Article

Analysis Matrix for Smart Cities

Electrical and Electronic Engineering Department, Public University of Navarra, Pamplona 31006, Spain
*
Author to whom correspondence should be addressed.
Future Internet 2014, 6(1), 61-75; https://doi.org/10.3390/fi6010061
Submission received: 13 November 2013 / Revised: 1 December 2013 / Accepted: 10 January 2014 / Published: 22 January 2014

Abstract

:
The current digital revolution has ignited the evolution of communications grids and the development of new schemes for productive systems. Traditional technologic scenarios have been challenged, and Smart Cities have become the basis for urban competitiveness. The citizen is the one who has the power to set new scenarios, and that is why a definition of the way people interact with their cities is needed, as is commented in the first part of the article. At the same time, a lack of clarity has been detected in the way of describing what Smart Cities are, and the second part will try to set the basis for that. For all before, the information and communication technologies that manage and transform 21st century cities must be reviewed, analyzing their impact on new social behaviors that shape the spaces and means of communication, as is posed in the experimental section, setting the basis for an analysis matrix to score the different elements that affect a Smart City environment. So, as the better way to evaluate what a Smart City is, there is a need for a tool to score the different technologies on the basis of their usefulness and consequences, considering the impact of each application. For all of that, the final section describes the main objective of this article in practical scenarios, considering how the technologies are used by citizens, who must be the main concern of all urban development.

Graphical Abstract

1. Introduction

The history of a city cannot be detached from that of its citizens. They are the ones who have determined the city’s location, spatial configuration, growth and development. All of this just has been possible, thanks to a set of technologies, developed and made available by and for the inhabitants themselves. At the same time, Technology is a set of theories and techniques that allow the practical application of knowledge and the completion of certain predefined tasks. Cities have been configured by actions and initiatives -human-driven tasks- and these have been carried out according to the level of development of the different tools and technologies. These tools and technologies have always evolved based on the specific needs of people and urban systems for their economic, commercial, industrial, cultural and personal development. However, the complexity of this technology is determined by two factors: first, available resources, and second, the strength of human initiative exerted in order to accomplish a purpose and take full advantage of the technology.
Now we are facing a new technological revolution, where, perhaps, we are losing the look for a specific purpose, where technology is becoming an end itself, being used before to know clearly why. An obvious exception to this is the case of communication, where people have gained unprecedented availability -to find someone or to be found-, as well as a permanent, hyper-connectivity capability. However, the obsession with being constantly connected and available creates such device dependence that, even being in a communicative action in physical space (the real one), people could prefer nonphysical communication (the virtual) with not present persons. The constant sharing of ideas on the walls, tweets, chats or blogs in social networks allows us to we know what all our friends, followers or admired celebrities are thinking. Urban policies and council’s initiatives are becoming more accessible through the use of smart phones and electronic devices. However, the great reflection today must reside in asking whether the digital communication channels through which all this information flow could become obstacles to the flow of other types currents, or barriers to the development of certain sectors of the population, such as poor neighborhoods, elder people or children. The vast majority of schemes designed so far by Smart City planners have focused more on goods, tools and devices rather than on individuals, who are the final recipients of these services. We should question how the policy of distributing communication services, energy or economic resources to the different sectors of the city and society will be implemented. Urban modeling allows the presentation of different invisible aspects of the city which influence citizens’ behavior and thus the shape of the city’s physical form. Professionals should be able to include different perspectives in their advocacy of urban planning in order to understand different approaches and to look for a common platform of communication [1].
This is how the need for a tool to evaluate the different technologies and their applications was detected, in order to facilitate the qualification process by city planners as well as by citizens themselves, trying to make easier both the users as the planners the approaching to different technologies an it applicability. Ultimately, how each technological scenario affects city development and citizens?
As mentioned above, today we are facing a brand new revolution of digital systems. This has led to the unprecedented evolution of communication systems, a wide variety of production schemes as well as new forms of leisure and culture. All this has begun to reconfigure the traditional technological scenario. Traditionally, humans developed tools to fulfill a particular need, but nowadays it is the tool that is generating new needs, uncovering new, previously unseen realities for which new solutions and tools must be found. It is a kind of virtuous technology cycle never seen before, in which people are faced with a new way to interact with their environment on a local, regional and global scale. They are becoming “global barbarians,” destroying an ancient empire in order to make way for something new.
The phenomenon of “global barbarism” and its relationship to new technology has been addressed by a number of authors. Baricco [2] discusses how global barbarians are establishing new relationship channels. Berdyaev [3] says that technology and the economy follow a hierarchy based solely on utility, with consequent indifference to the truth. Crisso et Odoteo [4] urgently demand for the arrival of the new barbarian to oppose this new global empire of technology, and Todorov [5] affirms that while we value the advantages of technology, we are increasingly aware of its side effects. He notes that, although techniques are common to all of us, each culture remains different. The global barbarian phenomenon, which we can see is the driving force behind recent social changes, is not just present in individuals and groups, but also in the decisions of their representatives who, in the act of planning a city (and its use of resources and technologies), are affecting the economic and social development of its inhabitants.
These global barbarians, increasingly involved in informal politics and citizenship, have found new communication channels. They no longer need forums or other physical spaces. Now, from home, their office, from the subway or even while on vacation, they are connected to the world. On one hand they participate in society and the economy but not necessarily in the city or with other citizens physically: they are political citizens, a part of society, but not necessarily part of the urban community. On the other hand it is clear that technology changes behavior, and behaviors change the way of acting in city spaces and places. From the statements made by Augé [6] in 1992 on ethnography, place is considered both spatial (physical) and relational (people meeting people). However, today we are confronted with a new archetype: the “non-place” that is defined just by the physical space, not so much by the relationships created there. Twenty years later, the digital revolution and, above all, that of multiple forms of communication in virtual environments (P2P-B2P-B2B) have generated a new form of place: one that occurs in the field of virtual reality. Even so, it is a very direct and real relationship, where the user is even more user, even more similar to other users and able to share their comments and opinions instantly. That is, as a whole, the sum of anonymous people, “global barbarians”, forming a network, a social framework whose power lies in the ability to create permanent new places, new relationships and new spaces (which are usually virtual).
Transferring this to the physical environment of urban areas, we know that there are many new exciting, constantly-evolving technologies being made available and affordable for people every day. However, the purpose and benefits of these technologies are not always clear, or whether they are the most efficient and appropriate technologies with which to meet the needs of the city. Urban spaces are changing and expanding their borders. They have been converted and reconfigured into new territory, partly real, partly virtual. As a result, they require a new tool to determine what the most appropriate technology is to fit each particular problem that arises.

2. Results and Discussion

2.1. Main Objectives

Our main goal here is to develop a tool that better serves the needs of modern cities and their inhabitants in the process of deciding how to implement new technologies.
When we discuss the issue of Smart Cities, we are not just talking about technology applied to the city and its spaces, but more importantly its impact on the city’s inhabitants. Therefore, priority must be given to the ends, not the means. For example, if we talk about mobility we are not just talking about car travel or public transport, but rather about people going from one place to another. This must be accomplished in an efficient way, in the shortest amount of time, as comfortable as possible, and with minimum social and environmental impact. In terms of energy, its efficient use and consumption may be the ultimate goal; however, the sources of this energy must also be the most efficient and economical searching for maximum efficiency and lower environmental impact during its production and transport. And if we talk about places and public spaces, the types of relationships that will be created must be considered.
In cities everything is produced by superposition, from reusing buildings and places or by large expansion processes. We must focus on the idea that technology is fundamental, but only if it is oriented towards the specific needs of human beings, That’s why we must recover the original spirit of technological development and its applications: the why and the wherefore.. However, we are not talking about the needs of an ordinary citizen, but rather a network of well-informed citizens with changing needs. They require new solutions and mechanisms in order to get more information and real-time solutions. Considering the potential of these new tools, it can be argued that while technologies (e.g., GPS or remote sensing) may be helpful in producing new spatial data, voluntary activities may be a suitable and “low-cost” method of bringing such data up-to-date while describing it in an informal, more accessible manner to citizens [7]. Some authors have said that networking is essential for the social organization of the city of the future, using Digital Urban Planning and new technologies in conjunction with the use of Internet as an extraordinary tool for disseminating information among citizens. On the other hand, they recognize that the implementation and monitoring phase of these technologies and unfiltered communication networks have always been the Achilles’ heel of urban planning [8].
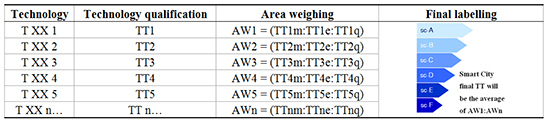
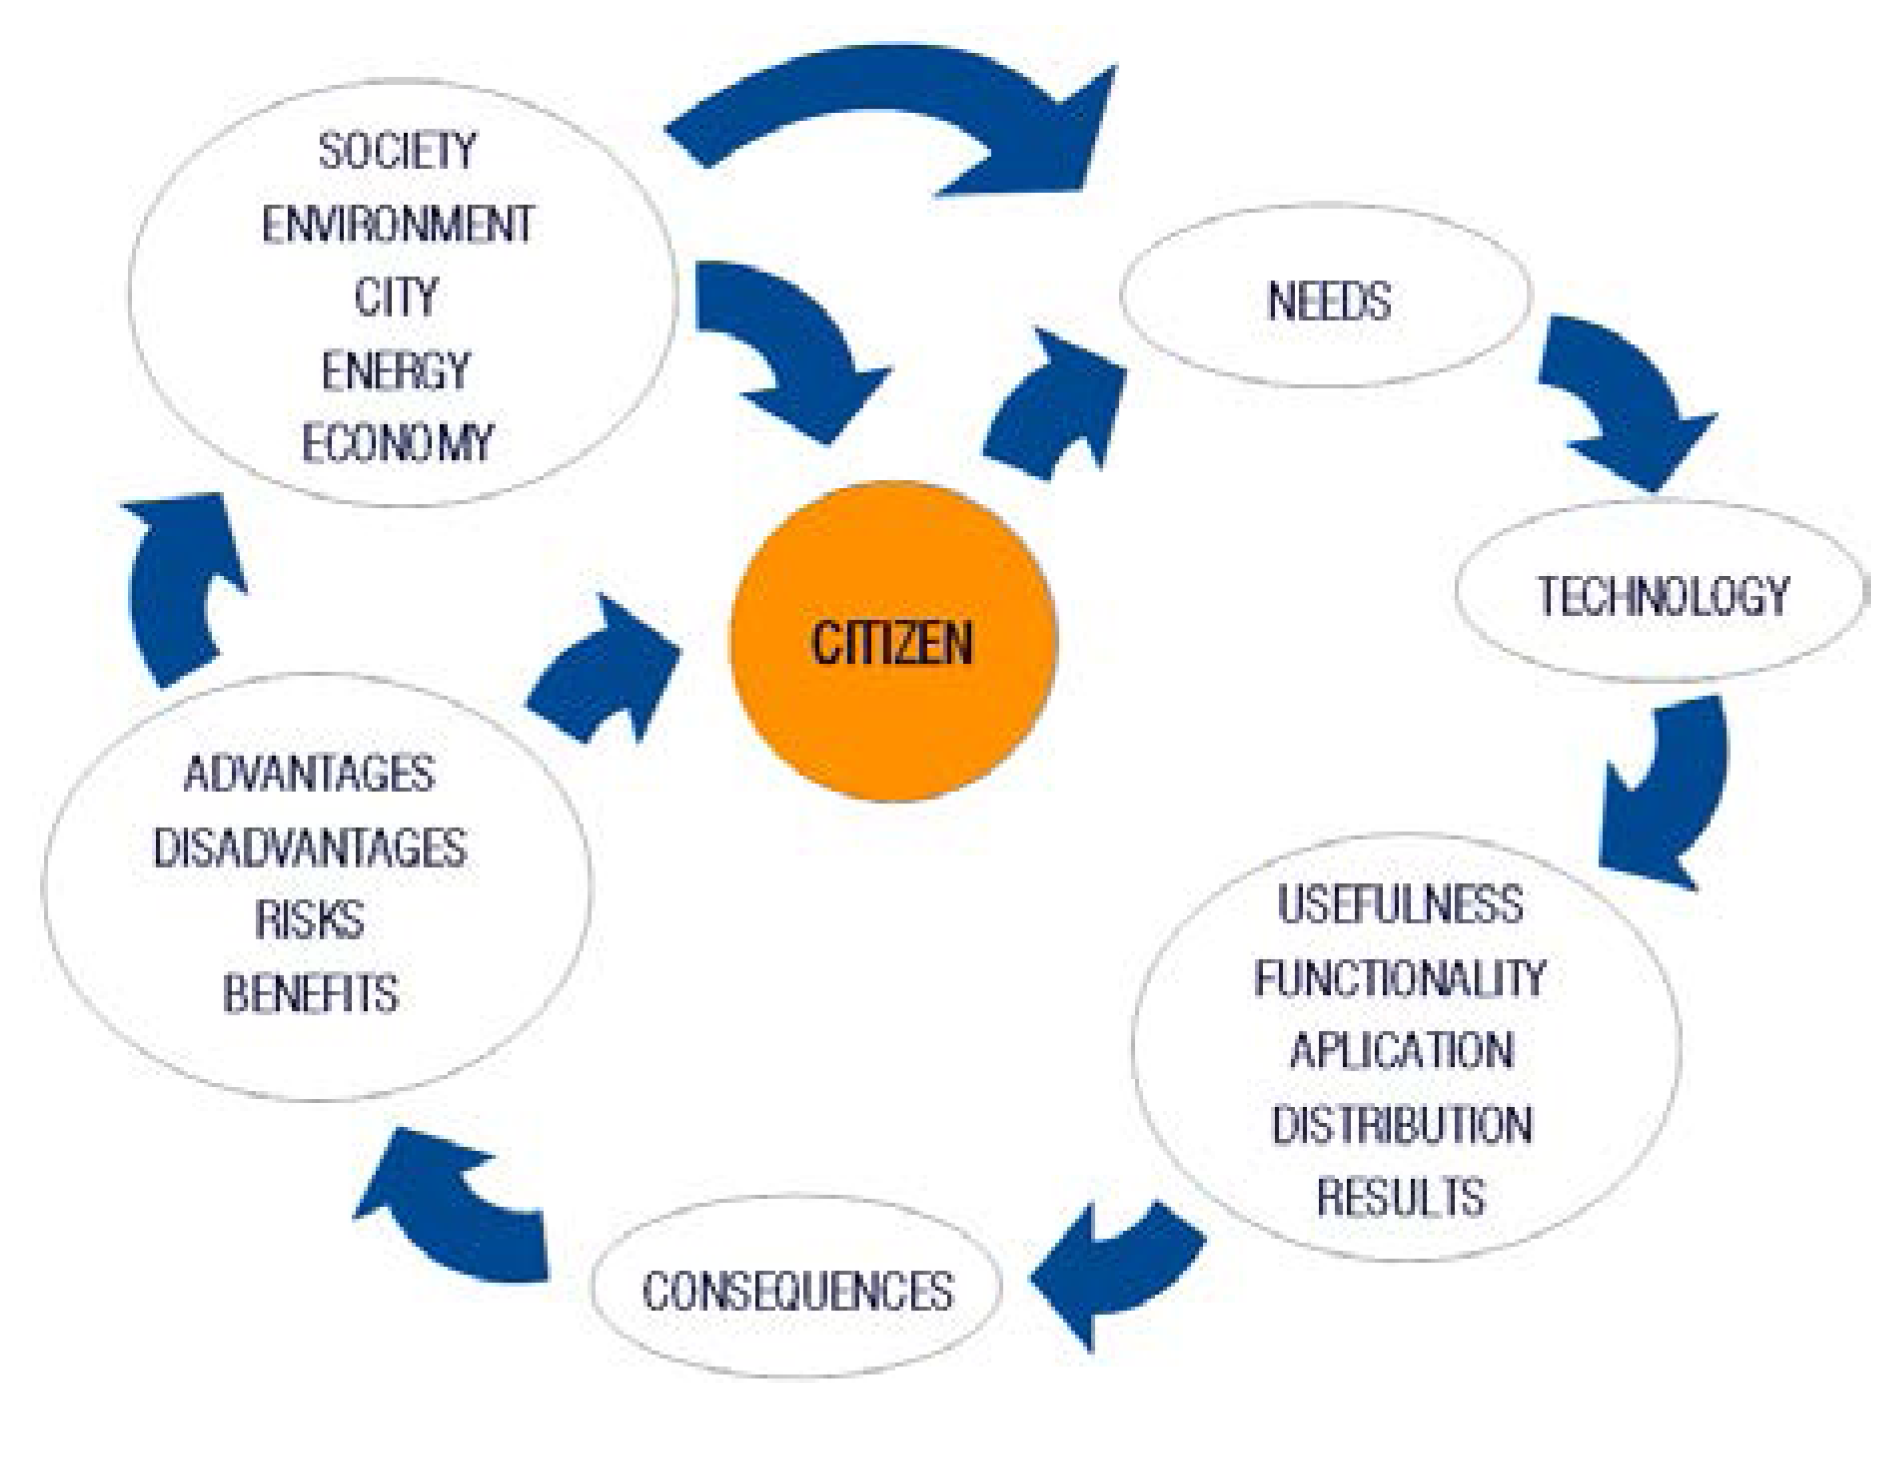
Therefore, we see the need for a tool in the form of a matrix f that can be used to analyze different technologies in terms of their usefulness, their potential uses, their expected results and, above all, their consequences. This matrix should consider the effects of different technologies, as well as the impact of their possible applications in cities. With the help of this matrix we could review the information and communication technologies that are managing and transforming the cities of the 21st century into Smart Cities: analyzing the impact on social behaviors, which ultimately tend to set or configure the spaces, areas, zoning, roads or channels of distribution (e.g., energy, information, economic flows, and social relations), from their production to their points of application, as well as comprehensive management in and between cities. The object of this article then is to summarize the different elements to be considered in new technological cities, in order to establish a matrix that can be used to analyze those different tools and their applications.

2.2. Scope of Application

The natural area of application of this matrix would fit into what we call today “Smart Cities”. Before moving forward, though, it is necessary to define what a Smart City is, especially since there are so many different definitions. A number of experts in this field have defined a Smart City as the following:
-
“a city that uses information and communications technologies to make its critical infrastructure, its components and public services more interactive, efficient and visible to citizens” [9];
-
“a digital platform on which a complex ecosystem of multiple agents (including administrations, companies and citizens) is developed, equipped with sensors and capable of offering, through the processing of all the information acquired by the sensor network, the best services possible at every moment” [10];
-
“a city in which Information and Communication Technologies play a role in one or more sectors” [11];
-
“investments in human and social capital and traditional (transport) and modern (ICT) communication infrastructure fuel sustainable economic growth and a high quality of life, with a wise management of natural resources, through participatory governance.” [12];
-
“a common framework and to highlight the growing importance of Information and Communication Technologies (ICTs), social and environmental capital in profiling the competitiveness of cities” [13].
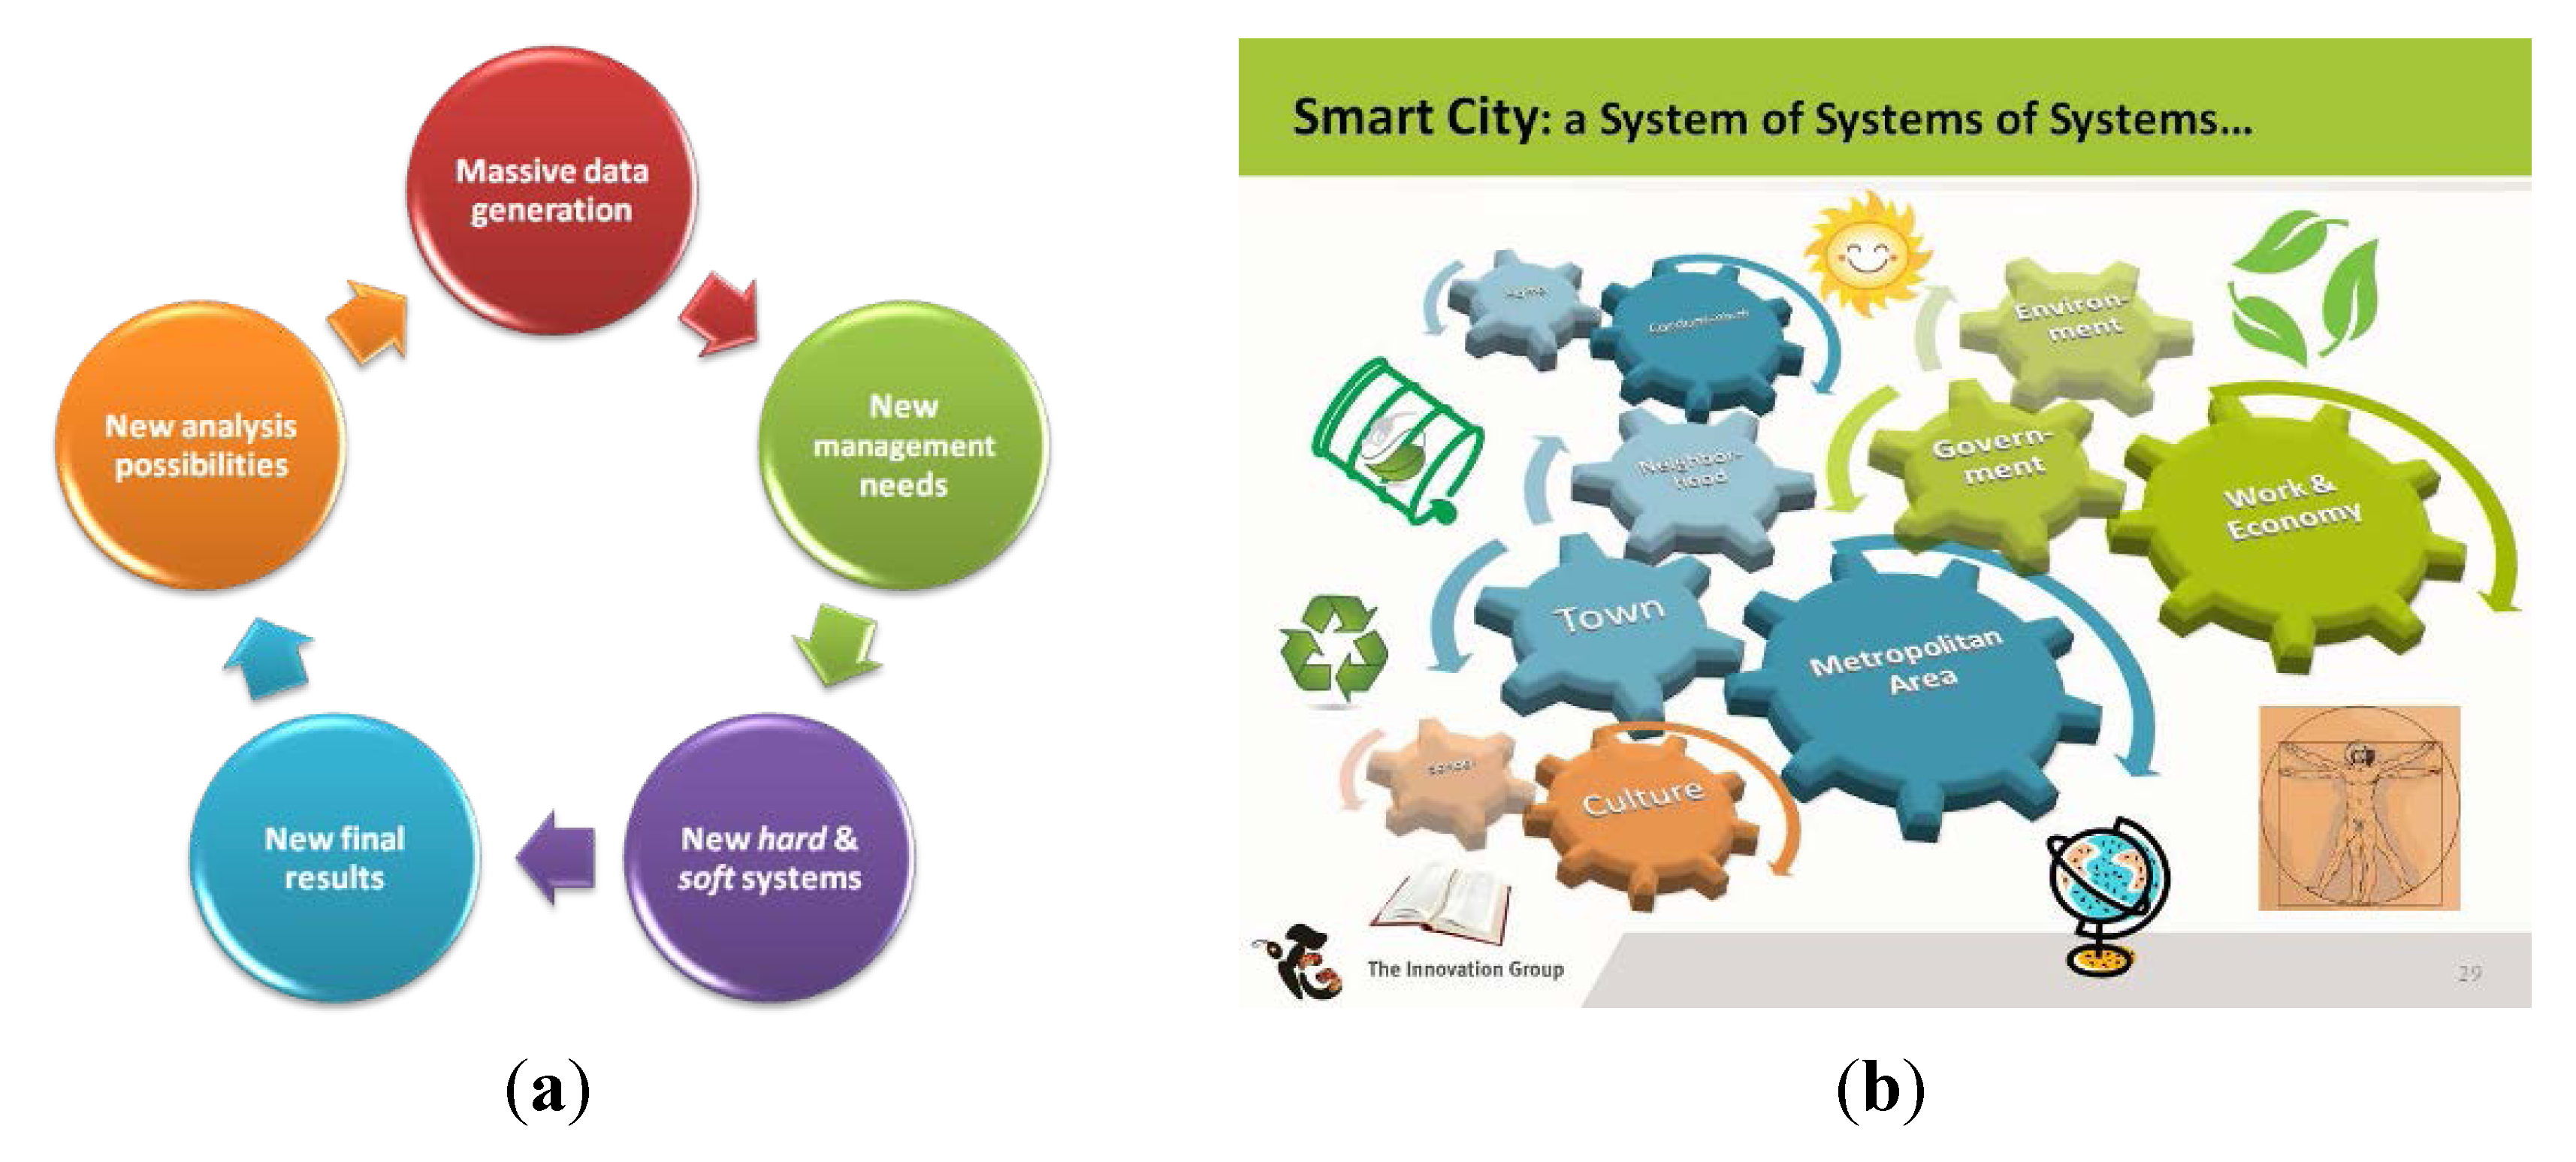
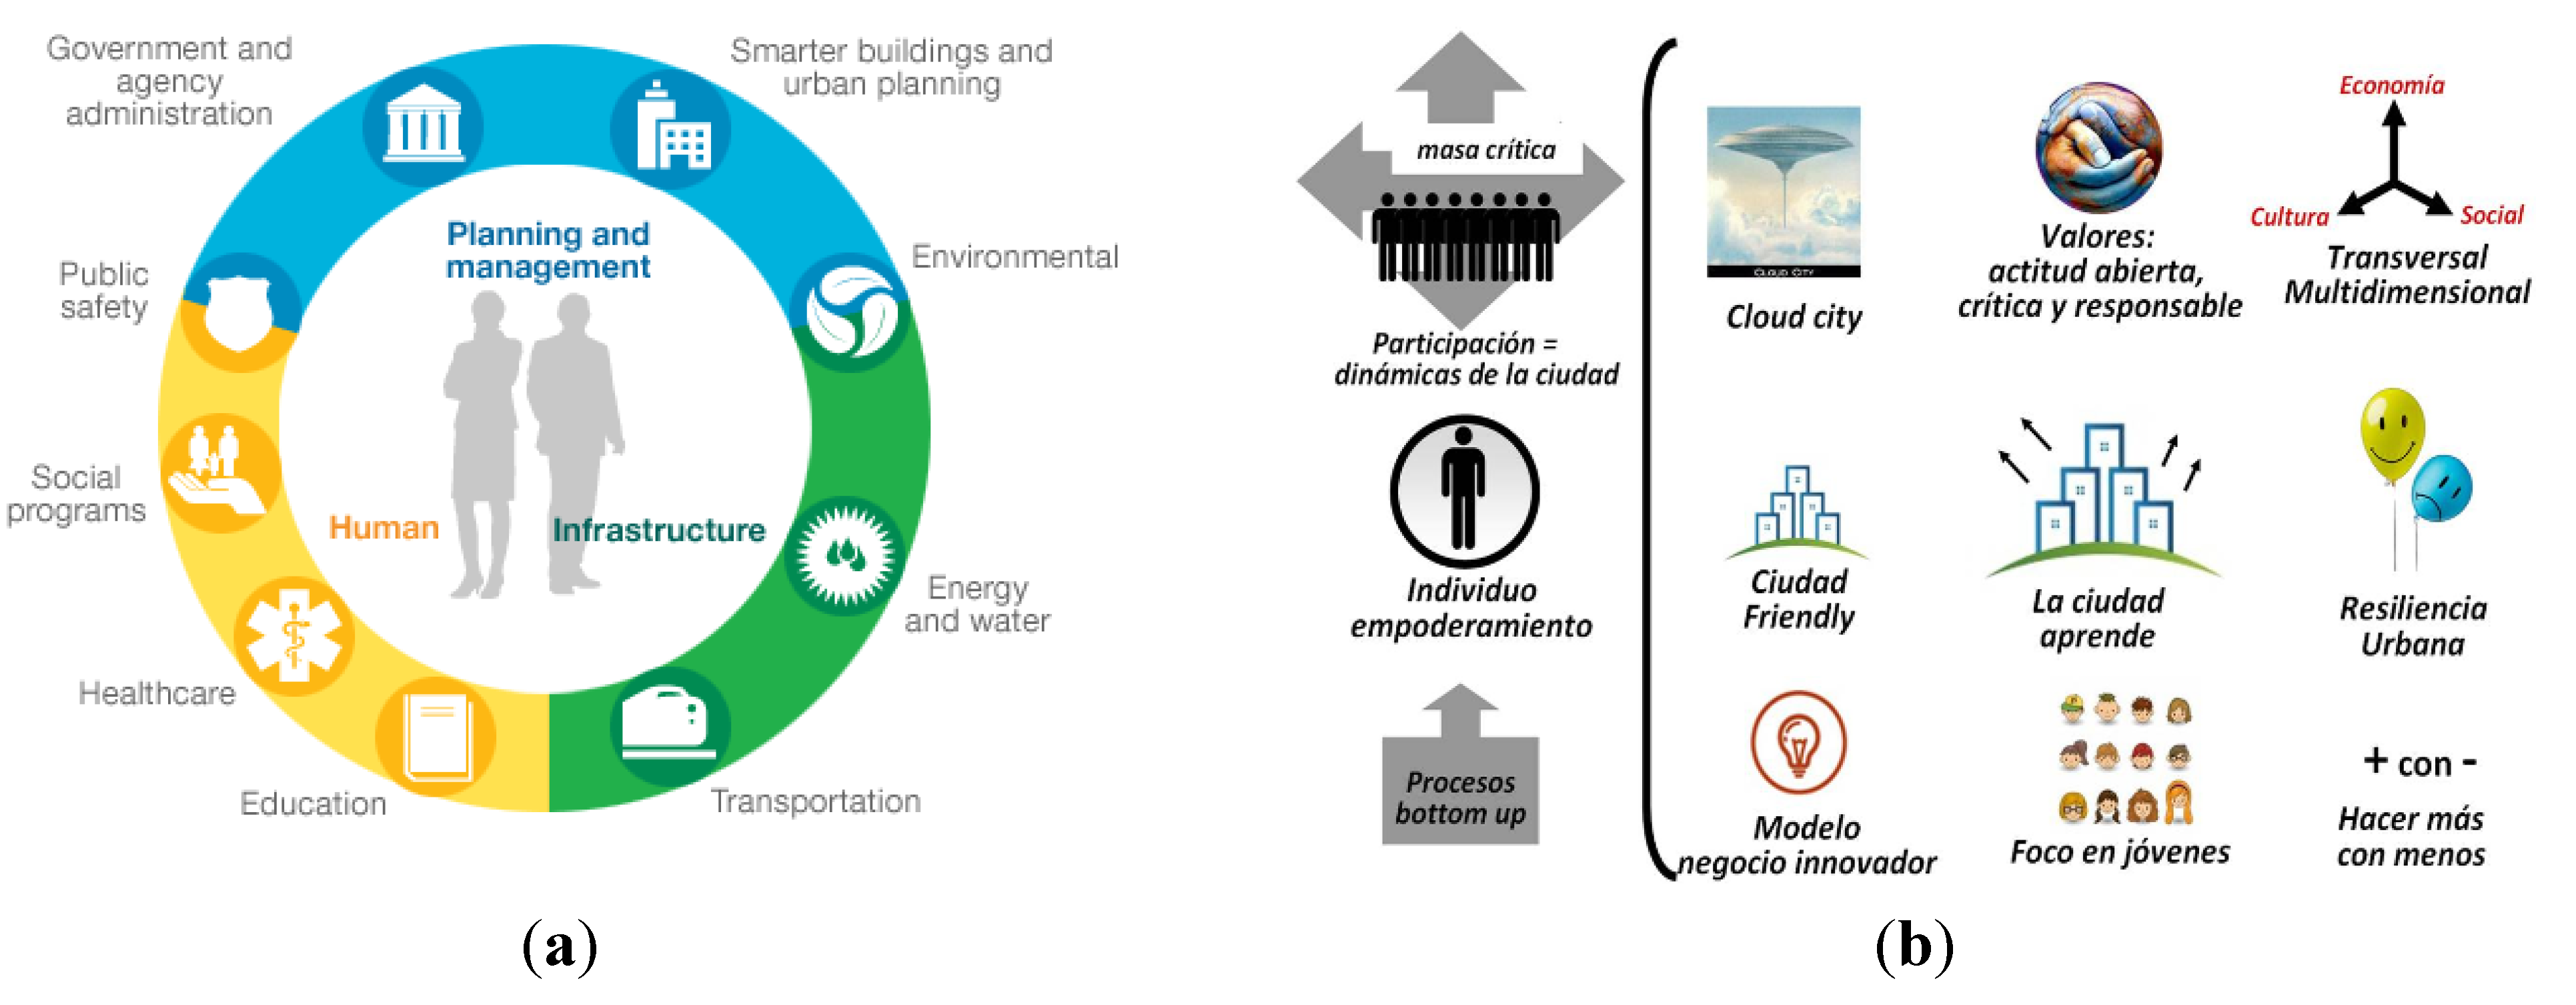
As can be seen in this small sample, the definitions are many and varied. This explains why, if we browse the vast majority of smart-city initiatives found online, we can find a great variety of charts and graphs (Figure 1) describing factors such as relationships, connectivity, sensing elements, interaction, and data centers. However, rarely does the role adopted by citizens or environmental impact appear on these graphs. Here are just a few examples:
Figure 1. A few schemes of Smart Cities found online, in which people do not appear. (a) “Smart Cities Big Data Cycle” [14]; and (b) “Smart Cities: a System of Systems of Systems” [15].
Futureinternet 06 00061 g001
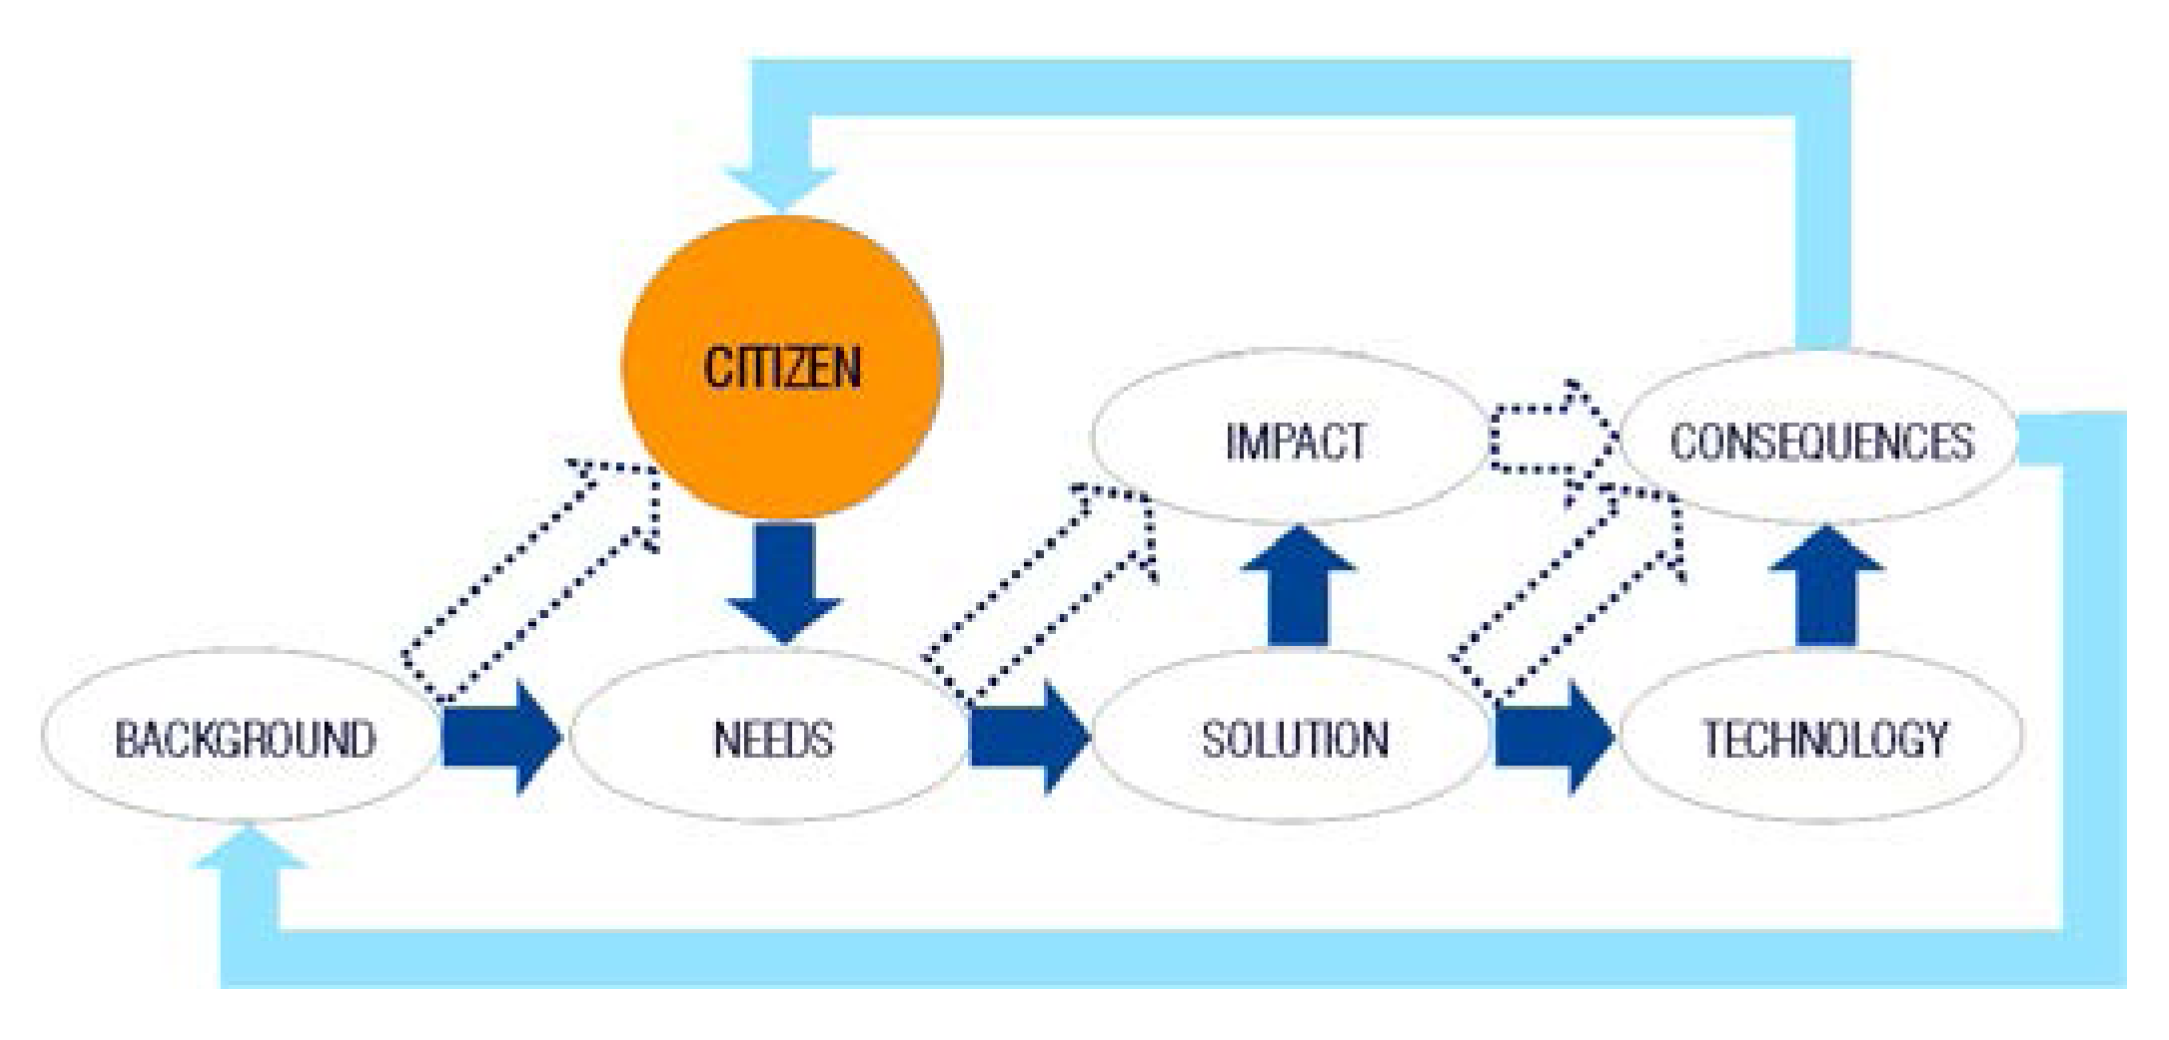
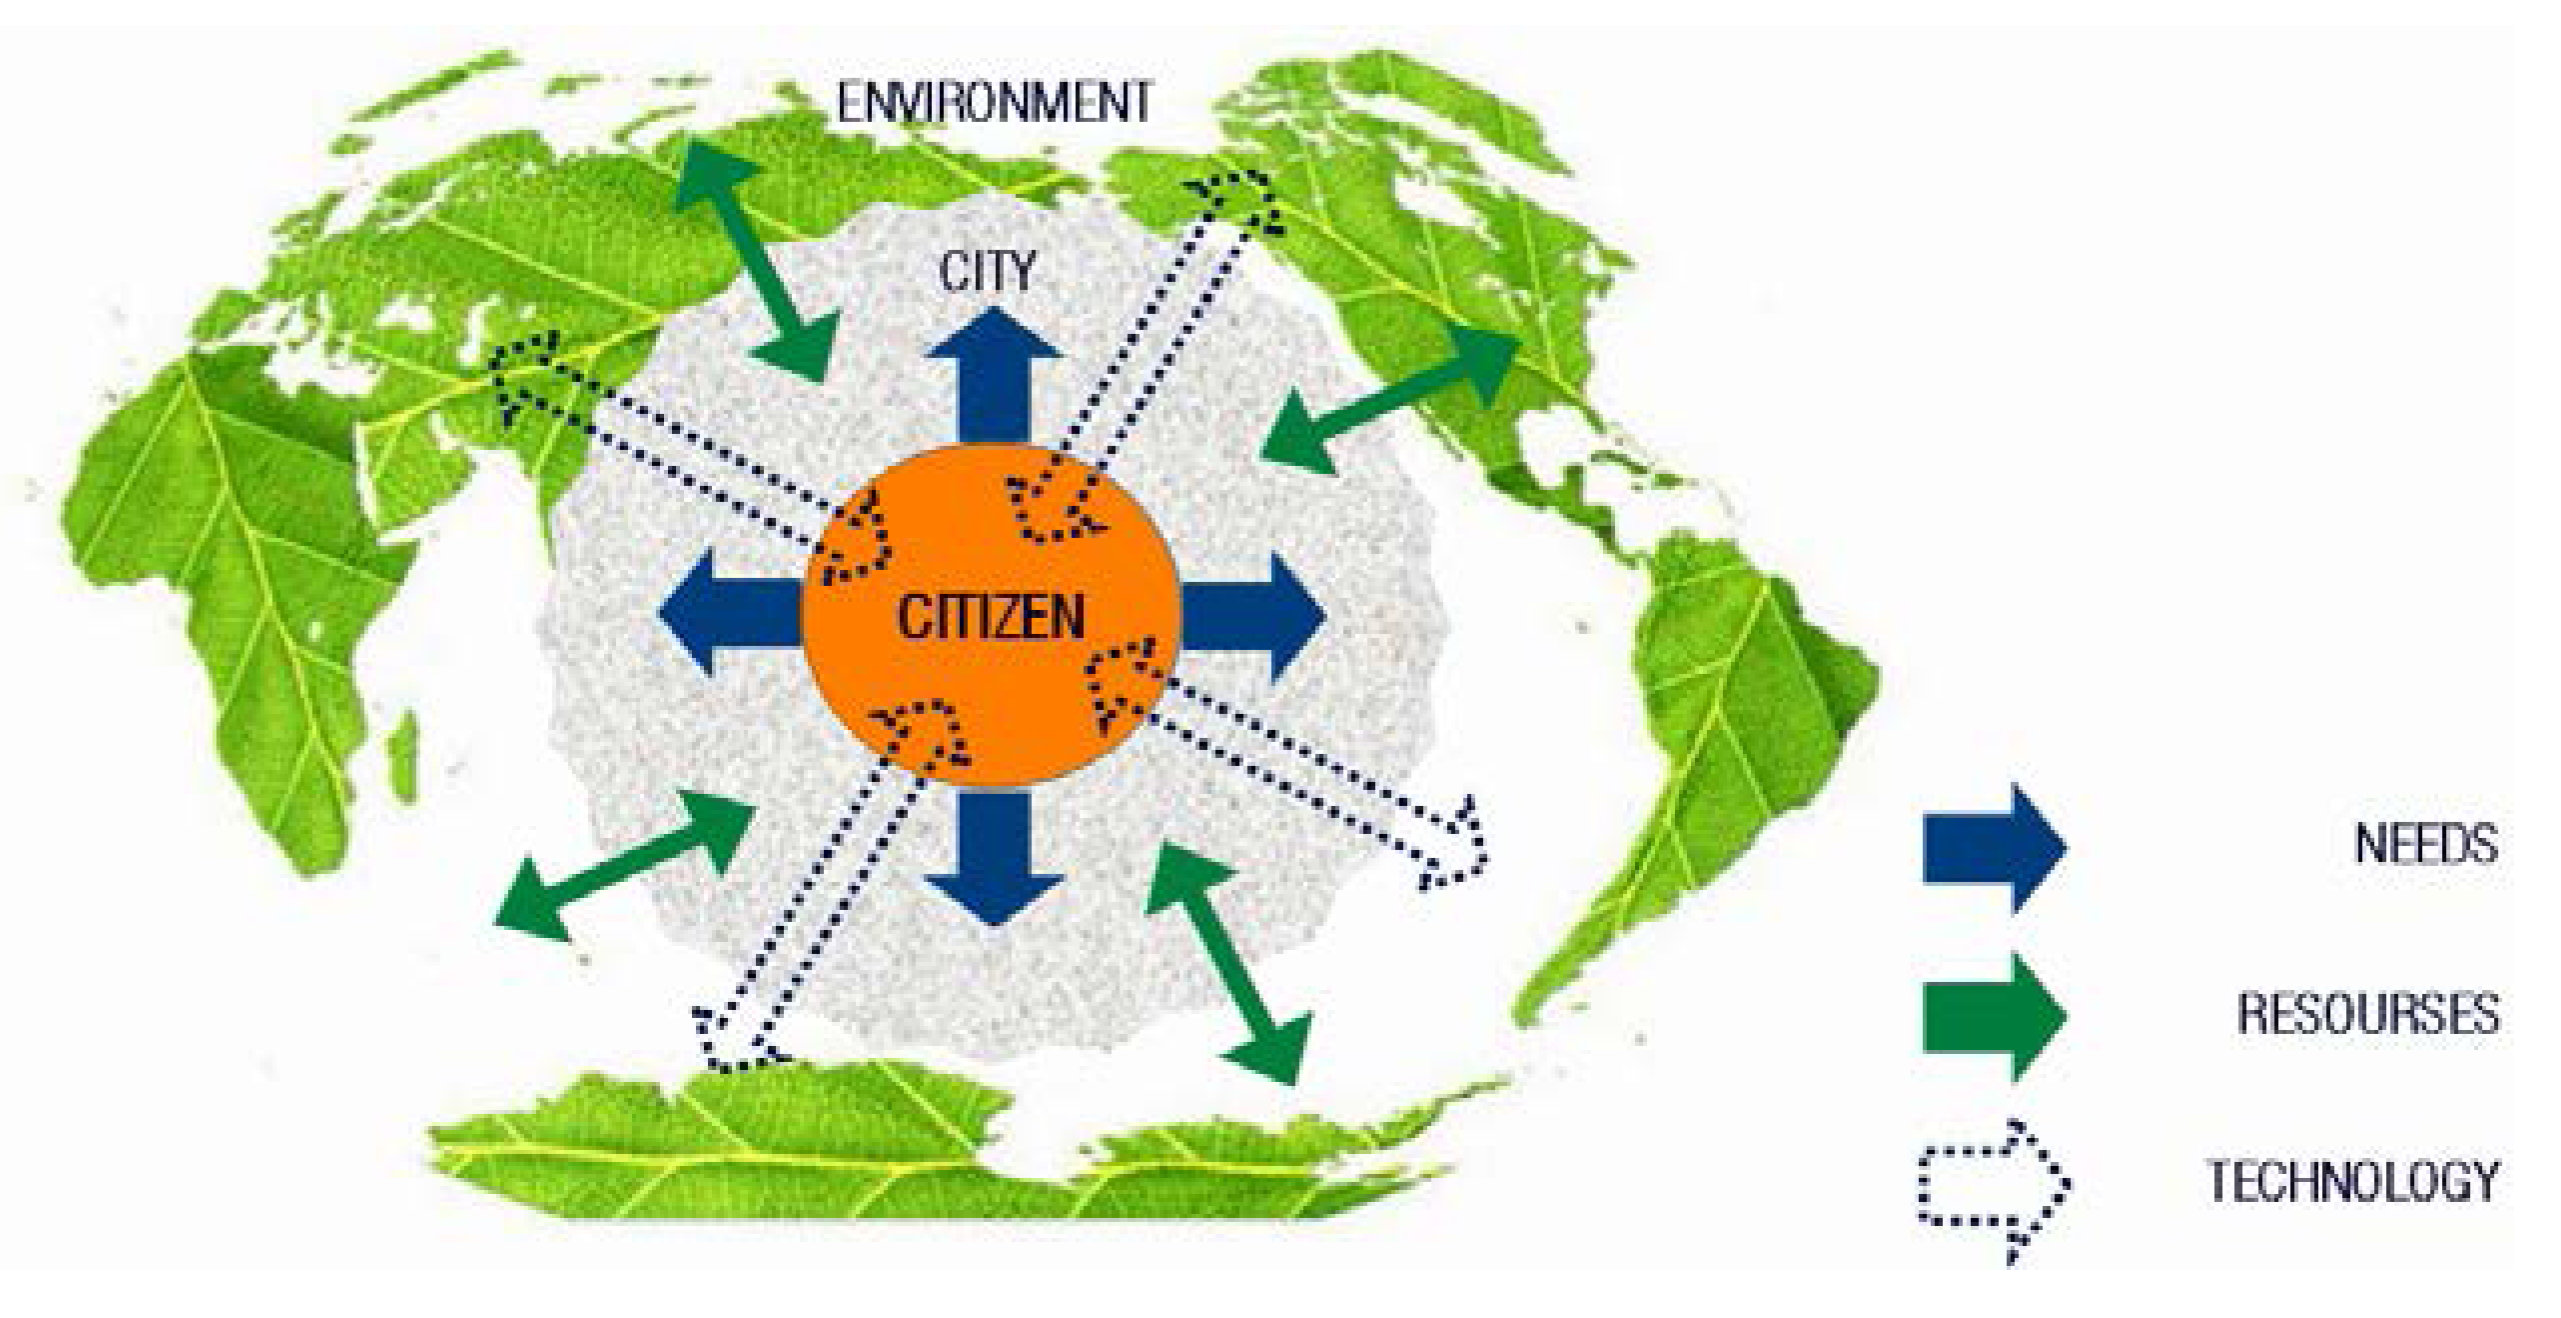
Increasingly, publications, companies and initiatives have begun to appear that incorporate people into their schemes of work (Figure 2). This is a hopeful development. We must see if just as mere users or if they really take into account their needs and how to meet them:
Figure 2. In recent years, finally the citizen is on these schemes. (a) “Infrastructures, operations, people” [16]; and (b) “Smart Cities need smart citizens” [17].
Futureinternet 06 00061 g002
As can be observed, there are several elements and different criteria in the definition of Smart Cities, as well in the graphic representation of a Smart City. Then, in searching for the definition of a Smart City we need to remember two things first:
  • What is a city?
    -
    From antiquity, a place for exchange, both social and economic;
    -
    At present, a system of systems that generates and promotes these relations and trading, but that occurs partly in real environments and partly in virtual spaces.
  • What is intelligence?
    -
    The ability to understand and comprehend, for which it is first necessary to perceive;
    -
    The ability to solve problems, based on memory and experience.
Therefore, we can advance a more comprehensive definition of a Smart City as:
“A space for coexistence among people who, based on the available technologies, can thrive and develop, while taking into account economic, social and environmental sustainability.”
These technologies, in order to act intelligently, should have the ability to perceive (via sensors and cameras), store, and process data (using servers and data centres), and solve problems (programming and information for decision-making). This should all be done in an energy-efficient way that serves the people. Also crucial for smart cities is combining the cloud and the sensors, so that the sensing data can be stored or processed. However, it is expected that people must have a certain level of skill in order to understand and use these systems [18].

3. Experimental Section: Matrix Development

3.1. Matrix Objectives

In the definition of the matrix, we must not forget that the main goal of all technology is none other than to respond a need—or set of needs—for a group of people. We could call that the technology’s impact. This impact can be measured according to:
-
Usefulness;
-
Functionality;
-
Applications;
-
Expected results;
-
And -most of all- consequences: advantages, disadvantages, risks or benefits.
Moreover, this matrix should consider all the effects of a technology's application and contemplate the impact on the different variables that constitute what we can call Background:
-
Social;
-
Urban;
-
Environmental;
-
Economic;
-
Growing energy requirements.
Then, the tools must be analyzed in terms of their utility, functionality, applicability, infrastructural needs and the expected outcomes. They will have their inevitable consequences (positive or negative), which may be characterized as advantages and disadvantages as well as risks and benefits. But this analysis should not only be made directly considering city residents, but also with regard to the different elements that allow their proper development: the environment, the economy, energy use, configuration and livability of cities and, ultimately, to society as a whole. As shown in the following scheme (Figure 3), technology is just one link in this chain that must have citizens at the ultimate centre. This citizen could be understood as user, as well as prescriber or decision-maker politician. They have a number of needs to be met, and in order to do so, they will consider what tools to use.
Figure 3. Circular flow diagram between the needs and consequences of technological application, based on social and individual demand.
Futureinternet 06 00061 g003
The difficulty is presented at the moment to define an analysis model that should include such a multiplicity of factors. That is why we must start by defining a model that works by stages, while having the ability to return to the same starting point. At that moment it would have to be capable of determining whether a proposed solution is able to meet the needs that were posed. This scheme of dependencies (where the start and the finish returns to the same point: people) could be summarized in a simplified structure (Figure 4), which should serve to develop the analysis and application matrix for each technology to help form a Smart-City:
Figure 4. Scheme showing dependencies between the different elements of analysis.
Futureinternet 06 00061 g004
It would be a system for making decisions in a chained form, which must be able to assess and quantify—in relational way, as an ensemble of permanently linked concepts and themes—all the elements that must to be solved, and the tools to achieve the expected results, but always bearing in mind why, what and where to apply technologies and what are their implications on environment and people. This analysis model should not only take into account the relationships that are triggered consecutively, but also those that occur in a spatial area, which we will call a 360° scheme (Figure 5). In this scheme, we can observe the three fundamental elements which technology should serve: the environment, the city, and the citizen.
Figure 5. 360° relational scheme.
Futureinternet 06 00061 g005
At the same time, there will be different relational scopes between them (the specific needs of the citizen, for example), which must be satisfied by the city itself. This must interact with the environment for taking (and, if possible, sharing) resources. However, technology should be able to function in a transversal way toward the three elements, operating in both directions: taking the information of citizens and cities needs to the environment, managing resources and returning solutions to meet those needs.

3.2. Matrix Development

In order to design the matrix properly, all the preceding requirements must be considered. These will be entered into a double-entry table called the Technologies Analysis Matrix (TAM) (Table 1), allowing the combination of each factor with all the others (1.a; 3.c; 7.e; …). In every line and column we can achieve sub-total qualifications making an average calculation of different elements (T1, T2; Ta, Tb; …). This will permit a quick look on analyzing the impact and effects of the analyzed technology over each of them. At the same time, the average data of the final results on every line and column will determine the final score of the technology, considering the inter-relationship of all factors (TT).
Table 1. Technologies Analysis Matrix (TAM) main concepts and qualification.
TechnologyXXType(Perceive/Store/Actuate)
a. Userb. Socialc. Urband. Environmentale. Economicf. Energy reqs.Total
1. Usefulness1.a1.b1.c1.d1.e1.fT1
2. Functionality2.a2.b2.c2.d2.e2.fT2
3. Applications3.a3.b3.c3.d3.e3.fT3
4. Expected results4.a4.b4.c4.d4.e4.fT4
5. Consequences5.a5.b5.c5.d5.e5.fT5
6. Advantages6.a6.b6.c6.d6.e6.fT6
7. Disadvantages7.a7.b7.c7.d7.e7.fT7
8. Risks/benefits8.a8.b8.c8.d8.e8.fT8
TotalTaTbTcTdTeTfTT
For this to be possible, a previous consideration over the impact of each element must be done, regarding the weight of each one on city planning, spatial configuration and social impact. In order to simplify the process and obtain a quick evaluation, each element must have an intuitive range of evaluation, similar to checklist of the different elements. An example of how this process would work for a specific technology (Technology X) can be seen (Table 2).
Table 2. Technology X scoring process.
1. UsefulnessPoor (1)Average (2)Good (3)Very Good (4)Excellent (5)
a. User O
b. Social O
c. Urban O
d. Environmental O
e. EconomicO
f. Energy Requirements O
In this case, the different scores are:
1.a = 31.b = 21.c = 41.d = 41.e = 11.f = 5
And the final score is the average of these scores: T1 = (3 + 2 + 4 + 4 + 1 + 5)/6 T1 = 3.17
At the same time, it is possible that in some cases a proposed solution will require not just one tool, but rather a combination of tools. In that case, the whole project for a Smart City will have a final score as the average score of the combined tools. Furthermore, a city would consider different factors to serve the needs of its citizens. The proposed solutions must fit three fundamental areas: mobility (m), energy (e) and quality of life (q), applying a correction coefficient for each.
Finally, in order to evaluate the final score of a City to be considered as Smart in a more graphic and visual way, this score must operate as a labeling system, similar to electronic equipment or building energy efficiency certification systems, called as SCM: Smart Cities Matrix (Table 3).
Table 3. Smart City final qualification Matrix (SCM).
TechnologyTechnology qualificationArea weighingFinal labelling
T XX 1TT1AW1 = (TT1m:TT1e:TT1q) Futureinternet 06 00061 i001
T XX 2TT2AW2 = (TT2m:TT2e:TT2q)
T XX 3TT3AW3 = (TT3m:TT3e:TT3q)
T XX 4TT4AW4 = (TT4m:TT4e:TT4q)
T XX 5TT5AW5 = (TT5m:TT5e:TT5q)
T XX n…TT n…AWn = (TTnm:TTne:TTnq)
The final labeling will represent at a glance an easy scoring of the Smart City strategy, and will be represented by a letter that will have a range between F (scoring from 0.00 to 0.50), E (from 0.51 to 1.00), D (from 1.01 to 1.75), C (from 1.76 to 2.5), B (from 2.51 to 3.50) and finally the best score: A (from 351 to 5).

4. Smart City Labeling: Case Studies on Matrix Testing

4.1. TAM (Technologies Analysis Matrix) Testing

This project is part of a doctoral thesis in progress. We are now beginning to define the design of the matrix and the algorithms in more detail in order to obtain the best qualification process, with the requirements previously defined and explained in the preceding paragraphs. It may seem inappropriate to present in this article a model that still needs to be defined more clearly. However, we can show one of the analyzed technologies and why it is understood as the first step towards a good model for evaluating Smart Cities, applying different technologies and testing their usefulness and performance in real environments.
One example of a good model for testing the Technologies Analysis Matrix (TAM) technology called “LUIX intelligent lighting”. The background for its development was in asking the following question: Why should we illuminate public spaces at unnecessary times? Several studies have shown that more than 70% of the energy used for lighting is used to illuminate spaces without the presence of vehicles or people at night. LUIX has developed a technology based on presence detection and automatic regulation of public lighting, leading to major savings in energy and maintenance costs (Figure 6). This is achieved by increasing light intensity only when the presence of vehicles or people is detected. This technology also transforms the electric grid into a data network, a concept fully aligned with the strategy of Smart Cities [19].
Figure 6. iiLUIX: how the system works [20].
Futureinternet 06 00061 g006
Applying the matrix to this technology, its score would be as follows (Table 4):
Table 4. TAM applied to ii LUIX.
TechnologyiiLUIXTypePerceive and Actuate
a. Userb. Socialc. Urband. Environmentale. Economicf. Energy reqs.Total
1. Usefulness5345554.50
2. Functionality4345444.00
3. Applications5454454.50
4. Expected results5454534.33
5. Consequences5455544.67
6. Advantages5354444.17
7. Disadvantages5454444.33
8. Risks/benefits4354433.83
Total4.753.54.754.384.384.004.29
Finally, why is understood that this analyzed technology is a good example for Smart Cities:
-
Use of new technologies by turning the grid into a data network;
-
No negative impact on people or the environment;
-
No impact on the city’s appearance, because it leverages existing infrastructure;
-
Environmental sustainability: lower energy consumption and lower CO2 emissions;
-
Economic sustainability: less spending on public electricity bills;
-
Social sustainability: less light pollution for the neighbours.
The score obtained by this technology on the matrix (4.29) reveals that could work properly in a Smart City.

4.2. SCM (Smart Cities Qualification Matrix) Testing

As part of this aforementioned research process, the matrixes are being tested on real case studies. More specifically, a number of cities are being tested, both in the technologies they are using, and the concepts they manage in order to be considered Smart Cities. These cities are grouped in a unique platform called RECI (Spanish Smart Cities Network). Forty-one cities belong to this network all around Spain: A Coruña, Alcobendas, Alcorcón, Alicante, Aranjuez, Ávila, Badajoz, Barcelona, Burgos, Cáceres, Castellón, Córdoba, Guadalajara, Elche, Gijón, Logroño, Lugo, Huesca, Madrid, Málaga, Marbella, Móstoles, Murcia, Oviedo, Palencia, Palma de Mallorca, Pamplona, Ponferrada, Rivas-Vaciamadrid, Salamanca, Santander, Segovia, Sevilla, Tarragona, Torrejón de Ardoz, Torrent, Valencia, Valladolid, Vitoria-Gasteiz, Sabadell y Zaragoza. This Network aims at the generation of a dynamic process between cities in order to have a “Spanish network of Smart Cities”, which will promote automatic and efficient management of infrastructure and urban services, reduce public spending improve the quality of services, attract economic activity, and facilitate overall progress [21]. The current research project focuses specifically on Pamplona and its Smart City strategy [22], which we will attempt to test with the developed matrix called SCM. Regarding the strategy of the city of Pamplona, the city council has posed the following objectives for these different areas. Some of them are now being implemented:
  • Administrative procedures:
    -
    (T01) Apps for citizen Smartphones;
    -
    (T02) E-Government: transparency and easy management;
    -
    (T03) Interoperability and transversality: by web and for citizens.
  • Infrastructures:
    -
    (T04) Free Wi-Fi in the city: 26 hot spots;
    -
    (T05) Integrated fare system for citizens: Citizen card;
    -
    (T06) Internet of Things: centralized digital management.
  • Environment
    -
    (T07) CO2 Sensors system;
    -
    (T08) Efficient and ecologic Public transport;
    -
    (T09) Car sharing;
    -
    (T10) Biodiversity (QR codification in urban landscape).
  • Public Safety and Traffic:
    -
    (T11) Car plate detecting systems for traffic control;
    -
    (T12) Signalling and sensorizing Parking lots;
    -
    (T13) Pedestrian lighting to improve security and safety.
  • Maintenance:
    -
    (T14) Building energy management;
    -
    (T15) Provide PDA systems to inspector for alert management;
    -
    (T16) Intelligent urban lighting systems.
As could be seen in the next Matrix (Table 5), after evaluating each technology (Table 6) and obtaining their score, area weighing can be made, depending on the different aspects they could try to solve: mobility (m), energy (e) and quality of life (q). A few examples are shown:
Table 5. SCM for Pamplona City strategy.
TechnologyTechnology qualificationArea weighingFinal labelling
T012.85AW12 = 1.33 Futureinternet 06 00061 i002
T023.03AW12 = 1.01
T032.24AW12 = 0.90
T043.45AW04 = 0.92
T053.82AW12 = 1.53
T064.02AW12 = 2.28
T073.32AW12 = 1.99
T084.14AW12 = 3.59
T093.15AW12 = 2.21
T103.92AW12 = 1.05
T114.00AW12 = 1.60
T123.68AW12 = 1.84
T132.90AW12 = 1.93
T144.20AW12 = 2.52
T153.54AW12 = 1.30
T164.29AW12 = 3.29
Table 6. Evaluation process.
TechnologyDifferent aspects scoringFinal average score
T04: Free Wi-FiTT04m: 0
TT04e: 0
TT04q: 0.8TT04:3.45 AW04 (3.45 × 0.267) = 0.92
T12: Parking LotsTT12m: 0.8
TT12e: 0.2
TT12q: 0.5TT12:3.68 AW04 (3.68 × 0.500) = 1.84
With this work system, each technology is evaluated and weighted, in order to obtain a final labeling for the Pamplona Smart City strategy.
As can be seen, the final score for Smart City labelling will be the average of the technologies and their impact on the different aspects that affects the urban life of citizens, and could become a useful instrument for city planners and public agents in order to achieve the most efficient technologies regarding user needs. At the same time, it could be a good instrument to perceive which elements could be unnecessary in Smart City policies, detecting those really important for building city intelligence, amongst others that do not contribute to the strategy and could be just services that the city council and authorities must provide to their citizens (i.e., the analyzed T15).

5. Conclusions

It can be said that the development and use of this matrix, could be a fast and efficient way for the implementation of new technologies in Smart Cities, as well as their interrelationship with other technologies (new or existing) in urban environments, whether new, consolidated or those that need to be regenerated. Its focus should be as close to the citizen as possible, so it should be a tool for application at a local level (municipal or regional), but always considering global factors such as the sources of production and distribution of data, information and energy in a territorial scale. With this tool, public policy makers will be able to evaluate the implementation of new technologies. Investors, planners and urban designers, may observe the advantages and disadvantages of each initiative, the virtues of the available technologies, and their best mode of application. But they will do it while considering above all the final impact on the environment, the cities and the citizens, who must be the beginning and end of any action in towns and countries. That person we called global barbarian, who has an enormous power of change. This ability will be beneficial as long as they have tools to evaluate their actions and make their own decisions. As Mitchell said, Sensoring and Remote monitoring will change service systems, and extend them wherever the network reaches, but the power of place will still prevail. Sometimes we will use networks to avoid going places; however, sometimes we will still go places to network [23]. Individuals will still be citizens, using and socializing new technologies in urban environments.

Acknowledgments

This work was supported by the Spanish Ministry of Economy and Competitiveness TEC2010-17805 Research Project.

Conflicts of Interest

The authors declare no conflict of interest.

References

  1. Hanzl, M.; Dzik, K.; Kowalczyk, P.; Kwieciński, K.; Stankiewicz, E.; Wierzbicka, A.Ł. Human geomatics in urban design-two case studies. Future Internet 2012, 4, 347–361. [Google Scholar] [CrossRef]
  2. Baricco, A. The Barbarians: An Essay on the Mutation of Culture; Rizzoli Ex Libris: Milan, Italy, 2008. [Google Scholar]
  3. Berdiaeff, N. The Realm of the Spirit and the Realm of Caesar; Harper & Brothers: New York, NY, USA, Spain, 1952; pp. 91–92. [Google Scholar]
  4. Chrissus and Odotheus. In Barbarians: The Disordered Insurgence; Venomous Butterfly Publications: Los Angeles, CA, USA, 2003; pp. 82–83.
  5. Todorov, T. The Fear of Barbarians; University Of Chicago Press: Chicago, IL, USA, 2010; pp. 56–59. [Google Scholar]
  6. Augé, M. Non Places; Verso: London, UK, 1992; p. 65. [Google Scholar]
  7. Rotondo, F. The U-city paradigm: Opportunities and risks for E-democracy in collaborative planning. Future Internet 2012, 4, 563–574. [Google Scholar] [CrossRef]
  8. Fusero, P. E-CITY, Digital Networks and Cities of the Future; LIST Laboratorio: Roma, Italy, 2008; pp. 10–12. [Google Scholar]
  9. Sáinz Peña, R.M. Smart Cities: A First Step Towards the Internet of Things; Fundación Telefónica: Ariel, Barcelona, Spain, 2011; p. 13. [Google Scholar]
  10. Giffinger, R.; Fertner, C.; Kramar, H.; Kalasek, R. Smart Cities: Ranking of European Medium-Sized Cities; Centre of Regional Science (SRF), University of Technology: Vienna, Austria, 2007; p. 10. [Google Scholar]
  11. Pérez Sánchez, M.; Morcillo Bellido, J.; Borrero, A. TIC Forum for Sustainability. In Smart CITIES 2012; AMETIC: Madrid, Spain, 2012; p. 30. [Google Scholar]
  12. Caragliu, A.; del Bo, C.; Nijkamp, P. Smart Cities in Europe. Serie Research Memoranda 0048; VU University Amsterdam: Amsterdam, The Netherlands, 2009; p. 6. Available online: ftp://zappa.ubvu.vu.nl/20090048.pdf (accessed on 10 October 2013).
  13. Smart-City Wikipedia. Available online: http://en.wikipedia.org/wiki/Smart_city (accessed on 16 October 2013).
  14. Digital Option, Fernando Rayon’s Personal Blog about Digital Economy, Smart Cities and Water Management. Available online: http://digitaloptionblog.wordpress.com (accessed on 6 June 2013).
  15. ICT4Green by Donato Toppeta. Available online: http://ict4green.files.wordpress.com (accessed on 4 June 2013).
  16. IBM Smarter Planet. Available online: http://www.ibm.com/smarterplanet (accessed on 7 June 2013).
  17. Albert García Pujadas/qtorb. Available online: http://www.qtorb.com (accessed on 7 June 2013).
  18. Hancke, G.P.; de Carvalho e Silva, B.; Hancke, G.P., Jr. The Role of Advanced Sensing in Smart Cities. Sensors 2013, 13, 393–425. [Google Scholar]
  19. De Bustos Almendros, A.; Ezcurra Loyola, F. Experience Implementing a Street Lighting Management System in Terms of Presence of Persons and Vehicles; Greencities and Sustainability Congress: Málaga, Spain, 2012; pp. 385–397. [Google Scholar]
  20. LUIX System Description. Available online: http://www.iluminacionluix.com/ (accessed on 10 October 2013).
  21. RECI: Red Española de Ciudades Inteligentes. (in Spanish). Available online: http://www.redciudadesinteligentes.es/sobre-la-red/quienes-somos/ampliar.php/Id_contenido/301/v/0/ (accessed on 4 November 2013).
  22. Pamplona City Council. Definition of Pamplona’s Smart City strategy. Available online: http://www.pamplona.es/verDocumento/verdocumento.aspx?idDoc=264537 (accessed on 4 November 2013).
  23. Mitchell, W.J. E-Topia; MIT Press: Cambridge, MA, USA, 2000; pp. 118–155. [Google Scholar]

