Article

Semantic Observation Integration

1
European Commission—Joint Research Centre, Institute for Environment and Sustainability, Via E. Fermi 2749, 21027 Ispra (VA), Italy
2
Institute for Geoinformatics, University of Muenster, Weseler Straße 253, 48151 Münster, Germany
*
Author to whom correspondence should be addressed.
Future Internet 2012, 4(3), 807-829; https://doi.org/10.3390/fi4030807
Submission received: 18 June 2012 / Revised: 6 August 2012 / Accepted: 21 August 2012 / Published: 3 September 2012
(This article belongs to the Special Issue Semantic Interoperability and Knowledge Building)

Abstract

:
Although the integration of sensor-based information into analysis and decision making has been a research topic for many years, semantic interoperability has not yet been reached. The advent of user-generated content for the geospatial domain, Volunteered Geographic Information (VGI), makes it even more difficult to establish semantic integration. This paper proposes a novel approach to integrating conventional sensor information and VGI, which is exploited in the context of detecting forest fires. In contrast to common logic-based semantic descriptions, we present a formal system using algebraic specifications to unambiguously describe the processing steps from natural phenomena to value-added information. A generic ontology of observations is extended and profiled for forest fire detection in order to illustrate how the sensing process, and transformations between heterogeneous sensing systems, can be represented as mathematical functions and grouped into abstract data types. We discuss the required ontological commitments and a possible generalization.

1. Introduction

The integration of sensor-based information into analysis and decision making has been a research topic for many years [1,2,3]. Standards such as the Sensor Web Enablement (SWE) suite of specifications, which is currently under major revision [4], help to establish syntactical and structural interoperability. This includes possibilities for integrating information produced by physical sensors and by environmental simulations [5]. Several approaches addressing semantic interoperability have been proposed. Most notably, the W3C recently released a sophisticated ontology of observations and measurements [6], and a lightweight approach for the semantic enablement of the Sensor Web has been suggested [3]. Before that, the ontology of observation had been hindered by, among other factors, the naive idea of a measurement instrument being an objective reporter of the mind-independent state of the world. This commonly held view neglects the fact that instruments are built and calibrated by human beings. Neither the choice of the observed entity, nor the quality assigned to it, nor its link to a stimulus providing the information, nor the value assignment to the result, are mind-independent processes. All of them involve human conceptualizations, though these are more amenable to grounding and agreement than anything else in the generation of information. Thus, an understanding of observations amenable to semantic modeling has been achieved and standardized, but mature applications that illustrate the use of such work for geospatial information integration are still missing.
In parallel, we have witnessed a surge of geographic information provided by the public to the public via the Internet. Resembling virtual sensors, citizens provide this so-called Volunteered Geographic Information (VGI) [7] through Web 2.0 services by posting images or videos (Flickr, Panoramio, YouTube, Facebook), blogging or micro-blogging (Twitter, Facebook), surveying and updating geographic information (OpenStreetMap), posting reviews and opinions (TripAdvisor, Foodspotting, GoogleLocal) or playing games (greenGoose). Considering the increase in mobile Internet access through smartphones and the number of (geo-)social media platforms, one can expect the amount of VGI to grow continually in the near future. This new abundance of VGI has several advantages over the traditional authoritative gathering, maintaining and disseminating of geographic information. First, it is more up-to-date, because a larger number of “surveyors” reports new information or changes to existing information in near real-time. Second, VGI can be very rich in content, providing pre-processed information instead of raw data. As information portals such as EyeOnEarth [8] or GEO-Wiki [9] illustrate, the provided information often complements the data coming from traditional sensor networks.
However, there are several challenges associated with VGI. The technology-driven development leads to frequent changes in data retrieval and data structures, since new platforms emerge, old ones disappear, and prevailing ones modify their user and programming interfaces. Further, most VGI is poorly structured and has little meta-data, so that quality control proves difficult. Even comparatively well-structured and quality-controlled platforms such as OpenStreetMap have to deal with these issues.
Thus, the integration of VGI with existing sensor networks and spatial data infrastructures is a challenging task [10]. The increased diversity of information channels and provided messages makes it even more difficult to establish systems for information combination. However, if one succeeds in joining data from various channels, integrated analyses, such as the identification of co-occurring observation results, would improve the richness and quality of the derived information. For example, flooding events that remained unnoticed by classical earth observing systems, could already be detected based on user contributed content on the web [11]. Recently, a conceptual solution of using SWE for integrating VGI with the Sensor Web has been suggested for creating a (more general) Observation Web [12], but again semantic aspects have not been considered explicitly.
In this paper, we propose a novel approach to integrate conventional sensor information and VGI in a forest fire case. We describe a traditional forest fire information system based on satellite data and an unconventional use of VGI as “citizen” observation system. We show the co-occurrence of forest fire events as the result of the integrated approach. Contrary to common logic-based approaches, we base our developments on another formalization paradigm from software engineering: algebraic specifications [13]. The advantages of this approach are at least threefold. First of all, the fact that sensing is a function from the world to data is directly reflected in the formalization. Second, any form of information integration is computation, which is also a function. The power of functions provides an inherent solution to describe unambiguously the processing steps from natural phenomena to value-added information. Third, algebraic specifications—and thereby the ontologies—can be directly tested using functional programming languages, such as Haskell [14]. The work presented in this article is based on a previous publication [10], which we substantially extend with detailed descriptions of the use case, the ontological commitments, and ways of generalizing the proposed solution. Compared to the initial conference paper, we present a completely reworked code and the final alignment with DOLCE Ultra Lite and the SSN Ontology.
The remainder of this paper is organized as follows. We provide the overall background and briefly illustrate the proposed solution to sensor integration in the next section. Then we argue for the use of algebraic specifications for ontology engineering and present related work in Section 3. The formalization of our approach to sensor integration is provided in Section 4. This first application of this approach is based on several assumptions and simplifications, which are discussed in Section 5. We conclude the paper with a discussion, a summary of our main findings and an outline of future work. Throughout the paper, the VGI use cases of forest fire detection as examples.

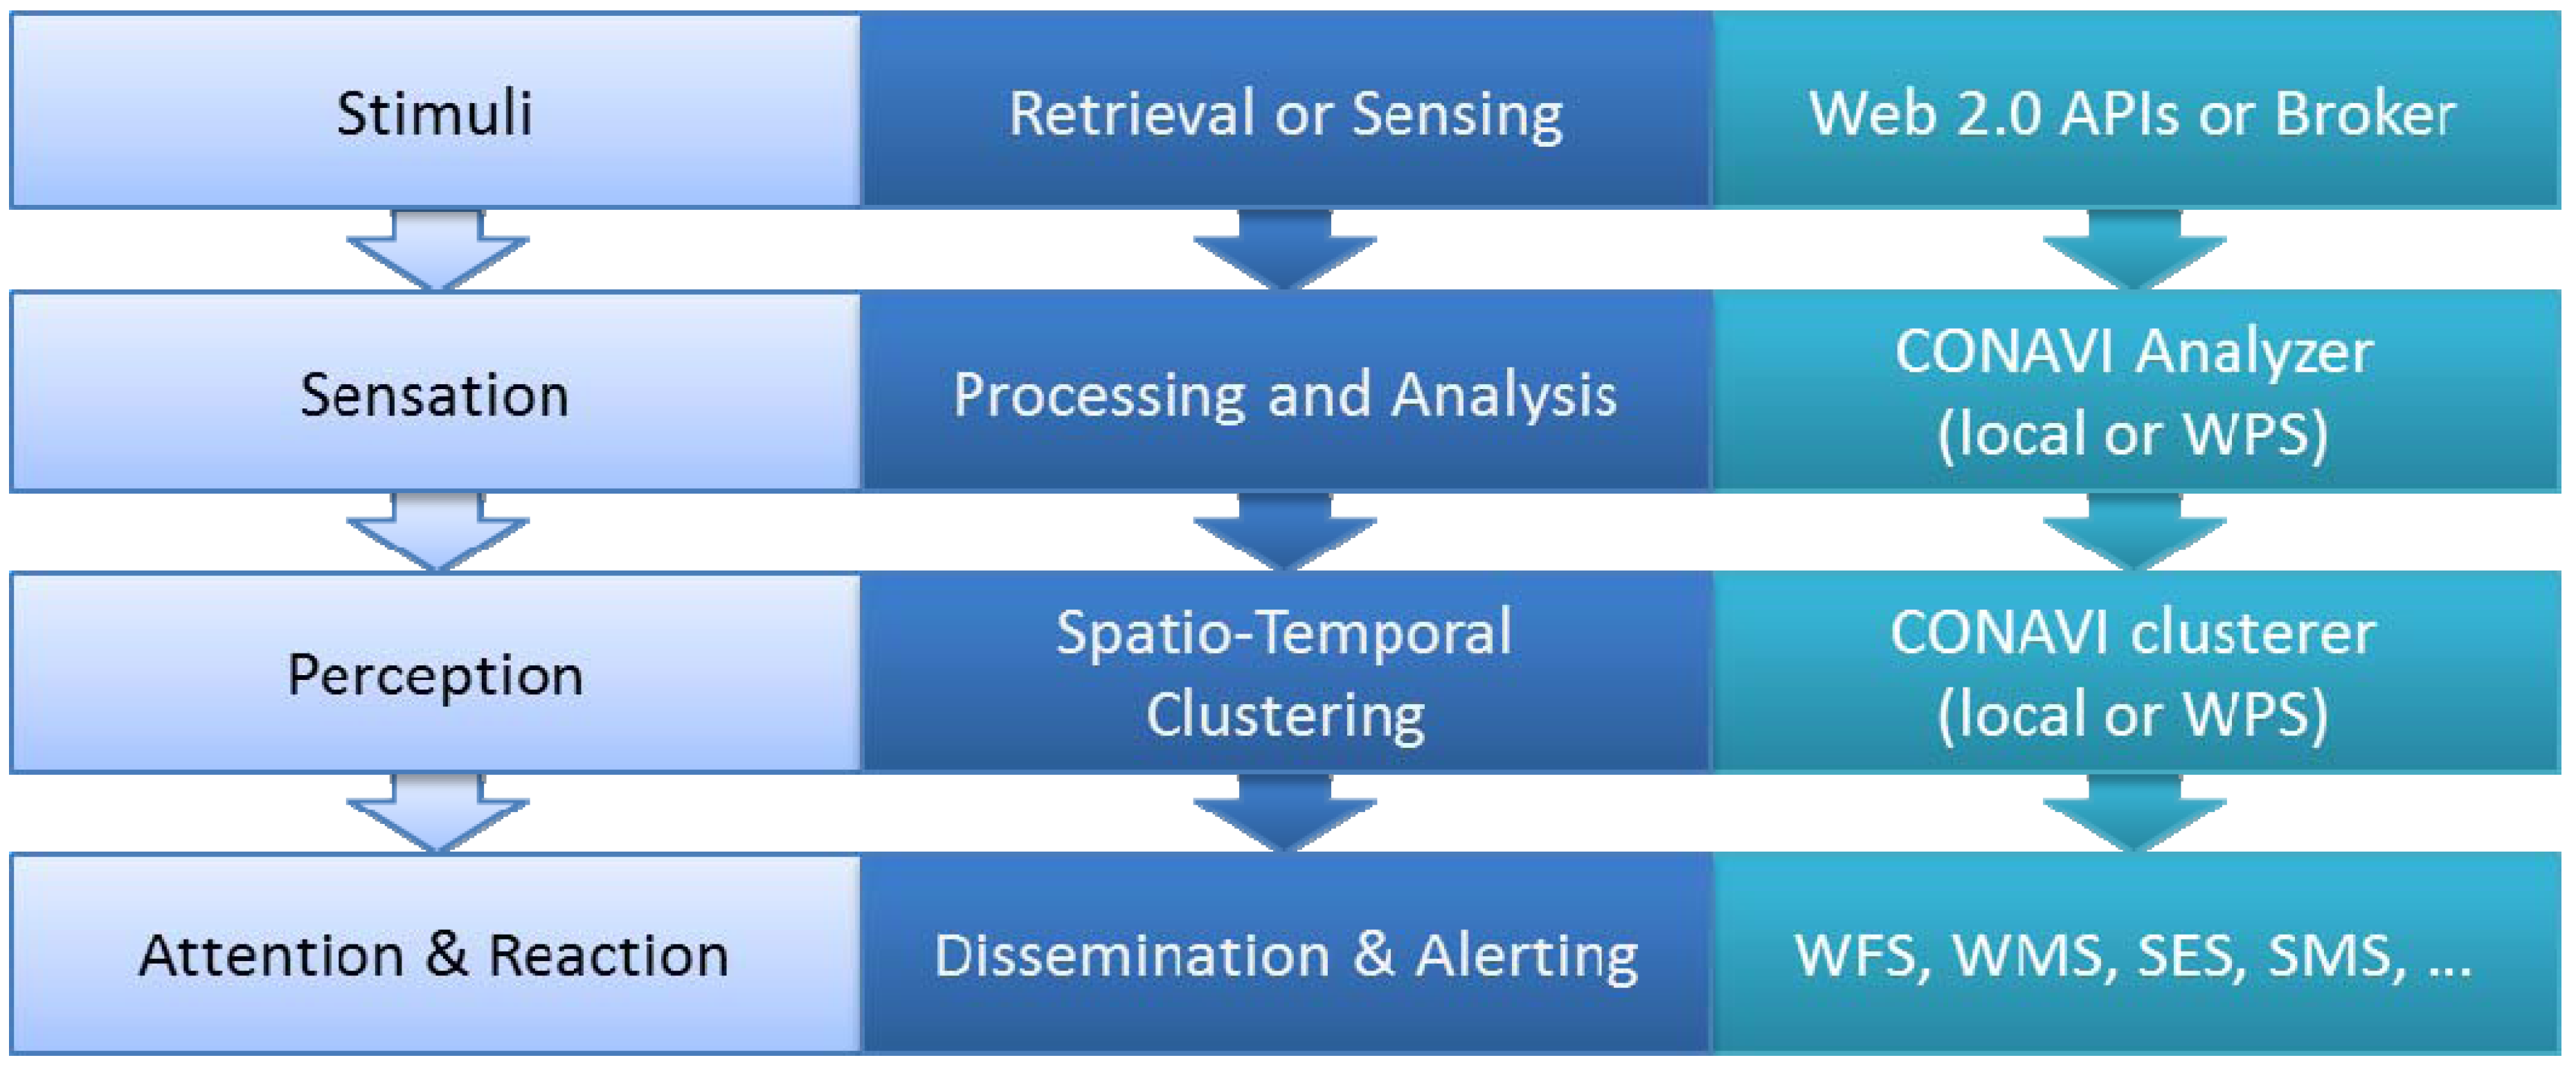
2. Observation Systems and their Integration

Ultimately, we intend to integrate sensor information coming from different sources. In this work, we focus on remote sensing information and VGI. This section provides the required background, and sketches the concepts behind the proposed solution.

2.1. VGI and other Types of User-Generated Content

User-Generated Content (UGC) comes in many facets. To arrive at a simple typology, we make two distinctions. First, whether the UGC was explicitly or implicitly volunteered, i.e., whether it was contributed for a specific purpose, or is “just” publicly available. Second, whether the UGC is explicitly or implicitly geographic, i.e., whether it is about a geographic location, or “just” has coordinates or a location as associated meta-data. Thus, if UGC is about a specific geographic place, it is explicitly geographic, while if it is merely geo-coded but not about a place, it is implicitly geographic. If an author contributes UGC as participation in a public effort or initiative, it is volunteered explicitly, while any UGC that is available to everyone but not contributed to a public effort or initiative is implicitly volunteered. This gives us a matrix of four types of UGC, with examples using the most common UGC (Table 1).
Table 1. Typology of user-generated content.
Content/Contribution Explicitly volunteeredImplicitly volunteered
Explicitly geographicVolunteered Geographic Information (VGI), e.g., Open Street MapUser-generated geographic content (UGGC), e.g., place-related Tweets
Implicitly geographicVolunteered information (VI), e.g., geo-coded Wikipedia entriesGeneric user-generated content (UGC)
The typology also impacts the sensing of UGC. We propose to differentiate between active and passive sensing, which corresponds to explicitly volunteered and implicitly volunteered information. Other possible terms are “participatory” sensing and “opportunistic” sensing [15]. The former provides a framework for the citizen participation and includes examples such as counting birds. The latter approach provides no a priori guidelines, and aims to tap into the abundance of UGC offered without any institutional or organizational framework. We acknowledge that the categories presented above only represent the poles of a spectrum of possible cases. For example, in the case of Tweets about natural disasters, the authors may not send their tweets to a particular institution or within a particular framework, yet they hope that their information is read and acted upon, thereby actively (explicitly) volunteering it. Initiatives like “Tweak the Tweet” [16] aim to strengthen the participatory character by offering a framework to structure the UGC. While our examples on natural disasters deal mostly with VGI, it is important to keep in mind that the UGC sensor we propose in the following sections is able to sense all types of UGC in an opportunistic or participatory manner.

2.2. Citizen-Based Geo-Sensor Networks

For our work, the perceptions of human observers are the crucial first step in the creation of VGI. However, in contrast to a trivial interpretation of the “citizen as sensor” metaphor, we do not consider the individual citizen as a sensor making observations, but as an element of a larger (virtual) UGC sensor. The observed property is VGI coming from a volunteer. Thus, we focus on a higher level observation process, where a stream of VGI from multiple volunteers gets harvested under pre-defined conditions and turned into an aggregate observation. For example, if a person perceives a forest fire, takes a picture of the fire and uploads that picture together with associated keywords and information about spatial-temporal location to Flickr, we consider the upload to Flickr as a stimulus to a “VGI sensor”, which aggregates such stimuli over some time and location windows and produces its own observations from them.
The following table (Table 2) presents the central concepts of VGI sensing and event extraction, as introduced originally by De Longueville et al. [11] and modified in Schade et al. [17]. In particular, the table distinguishes the different entities and processing steps for VGI (middle column) and remote sensing (right column) in analogy to the (human) nervous system and reactions to external stimuli (left column). The analogy to the nervous system is particularly relevant in respect to quality assurance. Similar to the combination of multiple human senses, multiple UGC and environmental sensors may be used in combination in order to support an initial perception or to gather additional information. For example, when a human feels something on his/her skin, this sensation is caused by the synthesis of a number of stimuli (e.g., nerve cells reporting something). If there are patterns in these sensations, such as a repeated light sensation moving in a direction, this might lead to the perception of having an insect on one's skin. Depending on the type of perception and situation, this could be dangerous or irrelevant. In the first case, the human directs his/her attention to the origin of the first (tactile) perception and reacts depending on a second (visual) perception, e.g., whether s/he sees a fly or wasp. Similarly, VGI sensing might detect a high number of tweets and images about forest fires in a given area. Combining this first perception with perceptions from other sources such as remote sensing improves the information basis on which to react.
Table 2. Event detection based on Volunteered Geographic Information (VGI) sensing compared to remote sensing (adapted from [17]).
Nervous SystemVGI SensingRemote Sensing
SensationPublicly available VGI is detected, filtered and organized according to the VGI virtual sensor’s specification.Waves are detected and digitized by a satellite-mounted sensor, i.e. camera and series of remote sensing images are created according to the image sensor’s specifications.
PerceptionPatterns are found in results, and events and situations are identified thanks to prior knowledge.Signals with specific characteristics are detected in image series, leading to the identification of events.
AttentionAlerting mechanisms are triggered according to context.
In order to exploit the full potential of sensed VGI, it needs integration with existing spatial data infrastructures, either through tight coupling in common data structures, or through loose coupling in common visualizations. Similarly to traditional remote or in-situ sensors, UGC sensing faces the problem of multiple sensor types and protocols defined by their manufacturers. To publish and integrate this sensor data with spatial data infrastructures, any captured raw data needs to be transformed to standardized protocols of the infrastructures. Traditionally, this has been done by manually implementing adapters for each sensor type, resulting in extensive efforts when developing large-scale systems [18]. More recent work, like the Sensor Interface Descriptor (SID) [19], enables the declarative description of sensor interfaces, including the definition of the communication protocol and processing steps. They establish the connection to a sensor and are able to communicate with it by using the sensor protocol definition of the SID. Similar to remote and in-situ sensors, the integration of these VGI sources with spatial data infrastructures poses new research challenges: to discover and retrieve this VGI we have to deal with the different interfaces of each Web 2.0 service (Flickr, Twitter, Facebook, etc.) and its heterogeneous capacities. To address these issues we propose a scalable solution, which aims at improving the interoperability of the heterogeneous nature of the multiple Web 2.0 services available.

2.3. Example Forest Fire Observation Systems

In this section, we describe our approach for processing VGI—CONAVI (CONtextual Analysis of Volunteered Information), see also [20,21], and we sketch a traditional forest fire information system.
The Figure 1 (below) shows the principal phases of a complete process model to retrieve, access, analyze and disseminate user-generated geographic content. The left column corresponds to the nervous system analogy introduced in Table 2, the middle column to the equivalent high-level tasks, and the right column to the technology used. The high-level task of retrieval/sensing corresponds to the querying of Application Programming interfaces (APIs) and the subsequent storage of retrieved data. In terms of technology, the system currently uses the social media platforms Twitter and Flickr, but it could be adapted easily to use a more generic platform such as the Web 2.0 Broker [22]. During the processing and analysis phase, the module CONAVI Analyzer works with the individual recording stimuli (i.e., Twitter texts, Flickr images with metadata). First, it validates them by checking their topicality. This check searches for forest-fire related keywords in the record, and based on keyword occurrences extracted from a manually annotated set of 6000 Tweets, assigns a topical category. The records that are likely to be about forest fires enter the next processing step and are geocoded by matching found place names with entries in gazetteers (currently based on the Geographic Information System of the European Commission). Then, the Analyzer enriches the sensations with further information (e.g., local land cover, population density, forest fire risk, distance to known fires), and from this calculates an integrated quality score that facilitates filtering for the end user and turns each recorded stimulus into a sensation with extended context information. In a next phase, the system looks for patterns among the individual sensations that have been organized according to the specification of the Analyzer Module. This is accomplished by clustering the sensations. Since forest fires are events located in space and time, we chose to cluster the sensations spatio-temporally, although other types of clustering (e.g., thematically) are possible. The spatio-temporal clustering module CONAVI Clusterer aims to find groups of high-potential VGI sensations. Currently, it uses the SatScan [23] software and performs both a spatio-temporal permutation as well as Poisson-based spatio-temporal scan (corrected for population density). Any clusters found are treated as perceptions, which are again assessed for thematic accuracy. Finally, the combined (cluster) likelihood of a forest fire is calculated, and based on this information, the system can alert human experts who can decide to further investigate or act on the issue.
Figure 1. Overview of approach for sensing and processing.
Futureinternet 04 00807 g001
The dissemination and alerting phase is currently implemented as a web map. In terms of technology, we use open standards, particularly the SWE suite of standards of the Open Geospatial Consortium (OGC) [4]. Further, we adhere to OGC standard service interfaces, such as Web Map Service (WMS) offering visualization functionality for geospatial content [24], Web Feature Service (WFS) providing querying and access capabilities for geospatial objects [25], and Web Processing Service (WPS), as the common OGC mechanism for encapsulating geospatial algorithms and simulations as a service [26].
Approaches relying on remote sensing imagery would follow a similar pattern. Comparable to the workflow used in the European Forest Fire Information System (EFFIS) [27], a satellite's sensors measure electromagnetic waves, generated either passively as reflected or emitted natural radiation (e.g., Infra-Red), or actively as emitted and reflected energy (e.g., Radar). These signals are usually stored as grid cells (or pixels of an image). Subsequent processing steps include the removal of artifacts, geo-referencing, and the addition of meta-data, similar to the calculation that the CONAVI Analyzed performs. Further analysis steps commonly derive a geophysical variable from the original raw data, e.g., the temperature at a location, similar to an integrated quality score for each sensation from the Analyzer. Similar to the CONAVI Clusterer module, a collection of pixels and images can be analyzed for clusters of significantly higher temperatures, resulting in the detection of hot spots that might be caused by forest fires. Further cross-validation with other data, such as land cover or risk indices, might lead to a classification of the hotspot as forest fire, with dissemination of this information to relevant authorities and issuance of alerts. We will use these two examples for illustration in the remainder of this paper. For the EFFIS related case, it should be noted that—for reasons of simplicity—we describe an abstracted system that is close to, but not identical with the current EFFIS implementation.

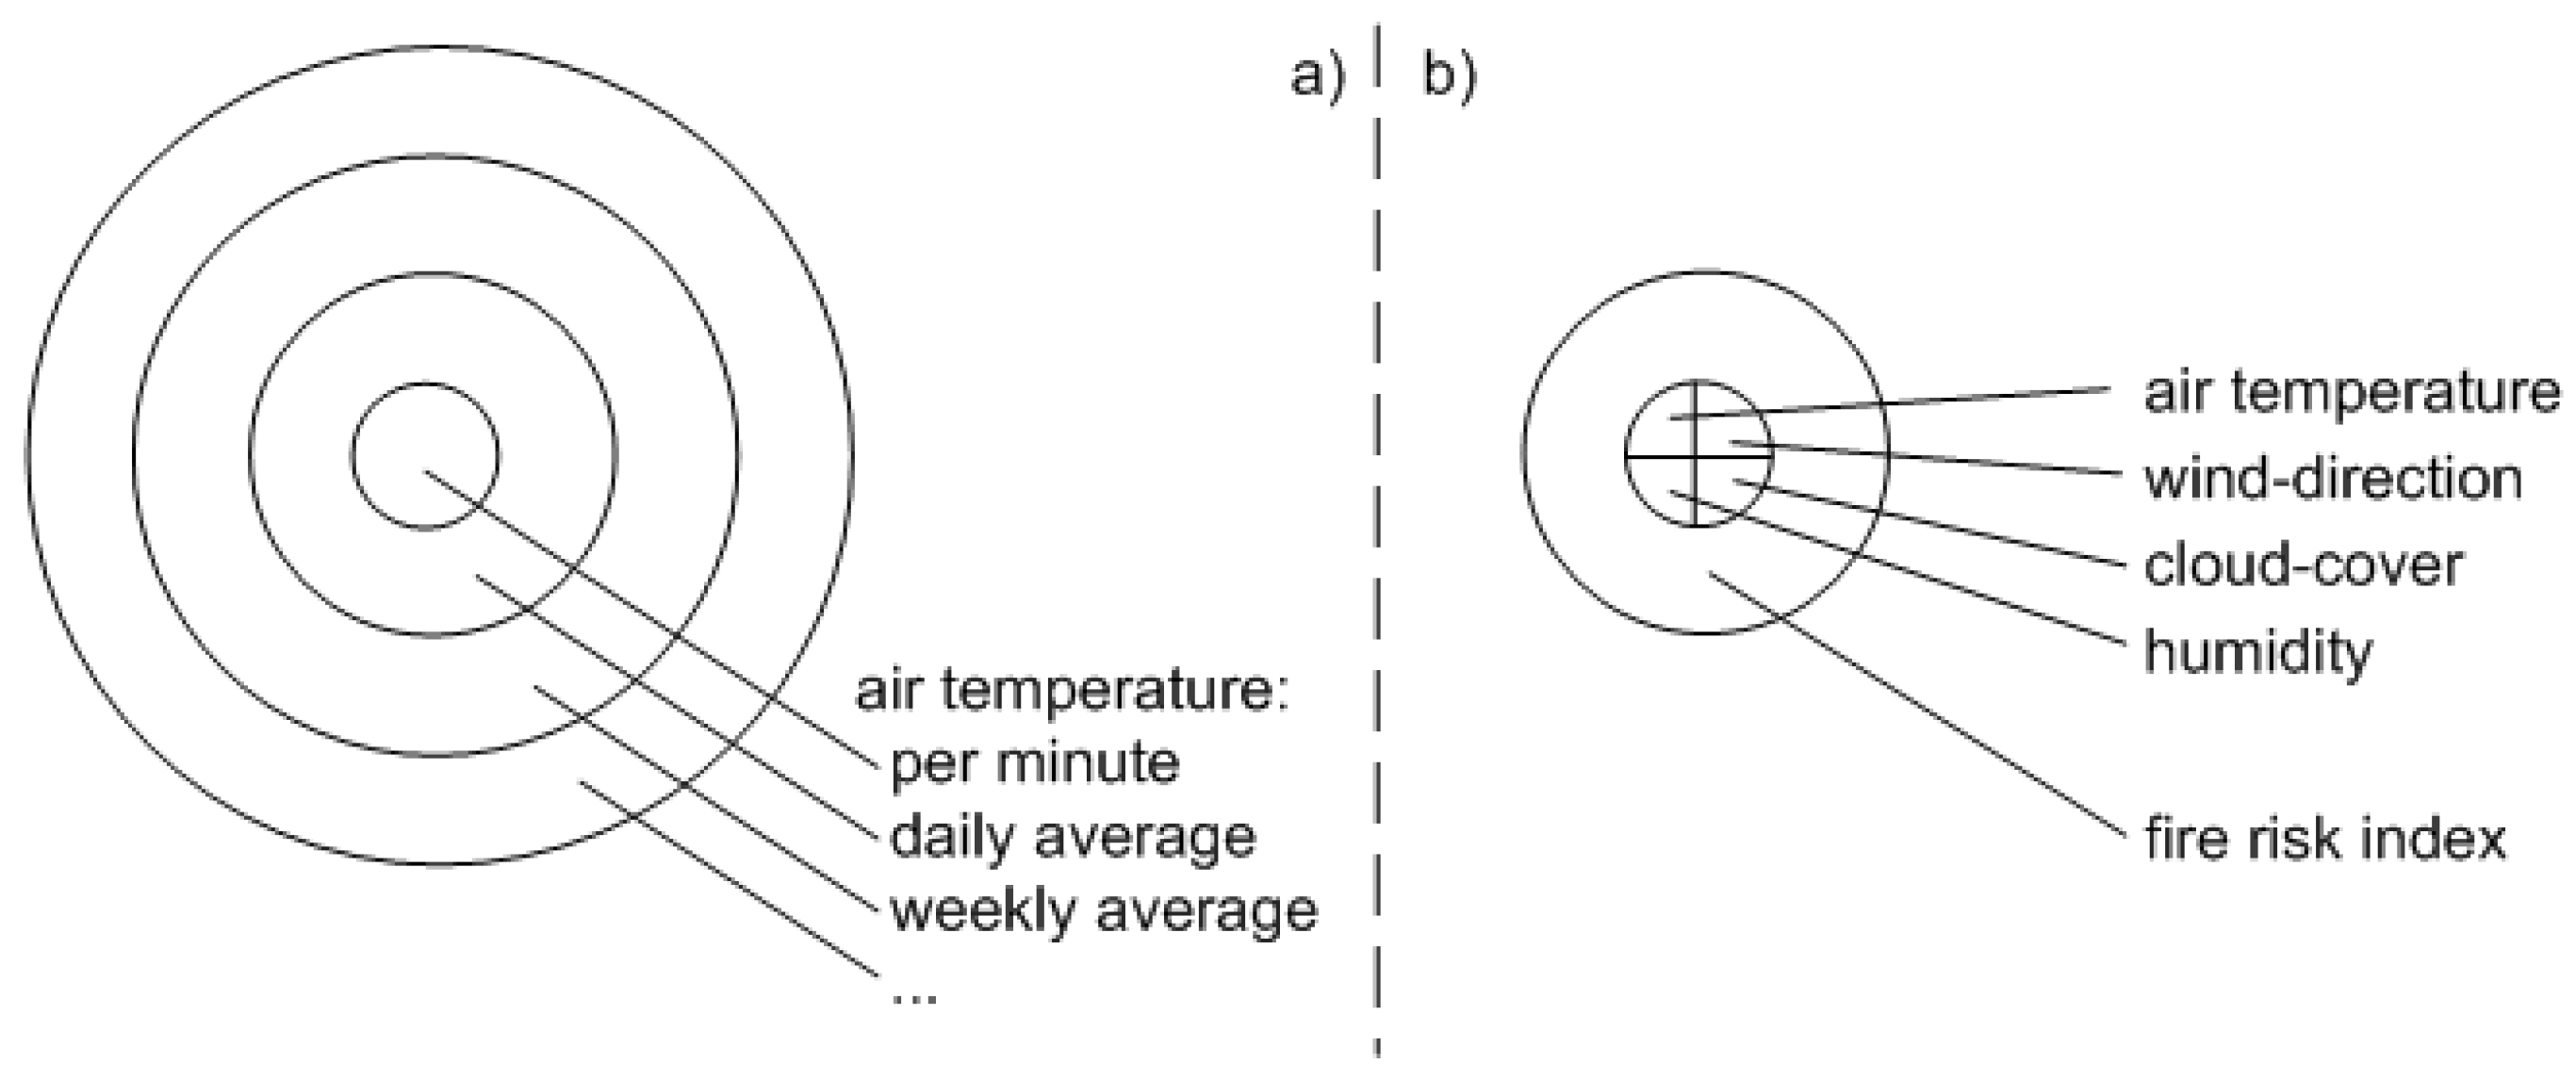
2.4. Design of the Integration Approach

Our integrative approach focuses on the value-chain of generating environmental information, in which raw measurements are processed step-by-step. The processing chains for generating value-added information traverse the layers in Figure 2, where the center represents the initial content and each surrounding layer represents the results of one processing step. For example, the raw data might be air temperature measures (in intervals of one minute), and the first processing step might provide daily averages, the next weekly averages, etc. (Figure 2a). We may also think of data coming from different sources, for example measured by diverse sensor networks, such as air temperature, wind-direction, cloud-cover and humidity values. In this case, the first processing step might be a merger of pieces of information into a complex measure, such as the fire risk index (Figure 2b).
Figure 2. Layers of value-added information, (a) averages of air temperature; (b) fire risk index.
Futureinternet 04 00807 g002
Alternatively, contents provided by two different sources, e.g., satellite images from a conventional physical sensor and VGI posts on photo-sharing web sites, may be provided separately. As the information is processed—i.e., value-added information is created—resulting layers might overlap. The example from the previous section illustrates this nicely. Satellite images could be analyzed for temperature hotspots, and some of these hotspots might be categorized as forest fires. At the same time, VGI posted through social media platforms could be analyzed for hotspots as well. In social media, these hotspots could be purely thematic in nature, such as an increase of words like ‘fire’ in messages, but in the case of sufficiently accurate VGI as in our example case, the hotspots would correspond to spatio-temporal clusters [21] and subsequently, some of these hotspots might also be categorized as forest fires (Figure 3). Two case studies for France in 2010 and 2011 have shown that the CONAVI system can detect the same forest fires that the EFFIS system reports, and some that were not reported but confirmed by looking up news reports [28]. Thus, one can arrive at the same kind of (forest fire) observation result using different information channels. This is an important result in itself, because it can help verify the respective results from multiple sources. However, usually the integration of the results depends on manual domain expert investigation, which is always time-consuming and might be in scarce supply. With our integration approach presented here, we aim to facilitate semantic observation integration by providing a sound formalization of the overall system.
Figure 3. Detecting forest fires using satellite images and VGI.
Futureinternet 04 00807 g003
For the following, especially for Section 4 and Section 5, it is worth remembering three characteristics:
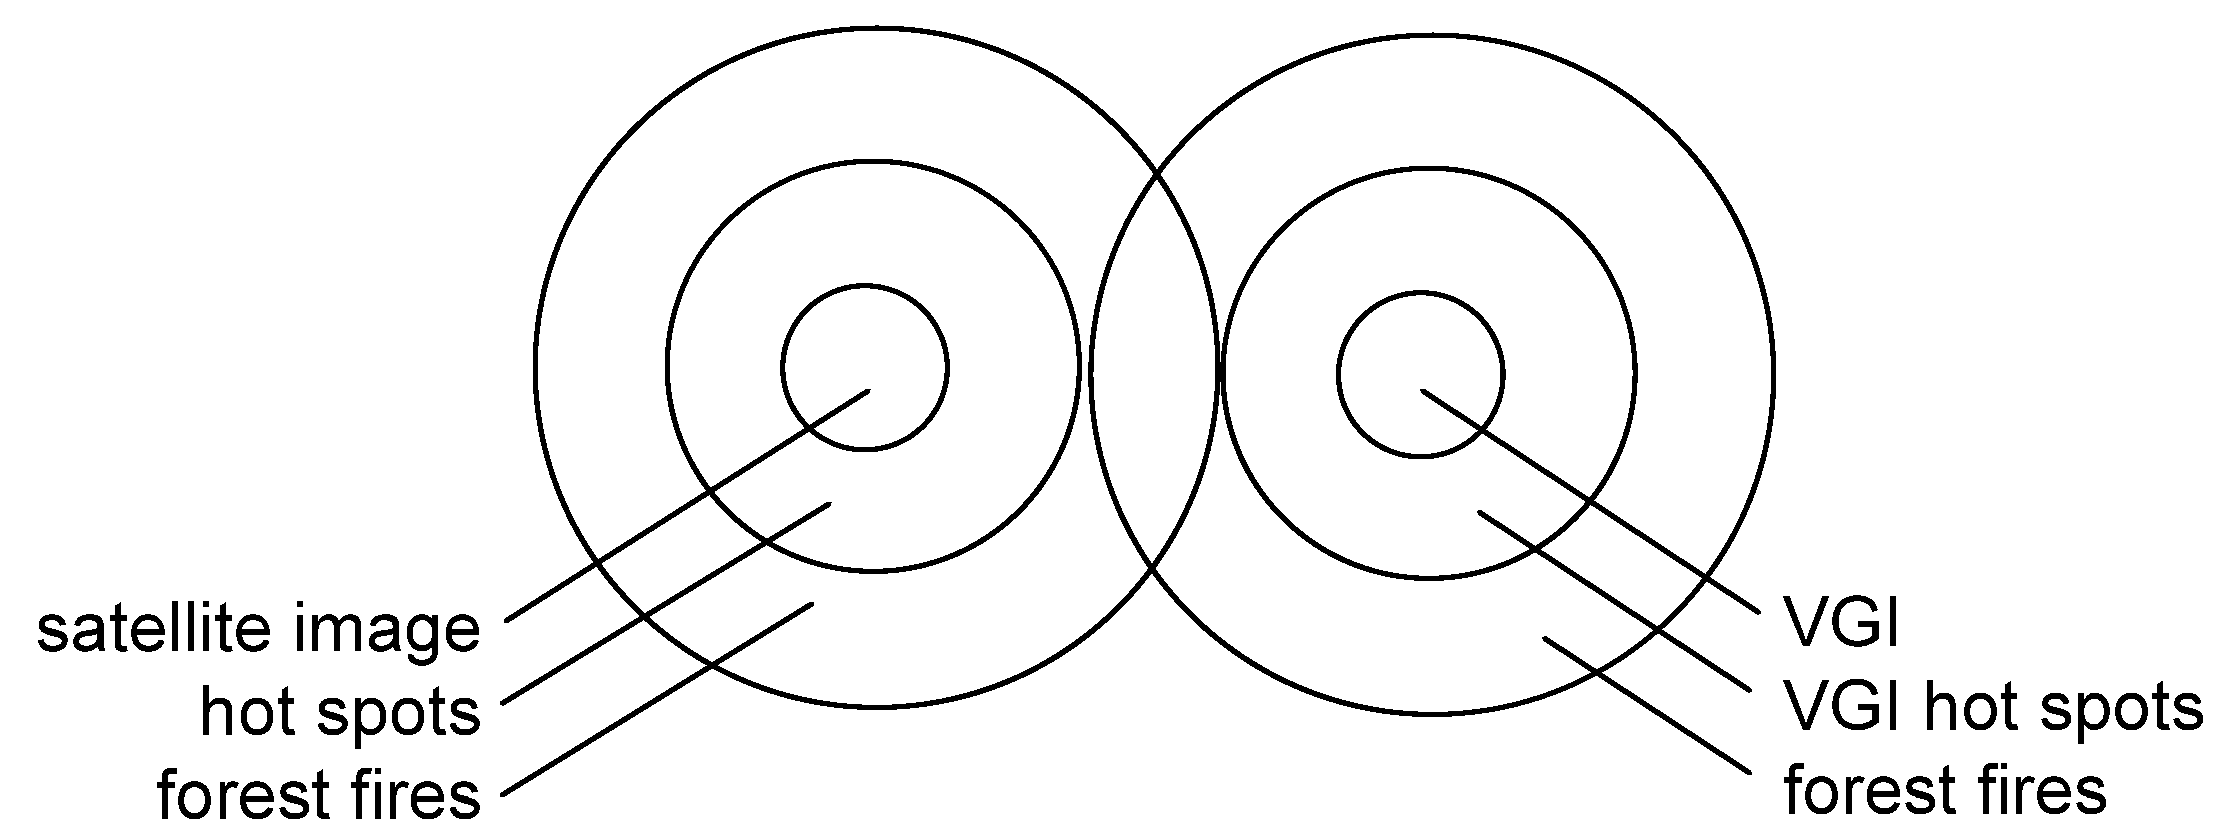
  • • We can only move from the inner layers to the outside.
  • • The information becomes more specialized with distance to the center, i.e., application specific context is introduced increasingly.
  • • Information can only be integrated on a shared layer.
In Section 4 we will use these characteristics, together with an ontology for observations, to formalize a system for information integration. Before, i.e., in the next section, we discuss the use of algebra as a tool for (formal) system engineering, whereas possible generalization, re-use and further improvements are discussed in Section 5.

3. Engineering Formal Systems with Ontologies and Algebras

Before elaborating on the detailed implementation of the example, we introduce the main engineering principles of algebraic specifications and its use for ontology development below. This particularly includes the alignment with the DOLCE Ultra Lite ontology, its SSN extension and the inherited ontological commitments.

3.1. Ontologies and Ontological Commitments

Ontologies have been suggested and used as the basis for semantic interoperability of information systems [29]. Following Guarino’s characterization of an ontology (in the Artificial Intelligence sense), as an “engineering artifact, constituted by a specific vocabulary used to describe a certain reality, plus a set of explicit assumptions regarding the intended meaning of the vocabulary words” [29], assumptions can be stated using any formal theory. We will use an algebraic formal theory as explained below (Section 3.2).
Any ontological theory has to commit to some basic distinctions. Our ontological commitments are based on the Descriptive Ontology for Linguistic and Cognitive Engineering (DOLCE) [30], in its simplified form of DOLCE Ultra Lite (DUL) [31] and its application to sensors in the skeleton of the Semantic Sensor Network (SSN) Ontology [32]. A comparison of the latter with other sensor ontologies has been provided by Janowicz and Compton [6]. All extensions that are introduced in this article are aligned with DUL and the SSN Ontology, i.e., no additional concept matching is required.
DUL distinguishes four top-level categories of entities: objects, events, qualities, and information entities. Objects, for example lakes, participate in events, for example rainfalls. The categorization of an entity as object or event depends on the purpose and desired temporal resolution. On closer analysis, many phenomena involve both categories. For example, a water body can be conceptualized as a single static object, neglecting the flow of water, or as a collection of objects (amounts of water, terrain features) participating in water flow events.
Properties are qualities that can be observed via stimuli by a certain type of sensors. Properties do not exist independently, but depend on other entities, the so-called features of interest. Physical properties belong to physical objects, temporal properties to events. For example, a temperature belongs to an amount of matter and a duration belongs to an event.
An observation is seen here as invoking first a quale in the observer’s mind, or an analog signal in a technical sensor. Our notion of qualia denotes a quality perceived by an observer and is not abstracted from the carrier of the quality. The red of the rose perceived by an observer belongs to that particular rose as well as to the observer; it is not abstracted from either. Thus, observation involves firstly the production of a quale (analog signal) and secondly its symbolization, i.e., a sequence of impression and expression.
Measuring is distinguished here from observing by requiring measurements to have numeric results. Stevens considered measurement as “the assignment of numerals to objects and events according to rule” [33], but included names in his measurement scales. This required, at least in theory, to turn names into numbers by some rules. Here, the term measurement is restricted to quantification, and the term observation is used for sensing processes with results symbolized in any form, not just numerically. The defining property of both, observation and measurement is to map to well-defined symbol algebras, whether these are numeric or not.
The result of an observation (as well as of a measurement) process is an information entity, which is commonly referred to as observation as well. It is considered a social object, expressed by abstract symbols. Apart from the value of the observed property, it can contain temporal and location as well as uncertainty information. We use the term observe for the event and the term Observation for its result.

3.2. Algebras and Algebraic Specifications

To formalize our theory, we use algebraic specifications of Abstract Data Types (ADTs) [34], in which the (algebraic) theory of an ADT describes its abstract behavior, whereas models are given by concrete data types [13]. In other words, we use ADTs together with their (algebraic) specification as ontologies. Additionally, we provide (algebraic) functions to define transitions between ADTs. The resulting formal system will implement the integration approach that has been outlined above.
The decision to use an algebraic approach for ontology engineering instead of common approaches, which apply Description Logics [35] or First-Order Logic [36], depends on the goals. In our case, we face a data integration challenge involving remote earth observation sensors and VGI. Encapsulation, as a main feature of ADTs [34], provides us with the required abstraction mechanisms. The functional equations that are used in algebraic specification can be directly applied for mapping from sensor- and VGI-specific models to an integrated theory of observations. In order to support clean ontology engineering, the observation theory can be aligned with an upper-level ontology (DUL and its SSN extension), as we will see in our examples in Section 4.3.
The above-mentioned principles relate closely to concepts of No-SQL databases in information science [37]. Moreover, the history of using algebraic specifications and functional programming for geospatial information dates back more than twenty years. They have been first suggested for user interface design of Geographic Information Systems (GIS) [38] and were soon extended to conceptual modeling [39], including the principle of measurement-based GIS [40]. The explicit use of this approach for (spatio-temporal) ontology engineering dates back at least five years [41,42,43]. Recent work directs these ontology developments to sensing [44] and data integration [1].

4. Formalization of the Integration Approach

We build our formal system for integrating sensor data using algebraic specifications and use the functional programming Haskell [14] for formalization. The table below provides a brief introduction with examples of the most important language elements. As we present the solution directly in an executable language, a test implementation (an executable model) of the desired system results automatically and guarantees the consistency of the ontology.
Table 3. Overview of required Haskell constructs.
Haskell constructExplanation
dataAlgebraic data types (which, for the purpose of this work, can be seen as synonyms to ADTs) introduce types by specifying a constructor function. The keyword (data) is followed by a type name, an equal sign and the constructor function. The first element of this function is its name. Constructor functions can be enumerated using the ‘|’ symbol. Lists can be typed using the construct “[]” (also nested).
data Value = Measure Float Unit | … | Image [[Pixel]]
typeType synonyms give previously defined types a new name. They are used for clarifying the meaning of existing types in new contexts.
type Hotspot = ObservationResult
classType classes collect types that share certain behavior. This behavior is defined by a selector function. The keyword is followed by the name of the type class and its parameters. Selection functions are specified after the keyword ‘where’.
class STIMULI quality entity agent where
perceive :: quality entity → agent → agent
instanceInstances connect algebraic data types to type classes. In an instantiation, axioms specify how the algebraic data types implement the behavior specified for the type class. The keyword is followed by the name of the type class and the assignment of its parameters to algebraic data types.
instance OBSERVATIONS VGI Volunteer VGISensor where ...
… =>Contexts assert constraints on algebraic data types, may by assigned to the parameters of a type class. Constraints are places after the keyword class and end with the
symbol “=>”.
class STIMULI quality entity agent => OBSERVATIONS quality entity agent
name:: p1 → p2 …Functions are introduced by their signature, which consists of a function name, the symbol ‘::’ and the function parameters (at least one), separated by ‘->’. The last parameter specifies the output.
tell :: agent -> ObservationResult
The behavior of a function is then specified by equations.
tell vgiSensor = vsResult vgiSensor

4.1. Algebraic Specification of the Abstract Data Types for Earth Observation

Before we can define steps in the processing chain of environmental observations (by functions) and introducing ADTs for representing intermediate and final integration results, we have to establish an ontology that captures the building blocks of observations, i.e., the inner layer of the diagrams presented above (in Section 2.3). This should not only cover physical sensing procedures and environmental simulation, but also VGI.
Since a basic observation algebra is already available [44], we can re-use ADTs, such as a construct for measurement values, i.e., for raw data that is the result of a measurement. However, we extend the initial “Value” ADT by messages and images:
data Value = Measure Float Unit | Category String | Message String | Image [[Pixel]] …
The result of an observation consists of a measurement value, a message, an image—each combined with a position and time—or of a set of such elements. We thus extend the basic ADT that has been suggested for an observation in [44] by a construct for multiple observation results:
data ObservationResult = Observation Value Position ClockTime | ObservationResults [ObservationResult]
On this basis, we can define sensing devices, which are able to perceive stimuli from their environment and express them as data. According to our examples, we introduce VGI sensors (following [12] and [17]) and earth observation satellites. In the former case, people that act as volunteers have a particular offering of VGI (quality), i.e., some kind of media content associated with spatio-temporal locations, which they upload and thereby produce a stimulus to the VGI sensor. We can re-use the previously introduced “ObservationResult” for representing this information held by the volunteer. An observation result such as a tweet could be generated by using the “Message” constructor, which has been introduced above, as part of the ‘Value’ ADT:
data Volunteer = Volunteer {vgiOffering:: ObservationResult}
In order to be later able to align our formal theory (ontology) for VGI sensing with DUL and its SSN extension, we also introduce an element that explicitly represents a piece of VGI as a senseable quality of a volunteer (Section 4.3 will provide more insides on the reasons behind this decision):
data VGI = VGI Volunteer
Now, a VGI sensor can be defined as the entity capable of translating the sensed offerings of volunteers into a new value-added observation result.
data VGISensor = VGISensor {vsQuale:: ObservationResult, vsResult:: ObservationResult)}
For an earth observation (EO) satellite, the sensor can translate the stimuli that it perceives related to a particular quality—electromagnetic radiation from the surface of the ear—into an observation result that is an image in this case. Again we rely on the extension of the initial ontology as introduced above. In this case we depend on availability of the ‘Image’ constructor function in order to encode data received from cameras. Accordingly, the earth surface transmits radiation (here represented as a Float) and—vice versa—the electromagnetic quality can be associated to the earth surface:
data EarthSurface = EarthSurface {radiation :: Float}
data ElectromagneticRadiation = ElectromagneticRadiation EarthSurface
data EOSatellite = EOSatellite {eoQuale:: [[Float]], eoResult:: ObservationResult}

4.2. Generating Value-Added Information

Now, as the foundations are available, we focus our attention on the transitions from the raw data (innermost layers in Figure 2, see Section 2.3), to any added value, i.e., processed information (outer layers the diagrams). These constructs are application dependent; the forest fire example serves for illustrations.
We introduce constructs that represent the results of a transition (the next outer layer in the diagram), and formalizations of the systems, which perform the actual transition between two layers, such as the creation of hotspots. In analogy to the observations data types above, the former can be seen as ADTs, which provide unique entry points to each layer, such as hotspots and forest fires. They encapsulate the manifold possibilities in which a single instance might have been produced.
As a first example, we create a type for capturing hotspots as a specific kind of value-added information. Each hotspot represents a set of observations results, which can again be encapsulated by a single data type:
type Hotspot = ObservationResult
Notably, as we use the type construct, hotspots can be handled just as any other observation result. We use the same mechanism to distinguish forest fires:
type ForestFire = Hotspot
Having the types for representing measurement results available, we are now able to specify systems implementing one or more processing step, i.e., the transition from inner to outer layers. For example, the CONAVI analyzer takes a VGI sensor as input and performs two steps, the identification of hotspots (e.g., Tweets mentioning burnt areas or on-going fires) and the categorization into forest fire information (e.g., the likelihood that the hotspot is actually about a forest fire, see also Section 2.1, Figure 1):
data CONAVIanalyser {caInput :: VGISensor, caHotspotResult:: Hotspot, caForestFireResult:: ForestFire}
Similarly, we introduce the CONAVI clusterer, which first provides the cluster analysis on a set of potential forest fire messages and then again performs a categorization of forest fires—this time on cluster levels. As we specified that an observation result can also incorporate a set of results (Section 4.1), and because the hotspot and forest fire data types behave similarly, it is sufficient to use only single types as function outputs:
data CONAVIclusterer {ccInput :: VGISensor, ccHotspotResult:: Hotspot, ccForestFireValue:: ForestFire}
In exactly the same manner, we can provide a data type for the forest fire information system (FFIS)—as sketched in Section 2.3—just that this is operating on top of an earth observation satellite, instead of facilitating a VGI sensor:
data FFIS {fInput :: EOSatellite, fHotspotResult:: Hotspot, fForestFireResult:: ForestFire}

4.3. Alignment with DOLCE-Ultra-Light

In order to further specify the semantics of forest fire observations, we perform an alignment with an upper-level ontology. Based on previous experience, we select DUL, the ultra-light version of the Descriptive Ontology for Linguistic and Cognitive Engineering (DOLCE), as the best candidate. Furthermore, we take benefit of the W3C SSN ontology that is already available. The central concepts, which we are re-using from DUL and the SSN ontology, are:
  • Agents: agentive physical objects, including those that can carry out observations, i.e. that serve as sensors, and tell about the results;
  • Stimuli: enabling agents to perceive qualities, i.e., properties of some entity; and
  • Observations: Given an available stimulus, the process of an agent generating an observation result through perception.
Again following [43], DUL and SSN concepts can be formalized in Haskell as follows. The entity, which is able to observe its surroundings is called agent. As the most important behaviors, an agent can tell what it has observed:
class AGENTS agent where
   tell :: agent → ObservationResult
Stimuli are emitted by an entity, related to a specific quality that this entity inherits. These can then be perceived by some agent. The result of this perception is a change in the agent’s internal state, which holds a quale (to be modeled further down):
class STIMULI quality entity agent where
   perceive :: quality entity → agent → agent
Now, if there is a stimulus, the agent may perform an observation, in which the quale is mapped onto a communicable expression, which will be an observation result, as we show later:
class STIMULI quality entity agent => OBSERVATIONS quality entity agent where
   observe :: quality entity → agent → agent
Having this reference frame available, we can specify the common observation behavior of the previously introduced data types by instantiation. For reasons of brevity, we introduce only one full example (the VGI sensor) below and only indicate the instantiations of the other data types.
A VGI sensor is an agent that can tell the full list of recorded VGI items, i.e., messages with position and clock time. Considering the functions that have been defined on the ‘VGISensor’ ADT, any such sensor can tell about its observation result(s), by using the vsResult operator, i.e.:
instance AGENTS VGISensor where
   tell vgiSensor = vsResult vgiSensor
It can perceive stimuli, i.e., information offerings from volunteers. The perceived stimulus is basically stored in the VGISensor inherent quale:
instance STIMULI VGI Volunteer VGISensor where
   perceive (VGI volunteer) vgiSensor = vgiSensor {vsQuale:( vgiOffering volunteer)}
In line with the VGI related parts of Table 2 and Figure 1, a VGI Sensor is now introduced as the tool to recognize VGI stimuli. The sensor can observe these stimuli by translating them into the set of messages with position and clock time, which corresponds to the sensation as mentioned in Table 2 and Figure 1 respectively. The newly generated observation result is stored as a VGISensor inherent status, which can be accessed via the “vsResult” operator. Exactly the same operator is used above—when implementing the “tell” operator—to communicate this observation result to the outside.
instance OBSERVATIONS VGI Volunteer VGISensor where
   observe (VGI volunt) vgiSensor = vgiSensor {vsResult:(vsQuale (perceive (VGI volunt) vgiSensor))}
Using a similar sequence of instantiations:
  • • the CONAVI analyzer finally can observe hotspots out of the data coming from a VGI sensor:
  • instance OBSERVATIONS Hotspot VGISensor CONAVIanalyser where
  • • the CONAVI analyzer can observe forest fires out of the previously identified hotspots:
  • instance OBSERVATIONS ForestFire CONAVIanalyser CONAVIanalyser …
In this way, we re-use the ‘Observations’ ADT to also encapsulate the perception behavior, as introduced in Table 2, by a sensor. Here, we see for the first time that an agent can play both roles, of the entity of which a quality is observed, and of the observing agent itself. This is a straightforward mechanism for capturing a kind of self-observation that causes an internal state change. The same procedure is applied several times below.
  • • the CONAVI clusterer can observe clusters out of the previously identified forest fires:
  • instance OBSERVATIONS Hotspot CONAVIanalyser CONAVIclusterer...
  • • the CONAVI clusterer can observe forest fire clusters out of the previously identified clusters:
  • instance OBSERVATIONS ForestFire CONAVIclusterer CONAVIclusterer...
Moving to the satellite based identification of forest fires, we can follow a similar approach:
  • • the earth observation satellite can observe images:
  • instance OBSERVATIONS ElectromagneticRadiation EarthSurface EOSatellite …
  • • the FFIS can observe hotspots within the data coming from the satellite:
  • instance OBSERVATIONS Hotspot EarthObservationSatellite FFIS …
  • • the FFIS can observe forest fires out of the previously identified hotspots:
  • instance OBSERVATIONS ForestFire FFIS FFIS …
Re-visiting Figure 1 and Table 2, these also encapsulate different levels of perception, this time related to electromagnetic waves as stimuli, i.e., remote sensing.

4.4. Common Access to Value-Added Information

The algebraic approach provides a straightforward solution to the integration problem. Given the DUL and SSN alignment just introduced above, we operate on different observation-based systems using their shared behavior. Above, we already illustrated how this is reflected by the common “tell”, “perceive” and “observe” operators.
Additionally, information from two separate sources, as for example illustrated for earth observation satellites and VGI in Figure 2 (Section 2.3), may be merged as soon as the derived information can be provided via a shared ADT (overlapping layers in the figure). Considering our example, this would be the abstract data type representing forest fires. Co-occurrences of forest fires can now be calculated without required knowledge about the sources that lead to the information about a particular fire. An according function could be directly implemented based on the commonly available ADT (ForestFire in this case). The signature of a co-occurrence function for forest fires—which returns a list that contains all collections of forest fires overlapping in space and time—may be defined as:
ffCoOccurrence :: [ForestFire] → [[ForestFire]]
For real-time applications this means that we become able to process (and in particular compare) information about events, such as forest fires, seamlessly, i.e., without any artificial barriers that might have been imposed by diverse use of sensors or user-generated content. In this sense, we solved a semantic integration issue in the Observation Web.
It is worth noticing that we remain able to trace back the generation process of a data set. Having co-occurring forest fires identified, we can reveal if a particular instance has been created from a satellite image or from VGI by uncovering the used constructor function. Among other information, we may get to know if statements of two separate sources confirm or contradict each other, and thereby increase the quality of derived statements.

5. Discussion of the Integration Approach

By using concatenated functions as opposed to (Description) Logic constructs, the proposed semantic integration approach follows the idea of algebraically specifying GIS and the principle of measurement-based information systems [40]. The advent of No-SQL databases [37] indicates a trend of such solutions even for mainstream IT. On top of these known concepts, we extend the observations ontology with user-generated content (VGI in our case) and apply the approach to data integration. The encapsulation by abstract data types and the use of functional equations as transformation mechanisms are characteristics of this algebraic approach. It has the potential to solve many of the semantic interoperability problems, which continue to grow with user-generated content and require quality improvement. Notably, possible investigations of using the proposed approach on massive amounts of data—which are to be expected in the presented case—have not been examined, up to now. We consider such processing a computational issue, which ought to be addressed by appropriate system architectures. These are not in the scope of the presented formalization work.
So far, we also did not discuss the possibility and requirements for generalizing this overall approach and re-applying it to other cases. We cover the related issues below and also highlight the overall potential and drawbacks of the solution together with the major items for future work.

5.1. Generalizability of the Overall Approach

We have shown the approach for the specific case of forest fire events, but the approach is generic and can be easily transpose in other domains. For CONAVI, the parameters for every module can be changed easily. Of course, domain expertise is a prerequisite to determine an initial set of keywords and useful ancillary information for other crisis events. Below, we briefly describe two other cases to show how easily the approach can be extended.
The first case is an oil spill scenario, such as the one occurred in Mexican gulf in 2010. As for other disasters, the satellite images were used to detect oil spill surface, but also multi modal (i.e., microwave) data from RADARSAT-1 SAR satellite were analyzed [45]. On the citizen observation side, several types of data were produced. This included geo-located photos and text messages through CrisisCommons web site [46], but also more structured observations using mobile phone applications, such as oilreporter [47]. The application produces semi-structured data: date, coordinates, oil (value from 0 to 10), wetlands (value from 0 to 10), description (free text) and wildlife (free text), with the first two being generated by the phone’s sensors, and the remaining three being the actual observations of the user. It is straightforward to define data and type for this, following the forest fire case. Once ADTs for core data types, e.g., oil spill would have been defined, the phone sensors could be described similar to the earth observation satellite in Section 4.2 and its instantiations in Section 4.3. The message-based information is already captured as part of the VGI sensor contracts. Any further processing would then use both sources as input, facilitate the common access operators as given by DUL and the SSN ontology. The subsequent processing steps and according observation results could then re-apply the mechanisms for instantiation as detailed in Section 4.3: instance OBSERVATIONS OilSpill OilReporter OilReporter and so on.
As second example, we describe a snow map scenario with weather stations and citizen observations shared via a website. Contrary to remote sensing with satellites, weather stations are in situ sensors. Weather stations are equipped with traditional sensors and the measurements taken include temperature, barometric pressure, humidity, wind speed, wind direction, and precipitation amounts. Snow observation is derived as a function of these measurements. Citizen observation for snow is very popular in UK. The application of the UK snow map project [48], for example, searches Twitter for real-time snow reports and displays them on the map. Citizens tweet their observation using the hash tag #uksnow, including location (postcode, town name or geo-tagged tweet), and rating the snow that is falling out of ten (0/10 for nothing to 10/10 for a blizzard). It is also possible to include the depth of snow (cm or inches), attach a photo and add a description to the tweet. It is easy to see the correspondences with the forest fire case. Again, weather stations and required core ADTs could be described similar to the satellite case. We do not expect major differences between remote sensing—as done by satellites or other air born sensor platforms—and in situ measurements as it is the case for many of the weather data sets. Instantiations of these with the reference frame of DUL and SSN will again look similar to the instantiations provided in Section 4.3. The Twitter encapsulation as a VGI sensor is already incorporated in this work. What has to be added is the filtering step using specific keywords. This could be done as an internal state change of the sensor using an instantiation such as instance OBSERVATIONS Interest VGISensorSnow VGISensorSnow. Once instantiations are available, all other processing steps would be encapsulated with the patterns discussed before.
In summary, the data types for earth observation, DUL and the SSN ontology can be directly reused in all adoptions of the integration approach. Beyond that, all additionally required data types (mainly for representing system components as observing agents) can be constructed by following a pattern that is similar to the specific forest fire constructs introduced above (Section 4.2).The same holds for the instantiations of the DUL and SSN reference frame. In this sense, the proposed solution is highly re-usable and work required for adoption is kept to a minimum. Further examples could be added following the same pattern. For additional evaluations, extra cases might be integrated from more diverse fields, such as urban planning or 3D cadastre.

5.2. Potential and Future Work

Although promising, algebraic solutions are still rare in the Semantic Web and they lack support in the context of geospatial web applications. This results in some difficulties, such as (1) missing tool support for input and output data management for the web; (2) rare examples that illustrate the combined use of logic-based and algebraic specifications for knowledge engineering; and (3) disconnectivity between the algebraic specification and the Semantic Web community. Research in this direction should be extended in order to avoid focusing solely on logic-based efforts towards a Semantic Sensor Web and running the risk of stagnation. Still, it should be kept in mind that also the presented approach has its formal drawbacks. For example, concept disjointness cannot be represented; behavior specified at type class (ADT) level might not be implements, or it might be overwritten. Schade at al. [41] provide more details about these and other shortcomings, especially in relation to web service matchmaking; most can be generalized.
The presented work lays the function for further investigations. For example others already suggests using Haskell for common error modeling and elegant propagation [49], but further examinations are required in this field, especially exploiting the interplay between the “quality” of VGI and of classical measurements.
Another open issue is the investigation of place. Our approach currently assumes that geospatial components are introduced in form of geographic locations, with precise geometric attributes. VGI however, might merely include vague place names instead of precise locations, introducing uncertainty on the geographical side. The interplay between place and location should be considered as a major aspect to improve the suggested integration approach.
The presented algebra does also not explicitly account for (spatio-temporal) level of detail, i.e., scale. Here lies a major area for future work, because different information sources are often captured on diverse scales. A functional approach eases scale changes, but more practical examples have to be explored. We expect challenges mostly related to location (i.e., geographic scale), because we usually have precise sensor time stamps (scale seconds) available and larger time windows for environmental phenomena. In the case of forest fires, it is usually days. The temporal scale becomes an issue when integrating more than one type of phenomena, which is another direction to be investigated.
As an improvement that would be easier to achieve, some of the operators used to calculate domain specific functionality, such as value filtering, clustering and the calculation of co-occurrence might be provided more generically as part of an extended observation systems ontology. Common algorithms might be provided as defaults for further re-use. For example, the function that calculates the spatial and temporal co-occurrence of forest fires could be lifted for calculating co-occurrences of any observation result.
On a more technical level, the interplay with current standard web services of the geospatial and particularly of the Sensor Web community could be established. Data exchange from and to OGC services would be a logical next step. Since the SSN ontology was built using OGC’s Observations and Measurement standard, all required information for the exchange data model are available, i.e., it is just a matter of implementing the connectors.

6. Conclusions and Outlook

We have established a formal (algebraic) system of the semantic integration of observation-based information and showed a successful approach to the challenge of integrating them in a forest fire scenario. This illustrates the functionality that we envision for a future Observation Web and introduces a solution for semantic interoperability. It provides an alternative to common logic-based attempts. Compared to these works, the algebraic approach directly reflects that (1) sensing is a function from the world to data; and (2) any form of information integration is a function, too. Such (dynamic) behavior cannot be directly represented by logic-based approaches, which have to rely on system. However it should be noted that the algebraic approach has drawbacks beyond its current rare use in the Semantic Web community. Most importantly, it cannot be used to define disjoint concepts, and domain level semantics might be overwritten during instantiations.
The proposed approach adds a next level of maturity to our previous work [12]. If we now, for example, had all satellite and VGI data available for the 2010 forest fire season in France, we could find out how many forest fire events were detected by both sources and how many were detected by only one. Such additional information, which can be derived from using the two sensor sources, satellites and VGI in this case, can be used to further calibrate the involved sensors and thus to improve measurement quality [50].
In order to further validate and extend the presented formal theory, we plan to experiment with a more detailed workflow for processing forest fire information, as for example presented in [20] and to implement also other cases, such as the above mentioned snow map, oil spill monitoring and urban planning systems. The latter activity will also show if the assumptions that we derived from DUL and SSN hold true.
As the generalization of processing operators from multiple concrete cases to common functions on observation results would add considerable value in terms of re-usability and can be achieved quickly, we intend to focus on these parts of the implementation first. Our intermediate goals are: (1) the examination of an integrative quality model (including propagation) for classical sensor based information, results of environmental simulations and VGI; and (2) experimentations on scale transitions.
We are confident that, in the end, we will contribute to the establishment of a digital nervous system for our planet and to the development of further value added processing. We believe that both are essential pillars for integrating environmental and geospatial matters into future internet applications.

Acknowledgments

This work was partially funded by the exploratory research project “Next Generation Digital Earth: Engaging the citizens in forest fire risk and impact assessment” from the Institute for Environment and Sustainability of the European Commission—Joint Research Centre and under the European Community’s Seventh Framework Programme (FP7/2007-2013), Grant Agreement No. 284898 (ENVIROFI project). Joint research on this topic between the Joint Research Center and the University of Muenster was initiated at the Vespucci Summer Institute on Volunteered Geographic Information in 2011 [51].

References

  1. Schade, S. Ontology-Driven Translation of Geospatial Data; AKA (Akademische Verlagsgesellschaft): Heidelberg, Germany, 2010. [Google Scholar]
  2. Sheth, A.; Henson, C.; Sahoo, S.S. Semantic Sensor Web. IEEE Internet Comput. 2008, 12, 78–83. [Google Scholar]
  3. Janowicz, K.; Bröring, A.; Stasch, C.; Schade, S.; Everding, T.; Llaves, A. A RESTful proxy and data model for linked sensor data. Int. J. Digit. Earth 2011. [Google Scholar] [CrossRef]
  4. Bröring, A.; Echterhoff, J.; Jirka, S.; Simonis, I.; Everding, T.; Stasch, C.; Liang, S.; Lemmens, R. New generation sensor web enablement. Sensors 2011, 11, 2652–2699. [Google Scholar] [CrossRef]
  5. Maué, P.; Stasch, C.; Athanasopoulos, G.; Gerharz, L.E. Athanasopoulos, G.; Gerharz, L.E. Geospatial standards for web-enabled environmental models. Int. J. Spat. Data Infrastruct. Res. 2011, 6, 145–167. [Google Scholar]
  6. Janowicz, K.; Compton, M. The stimulus-sensor-observation ontology design pattern and its integration into the semantic sensor network ontology. In Proceedings of 3rd International Workshop on Semantic Sensor Networks 2010 (SSN10), Shanghai, China, 7-11 November 2010.
  7. Goodchild, M.F. Citizens as voluntary sensors: spatial data infrastructure in the world of Web 2. 0. Int.J. Spat. Data Infrastruct. Res. 2007, 2, 24–32. [Google Scholar]
  8. The official Eye on Earth Web Portal. Available online: http://www.eyeonearth.eu (accessed on 13 June 2012).
  9. Official Web Page of the Geo-Wiki Project. Available online: http://www.geo-wiki.org (accessed on 13 June 2012).
  10. De Longueville, B.; Luraschi, G.; Smits, P.; Peedell, S.; de Groeve, T. Citizens as sensors for natural hazards: A VGI integration workflow. Can. Inst. Geomat. 2010, 64, 41–59. [Google Scholar]
  11. De Longueville, B.; Schade, S.; Ostlaender, N.; Whitmore, C. Digital earth’s nervous system for crisis events: Real-time sensor web enablement of volunteered geographic information. Int. J. Digit. Earth 2010, 3, 242–259. [Google Scholar]
  12. Schade, S.; Ostermann, F.; Spinsanti, L. Functional integration for the observation web. In Proceedings of International Joint Conference on Knowledge Discovery, Knowledge Engineering and Knowledge Management (KEOD 2011), Paris, France, 26-29 October 2011.
  13. Ehrich, H.D.; Mahr, B. Fundamentals of Algebraic Specification 1: Equation and Initial Semantics; Springer: Amsterdam, the Netherlands, 1985. [Google Scholar]
  14. Jones, P.S. Haskell 98 Language and Libraries-The Revised Report; Cambridge University Press: New York, NY, USA, 2003. [Google Scholar]
  15. Jiang, M.; McGill, W.L. Human-centered sensing for crisis response and management analysis campaigns. In Proceedings of 7th International Conference on Information Systems for Crisis Response and Management (ISCRAM), Seattle, WA, USA, 2-5 May 2010.
  16. Starbird, K.; Stamberger, J. Tweak the tweet: Leveraging proliferation with a prescriptive syntax to support citizen reporting. In Proceedings of 7th International Conference on Information Systems for Crisis Response and Management (ISCRAM), Seattle, WA, USA, 2-5 May 2010.
  17. Schade, S.; Díaz, L.; Ostermann, F.; Spinsanti, L.; Luraschi, G.; Cox, S.; Nuñez, M.; de Longueville, B. Citizen-based sensing of crisis events: Sensor web enablement for Volunteered Geographic Information. Appl. Geomat. 2011. [Google Scholar] [CrossRef]
  18. Aberer, K.; Hauswirth, M.; Salehi, A. A middleware for fast and flexible sensor network deployment. In Proceedings of32nd International Conference on Very Large Data Bases (VLDB), Seoul, Korea, 12-15 September 2006.
  19. Bröring, A.; Below, T.; Foerster, T. Declarative sensor interface descriptors for the sensor web. In Proceedings of 1st International Workshop on Pervasive Web Mapping, Geoprocessing and Services (WebMGS), Como, Italy, 26-27 August 2010.
  20. Ostermann, F.O.; Spinsanti, L. A conceptual workflow for automatically assessing the quality of Volunteered Geographic Information for crisis management. In Proceedings of 14th AGILE International Conference on Geographic Information Science, Utrecht, the Netherlands, 10-14 May 2010.
  21. Spinsanti, L.; Ostermann, F.O. Retrieval of Volunteered Geographic Information for forest fires. In Proceedings of 2nd Italian Information Retrieval (IIR) Workshop, Milan, Italy, 27-28 January 2011.
  22. Núñez-Redó, M.; Díaz, L.; Gil, J.; González, D.; Huerta, J. Discovery and integration of web 2.0 content into geospatial information infrastructures: A use case in wild fire monitoring. In Proceedings of International Cross Domain Conference on Availability, Reliability and Security for Business, Enterprise and Health Information Systems (ARES), Vienna, Austria, 22-26 August 2011.
  23. The Official Web Page of the SaTScan Project. Available online: http://www.satscan.org (accessed on 13 June 2012).
  24. De la Beaujardiere, J. OpenGIS® Web Map Server Implementation Specification, Version 1.3.0.; OGC Implementation Standard 06-042; Open Geospatial Consortium: Wayland, MA, USA, 2006. [Google Scholar]
  25. Vretanos, P.A. OpenGIS Web Feature Service 2.0 Interface Standard, Version 2.0.0.; OGC Implementation Specification 09-025r1; Open Geospatial Consortium: Wayland, MA, USA, 2010. [Google Scholar]
  26. Schut, P. OGC Web Processing Service (WPS) version 1.0.0.; OGC Standard Document; Open Geospatial Consortium: Wayland, MA, USA, 2007. [Google Scholar]
  27. The Official EFFIS Web Portal. Available online: http://effis.jrc.ec.europa.eu (accessed on 13 June 2012).
  28. Craglia, M.; Osternamm, F.; Spinsanti, L. Digital earth from vision to practice: Making sense of citizen generated content. Int. J. Digit. Earth 2012, in press. [Google Scholar]
  29. Guarino, N. Formal ontology in information systems. In Proceedings of International Conference on Formal Ontology in Information Systems (FOIS), Trento, Italy, 6-8 June 1998.
  30. Masolo, C.; Borgo, S.; Gangemi, A.; Guarino, N.; Oltramari, A. WonderWeb Deliverable D18: Ontology Library; Laboratory for Applied Ontology-ISTC-CNR: Trento, Italy, 2003. [Google Scholar]
  31. Latest Version of DOLCE Ultra Lite. Available online: http://www.ontologydesignpatterns.org/ont/dul/DUL.owl (accessed on 13 June 2012).
  32. Latest Version of the SSN Skeleton ontology. Available online: http://www.w3.org/2005/ Incubator/ssn/wiki/ SSN_Skeleton (accessed on 13 June 2012).
  33. Stevens, S.S. On the theory of measurement. Science 1946, 103, 677–680. [Google Scholar]
  34. Sommerville, I. Software Engineering; Pearson Education Limited: London, UK, 2007. [Google Scholar]
  35. Baader, F.; Calvanese, D.; McGuinness, D. The Description Logic Handbook: Theory, Implementation, and Applications; Cambridge University Press: New York, NY, USA, 2003. [Google Scholar]
  36. Russell, S.; Norvig, P. Artificial Intelligence-A Modern Approach, 3rd ed; Prentice Hall: Upper Saddle River, NJ, USA, 2009. [Google Scholar]
  37. Agrawal, R.; Ailamaki, A.; Bernstein, P.A.; Brewer, E.A.; Carey, M.J.; Chaudhuri, S.; Doan, A.; Florescu, D.; Franklin, M.J.; et al. The Claremont report on database research. ACM SIGMOD Rec. 2008, 37, 9–19. [Google Scholar] [CrossRef]
  38. Kuhn, W.; Frank, A.U. A formalization of metaphors and image-schemas in user interfaces. In Cognitive and Linguistic Aspects of Geographic Space, NATO ASI Series; Kluwer Academic Publishers: Dordrecht, the Netherlands, 1991. [Google Scholar]
  39. Car, A.; Frank, A.U. Formalization of conceptual models for GIS using gofer. Comput. Environ. Urban Syst. 1995, 19, 89–98. [Google Scholar] [CrossRef]
  40. Goodchild, M.F. Measurement-based GIS. In Proceedings of International Symposium on Spatial Data Quality, Hong Kong, China, 18-20 July 1999.
  41. Schade, S.; Sahlmann, A.; Lutz, M.; Probst, F.; Kuhn, W. Comparing approaches for semantic service description and matchmaking. In Proceedings of3rd International Conference on Ontologies, DataBases, and Applications of Semantics for Large Scale Information Systems (ODBASE), Larnaca, Cyprus, 25-29 October 2004.
  42. Frank, A. Towards a mathematical theory for snapshot and temporal formal ontologies. In Proceedings ofInternational Conference on Geographic Information Science (AGILE), Aalborg, Denmark, 13-17 August 2007.
  43. Kuhn, W. An image-schematic account of spatial categories. In Proceedings of8th International Conference on Spatial Information Theory, COSIT, Melbourne, Australia, 19-23 September 2007.
  44. Kuhn, W. A functional ontology of observation and measurement. In Proceedings ofThird International Conference on GeoSpatial Semantics (GeoS), Mexico City, Mexico, 3-4 December 2009.
  45. Marghany, M.; Hashim, M. Comparative algorithms for oil spill detection from multi mode RADARSAT-1 SAR satellite data. In Proceedings of International Conference on Computational Science and its Applications, Santander, Spain, 20-23 January 2011.
  46. The Official Web Page of the Crisis Commons Project. Available online: http://crisiscommons.org/ (accessed on 13 June 2012).
  47. The Official Web Page of the Oil Reporter Project. Available online: http://oilreporter.com (accessed on 13 June 2012).
  48. The Official Web Page of the UK Snow Map Project. Available online: http://uksnowmap.com (accessed on 13 June 2012).
  49. Navratil, G.; Karimipour, F.; Frank, A.U. Lifting imprecise values. In Proceedings of 11th International Conference on Geographic Information Science (AGILE), Girona, Spain, 11-12 September 2008.
  50. Spinsanti, L.; Ostermann, F.O. Validation and relevance assessment of Volunteered Geographic Information in the case of forest fires. In Proceedings of 2nd International Workshop on Validation Of Geo-Information Products For Crisis Management (VALgEO), Ispra, Italy, 11-13 October 2010.
  51. The Official Web Page of the Vespucci Initiative, Section on the 9th Summer Institute on Geographic Information Science. Available online: http://vespucci.org/history/2011#VGI (accessed on 13 June 2012).

