Article

Collaborative Open Source Geospatial Tools and Maps Supporting the Response Planning to Disastrous Earthquake Events

1
UTMEA Technical Unit, Research Centre Casaccia, ENEA-National Agency for New Technologies, Energy and Sustainable Economic Development, Rome 00123, Italy
2
UTTP Technical Unit, Research Centre Portici, ENEA-National Agency for New Technologies, Energy and Sustainable Economic Development, Portici (Naples) 80055, Italy
3
Consorzio T.R.E.-Tecnologie per il Recupero Edilizio, Naples 80125, Italy
*
Author to whom correspondence should be addressed.
Future Internet 2012, 4(2), 451-468; https://doi.org/10.3390/fi4020451
Submission received: 29 December 2011 / Revised: 20 March 2012 / Accepted: 27 April 2012 / Published: 7 May 2012
(This article belongs to the Special Issue NeoGeography and WikiPlanning)

Abstract

:
The latest improvements in geo-informatics offer new opportunities in a wide range of territorial and environmental applications. In this general framework, a relevant issue is represented by earthquake early warning and emergency management. This research work presents the investigation and development of a simple and innovative geospatial methodology and related collaborative open source geospatial tools for predicting and mapping the vulnerability to seismic hazard in order to support the response planning to disastrous events. The proposed geospatial methodology and tools have been integrated into an open source collaborative GIS system, designed and developed as an integrated component of an earthquake early warning and emergency management system.

Graphical Abstract

1. Introduction

In the past few years, the human population has experienced a series of natural disasters such as hurricanes, tsunamis, earthquakes (see, for example Aquila (IT) earthquake in 2009, Tohoku (Japan) tsunami in 2011, Turkey earthquake in 2011, etc.), floods, fires, landslides among others, that have in many cases overwhelmed the responding and recovering capacities. With modern geospatial technologies such as satellite imaging and geographical services (e.g., Google Earth®) it has been possible to see through Internet the magnitude of these natural disasters and how breakdown can often be complete and pervasive in an era of technological and information abundance [1].
Indeed, these disastrous events, have also drawn the attention of all types of people—from the scientific community and public decision makers, to stakeholders and common citizens—to the importance of geographical information and technology in all aspects of disaster management (DM), i.e. from planning for disastrous events that may have lead, through response and recovery, to the mitigation of these events, but also to the problems that can arise in the immediate aftermath of a disastrous event if adequate geospatial information are not available for damage assessment and response planning. Just as examples, Earth-observation satellites might not pass over the affected area for several days and the images might be obscured by clouds and/or smoke in case of fires. Further, the lack of power, internet connections or computer hardware and software might prevent the use of digital data, tools and services relevant to emergency management or other impediments to their effective utilization, such as the lack of knowledge about: what data and tools exist and where; restrictions on their use; lack of training on the part of users, and so on [2].
Modern approaches to emergency management and response involve efforts to reduce the vulnerability to hazards; to diminish the impact of disasters; and to prepare for, respond to, and recover from those that occur [1]. Geospatial data and tools have the potential to contribute to all these emergency tasks [3]. Decision makers and responders, who know where disaster impacts are greatest, where critical assets are located or where infrastructure has likely been damaged, will be able to act more quickly and effectively, especially immediately after the event [4]. It is possible to imagine the chaos if first responders are entirely unfamiliar with an area and have none of the geospatial information—maps, GPS coordinates, images—essential to effective emergency management.
Currently, a crucial contribution to the response planning can also derive from Volunteered Geographical Information (VGI) created by amateur citizens [5], who, familiar with the affected area, report the status of this area and aftermath disaster event through its spatial coordinates and contribute information by using mobile devices (such as smartphones, tablets or cameras enabled with GPS) [6] or ad hoc Web-GIS services [7]. VGI is timely and at local scale, properties that are needed in the disaster early warning and post event emergency management. The added value of VGI in disaster emergency management situations, the enabling technologies, collectively termed Web 2.0, and ad hoc geospatial tools to develop and diffuse, collect, synthesize, verify, and redistribute this information have been extensively discussed and investigated by the scientific and technological communities (see, for example [2,8,9,10,11] among others).
Over the past few decades, specific needs related to geospatial technology, data infrastructure and tools for supporting disaster early warning and emergency management tasks, especially for disastrous earthquake events, have only been addressed in a few cases [12]. Our focus is on earthquake early warning systems (EWS), their architectures and functionalities. The main components of an earthquake EWS are a central unit (operating centre) and a seismic sensor network connected by a high-speed communication network. The kernel of the operating center is generally a data mining and decision support system (DSS) that processes the earthquake magnitude and epicenter information and enables the operators to make decisions and to disseminate EW [13]. The generated alarm is used to evacuate buildings, shut-down critical systems (e.g., nuclear and chemical reactors), put vulnerable machines and industrial robots into a safe position, stop high-speed trains, activate structural control systems and so on [14]. Immediately following an earthquake, the operating center also has to support emergency response and rescue operations, but only using earthquake magnitude and epicenter information might not be sufficient. In fact, the damage pattern is not a simple function of these two parameters alone, and more detailed information must be provided to properly assess the situation and adequately plan and coordinate emergency response. Although an earthquake has one magnitude and one epicenter, it produces a range of ground shaking levels at sites throughout the region depending on distance from the source, rock and soil conditions at sites and variations in the propagation of seismic waves due to complexities in the structure of the Earth’s crust. Ground shaking maps can thus be generated by using specific geospatial datasets and advanced spatial analysis tools [15]. They can also be used for emergency response tasks and for public information through the media. For example, maps of shaking intensity can be combined with databases of inventories of buildings and lifelines to rapidly produce maps of estimated damage. Therefore, geospatial data and tools are needed to support quick analysis of the situation during and immediately following an earthquake and facilitate critical decision making processes.
Recently, a number of specific applications for rapidly assessing the extent of shaking and potential damage following an earthquake have been developed. USGS-ShakeMaps [16] and ElarmS [17] are two significant applications among others.
SHAKEMAP application rapidly and automatically generates shaking and intensity maps, combining instrumental measurements of shaking with information about local geology and earthquake location and magnitude. This application displays its results through a variety of map formats. These maps can thus become tools for earthquake early warning and emergency response systems.
ELARMS (Earthquake Alarm System) application, developed by the University of California Berkeley, provides the prediction of the distribution of peak ground shaking across the region affected by an earthquake before the beginning of significant ground motion. A map of predicted ground shaking is thus generated, also using datasets of past and probable future earthquakes. More specifically, ELARMS is a suite of algorithms designed to: (1) rapidly detect the initiation of an earthquake; (2) determine the size (magnitude) and location of the event; (3) predict the peak ground motion expected in the region around the event; and (4) issue a warning to people in locations that may expect significant ground motion. The algorithms use data from regional broadband seismic networks.
Due to the complexity of earthquake phenomena, the spatiotemporal nature of the seismic data and the very large amount of data collected by seismic monitoring networks, up-to-date earthquake EWS have been evolving towards more complex and integrated architectures [18]. In particular, these architectures are composed of integrated so-called seismic data management and mining systems (SDMMSs) [18] and Geographical Information Systems (GISs). More specifically, they consist of the following modules: (1) GIS subsystem for seismic early warning, risk assessment and emergency management tasks; (2) knowledge discovery database (KDD) and data warehouse (DW) subsystems for discovering decision-relevant knowledge from the very large amount of available seismic parameters observations; (3) spatiotemporal modeling subsystems for simulating the seismic activities; (4) specialized geo-visualization modules for supporting the operator in the process of deciding whether a warning has to be generated. Most of these prototypes earthquake EWS currently available, develop one or more of the components above described for predicting, managing, mining and visualizing (see [16,17,19,20,21], among others).
In this research work, we have designed and developed a web-oriented GIS application for predicting and mapping seismic vulnerability, assessing potential impacts of possible seismic events and to support the disaster response planning. This GIS application has been designed as an integrated component of the data-processing unit of the earthquake early warning system developed in the national SIT_MEW Project (http://www.consorziotre.com/index.php?option=com_content&view= article&id=73&Itemid=62). The novel SIT_MEW EWS architecture combines our GIS system with an advanced SDMMS. The proposed GIS subsystem for earthquake EWSs includes a geospatial database system; a local GIS application for predicting and mapping the seismic hazard vulnerability of regional areas; a WebGIS module for collecting, synthesizing and sharing the geo-information among private and public stakeholders, emergency managers and common citizens involved in disaster response [22].

2. Materials and Methods
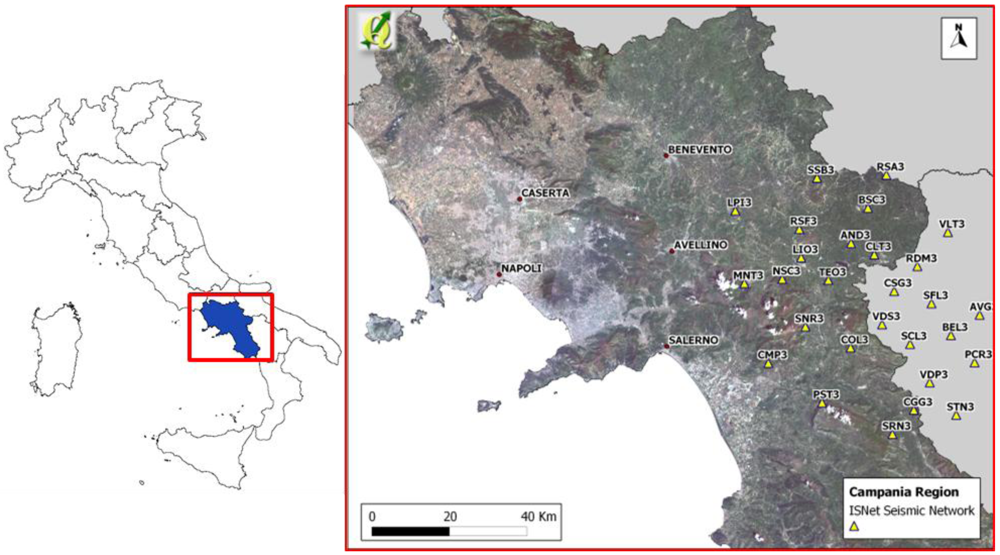
2.1. The Study Case

The presented research work focuses on the investigation and development of an innovative methodology for mapping vulnerability to seismic hazard at a regional scale by using collaborative geospatial methods and ad hoc open source tools. The study area is a region of southern Italy (Campania, Figure 1), historically characterized by high intensity seismic events (between 6.5 and 7 Richter magnitude). For this area, seismic structural damage and loss estimation maps at regional scale have been generated by using advanced spatial analysis and geo-processing procedures, structural inventories, motion-damage relationships and scenarios modeling.
An extensive seismic sensors network is located within the study area (ISNet, Irpinia Seismic Network, http://isnet.amracenter.com/) supported by an integrated platform of broadband telecommunications. The sensor network is deployed around the fault zone that goes across the Appennini Mountains next to Irpinia. This area was struck hard by the disastrous earthquake of 23 November 1980: measuring 6.89 on the Richter Scale, the quake killed 2914 people, injured more than 80,000 and left 280,000 homeless.
The seismic alert and emergency management includes by three sequential phases: early warning, near early warning, post-event. The early warning phase occurs 10–20 s after the main shock. In this short time interval, an EWS should predict the ground motion intensity, evaluate the epicenter and alert of a dangerous seismic event. The near early warning phase occurs 100–200 s after the main shock. During this time interval, firstly a ground motion map (shake map) is produced and, subsequently, a more detailed map (scenario) is produced based on simplified models of source/propagation and representing a simulation of expected damages. These maps assist in locating the area affected by the seismic event and supporting first search and rescue operations. The post-event phase consists of the response planning and emergency management tasks.
Figure 1. Study area and geographic location of Irpinia Seismic Network (ISNet).
Futureinternet 04 00451 g001

2.2. The Methodology

The first information available immediately after a significant earthquake consists of the seismic event magnitude and the epicenter.. Through spatial analysis, geo-processing and visualization tools, this information together with spatial parameters such as rock and soil conditions of the affected area, distance from the epicenter and variations in the propagation of seismic waves can be processed for producing ground shaking maps overlaid with inventories of critical facilities (e.g., hospitals, schools, police and fire stations, etc.), highways and bridges, and vulnerable structures can effectively support the response planning. [13]. Then, decision makers and responders who know where impacts of the occurred seismic event can be greatest, where structure and infrastructure have likely been damaged can act more quickly and effectively, immediately after the seismic event. Thus, predicting and mapping the seismic vulnerability of an area, assessing potential impacts of a seismic event in that area can play a crucial role in the emergency management [23].
In this research work, geospatial decision support tools that assimilate model predictions and data for mapping vulnerability to catastrophic earthquakes, scenario testing, disaster planning are investigated and developed. In particular, a simple methodology for mapping seismic vulnerability of an extensive area is investigated and related spatial resolution issues are addressed. Actually, seismic vulnerability analysis is performed at regional scale while commonly it is at local scale. The resolution issue is addressed by identifying potential earthquake sources in the interest regional area. Potential earthquake sources can be selected within the deployment area of a seismic monitoring network or by parametric catalogue of disastrous earthquakes in regional area (the catalogue used for the study case was retrieved from INGV—Italian National Institute of Geophysics and Volcanology, http://www.ingv.it/eng). The following steps of the investigated procedure are basically:
  • estimate the earthquake ground motion attenuation with the distance from the seismic epicenter;
  • evaluate local site effects of soil amplification;
  • estimate the damages to the facilities inventories.
Local geologic deposits are well known for their capabilities to modify the characteristics of seismic motions and influence the amount of damage to buildings [24]. Then, the surface ground motion of earthquakes is heavily influenced by the subsurface ground conditions, especially in areas covered by thick sediments. In order to evaluate the distribution of earthquake motion across a wide area, it is necessary to evaluate the difference in the subsurface amplification, site by site. A geology map has been used to classify the study area at regional scale (as depicted in Figure 1) on the basis of different litho-technical types. Slope and hillshade maps, topographic profiles and curvature maps have been generated by using a Digital Terrain Model (DTM) of the study area. Thus, specific indicators of local site conditions have been extracted by these spatial layers such as the distribution of unconsolidated, youngest sedimentary covers that can often be correlated to areas showing less than 10° slope gradient and no curvature. DTM and topographic profiles of the interest area allow identifying depressions covered by recently formed sediments, which are related to relatively higher groundwater surface. These areas have frequently shown the highest damage intensities in case of seismic events.
In order to quantify the effects of local soil conditions on the earthquake ground motion amplification, empirical multiplication factors are generally used. So, a selected ground motion parameter such as Peak Ground Acceleration (PGA) or Peak Ground Velocity (PGV) at the bedrock level is multiplied by an empirically-derived factor [25]. Indeed, the earthquake motion amplification is one of the most difficult site effects to be modeled. A commonly used approach to micro-zonation is to determine empirical site-amplification factors for a large set of sites by regression analysis of earthquake data, correlating them to different geotechnical parameters of the site [25]. Several multiplication factors have been identified for different regional areas based on statistical analysis of observed strong ground motion data. These factors are derived by input PGA or PGV values, by bedrock depth and average shear wave velocity of the soil deposit [26,27]. The investigated geospatial methodology and tools are able to produce PGA maps, vulnerability maps and expected damage scenarios. In this way, it is possible to have a preliminary assessment of the expected damages after a seismic event. The seismic vulnerability is expressed in terms of macroseismic intensity (IMCS). In particular, PGA and IMCS values [28,29] are correlated by using the law proposed by Sabetta and Pugliese [30]. In order to estimate the surface ground shaking in the interest area and calculate the PGA value, the following attenuation relationship [30] is used:
Futureinternet 04 00451 i001
where M is the local magnitude, R the distance from the epicenter and σ the standard deviation of log PGA. The variables S1 and S2 refer to site classification and take the value of 1 for shallow and deep alluvium sites, and zero otherwise. The analyses do not take site effects into account and the PGA has been calculated considering bed rock condition. Sabetta and Pugliese [30] also provide an exhaustive description of the other parameters considered in the (1) equation. To convert PGA to IMCS, the following equation [28] is used:
Futureinternet 04 00451 i002
The PGA map of seismic attenuation is obtained by IDW (Inverse Distance Weighting) interpolation. This step provides numerical modeling of the various input data where each pixel in the digital map may assume values in range 0 and 1, that represent respectively the minimum and maximum ground shaking impact.

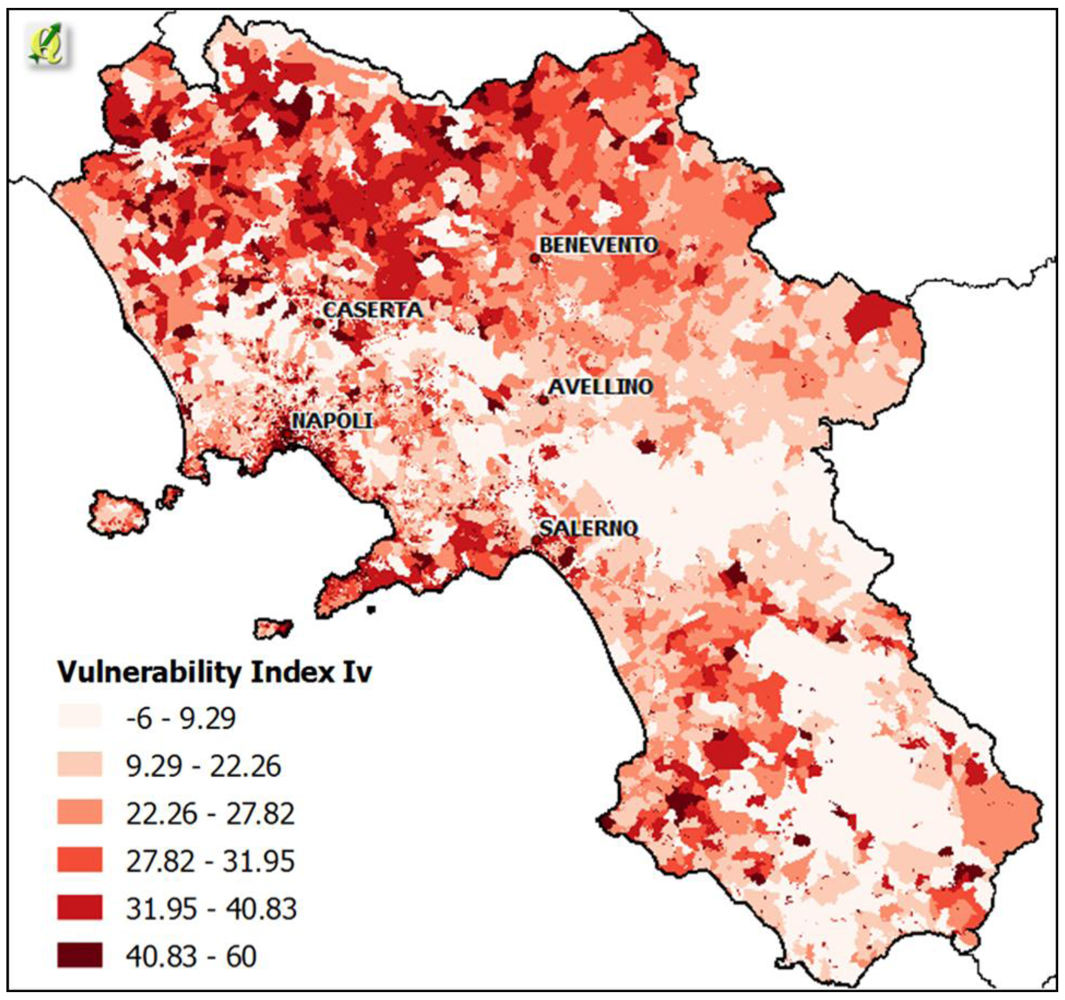
2.3. Mapping Structures Vulnerability

Once the seismic hazard due to ground shaking and local site effects are adequately characterized, the next step is the damage estimation to structural facilities. To evaluate the seismic vulnerability of structures, a detailed buildings inventory of the interest regional area is needed and well-defined relationships between earthquake motion (including local site effects) and both structural and non-structural damage have to be identified. Vulnerability estimation allows measuring the structures and infrastructures susceptibility to be damaged by a seismic event. For the study area, buildings inventory has been derived [22] by institutional ISTAT Census dataset (Italian National Institute of Statistics. http://www.istat.it/en/). Aggregated data related to buildings such as built-up density, structural typology (2 classes: Masonry or Reinforced Concrete), age of construction (7 classes), number of storeys (4 classes), that can be derived by buildings datasets by using geo-processing and spatial analysis tools, can be attributed to census sections as spatial unit. Thus, the vulnerability index (IV) for each census section can be calculated by using the Lagomarsino and Giovinazzi method [31].
According to the proposed approach, buildings can basically be classified (Table 1) in Masonry (M) or Reinforced Concrete (RC). Buildings attributes, generally available in a common buildings inventory, such as the number of floors and period of construction, can be used to correct the vulnerability index for each category and considered as behavior modifiers (Table 2) [32].
Table 1. Vulnerability indices for building typologies and construction age for the study area (Campania, Southern Italy).
Construction ageIV
MasonryRC
1Before 191950-
21919–194540-
31946–19613020
41962–19713020
51972–19812020
61982–1991200
7After 1991200
Table 2. Vulnerability index modifiers depending of number of storeys and construction age.
Age<19191919–19451946–19611962–19711972–19811982–1991>1991
No. of storeys
100000–6–6
2+5+5+5+5+500
3+5+5+5+5+500
>4+10+10+10+10+10+6+6
The listed modifiers can be used to increase or decrease the IV index, depending on the characteristics of the buildings within the area considered. However, vulnerability index is a building intrinsic value. Census sections might therefore contain buildings with different vulnerability indices. In this case, IV can be calculated for each census section as weighted average of the different building indices. The resulting map is depicted in Figure 2.
Figure 2. Vulnerability Index Map (IV) for the study area (Campania). The values are shown for census sections.
Futureinternet 04 00451 g002

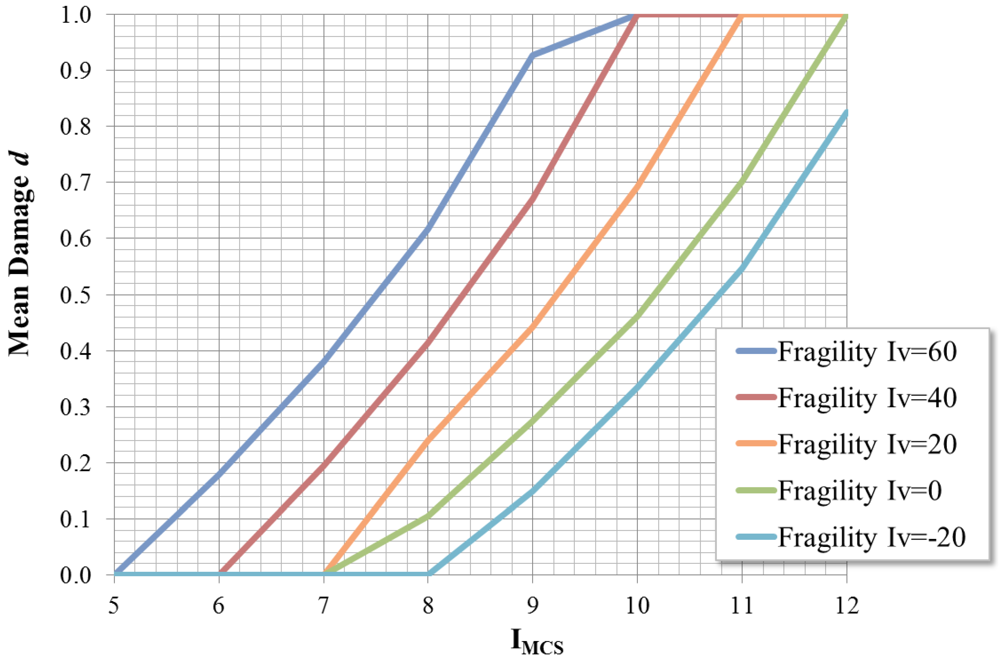
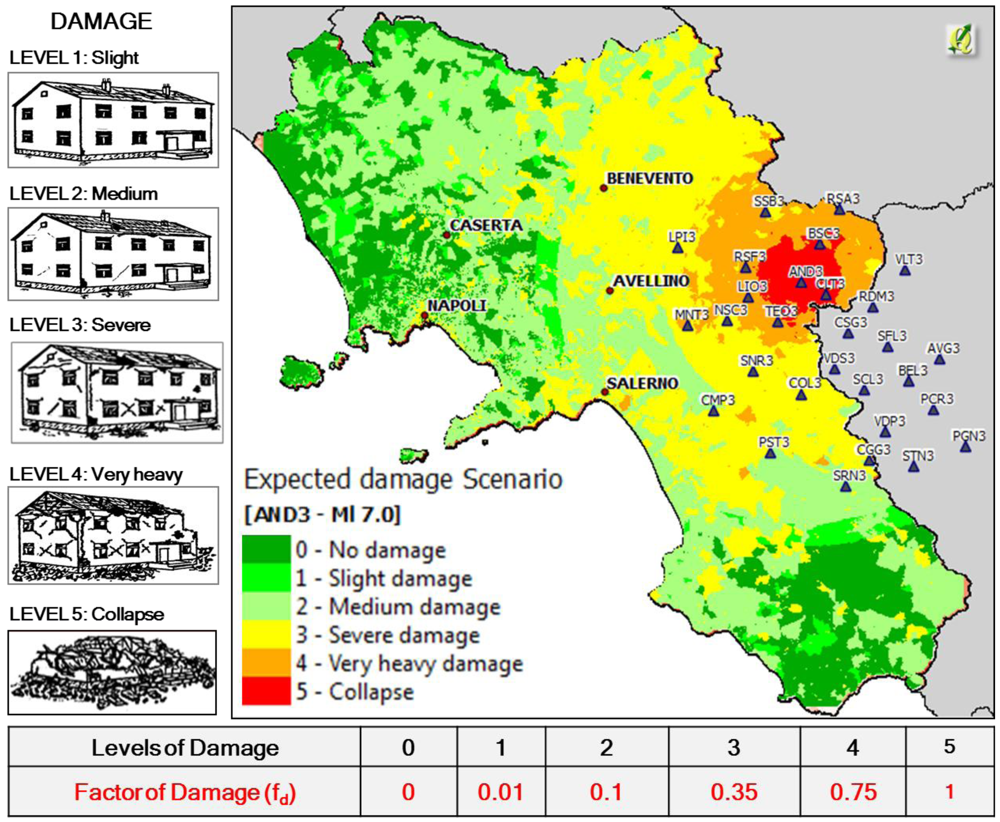
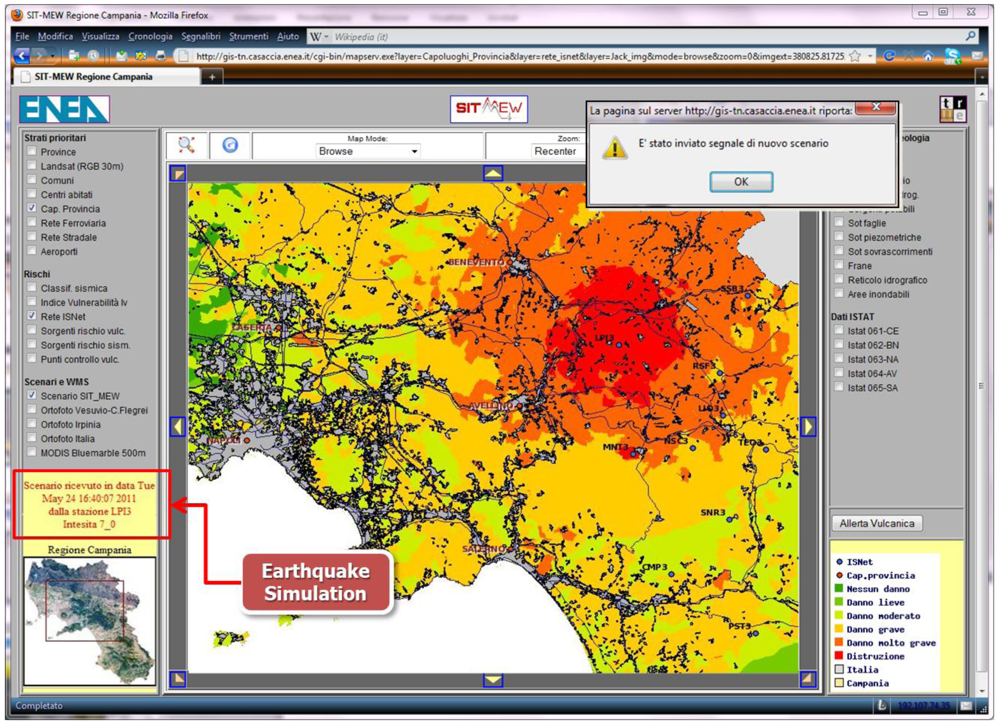
2.4. Mapping Expected Damage Scenarios

Despite the obvious approximations, seismic vulnerability assessment by using the proposed approach can be considered a simple and prompt application, especially for large areas as this study area, the Campania Region. After converting each vector map in raster maps (resolution 50 meters), thematic PGA, IMCS and IV maps can be overlaid to institutional census data and the damage d can be calculated [31] as:
Futureinternet 04 00451 i003
The formula (3) expresses the relationships between IMCS and damage d, according to the trend of fragility curves [31] depicted in Figure 3. Therefore, according to a qualitative point of view, it is possible to establish a relation between IMCS and d values by classifying the mean damage into five different levels (see the left side of Figure 4).
Then, the damage can be expressed by an a-dimensional parameter fd (ranging between 0 and 1), in order to obtain a correspondence (see under-side in Figure 4) between the levels of damage and the values of d calculated by the formula (3). Expected damage maps can be dynamically generated, immediately following an earthquake by using the proposed methodology and the available epicenter coordinates and local magnitude (LM) information (Figure 4). System processing time of these maps has been estimated within 20 s.
Figure 3. Fragility curves and vulnerability index IV: relationship expressed in terms of mean damage [31].
Futureinternet 04 00451 g003
Figure 4. Example of expected damage scenario. The map is categorized considering six different levels of damage as described below (level representation shown on the left).
Futureinternet 04 00451 g004

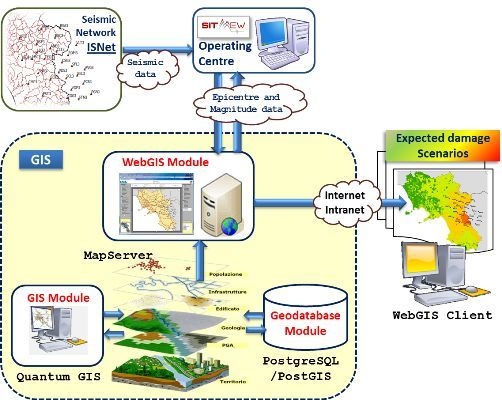
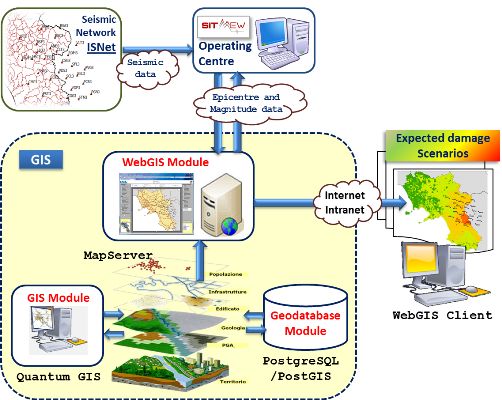
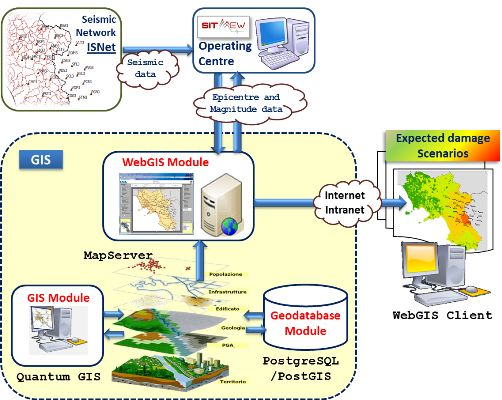
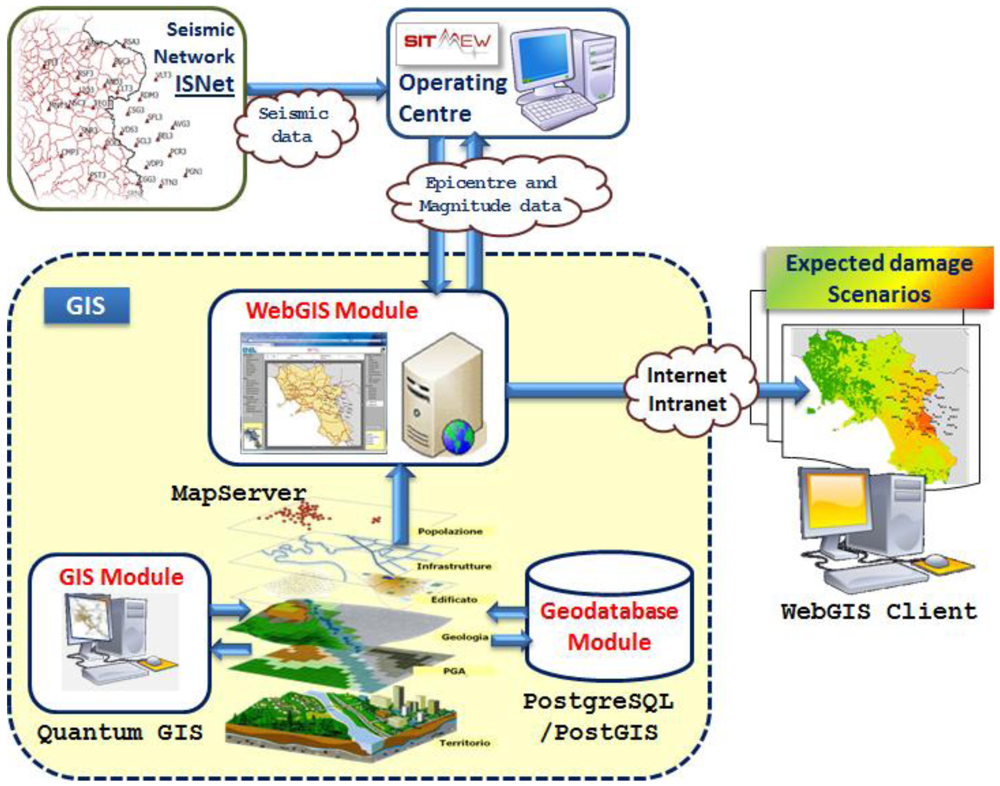
3. The WebGIS System

The geospatial tools for predicting and mapping the vulnerability of a large area to seismic hazard, and assessing the potential impacts of a possible seismic event, in order to support the response planning have been developed as a Web-GIS subsystem of an earthquake EWS, designed and developed into national SIT_MEW Project framework. The data-processing unit architecture of the developed earthquake EWS integrated several subsystems such as knowledge discovery database (KDD) and data warehouse (DW) subsystems for discovering decision-relevant knowledge from the very large amount of available seismic parameters observations [14]; temporal modeling subsystems for simulating the seismic activities; specialized visualization modules for supporting the operator in the process of deciding whether a warning has to be generated and finally the proposed open source Web-GIS subsystem—geospatial data and models, and collaborative tools—for seismic hazard assessment and emergency management tasks.
A task of the operating centre is the acquisition of data from different sources and their integration to provide—via a broadband network—information for executing security measures. Geospatial data and ad hoc tools play a fundamental role in earthquake early warning and post-event emergency management: to this purpose, the proposed GIS subsystem has been integrated into the EWS architecture as geospatial interface of the Operating Center (OC). Consequently, basic spatial information and thematic maps are stored and managed in a geospatial database specifically implemented so that it is possible to display and query the data by means of a map viewer.
The geospatial analysis tasks are fairly simplified and suitable for use with regional spatially-distributed data, which can often be incomplete in the amount and type of available information. The proposed Web-GIS subsystem architecture, based on free/open source GIS technology (FOSS) [33] includes several modules (Figure 5) such as:
  • Geodatabase Module (by using PostgreSQL/PostGIS);
  • GIS Module (by using Quantum GIS);
  • WebGIS Module (by using MapServer).
Figure 5. Geographical Information System (GIS) logical architecture: GIS modules are represented inside the dashed box, to differentiate them from other subsystems developed within the SIT_MEW Project.
Futureinternet 04 00451 g005
The Geodatabase Module has been designed to manage and integrate geospatial data provided as input to the system, including the alphanumeric data related to seismic events (e.g., magnitude and epicenter, recorded and processed by the operating center) and specific geospatial data related to the area of interest (geology, vulnerability maps, urbanized areas, census, etc.). The FOSS technologies chosen to implement this module were PostgreSQL/PostGIS (http://www.postgresql.org and http://postgis.refractions.net/).
Data collected in Geodatabase (UTM-WGS84 reference system) were:
  • Basic GIS Layers (Italian DBPrior10K: Administrative boundaries, road network, railways, hydrograph, etc.);
  • Thematic Maps (hydrology, geomorphology, seismic classification, etc.);
  • 1:25.000 Cartography;
  • Census data (ISTAT);
  • Digital Terrain Model (DTM, 20 m ground spacing);
  • Geographic location and data of ISNet seismic sensors;
  • PGA (Peak Ground Acceleration) distribution maps;
  • Data from parametric catalogue of damaging earthquakes in Italy (INGV).
These spatial data and thematic maps have been used for the spatial analysis tasks carried out through the GIS Module. This module is devoted to process geospatial data collected in Geodatabase. By using spatial analysis procedures and geo-processing tools, this module provides a complete and up-to-date description of the study area and, as final result, the expected damage maps. The software package chosen to implement the GIS Module was QuantumGIS (http://www.qgis.org/). This solution has been adopted after a comparative analysis between the main FOSS desktop GIS platform available [34]. This comparison was based on main functionalities, technology, geo-processing capabilities and interoperability with the other FOSS packages used for the modules Geodatabase and WebGIS.
Finally, the WebGIS Module was implemented by using the FOSS UNM Mapserver (http://mapserver.org/). The primary goal of the WebGIS Module is to make geographic data and thematic maps available to specific end-users and, potentially, to the public. The application allows the end-user to view spatial data within a web browser, without specific GIS Desktop software. This Module provides interactive query capabilities and integrates the GIS solutions with other technologies and has been developed on the Internet according to server-side or client-side applications. Several Web-GIS packages are available at present. We focused our attention on the FOSS package MapServer mainly because it represents a solution widely adopted, especially when highly customized applications are needed.
Thus, the WebGIS Module allows to visualize and analyze the geo-spatial data and thematic maps stored in the system by means of basic functionalities such as: description and characterization of the study area, production of thematic maps (e.g., expected damage) to support the management of near-EW and post-event phases, consultation via Intranet/Internet to data and maps (basic geographic layers, geology, shaking maps, urban areas, census data, PGA and IV maps, Scenarios, etc.). WebGIS principally supports a real-time monitoring of the vulnerability of structures and infrastructures within the area of interest, providing (Figure 6) a preliminary assessment of the expected damages on structures (buildings) and infrastructures (road network) a few seconds after the main shock.
Figure 6. WebGIS visualization of expected damage map (Earthquake simulation: epicenter in Lapio, LM 7.0).
Futureinternet 04 00451 g006

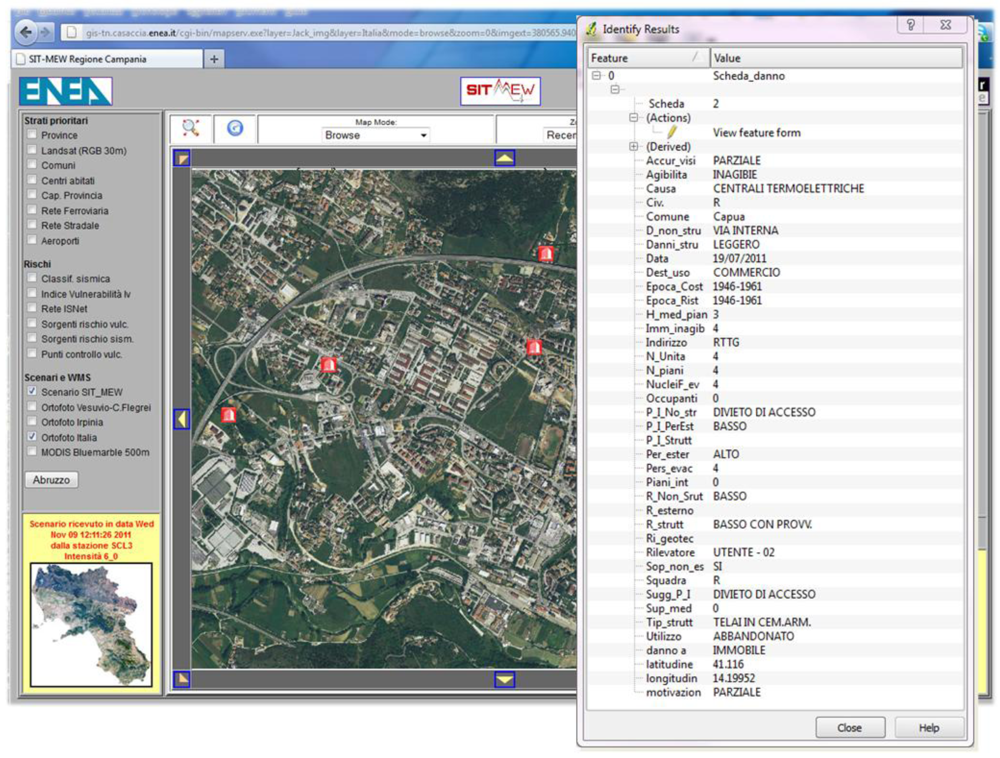
3.1. The Post-Event Management

As previously stated, many of the calamitous events that have occurred in recent years have been characterized by the involvement of a large number of private citizens (without formal qualifications) in the production of geographic information. This function, usually reserved for professional operators, is accomplished by untrained volunteers and the results in many cases could be inaccurate. Nevertheless, from a cooperative point of view, VGI represents a strong innovation in GIS approaches, with important consequences in the relationship between citizens and emergency managers. Some authors [5,35,36] also use the term “crowdsourcing” to describe this typology of data acquisition by large and diverse groups of people, using web technology and specific data sources. To this end, there are two fundamental technologies used for VGI: geo-referencing, either using GPS or mobile devices positioning (e.g., phone or tablet), and the web 2.0.
In the course of the research activities described in the present paper, a collaborative way to acquire geospatial data during the earthquake post-event phase has been implemented. The main goal was to collect information about buildings, by reporting their structural condition after the main shock. These surveys can be carried out by groups of volunteers, who—after a rapid training—are able to collect a defined list of information about structures and infrastructures struck by the earthquake (typology, damages, suitability, security measures to be adopted, etc.). These data are georeferenced using a handheld device (equipped with GPS receiver) and then recorded into the WebGIS system by mobile Internet access.
Building damages following an earthquake event, processed by the proposed EWS and stored in its Geodatabase module, can be updated and used to generate more reliable vulnerability maps. Consequently, updated expected damage maps will be used not only to efficiently support the management of the post event phase but also to take into account the possible effects of other damages due to the aftershocks.
Moreover, the volunteers involved in these activities can access the WebGIS to look through existing maps, digital orthophotos and scenarios and also to provide refinements (e.g., updated information) for existing georeferenced maps and data. Figure 7 shows an example of data about buildings collected according to the above described procedure (such as: location, information about building, age of construction, typology, structural conditions, level of damage, actions to be taken, etc.) and displayed in the implemented WebGIS interface.
Figure 7. Post-event phase: visualization in the WebGIS of building information collected by means of handheld devices.
Futureinternet 04 00451 g007
Considering that the aftershock sequence can cause the collapse of seriously jeopardized structures, it is very important to gather information about the real conditions of buildings after the initial main shock. The proposed approach allows collecting these data in a rapid and timely way, jointly exploiting the potential of VGI and web 2.0. Finally, this methodology offers the advantage to easily provide information about the damages, which is very useful to support stakeholders and emergency managers to: (a) outline the real crisis scenario after the disastrous event; (b) efficiently address and manage the emergency tasks.

4. Conclusions and Future Developments

A procedure, based on advanced spatial analysis and geoprocessing tools, has been developed for mapping and assessing buildings seismic vulnerability. The proposed geospatial approach improves the effectiveness of disaster monitoring, management and awareness. In fact it facilitates analyzing the potential hazard due to a certain earthquake magnitude. A conceptual model has been developed for quickly managing the probable damage scenarios by using the implemented GIS architecture. In order to produce the thematic maps, PGA, IMCS, IV and building characteristics (reported in census data) are the main parameters to detect the areas (subdivided in parcels) that would probably face serious problems as a consequence of total or partial collapse. The model described in this paper is fully functional and available on a regional scale. The advantage of the methodology implemented is that the system is open and additional data can be integrated as soon as new information is available. Further, VGI data and collaborative tools can contribute to a better emergency planning, providing fundamental information for immediate response when disaster occurs. The results become tools for an interactive DSS, which is able to support the public stakeholders to evaluate damages of buildings and lifelines and to address—in the post-event phase—activities related to emergency management. As a next step, the proposed system architecture will be enhanced by implementing a backup system, in order to manage and/or mitigate the effects potentially arising from a network failure (electricity, telecommunications, etc.).

Acknowledgments

This research work was carried out within the national SIT_MEW Project (Sistema integrato di telecomunicazioni a larga banda per la gestione del territorio e delle emergenze in caso di calamità naturali comprensivo di Metodologie di Early Warning). This R&D project was co-funded by Italian Ministry of Education, Universities and Research (MIUR) in the framework of the “Grandi Progetti Strategici” (GPS) national program. The authors wish to thank Sergio Lo Curzio and Eng. Agnese Arolchi for their scientific contribution to this research work and Eng. Carmine Pascale–SIT_MEW Project Manager–for his considerable support.
Finally, the authors wish to thank the two anonymous reviewers for their valuable comments on the earlier draft of this paper.

References

  1. National Research Council–Board on Earth Sciences and Resources, Successful Response Starts with a Map: Improving Geospatial Support for Disaster Management; The National Academies Press: Washington, DC, USA, 2007.
  2. Goodchild, M.F. Citizens as sensors: The world of volunteered geography. GeoJournal 2007, 69, 211–221. [Google Scholar]
  3. Cova, T.J. GIS in Emergency Management. In Geographical Information Systems: Principles, Techniques, Applications, and Management; Longley, P.A., Goodchild, M.F., Maguire, D.J., Rhind, D.W., Eds.; John Wiley & Sons: New York, NY, USA, 1999; pp. 845–858. [Google Scholar]
  4. Charvat, K.; Kubicek, P.; Talhofer, V.; Konecny, M.; Jezek, J. Spatial Data Infrastructure and Geo-Visualization in Emergency Management. In Resilience of Cities to Terrorist and Other Threats; Pasman, H., Kirillov, I., Eds.; Springer: Dordrecht, The Netherlands, 2008; pp. 443–473. [Google Scholar]
  5. Heipke, C. Crowdsourcing geospatial data. ISPRS J. Photogramm. Remote Sens. 2010, 65, 550–557. [Google Scholar]
  6. Schoier, G.; Borruso, G. Individual Movements and Geographical Data Mining. Clustering Algorithms for Highlighting Hotspots in Personal Navigation Routes. In Lecture Notes in Computer Science; Murgante, B., Gervasi, O., Iglesias, A., Taniar, D., Apduha, B.O., Eds.; Springer: Heidelberg, Germany, 2011; Volume 6783, pp. 376–391. [Google Scholar]
  7. De Longueville, B. Community-based geoportals: The next generation? Concepts and methods for the geospatial Web 2.0. Comput. Environ. Urban Syst. 2010, 34, 299–308. [Google Scholar] [CrossRef]
  8. Laituri, M.; Kodrich, K. On line disaster response community: People as sensors of high magnitude disasters using internet GIS. Sensors 2008, 8, 3037–3055. [Google Scholar]
  9. Tilio, L.; Scorza, F.; Lanza, V.; Murgante, B. Open Source Resources and Web 2.0 Potentialities for a New Democratic Approach in Programming Practices. In Lecture Notes in Artificial Intelligence; Springer-Verlag: Berlin, Germany, 2009; Volume 5736, pp. 228–237. [Google Scholar]
  10. Della Rocca, A.B.; Fattoruso, G.; Lo Curzio, S.; Pasanisi, F.; Pica, R.; Peloso, A.; Pollino, M.; Tebano, C.; Trocciola, A.; De Chiara, D.; Tortora, G. SISI Project: Developing GIS-Based Tools for Vulnerability Assessment. In Visual Information Systems. Web-Based Visual Information Search and Management; Sebillo, M., Vitiello, G., Schaferer, G., Eds.; Springer: Heidelberg, Germany, 2008; Volume I, pp. 327–330. [Google Scholar]
  11. Marcheggiani, E.; Galli, A.; Gulinck, H. The Characterisation of “Living” Landscapes: The Role of Mixed Descriptors and Volunteering Geographic Information. In Lecture Notes in Computer Science; Murgante, B., Gervasi, O., Iglesias, A., Taniar, D., Apduha, B.O., Eds.; Springer: Berlin, Germany, 2011; Volume 6782, pp. 369–380. [Google Scholar]
  12. Falck, C.; Ramatschi, M.; Subarya, C.; Bartsch, M.; Merx, A.; Hoeberechts, J.; Schmidt, G. Near real-time GPS applications for Tsunami early warning systems. Nat. Hazards Earth Syst. Sci. 2010, 10, 181–189. [Google Scholar]
  13. Gasparini, P.; Manfredi, G.; Zschau, J. Earthquake early warning as a tool for improving society's resilience and crisis response. Soil Dyn. Earthq. Eng. 2011, 31, 267–270. [Google Scholar]
  14. Nakamura, Y.; Saita, J.; Sato, T. On an earthquake early warning system (EEW) and its applications. Soil Dyn. Earthq. Eng. 2011, 31, 127–136. [Google Scholar]
  15. Satriano, C.; Wu, Y.-M.; Zollo, A.; Kanamori, H. Earthquake early warning: Concepts, methods and physical grounds. Soil Dyn. Earthq. Eng. 2011, 31, 106–118. [Google Scholar]
  16. Wald, D.J.; Worden, B.C.; Quitoriano, V.; Pankow, K.L. ShakeMap Manual: Technical Manual, User’s Guide and Software Guide. USGS. 2006. Available online: http://pubs.usgs.gov/tm/2005/12A01/ (accessed on 4 may 2012).
  17. Allen, R.M. The ElarmS Earthquake Early Warning Methodology and Application across California. In Earthquake Early Warning Systems; Gasparini, P., Manfredi, G., Zschau, J., Eds.; 2007; pp. 21–43. [Google Scholar]
  18. Marketos, G.; Theodoridis, Y.; Kalogeras, I.S. Seismological data warehousing and mining: A survey. Int. J. Data Warehous. Min. 2008, 4, 1–16. [Google Scholar]
  19. Federal Emergency Management Agency FEMA 2008, HAZUS-MH Estimated Annualized Earthquake Losses for the United States; FEMA: Washington, DC, USA, 2008.
  20. Theodoridis, Y. Seismo-Surfer: A Prototype for Collecting, Querying, and Mining Seismic Data. In PCI 2001. Lecture Notes in Computer Science; Springer: Berlin, Germany, 2003; Volume 2563, pp. 159–171. [Google Scholar]
  21. Andrienko, N.; Andrienko, G. Intelligent visualization and information presentation for civil crisis management. Trans. GIS 2007, 11, 889–909. [Google Scholar]
  22. Pollino, M.; Fattoruso, G.; Della Rocca, A.B.; La Porta, L.; Lo Curzio, S.; Arolchi, A.; James, V.; Pascale, C. An Open Source GIS System for Earthquake Early Warning and Post-Event Emergency Management. In Lecture Notes in Computer Science; Murgante, B., Gervasi, O., Iglesias, A., Taniar, D., Apduha, B.O., Eds.; Springer: Berlin/Heidelberg, Germany, 2011; Volume 6783, pp. 376–391. [Google Scholar]
  23. Lantada, N.; Pujades, L.G.; Barbat, A.H. Vulnerability index and capacity spectrum based methods for urban seismic risk evaluation. Nat. Hazards Earth Syst. Sci. 2009, 51, 501–524. [Google Scholar]
  24. Borcherdt, R.D. Influence of Local Geology in the San Francisco Bay Region, California on Ground Motions Generated by the Loma Prieta Earthquake of October 17, 1989. In Proceedings of the International Symposium on Safety of Urban Life and Facilities, Tokyo, Japan, 1–2 November 1990; pp. 1–35.
  25. Aki, K. Local Site Effects on Strong Ground Motion. In Proceedings of the ASCE Conference on Earthquake Engineering and Soil Dynamics; Rolla, MO, USA, 1998; I, pp. 103–155. [Google Scholar]
  26. Kiremidjian, A.S.; King, S.A.; Sugito, M.; Shah, H.C. Simple Site-Dependent Ground Motion Parameters for the San Francisco Bay Region. In The John A. Blume earthquake Engineering Center Report No. 97; Stanford University: Stanford, CA, USA, 1991. [Google Scholar]
  27. Lutz, K.A.; Kirernidjian, A.S. A Generalized Semi-Markov Process for Modelling Spatially and Temporally Dependent Earthquakes. In The John A. Blume earthquake Engineering Center Report No. 97; Stanford University: Stanford, CA, USA, 1993. [Google Scholar]
  28. Decanini, L.D.; Mollaioli, F. Formulation of elastic earthquake input energy spectra. Earthq. Eng. Struct. Dyn. 1998, 27, 1503–1522. [Google Scholar]
  29. Decanini, L.D.; Mollaioli, F. An energy-based methodology for the assessment of seismic demand. Soil Dyn. Earthq. Eng. 2001, 21, 113–137. [Google Scholar]
  30. Sabetta, F.; Pugliese, A. Estimation of response spectra and simulation of non-stationary earthquake ground motion. Bull. Seismol. Soc. Am. 1996, 86, 337–352. [Google Scholar]
  31. Lagomarsino, S.; Giovinazzi, S. Macroseismic and mechanical models for the vulnerability and damage assessment of current buildings. Bull. Earthq. Eng. 2006, 4, 415–443. [Google Scholar]
  32. Borfecchia, F.; De Cecco, L.; Pollino, M.; La Porta, L.; Lugari, A.; Martini, S.; Ristoratore, E.; Pascale, C. Active and passive remote sensing for supporting the evaluation of the urban seismic vulnerability. Ital. J. Remote Sens. 2010, 42, 129–141. [Google Scholar]
  33. Ramsey, P. The State of Open Source GIS. In Proceedings FOSS4G 2007 Conference, Vancouver, Canada, 12–16 September 2007; Available online: http://2007.foss4g.org/presentations/viewattachment.php?attachment_id=8 (accessed on 4 May 2012).
  34. Steiniger, S.; Bocher, E. An overview on current free and open source desktop GIS developments. Int. J. Geogr. Inf. Sci. 2009, 23, 1345–1370. [Google Scholar]
  35. Ramm, F. Crows Sourcing Geodata. In Proceedings FOSSGIS 2008, Freiburg, Germany, 1–3 April 2008; Available online: www.geofabrik.de/media/2009-09-08-crowdsourcing-geodata.pdf (accessed on 4 May 2012).
  36. Hudson-Smith, A.; Batty, M.; Crooks, A.; Milton, R. Mapping for the masses: Accessing Web 2.0 through crowdsourcing. Soc. Sci. Comput. Rev. 2009, 27, 524–538. [Google Scholar] [CrossRef]

