Article

WikiGIS Basic Concepts: Web 2.0 for Geospatial Collaboration

1
Centre for Research in Geomatic, Pavillon Casault, Université Laval, Québec, QC G1V0A6, Canada
2
Fujitsu Canada, 2000, boulevard Lebourgneuf, bureau 300, Québec, QC G2K0B8, Canada
3
Interdisciplinary Centre for the Development of Ocean Mapping–CIDCO, 310 allée des Ursulines, Rimouski, QC G5L3A1, Canada
*
Author to whom correspondence should be addressed.
Future Internet 2012, 4(1), 265-284; https://doi.org/10.3390/fi4010265
Submission received: 7 November 2011 / Revised: 22 February 2012 / Accepted: 23 February 2012 / Published: 13 March 2012
(This article belongs to the Special Issue NeoGeography and WikiPlanning)

Abstract

:
With the emergence of Web 2.0, new applications arise and evolve into more interactive forms of collective intelligence. These applications offer to both professionals and citizens an open and expanded access to geographic information. In this paper, we develop the conceptual foundations of a new technology solution called WikiGIS. WikiGIS’s strength lies in its ability to ensure the traceability of changes in spatial-temporal geographic components (geometric location and shape, graphics: iconography and descriptive) generated by users. The final use case highlights to what extent WikiGIS could be a relevant and useful technological innovation in Geocollaboration.

1. Introduction

The convergence of the Web 2.0 and geospatial technologies to develop participatory solutions completely changed the perception and use of geographic information, and provides a growing number of users with the possibility to interact with maps and data. The GeoWeb, introduced in the mid-90s by Herring [1] has now become also contributory (populated by users). On the one hand, geospatial technologies combine to achieve complementarity (interoperability of tools and formats, development of location-based systems, etc.); and on the other hand, the uses of the Web 2.0 and associated technologies develop into more mature types of participation, based upon information sharing and collaborative work [2].
The transition from consultation to content interaction introduced the concept of volunteered geographic information (VGI), which characterizes the location-based contents that are generated, increased and updated by users [3]. Associated to new web-based online mapping applications such as Application Programming Interfaces (APIs), Web-mapping in its “2.0” form enables users not only to read but also to write maps collectively [4,5]. The new applications resulting from the combination of distributed services and data (mashups) evolve towards more interactive forms of collective intelligence. Mashups between content management systems (CMS or Wiki) and geographic services grow following the example of Wikimapia, OpenStreetMap, Google MapMaker, ArgooMap, Geodeliberator, etc. [6,7]. However, these new “collaborative” mapping applications are still too limited to meet the demands of Geocollaboration: failure to track the spatio-temporal evolutions of user-generated geometric objects (positioning, shape, descriptive attributes, visual attributes), and lack of relevant metadata to qualify these data.
The present paper aims at providing the basic concepts of WikiGIS, a new type of geospatial collaborative tool. WikiGIS results from three major paradigm shifts regarding the production and diffusion of geographic information (for further details see [8]). The first paradigm shift “from top-down to bottom-up” refers to the development of Public Participation GIS (PPGIS). The second paradigm shift “from requested production of geo-information to voluntary production” is part of the current democratization trend of Geoweb 2.0 technologies (also called neogeography). It is particularly materialized by VGI and geo-crowdsourcing. The third paradigm shift, “the wikification,” is linked to the second one but occurs with a slight temporal shift. The “wikification” of GIS and online mapping is at odds with the traditional (linear and hierarchical) production of geographical information. It allows for WikiGIS-like geocollaborative solutions that provide dynamic access to the collective process of map design and making. This iterative and non-cumulative approach of geographical knowledge production is about to quite radically change Geocollaboration processes.
More precisely, WikiGIS combines wiki-type content management systems with an interactive map built upon GeoWeb technologies (Google Maps in the current prototype). It ensures traceability and history of the user-generated spatial representations, while providing dynamic access to the previous versions of geographic objects, as well as documentation on data quality. Section 2 focuses on the general context of this research by providing an overview of the wikification of geographical information in the context of GeoWeb 2.0. It particularly introduces the concept of WikiGIS by briefly clarifying the specifications and needs of Geocollaboration, and the relevance of the wiki-type approaches. Section 3 provides a conceptual and technical description of the first WikiGIS prototype (architecture and functionalities), supported by a use case as a proof of concept. The paper concludes with a discussion of the prospects held out by this first development.

2. General Context: Geocollaboration in the GeoWeb 2.0 Era

2.1. GeoWeb 2.0: A Socio-Technical Platform for Geo-information Coproduction and Sharing

Spatial data processing, dissemination and exchange offered by online mapping solutions keep pace with technical advances and the evolving use of the Internet (bandwidth, accessibility) and of the Web 2.0 (interactive applications, rich contents, user-generated contents) [9,10,11]. The Web 2.0, as a development environment for the GeoWeb, is characterized by an unprecedented democratization of geospatial technologies that were traditionally exclusive to professionals. The take-up of these technologies by the general public in mobile use situations (Personal Navigation Devices–PND, Location-Based Services–LBS) has transformed the geographic information production and dissemination (contribution) processes, and introduced new forms of mapping (including mobile mapping) in people’s everyday lives [12,13]. This democratization is more the result of Web-related technological advances rather than of geospatial sciences (JAVA, XML, Tag, etc.). Web 2.0 current technologies offer more flexible architectures, more responsive display, simplified interfaces, extended content interaction and a better interoperability [14]. The emerging model of Cloud Computing enables the development of Rich Internet Applications (RIA) providing similar characteristics (interactivity, functionality and speed) to standard computer software. Based on the use of Web services, these technologies make it possible for applications to communicate remotely regardless of the platforms they run on. These dynamic and interactive distributed services are based on technologies widely adopted and enriched by the Web developer community, such as AJAX (Asynchronous JavaScript) and XML.
As a result, GeoWeb 2.0 services offer a coherent group of spatial data handling tools (import, cataloguing, visualization, creation, processing, distribution, etc.). API (Application Programming Interface), such as Google Maps, Bing Maps or ESRI ArcGIS, give access to the functions and contents of Web applications using external commands, especially for visualization purposes (road networks, satellite imagery, relief, POI). The fast refresh rate to display raster tiles (imagery, plan, relief), the high responsiveness of the zoom and drag tools, along with many other possibilities related to spatial data handling, make these applications very popular. In addition to discovery and visualization of geographic information, API also provides utility programs to manipulate and create data, as Google MyMaps does. Interchange formats that are specific to the GeoWeb (KML, GML…) are now included in geospatial data standards, especially those of the Open Geospatial Consortium–OGC (WMS, WFS, WCS…), which offer better interoperability of data and services.
Mapping in the GeoWeb 2.0 environment is dynamic, interactive, multimedia and, more importantly, distributed [15]. The strength of the GeoWeb 2.0 is its capacity to provide, within the Web 2.0 environment, composite geographic applications mixing (following the logic of mashups) numerous Web services and contents under a unified graphic interface, so as to develop new tailor-made applications. The added value of these GeoWeb 2.0 services is the possibility for users to manipulate geospatial data (external or personal), to produce and distribute contents, or even to develop their own tools (converter, widget, layer management, etc.).
Indeed, GeoWeb 2.0 is a place where users can get involved and contribute, through the creation, sharing and modification of contents, while developing social relationships. “Many to many” is a way of communication that allows people to move from interactivity to interaction and, contributes to the building of networks, which are no longer based on information exchange alone but also on knowledge sharing. This type of content interaction (location-based) changes the processes used to produce, update and distribute geographic information. Moreover, producers become more and more diversified: private individuals, enthusiasts, communities of practice, Web stakeholders, etc. [3,16]. Geographic information is no longer only generated by large institutional and private producers. A growing part of the available geographic information is now produced, enriched, updated and disseminated to citizens (communities of practice, individuals) following a bottom-up approach. Users of geo-information become also and, at the same time, producers of geo-information: “producers” [17]. The use of crowdsourcing as a new way of collaboration to produce and update professionals’ databases has also become widespread among the actors of the GeoWeb 2.0 (Google, Microsoft) and institutional and private producers (Tom-Tom, Télé Atlas, French IGN, Ordnance Survey).

2.2. Geocollaboration in the Era of GeoWeb 2.0

In functional terms, collaboration can be considered as the entanglement of three complex processes having different, but interdependent objectives: communication, cooperation and coordination [18,19,20]. In this paper, we refer to Geocollaboration as collaborative working situations using geographic data (geometric (shapes and locations), graphic and descriptive elements, and even associated metadata), geomatics technologies, and also processes of collaborative design, data co-production and spatial representation [20]. A considerable amount of research has been conducted on Geocollaboration in the realm of GISciences [21,22,23,24,25,26]. Geocollaboration is based on a constant interaction between geographic contents and users. Maps (more generally spatial representations) have become a medium in which to ask questions and gather local knowledge in a common space open to all.
The number of technological solutions, and of both methods and concepts as well, on which geocollaboration is based, increase along with the development and democratization of GeoWeb 2.0 tools [27,28]. The geospatial technologies that are now available allow users (professional and amateur) to read and write maps, and at the same time manage data in an organized manner. As mentioned by [29], working together, collaboratively, suggests that tools should allow several participants to work in a private common space while providing a historical log of who made changes and where. To do so, documented data (metadata) and identified skills are necessary, along with a location-based content management system providing efficient versioning methods. Computer-assisted collaborative work allows several persons to work on the same document, or the same application, with no constraint of time, place or tools and processes [30,31]. Collective and organized working methods integrate users into an ongoing effort to improve every task, as well as the project as a whole, without a set and predetermined division of the tasks [32]. In order to support this process, current collaborative tools, such as CMS or Wikis, offer numerous features to publish and share contents (documents, knowledge, information). These tools allow syndication of the contents generated by all the contributor actors, and are used to maximize the creativity and efficiency of groups involved in large-scale projects, such as the online encyclopedia: Wikipedia.
Wikis are a specific type of CMS. They are more simplified, relatively unstructured and content-centered [33]. They are designed to enable several persons to build the content of the same page keeping track of every version, which can be applied to the production of a map. Wiki basic principles are at odds with the linear production of information and traditional hierarchical functioning. They follow an iterative and non-cumulative approach to produce knowledge, and they represent new information management practices. When applied to the production of geospatial data, two features make Wikis particularly collaborative. On the one hand, location-based content can be modified, enriched, updated and deleted by any user in synchronous or asynchronous mode. On the other hand, all users’ contributions are stored and dynamically accessible through a history of actions, which allows the evolution of the design process to be traced [34,35]. Wikis offer the possibility of saving a very large number of versions of the same page, and to revert to a former version. Wikification can be considered as a knowledge management method that meets the requirements of collective work, as well as ensuring continuous communication within working teams and a constant evolution of the contents.
Managing multiple users engaged in editing “the same continuous geographic database at the same time” is not a new challenge for GI Science [36]. Since the mid-90s, multi-user transactional editing tools have been developed by the GIS and spatial database community. Commercial Spatial DBMS as Spatial Oracle, Ms SQL or ESRI ArcSDE already provide this sort of functionalities. Wikis (and WikiGIS) replicate and adapt this setting in today’s GeoWeb 2.0 architecture. However, “classical” collaborative GIS and mapping applications fail to track the spatio-temporal evolutions of user-generated geometric objects (positioning, shape, descriptive attributes, visual attributes). There is also a lack of relevant metadata to qualify these data. Moreover, supporting Geocollaboration not only requires multi-user editing tools, but also the capability for each participant to compare his/her own contribution with other contributions. As a follow-up of Geocollaboration, wikification of geographic information refers to the development of online mapping applications based on wiki-like CMS [37].

2.3. The Wikification of Geographical Information

The combination of collaborative work approaches together with geographic information is still limited on the GeoWeb 2.0. On the one hand, Wikis evolve and converge towards more collaborative and participative tools. Yet, the spatial component is either lacking (most commonly), or confined to the localization of content in order to spatialize information (geocoding, geotagging, geonaming, etc.). The logic of Wikis is thus restricted to written contents. On the other hand, online mapping applications on the GeoWeb (Web map services, virtual globes) pay little or no attention to the collaborative aspect of contributions. Most of the time, users can only read, create and modify contents with no access to their versioning (neither read nor create access). Moreover, the existing solutions that provide versioning of contributions such as Google Map Maker, Wikimapia or OpenStreetMap are not effective in maintaining the traceability of geometric components to facilitate collaborative work. These applications are unable to maintain the history of contributions and edited objects (from original to final version) with all their components (geometric (location and form), graphic (iconography) and attributive (description of the object). They manage attributive components only. Yet, collaborative work requires knowing the following: Who has made changes in preceding versions? When and where were these changes made? Why and what for? How and what are the justifications?
This is especially the case in asynchronous working contexts, or when projects are carried out over long periods of time, and with different frequencies. However, even in environments such as Wikimapia, in which the wiki dimension is emphasized, collaboration in the strict sense only takes place at the level of the descriptive components (text, hyperlinks, photos). Moreover, in most wiki applications there is no information available on users (their technical skills or degree of knowledge for instance) nor on their actions, except in Google Map Maker, Wikimapia or OSM.
Developing a WikiGIS application that enables tracking of the history of spatial data edits and promoting geocollaborative working is fair. There are currently no examples of where this is done satisfactorily. Therefore, we have designed a new type of online collaborative mapping application based on the operating principles of Wikis, both in terms of creating and enriching location-based contents (of the map), and in terms of maintaining a documented history of all the stages of development. In the WikiGIS, location-based contents can be modified, enriched, updated and deleted by any user. All of the users’ actions are saved, “versioned” and dynamically accessible via the content history. Storing all actions is a way to tell the story of the map (or project) “in progress”. It allows the reporting of its progress over time or to “rewind” the process so as to understand its genesis, for example. The core component of wiki approaches is the process itself (data generation, map design), more than data, which are to some extent a materialization (an occurrence) of the contributors/actors’ points of view (opinions). Contrary to most existing mapping mashups, in which users cannot really act on the database, the architecture proposed for the WikiGIS (cf. Section 3) ensures the traceability of the spatio-temporal evolution of each geographic object created, and provides dynamic access to the corresponding history file. Consequently, data coproduction could be achieved iteratively rather than in a cumulative way as in traditional GIS approaches.
This new form of geo-data coproduction is interesting for geocollaborative work, when everyone contributes (expressing personal views) to a common project. Cartographic representation thus becomes a tool to read the dynamics at work in the production of spatial knowledge, and to keep track of spatial representations. For instance, this tool provides the history of the advancement of a project by types of actors involved (citizens, land-planners or elected representatives). A WikiGIS thus makes it possible to support both integration and differentiation dynamics, which are core to Geocollaboration [20,21]. In other words, it offers a solution to integrate Geocollaboration to what Noucher [29] calls the differentiated consensus, that is to say, the building of a consensus, based on the identification and recognition of differences and divergences.
The WikiGIS, as we define it in this paper, applies wiki management and integration strategies to geo-data–geometry (shape and location)–graphic attributes–descriptive attributes, and not solely to location-based texts, as in geoblogs for instance. Table 1 presents the characteristics of the WikiGIS compared to those of wiki technologies. More precisely, a WikiGIS is a “geographic information system (GIS), created online (on the Internet) through collective interventions, which involves interactions between participants, followed by the combination and traceability of their contributions into coherent geospatial representations that are open to improvements” [38].
Table 1. Characteristics of the WikiGIS.
IndicatorsWikisWikiGIS
Data accessWeb server (Apache)Web server (http)
StorageMySQL, OracleSpatial DB (MySQL…)
Formatting pagesSimple markup languageGML, MWX: formats allowing both description of geographic data and their transfer on the Web
Type of editionAsynchronous Synchronous, redlining type
Types of dataText, image, sound, videoGeometric data (point, line, polyline, polygon), descriptive and graphic data
Decoding the informationMinimalMore complex
Display of dataHTML- Geometric data: AJAX
- Descriptive data: HTML
Historicity managementWiki browser- Descriptive data: by wiki syntax (wiki browser)
- Geometric data: by file, indexation, spatial DB
Although geographic information practices and forms have come a long way, the quality and reliability of volunteered geographic information remain a key issue [39,40,41]. The limits and difficulties related to user-generated contents are of all kinds and not to be ignored (varying motivations of users, heterogeneous contents, legal issues, etc.). Mapping applications 2.0 are still limited in terms of accuracy and data qualification. Therefore, it is necessary to develop mapping applications based on new approaches specific to the mobilization and representation of public knowledge, following the examples of Geocollaboration or wikification. The “wiki” approach for geographical information production opens new ways to qualify data (peer-review or successive iterations for instance). It also offers new opportunities, through the direct involvement of interested end-users, to produce redundancy that could improve geodata quality (Linus Law [42]). Last but not least, this direct involvement of end users could probably contribute to improving the adequacy of geodata with users’ needs (fitness for use) [40].

3. The Solution Proposed: WikiGIS

We propose, as a proof of concept, to instantiate the characteristics presented above in a WikiGIS prototype, which is available at the following address: http://wikisig.scg.ulaval.ca/prototypes/v1/.

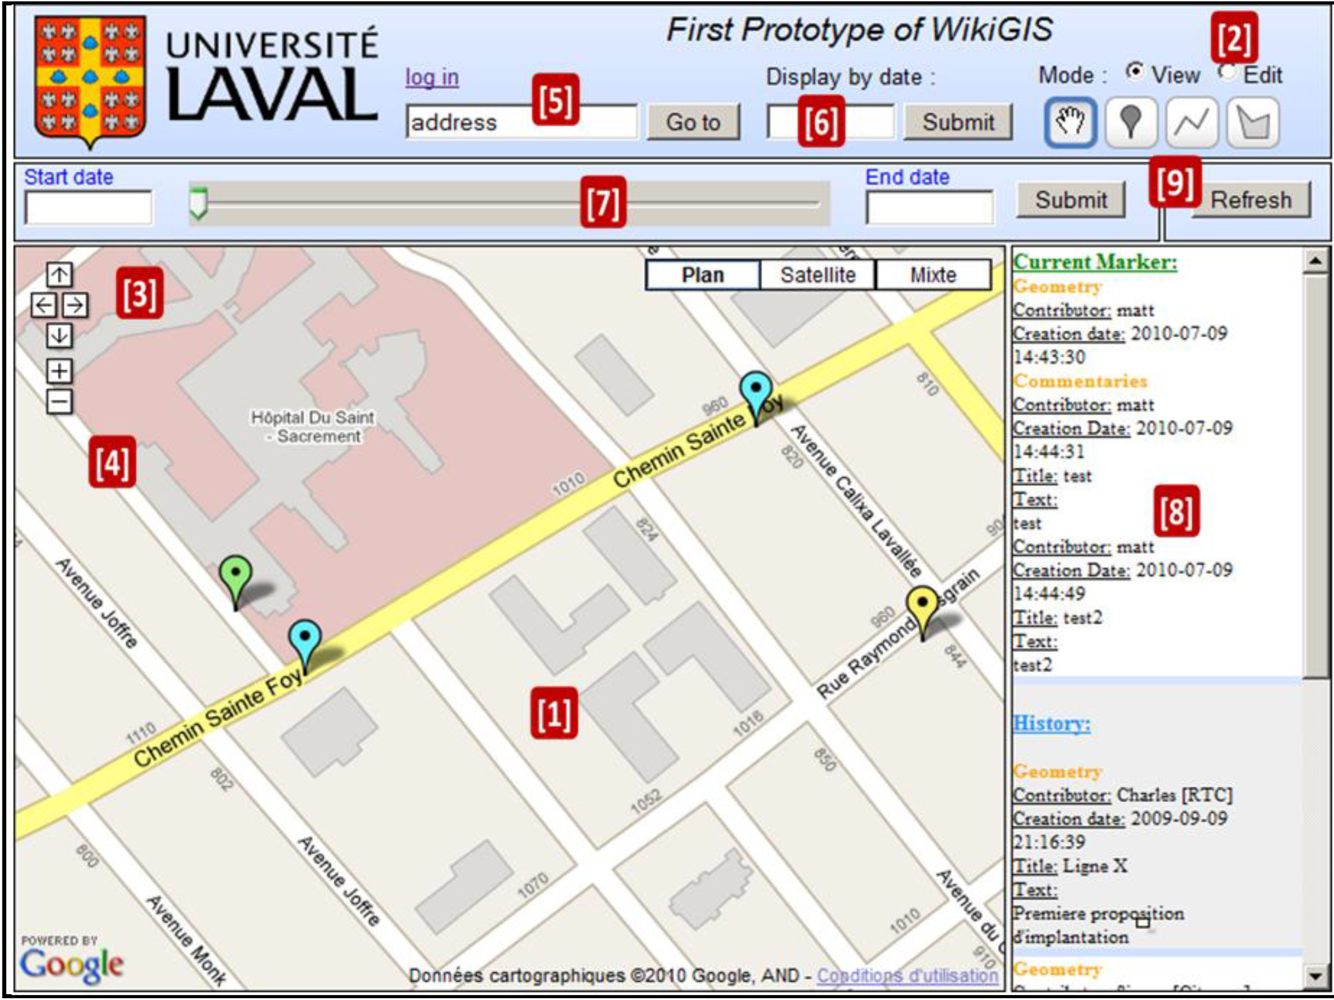
3.1. WikiGIS Interface

The website consists of a homepage displaying the workspace, and of a login/registration page for users (Figure 1). Most of the homepage consists of a Google Maps base map [1], a commentary field [8] and traditional browsing tools. Two modes are available [2]: a view mode (default selection) and an editing mode.
Figure 1. WikiGIS Interface.
Futureinternet 04 00265 g001
The view mode is available by default for all users. It allows viewing of all of the geometric entities (points, polylines, polygons) with their related comments that compose the map at a given time chosen by the user (the logon date by default). The map can be explored by using the navigation tools [3], the zoom and pan controls [4] or by choosing an address, a place [5]. Two display types are available: visualization of the last updated geometry, and visualization of the history of the geometric shapes. The visualization of the last updated geometry is selected by default when the homepage is loaded. In this arrangement, the map displays the last update of each object. The visualization of the history of the geometric shapes is achieved in three different possible ways:
  • - Through the consultation of a situation status at a given time (t) [6];
  • - Through the consultation of the advancement of a situation between two given times (t1) and (t2) via a linear temporal slider [7];
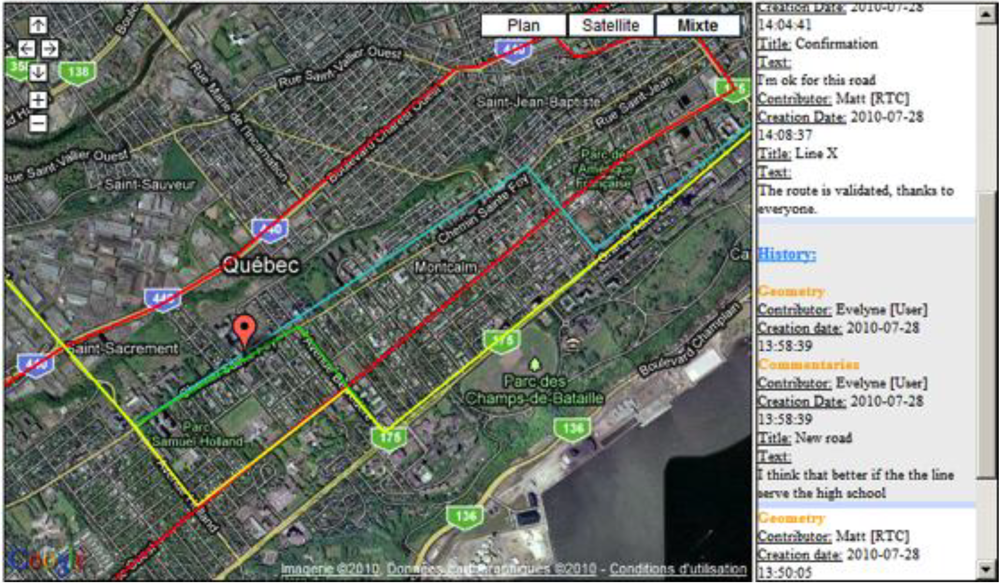
  • - Through the consultation of the descriptive information and of the history of a selected item [8].
The visualization of descriptive data is launched by clicking an object. Then, the corresponding information appears in a text box on the right of the map [8]. Descriptive data are arranged in two sets: the descriptive data associated with the last updated geometry object, and the descriptive data associated with former versions of the geometry object (each version being considered in the database as different temporal instances of the same object, and not as different objects). These text data include the author’s identification and the creation date of the geometry, as well as the titles and comments associated with this geometry. The date of creation is one of the structural elements of the geographical data management in the Wiki. This date is actually the date of the registration of the transaction in the database. Transaction is defined here as any action done by a user in order to create a new object; or to change one or more components of an existing object (e.g., changing location, changing its shape, appearance or descriptive associated data); or to remove an existing object. One object can have several comments created by different users at different times.
The editing mode (for registered users) allows the same actions as the visualization mode, and in addition:
  • - The creation of new objects [9];
  • - The modification of existing objects (modification of the geometric component (shape, location); modification of the descriptive component; modification of both components).

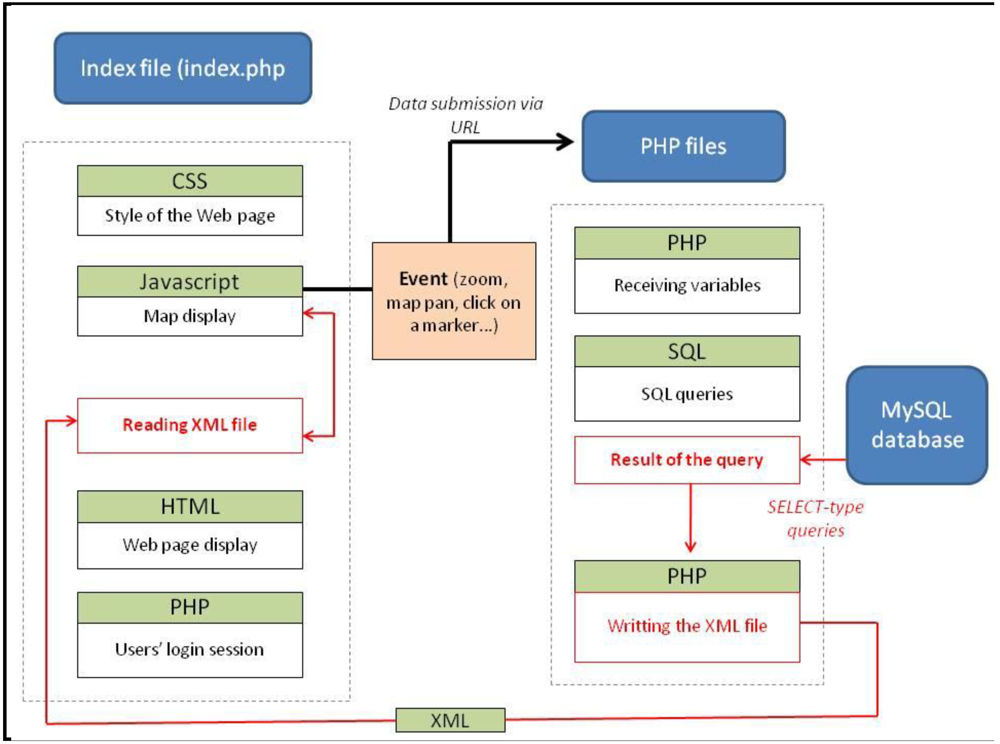
3.2. Prototype Architecture and Operation

For now, the prototype is based on client/server type architecture. The browser loads the application when connecting to the WikiGIS site, then it queries the server, which processes most of the information, and finally returns the results to the browser (Figure 2).
Figure 2. WikiGIS Architecture.
Futureinternet 04 00265 g002
On the client side, the user interface is accessible through a standard web-browser such as Firefox, Internet Explorer or Safari. The cartographic interface is based on the Google Maps API, which enables the use of all the functionalities provided by the Google Maps Web Service (tools, base maps, address geolocation, etc.). Interaction (creation, modification, consultation) with this API, and therefore the display of geometric entities, is achieved via the client workstation. It allows the desired entities to be displayed and retrieval of the geometry of the entities created using the tools available. However, it does not provide data storage, which is completed on the server side.
On the server side, there are two components:
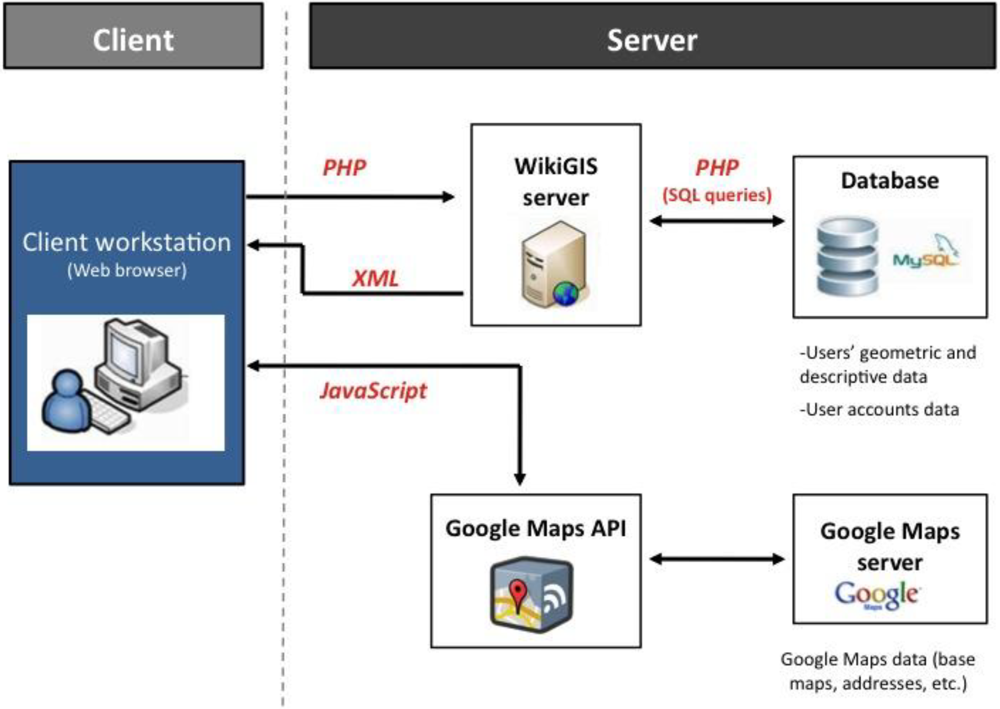
  • - The WikiGIS HTTP server (Apache/PHP) manages the website pages, and hosts the code files on which the prototype is based. The latter communicates with the database via SQL queries to send and receive geometry- or user-related information, in order to transfer it to the client workstation. It acts as a communication intermediary between the client and the database.
  • - The MySQL database of the WikiGIS allows geometric and attributive components of each entity (points, polylines, polygons) to be stored and tracked. Its purpose is to store all the information necessary to the operation of the WikiGIS; that is to say, users’ data (family name and given name…), geometric data and descriptive data (in text format) associated with the geometry.
The development of the WikiGIS required the use of several programming languages (HTML, CSS, JavaScript, PHP and XML). Figure 2 and Figure 3 present the interactions between the different components, and the corresponding languages. The Web page displaying the main interface of the WikiGIS is written in HTML, PHP and JavaScript. JavaScript enables the primary functions necessary to operate the Google Maps API to be used, because the Web client alone communicates with the Google Maps Service, depending on the information the WikiGIS server sends back to it. To enable the client to communicate with the database, we used PHP (server language) to establish a bridge between the two. Only SQL queries contained in PHP files sometimes need to receive JavaScript variables. The communication between these two languages is then achieved through URL links, which contain both the name of the specified PHP file, and the variables needed to perform the SQL query. PHP language is also used for user management. The principle is simple, when a user logs in via PHP, his or her login name and logon date are saved. Storing these data is necessary, because some actions are available only if the user is logged in (creation, modification of geometric entities…).
Figure 3. The role of languages in operating the WikiGIS.
Futureinternet 04 00265 g003
The other PHP files store SQL queries. They get JavaScript variables through the GET method. When the purpose of a SQL query is to read information from the database table (SELECT type), it is essential to send the result of the query back to the JavaScript code contained in the HTML file. Therefore, we write a XML file based on a structure consisting of three main nodes corresponding to object types (points, polylines, polygons). These nodes contain both subnodes holding the characteristics and attributes (ID, position, etc.) of a specific object, and as many “comment” subnodes as there are comments associated with this object. “Comment” nodes contain their own attached attributes and a final “text” subnode, which consists of the text of the comment. This file is then read by the JavaScript. However, if the purpose of the SQL query is not to read but to add information in the database table (“insert into” type), no data are sent back to the HTML file. In this case, no XML file is written.

3.3. WikiGIS Features

One of the strengths of the WikiGIS is its efficiency in keeping track of the geometric and descriptive components of the entities composing the map. Traceability information is stored in the database. It consists of seven tables (Figure 4):
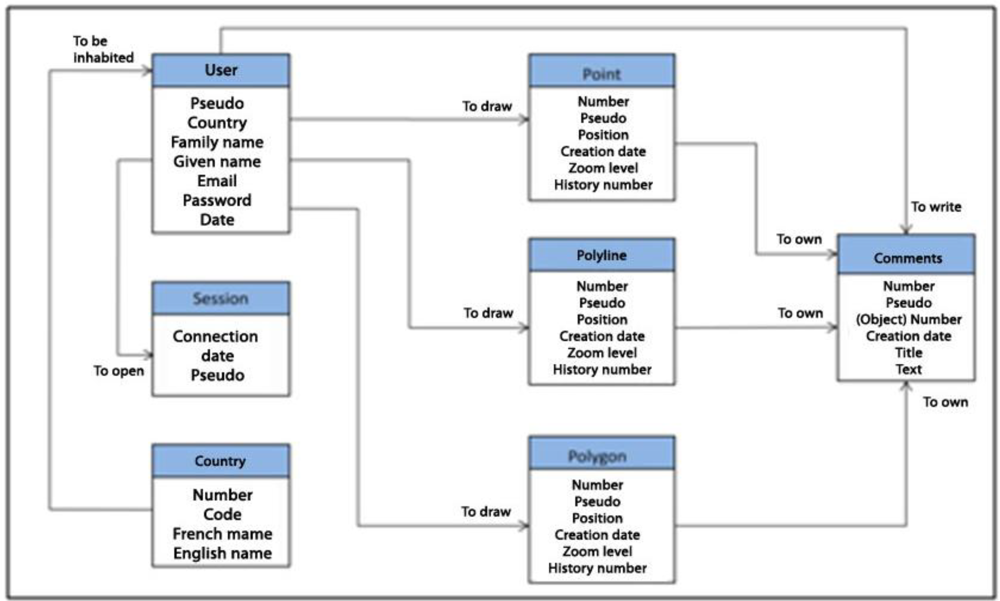
  • - Three tables storing user-related data (users, connection and country)
  • - Four tables storing the geometric and descriptive components (points, polylines, polygons and comments)
Each geometric object is stored with its properties and two numeric identifiers:
  • - A unique identifier: to identify individually and unambiguously each object, as well as each version of an object.
  • - An entity identifier, which is the same for all the versions of the same object.
It establishes a link between all the versions. Indeed, regarding the database, all the versions of the same object are stored as if it were an object as a whole. Therefore, all the versions include both the geometry and properties of the object. The versions are finally linked to one another via the entity identifier, and classified according to their creation date.
Figure 4. Database model.
Futureinternet 04 00265 g004

3.3.1. User Management

Each geometric shape must be associated with an author. This is why managing users’ accounts is essential. Therefore, each user entity should be considered and associated with properties, such as first and last names, pseudo, country, email, password and the date of the account creation. Before being allowed to create objects in the database, the user must create an account. We consider the pseudo as the user entity ID, which is a priori unique. The pseudo alone is visible to other collaborators when the user performs an action. All the other data are visible and relevant to the administrators alone. Finally, in order to keep track of the users’ logon time, we use a session entity characterized and identified by the users’ logon date.

3.3.2. Managing Traceability of the Geometric Component

The WikiGIS manages three types of objects: points, polylines and polygons. The properties of these objects being different, particularly with respect to coordinate management, we identified three distinct families of entities:
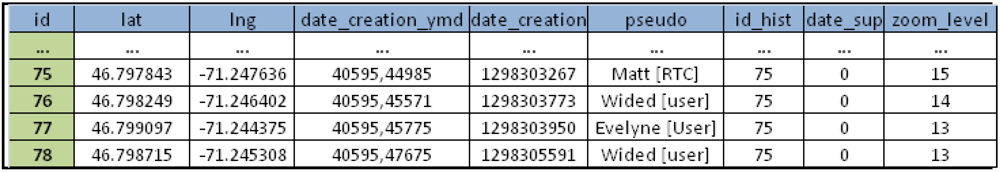
  • - The point, identified by a number, is characterized by its position (latitude and longitude), creation date, author and zoom level at which it becomes visible on the map. Other characteristics can be added, such as the type of icon or opacity.
  • - The polyline entity is characterized by the position of its tips, its creation date, author and zoom level at which it becomes visible on the map.
  • - The polygon entity has the same characteristics as the polylines.
The WikiGIS allows dynamic storage of all the previous versions of the same object. As mentioned above, the previous versions and the current version of an object are considered as similar entities, since they have exactly the same type of properties. Only the values of these properties change. The current version of an object is the one corresponding to the latest creation date. In terms of visualization, when a user interacts with the map (zoom or pan), only the current version of the objects in the cartographic window appears. When the user clicks on one of these objects, then all the previous versions are displayed (in a different color).
Figure 5 shows this principle. The series of top thumbnails displays the current version of the geometry. The series of bottom thumbnails represents the result of a click to activate the current geometry. The timeline is divided into three moments (…085, …152, …179) corresponding to three actions performed on the marker. Time in the database is counted in seconds since January 1, 1970. A "timestamp" is associated with each object. This solution offers unique and non-ambiguous object identification on the timeline. This is a quite usual convention in computer science (e.g., Linux). Of course, it is possible to convert each time expressed in “seconds” to “day, month, year, hh, mm, ss”.
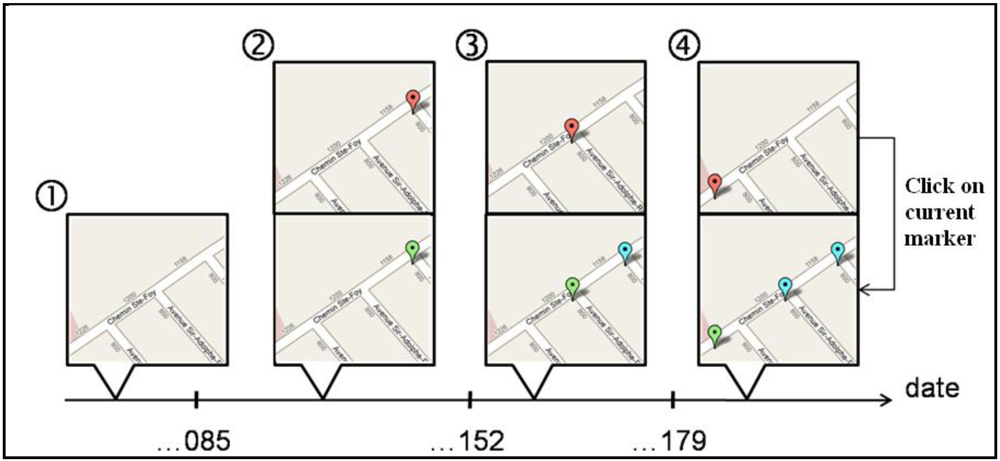
  • - Configuration 1: The consultation date being earlier than the creation date of the point (…085), the query returns no object. The database has no point with a creation date earlier than the display date.
  • - Configuration 2: A current version of an object appears (object 16). When the user clicks on it, the icon turns green to indicate that it is active. No other marker appears at this stage, because there are no prior versions.
  • - Configuration 3: The object has been moved. Therefore, it has two versions. The green icon (object 17) indicates that the point is active. The earlier version (object 16) appears in blue. It corresponds to the current version in configuration 2. This geometry is associated with an earlier version in configuration 3.
  • - Configuration 4: the point has been moved again, which generated a new version of the object (object 18). At this stage, there are two earlier versions of the entity (object 16 and 17).
Figure 5. Viewing the current state of an object according to the date set by the user.
Futureinternet 04 00265 g005

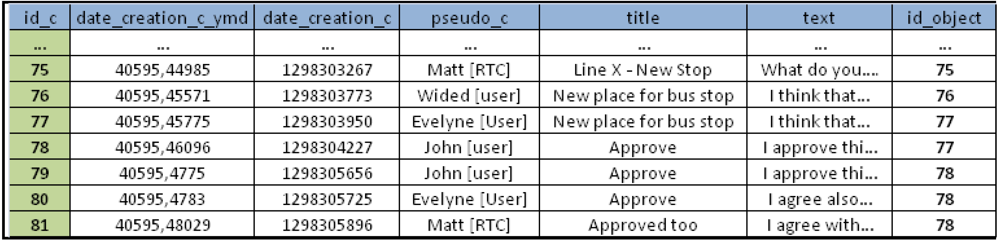
3.3.3. Managing Traceability of the Descriptive Component

Textual descriptive data allow the characterizing of an object. Each descriptive data entity is allocated to a specified version of an object, but not to the object as a whole. Consequently, some versions of an object contain one or more comments, whereas some others have none. As for the geometry, the descriptive component, also called “comment entity”, holds the following properties: a unique identifier (number), author, creation date, a title and its content (text of the comment). Each comment is associated with a specific version of the object via the unique ID (and not to the entity ID, because a comment is allocated to a version of the object, and not to the entity as a whole).

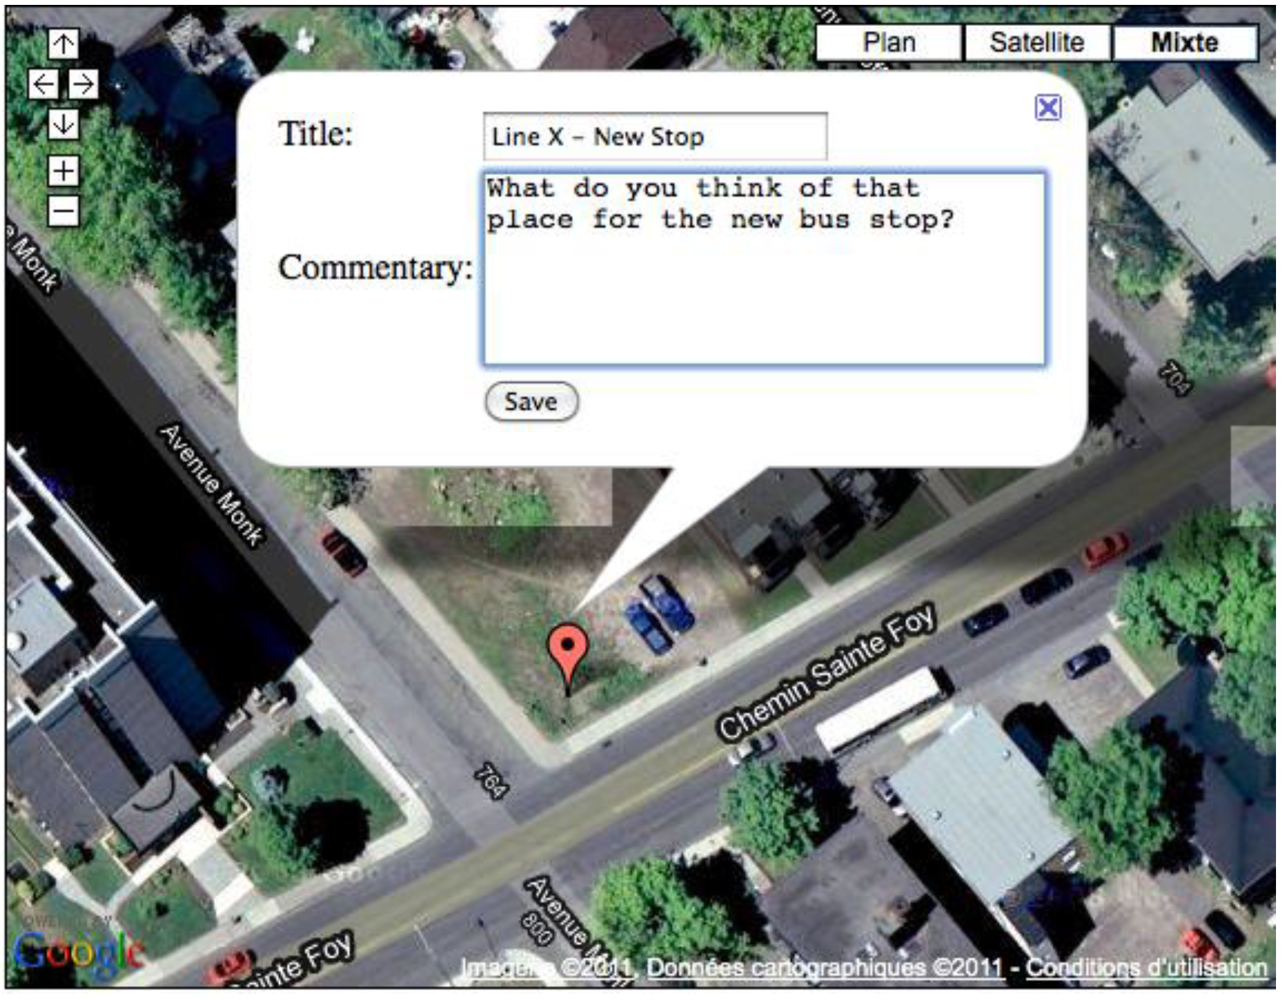
3.4. Use Case as Proof of Concept

This WikiGIS application is at an early prototype stage. So far, we have mainly worked on the development of the traceability functionalities. One of the next stages will be dedicated to systematic usability tests, in order to improve its robustness. These tests will focus especially on proper user-centered design of the Graphical User Interface (GUI).
At this stage, the use case is intended to illustrate the relevance of the WikiGIS in supporting collaboration between various actors. The example chosen here consists of simulating the installation of a new bus stop and a new bus line. The context is as follows (Figure 6): the bus lines 18 and 800 of the Réseau de Transport de la Capitale (RTC) respectively connect to the Lower Town and the Upper Town of Quebec, following a southwest/northeast route. The 18 line is a secondary line (low number of passengers and limited frequency). The 800 line is a main line (high number of passengers and high frequency service). The project suggests the installation of a southeast/northwest connection (line X), crossing both existing lines between the residential development of Vanier and the Plains of Abraham, and of a bus stop providing connection to the other lines.
Figure 6. Initial situation.
Futureinternet 04 00265 g006

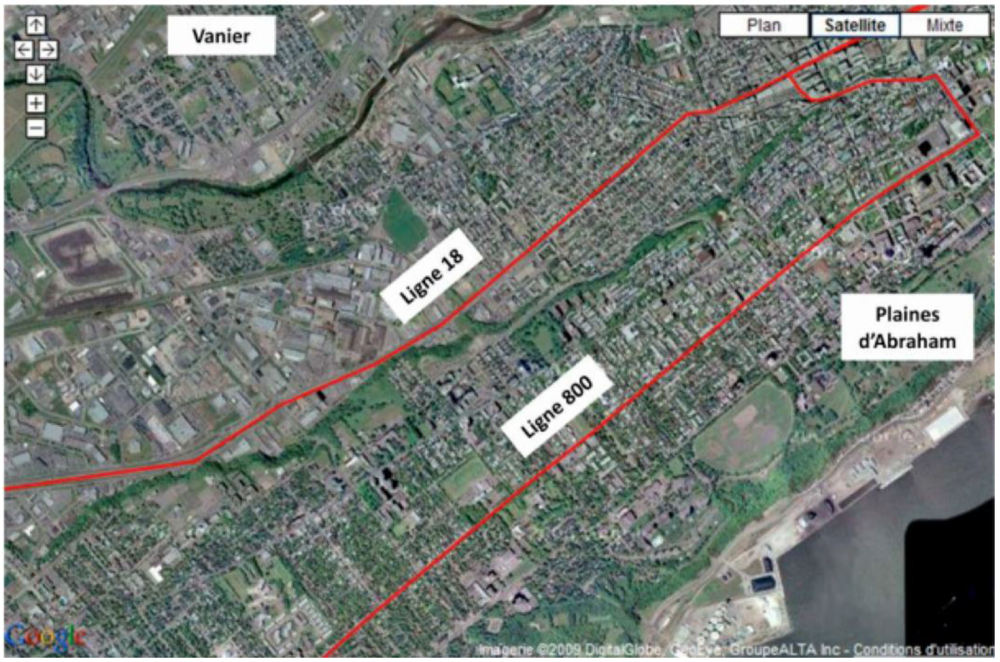
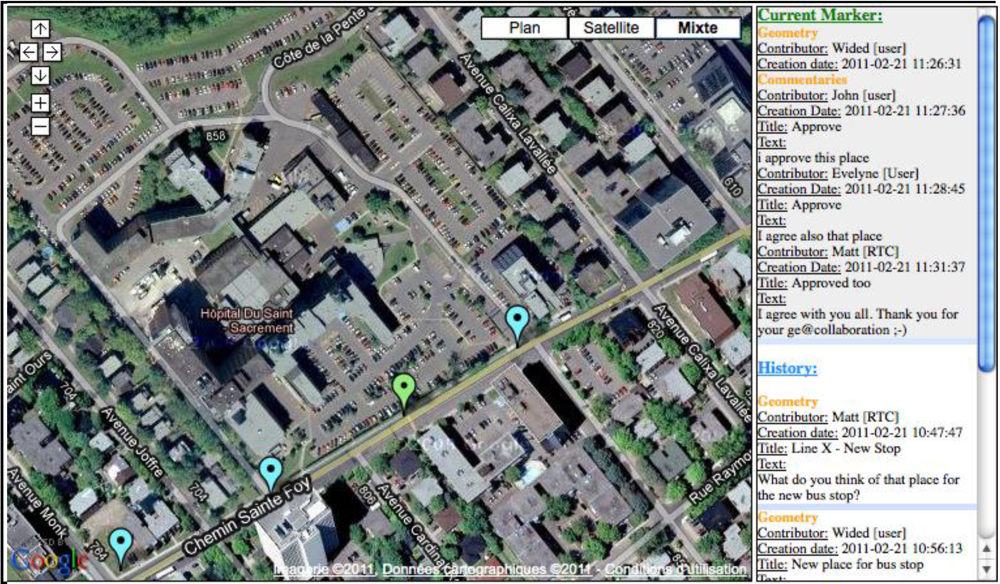
3.4.1. Creation of a New Bus Stop and Modification of Its Installation

A first proposal of where the bus stop should be located is submitted by Matt, an employee of the RTC. He creates a user account, selects the editing mode and adds the first marker along with a comment (Figure 7).
Figure 7. First point is added.
Futureinternet 04 00265 g007
This action generates a new bus stop point in the marker table. A new line is also created in the comment table of the database (Figure 8). This object (n°75) has only one version at that stage. Therefore, its geometric and history identifiers are identical. The object identifier in the comment table allows the comment to be linked to the object (Figure 9).
Figure 8. Marker table (object n°75).
Futureinternet 04 00265 g008
Figure 9. Comment table (object n°75).
Futureinternet 04 00265 g009
A transport user, Wided, modifies the location of the bus stop and justifies her action with a comment. A new line, with the new version of the marker, appears. Both versions are linked by their history identifier (id_object). Later on, Evelyne, modifies again the location of the bus stop and justifies his action with a comment. John, another transport user, leaves a comment to approve this new location. But Wided is not satisfied of this new place. She proposes a new bus location of the bus stop. John and Evelyne approve this location with comments. Matt, also satisfied with this last modification, decides to validate John’s choice. He simply comments on the last location of the bus stop to inform transport users of his approval (Figure 10). Thereafter, the marker table (Figure 11) contains the four bus stop locations that have been successively put forward by Matt, Wided, Evelyne and John, linked together by the same history identifier. As shown in Figure 12, where the current marker is green and historic marker in blue.
Figure 10. Comment table: object n°75, n°76, n°77 and n°78.
Futureinternet 04 00265 g010
Figure 11. Marker table: object n°75, n°76, n°77 and n°78.
Futureinternet 04 00265 g011
Figure 12. Visualization of the different positions of the point, with its associated comments.
Futureinternet 04 00265 g012

3.4.2. Addition of a New Bus Line and Modification of Its Route

The installation of the bus line follows the same process as for the installation of the bus stop. The polyline can be changed at any time by any actor having a user account. The same method with identical colors is applied to the management of traceability. The figure below (Figure 13) repeats the same simulation as the one detailed previously regarding the installation of the bus stop. Comments highlight the dynamics of the decision-making process regarding the bus route. Matt made the first suggestion (blue route). This solution was then modified by Evelyne (yellow route). John supported this modification and mentioned that the route should serve the secondary school. Finally, Matt proposed a new route (green), which was validated by John and Evelyne, thereby providing the final solution.
Figure 13. Visualization of the different routes with their associated comments.
Futureinternet 04 00265 g013

4. Conclusions

The chief strength of the WikiGIS, compared to other existing applications, is its efficiency in keeping documented track of the geometric and descriptive components of the entities on the map. Be it a point, a polyline, a polygon or a comment, each action (moving an object, modifying the geometry, adding descriptive information, etc.) is stored in the WikiGIS database, and associated with an author and a date. The dynamic archival of all actions provides a comprehensive picture of the way objects are created and evolve on the map from contributor to contributor, just like a Wikipedia article. The notion of time being taken into account in the collaborative creation of objects, the spatio-temporal evolution of the layout of a bus route or an area can be visualized. Combining the principles of iteration and traceability that are specific to Wikis with that of geo-referenced argumentation of Argumaps, the WikiGIS has become a comprehensive tool providing real-time or ex-post dynamic access to the process of collaborative geo-referenced knowledge creation, while keeping track of every action.
The research on WikiGIS should provide also advanced contributions for sciences, and especially geographical information sciences. WikiGIS system represents an innovative direction to improve the existing research topics, such as public participation GIS (PPGIS) or geodata crowdsourcing in the new field of VGI (e.g., the French mapping agency does research in order to use the “deltification” management functions to deal with differentiated crowdsourced contributions and updates). In the following research projects we particularly think about using the tracking log to analyze user's behavior and motivations, and to identify what trends that specific user/group will be (that is precisely one of the main issues identified during the last Vespucci Summer Institute in VGI). The analyzed result could become an additional benefit (as a feedback) to the improvement of our user-interface or could also be proposed as a better way for PPGIS practices.
The prototype presented here is a first version of a work-in-progress Therefore, the prospects for further technical improvements are promising. In particular, we plan to focus on:
  • - Management and dynamic traceability capacities of the graphic component. Other characteristics could be added such as style or weight of a line, transparency, etc.,
  • - Adding screen tips on markers,
  • - Adding complementary characteristics regarding the contributors (technical level, dependability, personal information, history, as well as a level of confidence in their own contributions),
  • - Expanding the current metadata fields in order to ensure compliance with international spatial data metadata standards (e.g., ISO 19115),
  • - Capacities to integrate multimedia items into comments,
  • - A system for the collective assessment of the contributions, based on a voting system or a consensus-building mechanism (such as Delphi for instance),
  • - Formal project management capabilities to efficiently support authoritative projects,
  • - Creating of a hierarchy of users (with the possibility to change level depending on the contributions, as in forums or Wikimapia for example),
  • - The possibility to modify a contribution (such as deletion),
  • - Displaying users’ contributions,
  • - The possibility to import (and export) GIS files (interoperability between standard formats and GeoWeb formats),
  • - Replacement of the linear temporal slider by a temporal query tool that takes into account a non-linear conception of time (system of temporal trees for example).
In order to achieve these technical enhancements, a few preliminary research steps should be undertook. First, a validation survey–of the conceptual framework on which the WikiGIS has been designed and developed- is already scheduled and will be carried out by the end of spring 2012. Secondly, in fall 2012 a test with a group of students engaged in an urban design studio (in collaboration with colleagues from the school of Architecture and Planning) will be performed, aiming at validating the WikiGIS usability. Third, the WikiGIS should be used as the main cartographic component in a participatory prospective planning survey leaded by the city council in fall 2013. This survey will be the opportunity to undertake our own survey with real practitioners and citizens.
Between collective intelligence and open networks, this new type of online mapping paves the way for geo-referenced collective intelligence development, and stands as a new paradigm in the design and use of maps and of geographic information. The democratization of online consumer mapping services combined with the development of mobile solutions provide various types of users with effective means to overlay information and services on traditional maps, thus improving substantially the added value of maps. With the development of wiki-type mapping applications, map design can now be achieved through local knowledge management, in which the project participants can freely modify contents by exchanging and confronting their knowledge and points of view.

Acknowledgments

The authors acknowledge the Natural Sciences and Engineering Research Council of Canada – NSERC for the financial support provided to this project (discovery grants program).

References

  1. Herring, C. An Architecture of Cyberspace: Spatialization of the Internet; U.S. Army Construction Engineering Research Laboratory: Champaign, IL, USA, 1994. [Google Scholar]
  2. Tapscott, D.; Williams, A.D. Wikinomics: Wikipédia, Linux, You Tube–: Comment L'intelligence Collaborative Bouleverse L'économie; Pearson/Village mondial: Paris, France, 2007. [Google Scholar]
  3. Goodchild, M.F. Citizens as voluntary sensors: Spatial data infrastructure in the world of Web 2.0. Int. J. Spat. Data infrastruct. Res. 2007, 2, 24–32. [Google Scholar]
  4. Haklay, M.; Singleton, A.; Parker, C. Web Mapping 2.0: The Neogeography of the GeoWeb. Geogr. Compass 2008, 2, 2011–2039. [Google Scholar] [CrossRef]
  5. Crampton, J. Mapping without a Net: Neogreography in the 21st century. Global GIS Academy. Virtual Seminar Session: Neogeography. Available online: www.slideshare.net/ubikcan/ crampton-ggisa-presentation-686101 (accessed on 5 March 2012).
  6. Rinner, C.; Kessler, C.; Andrulis, S. The use of Web 2.0 concepts to support deliberation in spatial decision-making. Comput. Environ. Urban Syst. 2008, 32, 386–395. [Google Scholar] [CrossRef]
  7. Brent Hall, G.; Chipeniukb, R.; Feick, R.D.; Leahy, M.G.; Depardaye, V. Community-based production of geographic information using open source software and Web 2.0. Int. J. Geogr. Inf. Sci. 2009, 24, 661–781. [Google Scholar]
  8. Roche, S. De la cartographie participative aux WikiSIG. In Les SIG au Service du Développement Territorial; Walser, O., Thévoz, L., Joerin, F., Schuler, M., Joost, S., Debarbieux, B., Dao, H., Eds.; Presses polytechniques et universitaires romandes: Lausanne, Switzerland, 2011; pp. 117–129. [Google Scholar]
  9. Scharl, A.; Tochtermann, K. The Geospatial Web: How Geobrowsers, Social Software and the Web 2.0 Are Shaping the Network Society; Springer: London, UK, 2007. [Google Scholar]
  10. Sample, J.; Shaw, K.; Shengru, T.; Mahdi, A. Geospatial Services and Applications for the Internet; Springer: New York, NY, USA, 2008. [Google Scholar]
  11. Hudson-Smith, A.; Crooks, A.; Gibin, M. NeoGeography and Web 2.0: Concepts, tools and applications. J. Locat. Based Serv. 2009, 3, 118–145. [Google Scholar] [CrossRef]
  12. Dodge, M.; Kitchin, R.; Perkins, C. Rethinking Maps. New Frontiers in Cartographic Theory; Routledge: London, UK, 2009. [Google Scholar]
  13. Haklay, M. Interacting with Geospatial Technologies; J. Wiley & Sons: Chichester, UK, 2010. [Google Scholar]
  14. Deitel, P.; Deitel, H. AJAX, Rich Internet Applications, and Web Development for Programmers; Pearson Prentice Hall: Upper Saddle River, NJ, USA, 2008. [Google Scholar]
  15. Cetin, H. Geographic Information Systems and the Internet. In The Internet Encyclopedia; Bigdoli, H., Ed.; Wiley: New York, NY, USA, 2004; Volume 2, pp. 23–37. [Google Scholar]
  16. Coleman, D.J.; Georgiadou, Y.; Labonte, J. Volunteered Geographic Information: The nature and motivation of produsers. Int. J. Spat. Data Infrastruct. Res. 2009, 4, 332–358. [Google Scholar]
  17. Bruns, A. Blogs, Wikipedia, Second Life, and Beyond. From Production to Produsage; Peter Lang: New York, NY, USA, 2008. [Google Scholar]
  18. Borghoff, M.; Schlichter, J.H. Computer-Supported Cooperative Work: Introduction to Distributed Applications; Springer: Berlin, Germany, 2000. [Google Scholar]
  19. Levan, S.K.; Vickoff, J.P. Travail Collaboratif sur Internet: Concepts, Méthodes et Pratiques des Plateaux Projet; Vuibert: Paris, France, 2004. [Google Scholar]
  20. Pornon, H.; Noucher, M. Bilan et perspective de 20 années de géomatique: Vers des SIG plus collaboratifs, la Géo-collaboration. Géomatique Expert 2007, 58, 56–60. [Google Scholar]
  21. Jankowski, P.; Nyerges, T.L.; Smith, A.; Moore, T.J.; Horvath, E. Spatial group choice: A SDSS tool for collaborative spatial decision-making. Int. J. Geogr. Inf. Sci. 1997, 11, 577–602. [Google Scholar]
  22. MacEachren, A.M. Cartography and GIS: Extending collaborative tools to support virtual teams. Prog. Hum. Geogr. 2001, 25, 431–444. [Google Scholar]
  23. Jankowski, P.; Nyerges, T.L. Geographic Information Systems for Group Decision Making: Towards a Participatory, Geographic Information Science; Taylor & Francis: London, UK, 2001. [Google Scholar]
  24. MacEachren, A.M.; Brewer, I. Developing a conceptual framework for visually-enabled geocollaboration. Int. J. Geogr. Inf. Sci. 2004, 18, 1–34. [Google Scholar]
  25. Balram, S.; Dragicevic, S. Collaborative Geographic Information Systems; Idea Group Inc.: London, UK, 2006. [Google Scholar]
  26. Hopfer, S.; MacEachren, A.M. Leveraging the potential of geospatial annotations for collaboration: A communication theory perspective. Int. J. Geogr. Inf. Sci. 2007, 21, 921–934. [Google Scholar]
  27. Sidlar, C.; Rinner, C. Utility assessment of a map-based online geo-collaboration tool. J. Environ. Manag. 2009, 90, 2020–2026. [Google Scholar]
  28. Maiyo, L.; Kerle, N.; Köbben, B. Collaborative Post-disaster Damage Mapping via Geo Web Services. In Geographic Information and Cartography for Risk and Crises Management: Towards Better Solutions; Konecny, M., Zlatanova, S., Bandrova, T.L., Eds.; Springer: New York, NY, USA, 2010; pp. 221–231. [Google Scholar]
  29. Noucher, M. Coproduction de données géographiques: du compromis au consensus... différencié. Conditions et démarches participatives pour produire ensemble des données sur le territoire. Rev. Int. Géomat. 2008, 18, 471–492. [Google Scholar]
  30. Beyerlein, M.; McGee, C.; Klein, G.; Nemiro, J.; Broedling, L. The Collaborative Work Systems Fieldbook: Strategies, Tools, and Techniques; Jossey-Bass/Pfeiffer: San Francisco, CA, USA, 2003. [Google Scholar]
  31. Dillenbourg, P.; Huang, J.; Cherubini, M. Interactive Artifacts and Furniture Supporting Collaborative Work and Learning; Springer: New York, NY, USA, 2009. [Google Scholar]
  32. Blaise, J.-Y.; Dudeck, I. Modélisation informationnelle: Un cadre méthodologique pour représenter des connaissances évolutives spatiales. RNTI-E 2006, 6, 347–358. [Google Scholar]
  33. Leuf, B.; Cunningham, W. The Wiki Way: Quick Collaboration on the Web; Addison-Wesley: Boston, MA, USA, 2001. [Google Scholar]
  34. West, J.A.; West, M.L. Using Wikis for Online Collaboration: The Power of the Read-Write Web, 1st ed; Jossey-Bass: San Francisco, CA, USA, 2009. [Google Scholar]
  35. Ebersbach, A.; Glaser, M.; Heigl, R.; Dueck, G. Wiki: Web Collaboration; Springer: Berlin, Germany, 2008. [Google Scholar]
  36. Longley, P.; Goodchild, M.F.; Maguire, D.J.; Rhind, D.W. Geographic Information Systems and Science, 2nd ed; John Wiley and Sons: New York, NY, USA, 2005. [Google Scholar]
  37. Sui, D. The Wikification of GIS and its consequences: Or Angelina Jolie's new tatoo and the future of GIS. Comput. Environ. Urban Syst. 2008, 32, 1–5. [Google Scholar]
  38. Ciobanu, L.D.; Roche, S.; Badar, T.; Caron, C. Du Wiki au WikiSIG. Geomatica 2007, 61, 137–145. [Google Scholar]
  39. Flanagin, A.; Metzger, M. The credibility of volunteered geographic information. GeoJournal 2008, 72, 137–148. [Google Scholar]
  40. Grira, J.; Bedard, Y.; Roche, S. Spatial data uncertainty in the VGI world: Going from consumer to producer. Geomatica 2010, 64, 61–71. [Google Scholar]
  41. Haklay, M. How good is volunteered geographical information? A comparative study of OpenStreetMap and Ordnance Survey datasets. Environ. Plan. B: Plan. Des. 2010, 37, 682–703. [Google Scholar] [CrossRef]
  42. Haklay, M.; Basiouka, S.; Antoniou, V.; Ather, A. How many volunteers does it take to map an area well? The validity of linus’ law to volunteered geographic information. Cartogr. J. 2010, 47, 315–322. [Google Scholar]

