Article

How Can We Study Learning with Geovisual Analytics Applied to Statistics?

1
Department of Social and Welfare Studies, Linköping University, Holmentorget 19, 601 74 Norrköping, Sweden
2
National Centre for Visual Analytics, NCVA, Linköping University, Campus Norrköping, 601 74 Norrköping, Sweden
*
Author to whom correspondence should be addressed.
Future Internet 2012, 4(1), 22-41; https://doi.org/10.3390/fi4010022
Submission received: 21 November 2011 / Revised: 13 December 2011 / Accepted: 19 December 2011 / Published: 30 December 2011
(This article belongs to the Special Issue Geovisual Analytics)

Abstract

:
It is vital to understand what kind of processes for learning that Geovisual Analytics creates, as certain activities and conditions are produced when employing Geovisual Anlytic tools in education. To understand learning processes created by Geovisual Analytics, first requires an understanding of the interactions between the technology, the workplace where the learning takes place, and learners’ specific knowledge formation. When studying these types of interaction it demands a most critical consideration from theoretical perspectives on research design and methods. This paper first discusses common, and then a more uncommon, theoretical approach used within the fields of learning with multimedia environments and Geovisual Analytics, the socio-cultural theoretical perspective. The paper next advocates this constructivist theoretical and empirical perspective when studying learning with multiple representational Geovisual Analytic tools. To illustrate, an outline of a study made within this theoretical tradition is offered. The study is conducted in an educational setting where the Open Statistics eXplorer platform is used. Discussion of our study results shows that the socio-cultural perspective has much to offer in terms of what kind of understanding can be reached in conducting this kind of studies. Therefore, we argue that empirical research to analyze how specific communities use various Geovisual Analytics to evaluate information is best positioned in a socio-cultural theoretical perspective.

1. Introduction

We are situated in a rapidly growing and complex digital environment which has in turn increased our dependency on information, but at the same time there is increasing evidence that our information skills are not keeping pace in any systematic fashion. We all need help to sharpen the techniques and skills to manage information. Today more data are produced and access to information is greater than ever before, largely as a result of the development of information and communication technology (ICT). People have, in their daily life, to face the problem of sorting, filtering, interpreting and evaluating huge quantities of information. Keim [1] reported, already at the beginning of the new millennium, that one million terabytes (or one Exabyte) of data were generated globally each year, and that 99% of these were digital. In the coming years, more data will be generated than during all previous human history. How is it possible, in this (over) flow of information and unsorted media, to give people better potential to create their own well-founded meaning to orient themselves and  act and communicate accordingly in a meaningful way [2]?
Connected to this, two distinct but related factors should be emphasized. These are the shifts in (1) handling and (2) communicating information. The first is about the move from the dominance of writing to a new dominance of images [3]. The second is about the move from the dominance of the medium of books to the medium of screens. The combined effects of this will probably produce a deep change in human, cognitive cultural and bodily engagement with the world and the forms and shapes of knowledge. The World Told is a different world to the World Shown [4]. This is something that especially education and schools are faced with and have to think thoroughly about.
In order to support us in our effort to sort and analyze information, new tools and approaches offered by Geovisual Analytics are developed. These tools try to solve some of the problems caused by the overwhelming amount of information. The tools are using the main feature in the shift towards communicating information by using the screen and images/representations. Geovisual Analytics (short for Geospatial Visual Analytics) extends geovisualization research by enhancing purely visual and interactive methods with possibilities provided by computational techniques such as data mining, statistics and optimization [5]. The integration of perspectives from cognitive and perceptual science is also important. Potential enhancements come from developing methods to support analytical reasoning, argumentation and knowledge building [6]. In this process Geovisual Analytics supports and melds innate human abilities of vision and cognition with computer-based visual interfaces that provide connections to relevant data that supports knowledge construction [7]. The tools are capable of identifying applicable data or information patterns within a vast information flow made of multidimensional geographical data. Geovisual Analytics can help identify conditions emerging from e.g., a variation of spatial configurations, monitoring of the data over time and variation over time of numerical values associated with geographical features. Furthermore, also the knowledge communication by publishing and storytelling methods is of significance for Geovisual Analytics [7]. The tools are used increasingly in the process of knowledge building, decision support, disaster management and information communication [8].
Lately Geovisual Analytics have been applied also in educational activities in schools [9]. The technology has been found to be supportive for teachers and students as the tools process and visualize large parts of the spatial and temporal data that modern society, as well as educational institutions, has to deal with. The ubiquitous availability of Geovisual Analytics gives possibilities for educators to incorporate these powerful tools into a variety of subject courses and teaching practices. There are very few studies of the potential for teachers and their students to harvest the tools, to explore and learn via geovisual educational material. This ought to be the focus of further investigation. Looking at research on learning with multi-representational software in general, where the focus often has been to find out if multiple-representational technology is effective as learning environments, research has indicated that Web supported teaching and learning can provide access to a rich and varied amount of information sources as well as freedom for students to search for, select and organize information [10]. However, the studies also indicate that assessing the credibility and authority of information sources in Web environments can cause serious problems for students. Learners can find such environments overwhelming to the extent that students may even risk becoming “losers” through the Web [11,12]. It is common that there is neither time nor energy to transform the digital information flow into meaning in school activities. Mostly the students are left with their information from the seeking sequence without help or questioning discussions [13,14]. Evidence exists that in the worst cases such environments are not just neutral but can even harm learning [15,16,17,18,19]. Consequently, it is increasingly important to develop formal learning contexts, including technology, so the possibilities for a growing ability to access, evaluate, organize and use information in order to learn, problem-solve, and make decisions are offered. Again, Geovisual Analytics can be a useful alternative for students and give valuable contributions to their learning, but in order to obtain knowledge on the constructed learning processes, research questions have to be formulated. The questions ought, according to the discussion, to change from the simplistic “is multiple-representational technology an effective learning environment” to “Under what circumstances, with which design factors, for which learners, performing which tasks and expecting what outcomes, are such tools efficient”. To be able to answer that kind of questions the theoretical perspectives; design and methods have to be considered most critical. Therefore, to conduct a study of learning with Geovisual Analytics, which are more than neutral tools enabling transmission of messages or providing access to information, our understanding of the activities in the learning process needs to be founded on a well-formulated perspective on the nature of learning with technical artifacts.
As an example of the implications from the theoretical perspective accentuated in this paper, a study conducted within the socio cultural tradition is presented. The focus in the study was young students’ use and learning processes when employing The Open Statistics eXplorer-platform—a Geovisual Analytics (Figure 1). Children employed this application and its interactive multiple external representations (MERs) in their school activities—in their process of learning. The Open Statistics eXplorer platform includes a collection of innovative geographic and information visualizations adapted to statistics data handling for geovisual analysis, collaboration and publication processes [20].
Figure 1. Open Statistic eXplorer with 3 time-linked views showing the world “fertility rates” during 1960–2008; map, scatter plot (fertility rate vs. age 0–14) and time chart; comparing 4 countries Nigeria, South Africa, China and Italy. The story is published on the right side. Students learn that central Africa maintains a high fertility rate (Nigeria), while South Africa started in 1960 at the same level but then shows a reduced trend. The students can interact and change indicators to discover reasons behind this trend and gain knowledge. http://www.ncomva.se/v4/world/#story=0.
Futureinternet 04 00022 g001
To summarize, the paper begins by scrutinizing its purpose and aim. Next, the paper clarifies the most common learning theories applied when studying learning in such environments. It discusses the socio-cultural theoretical perspective on learning, advocating the latter to be applied for studying the complexity of learning when using these kinds of environments. The paper elucidates the implications a socio-cultural perspective can have upon the research design and methods. To contrast this, the paper gives an example of a study which focuses on students’ learning activities and their knowledge construction, when they are employing a Geovisual Analytics–the Open Statistics eXplorer platform. Finally some conclusions are drawn.

2. Purpose and Aim

The purpose of the present article is to argue that having acknowledged the complexity of the first question, “Is multiple-representational technology an effective learning environment” we now need to adjust and develop research methodologies for the new complexity that the second question poses “Under what circumstances, with which design factors, for which learners, performing which tasks and expecting what outcomes, are Geovisual Analytics efficient. We will argue that to really understand learning with multiple-representational environments, we needed to close this quote by adjusting conventional methods and employing methodologies that are more appropriate in supporting this.
The aim is to highlight what factors the socio cultural theoretical perspective implies when studying learning with Geovisual Analytics, since there are important questions that need to be answered: What do we know about teachers’ management of Geovisual Analytics when used in education and as educational material? What do we know about the tools’ usability for learners’ knowledge construction and elucidating meaning? and what do we know about the processes of how visualized information turns into knowledge for the learners? The aim is not to answer these questions; it is rather to suggest methods that make itpossible to answer those questions that are the central topic in this paper. It is to suggest a useful theoretical perspective, and illustrate how a research project carried out within that perspective can be designed.
The next section discusses common theoretical approaches but also a perspective not so commonly used within the fields of learning with multimedia environments, geovisualization and Geovisual Analytics—the sociocultural theoretical perspective.

3. Studying Learning with Geovisual Analytics

Learning theories tend to fall into one of several perspectives or paradigms, such as behaviorism, cognitivism or constructivism. When evaluating learning with multimedia environments the dominating approach is built on cognitive theories. Another theory connected to the paradigm of constructivism–the socio-cultural perspective of learning–gives an alternative view for studying the learning process and outcome.

3.1. Dominating Theories and Approaches Within the Field

When studying learning in multimedia environments such as Geovisual Analytics, the most common approach is built on cognitive theories. The cognitivistic paradigm essentially argues that the “black box” of the mind should be opened and understood. The learner is viewed as an information processor, with input to working memory and long-term memory as in a computer. The two most commonly applied theories are:
The Cognitive Load Theory of Multimedia Learning [21,22]
The Cognitive Theory of Multimedia Learning [23,24,25]
These theories can be said to have a focus on the nature of working memory (and its relation to long-term memory), with its multiple modality-specific, limited-capacity subsystems. They identify the benefits that can accrue by presenting information using multiple modalities so that learners who actively process such information can profit from this. In short, cognitive construction depends on the cognitive processing of the learner during learning [24]. In this tradition, what Goldman [26] called “first generation research or experimental approaches” have been applied to explore the effectiveness of multimedia learning. A typical design, presented by Ainsworth [19], may be considered to have the following characteristics,
participants for a study or an experiment are recruited in return for a small amount in reward for their time;
the participants are seen as having “no prior knowledge” of the area or they may be given a short pen and paper multi-choice pre-test to check that they have little prior knowledge of the concepts of the domain and then they are randomly assigned to two groups;
the first group receives the special multimedia condition that has been previously designed to be “good” according to the predictions of a current fashionable theory. The second group receives the same material but in a text-only control;
a short orientation phase is provided to ensure that students know how to use the interface. They then learn with this material for 30 minutes and are then immediately given a pen and paper multi-choice post-test of the domain concepts, which typically will include some harder elements than the pre-test;
the participants are debriefed, thanked for their participation and told not to sign up for further experiments. The whole experience takes about an hour; and
the multimedia group does most often statistically better on the post-test than the control group and the results are interpreted to support the predictions of the current theory.
These kinds of methodologies have limits, but of course also desirable characteristics. For instance, the widespread acceptance of the theories means that a substantial number of researchers are contributing to the field and this helps in building robust and replicable results; these experimental studies use statistical methodologies to show if the results are justified or not; this kind of study makes it possible to publish negative data as well as positive; and the studies provide opportunities to control the experiments.
However, there are many ways that experiments such as the one described above could be improved to increase our understanding of the processes taking place. For example, this kind of experimental study disregards a key aspect of multimedia learning, namely that people differ in what and how they learn. Often, the level of detail these studies present about the design of the multimedia environment used is insufficient and the task characteristics are often problematic in different ways. For instance, is it the tool in itself which is difficult to handle? Is there always a correct answer? Is the amount of time for solving problems sufficient? Also, learners differ with regard to goals, motivation and abilities, and there is the difficulty of measuring learning outcome characteristics with different kinds of multi-choice or true or false tests. The problem here is what kind of learning or knowledge is possible to be measured or studied? These questions highlight the need for collecting much richer data. There is a need to widen the theoretical stance to understand how representations influence learning.
Our suggestion is that there are other and maybe more useful and appropriate theoretical perspectives on learning when studying multi-media learning environments. In the next section, the socio-cultural theory is described and advocated as plausible for investigating interacting characteristics of learning with multimedia. Further on it will also be illustrated how a study conducted within this perspective can be performed.

3.2. The Socio-Cultural Theoretical Perspective

Current conceptualizations of socio-cultural theory draw heavily on the work of Vygotskij [27,28], as well as later theoreticians such as Wertsch and Driscoll [29,30,31,32]. According to Tharp and Gallimore [33], the socio-cultural perspective has profound implications for teaching, schooling and education.
Vygotskij addresses the humanness of mental activity. Learning is a social process with internalization of cultural signs and symbols and is dependent on culture and social relationships. The major theme of Vygotskij’s theoretical framework is that social interaction plays a fundamental role in the development of cognition. Vygotskij argues that learning or a child’s development cannot be understood through a study of the individual. We must also examine the external social world in which that individual life has developed. Through participation in activities that require cognitive and communicative functions, children are drawn into the use of these functions in ways that nurture and “scaffold” them. Kublin et al. [34] succinctly state that Vygotskij [30] described learning as “being embedded within social events and occurring as a child interacts with people, objects, and events in the environment”.
As mentioned, not only people but also objects and events are important features for learning in a socio-cultural perspective. Tools and symbols are therefore of significance in this perspective of learning. Tools can be seen as intellectual or physical artifacts. Connected with these, central foundations are language,mediation andmeaning making.
Language helps people to accumulate knowledge, insights and understanding by individuals or collectively. It is humans’ symbolic language that separates us from other creatures when it comes to building, expressing and transmitting knowledge and experiences. Language, acquired as a cultural tool, is used to organize our thinking. We use our language to process the interpersonal (interaction with others) to the intrapersonal (interactions with our own thoughts and experiences). As Vygotskij [27] states,
Every function in the cultural development of a human appears twice: first, on the social level, and later, on the individual level; first, between people (inter-psychological) and then inside the child (intra-psychological) (p. 57).
Language is the link between the inner and the outer world and allows us to express and retell insights and understanding. Through language the human being is a creator of cultural signs which are possible to pass on between individuals in social interactions or with the help of physical artifacts. These interactions can be likened to the mediation of a cultural repository.
Mediation happens in different ways, by intellectual artifacts such as the alphabet, units of measurements, conceptions and discourses, i.e., by linguistically held knowledge, but also by physical artifacts such as spades, needles, computers and other technology. The visual and partly text-based communication within a Geovisual Analytics environment creates a language of images, signs and symbols. The meaning of these has been created by agreements between people. Within the intra- and interphysiological processes, signs and symbols are mediated. This is what Vygotskij refers to as “semiotic mediation” (semiotics is the science of signs and symbols). Mediation, a type of interpretation, is created through every individual’s knowledge within the actual area, where the individual’s present knowledge gives possibilities to be developed and passed on to others. Säljö [35] argues that this process can be intentionally conceived or accidental.
Meaning making is a constantly ongoing process where people are trying to understand their context or surroundings. According to this, or within this, culture plays a major role in individuals’ learning and providing goals and the methods through which to achieve them. This creation of meaning consists of concepts where different notions exist between people. This is another part of Vygotskij’s theory–the idea that the potential for cognitive development depends upon the “zone of proximal development (ZPD)”: a level of development attained when people engage in social behavior. Full development of the ZPD depends upon full social interaction. The range of skills that can be developed with adult guidance or peer collaboration exceeds what can be attained alone.
This perspective on learning has advantageous characteristics but it also has its limitations. Some criticism is that it may be more complex to compare results from different studies and that the opportunities to control a study to help building robust and replicable results may be more complicated. Also, the qualitative methodologies do not give exact, measurable outcomes and possibilities to publish negative data as well as positive, which makes it difficult to show whether the results are justified or not. Within the socio-cultural perspective this criticism becomes more or less irrelevant, because the conditions, the context and the learners can never be the same and the possible variety of results may instead build a more broad understanding of the learning taking place. In a socio-cultural perspective,meaning making is a continuous, ongoing process where people differ and in some ways the differentiation may be a valuable contribution to the results. In a socio-cultural perspective, the tool or artifact has a culturally established potential of meaning making in a “matter of affordances”, to use a term used by Gibson [36]. A learning environment creates different framings for learning and it is in the interface between the material resource and the individual framing based on interest, motivation and expectations that the empirical data can be found [3]. These kinds of data are hard to collect in ways other than qualitatively.
Clearly, socio-cultural theory is much more complex than this brief description may lead one to believe. None the less, the aspects described above are important components to consider when examining the communicative and cognitive development of learners. The following section will point to some of these components and discuss the factors implied by this theoretical perspective when studying learning within information visualization and multi-media environments such as those based on the ideas of Geovisual Analytics.

4. Implications for Research Design when Using a Socio-Cultural Perspective

As Wertsch [29], citing Vygotskij, describes learning as being embedded within social events and occurring as individuals interact with other people, objects and events in the environment, there are implications for what kind of research questions that can be addressed; also, the research design and methods are influenced by a socio-cultural theoretical perspective.
The following process gives a foundation for the understanding of learning: staging → interpretation → transforming → representation → reflection. Learning takes place in sequences over time, in interaction with others and with physical artifacts. What can be analyzed are the actions linked to others and the environment, and the choices made, as well as the type of signs of learning that have been created and the type of representations designed. Due to this a study within this perspective has to be conducted in a natural working context and has to take place over a period of time. A concrete example of how a study, therefore was, conducted in the actual school setting will be shown in the next paragraph. That kind of setup provides the possibility to collect data from different sequences and to collect different “signs” of the learning process [3,37,38].
As learning is seen as embedded within social events and occurring as interaction between people and actions in and with the surroundings, we have to consider and examine the external social world of the individuals taking part in a study. The attention should not be drawn to single individuals [39,40]: to design a study as a “one-off” situation in an experimental laboratory with individual pre- and post-tests would be deceptive in this perspective. In a socio-cultural view that kind of design builds on a too narrow apprehension of learning. Therefore the study in this paper is conducted over several weeks in each school.
Moreover, in a socio-cultural perspective of learning it is not possible to see an individual as “empty” and without prior knowledge, as Vygotskij claims that individuals’ pre- or present knowledge is the base for, and enables, learning and developing new knowledge. Pre-knowledge or present knowledge is more of a prerequisite to an individual to be able to go further in the creation of knowledge in interaction with others and with different artifacts. However, phrases like “all participants indicated a low level of prior knowledge” or “the participants had no or low prior knowledge in the domain” [41], which are often used to ensure the correctness of quantitative measurements, are problematic, since they imply that students’ learning can be measured with quantitative methods like pre- and post-tests. In fact, tests like that do not actually say very much about learning. In the socio-cultural perspective, qualitative methods are seen as useful for collecting empirical data that, through analysis, can provide some information about the learning process. These methods are accordingly used in the study discussed further on.
Furthermore, the perspective here advocated also has implications for perspectives on control groups and comparing students’ learning outcomes. To develop perspectives on control groups and comparing students through the lens of a socio-cultural perspective is challenging and even seen as not practicable. As said previously, the individuals of a group or the context of the group could never be the same, only almost be the same. Therefore, to summarize, the design and data collection when studying learning in a socio-cultural perspective ought to be about following the learners’ interactions during the process of learning, in their ordinary context and over some time, rather than about comparing different groups where one group is learning with the multi-media tool and the other, without. It is about following the learners’ different use of the tools, and the intellectual and physical artifacts used in the learning process, such as language, mediation and creation of meaning [35,42]. To follow this, different methods such as observations and interviews are appropriate and suitable [39]. So, if this is the case, what would a study design from a socio-cultural perspective on learning within information visualization and multi-media environments as Geovisual Analytics look like? To get guidance of this, the set up of a conducted study will be elucidated in the remainder of this section.

4.1. An Example of Examining Learning Within a Socio-Cultural Perspective When Using a Geovisual Analytics

In this section, the setup of a study conducted from a socio-cultural perspective on learning is presented. This is an attempt to show some of the implications this theoretical perspective on learning has, and this may be useful in guiding the choice of design and research methods for a research enquiry. The presentation aims at both elucidating the socio-cultural theoretical perspective and gives a picture of the study as such. The study had a focus on learning, with young students using a Geovisual Analytic tool–in this case, the Open Statistic eXplorer platform. The study is a part of a larger on-going research project.

4.1.1. The Study’s Aim and Issues

There are research and usability studies of Geovisual Analytics, but there is a lack of studies performed in educational settings and on young students’ learning when employing these tools [43]. This study, conducted in three primary schools in Sweden, investigated the students’ (aged 10–13 years) use of a Geovisual Analytics. The Geovisual Analytics used provides possibilities for the educator to have an input in the educational planning and orchestrate the teaching. The tool–the Open Statistic eXplorer platform was implemented and applied in social science classes to help educators to communicate progress initiatives, measuring economic, social, educational, health and environmental developments, to young students. It examined,
what the interaction possibilities offered by the Geovisual Analytics mean to the learning process;
the students’ development of knowledge and understanding through visual analytic storytelling methods; and
the students’ experiences when employing Geovisual Analytics in their learning process.
With a major interest in studying human understanding and learning within complex geovisual technology, meaning a mediated learning environment, the research was built on a number of analytical concerns and assumptions derived from the socio-cultural theoretical perspective on learning.
First, in the next section, a presentation of the tool that is implemented in the school setting is given.

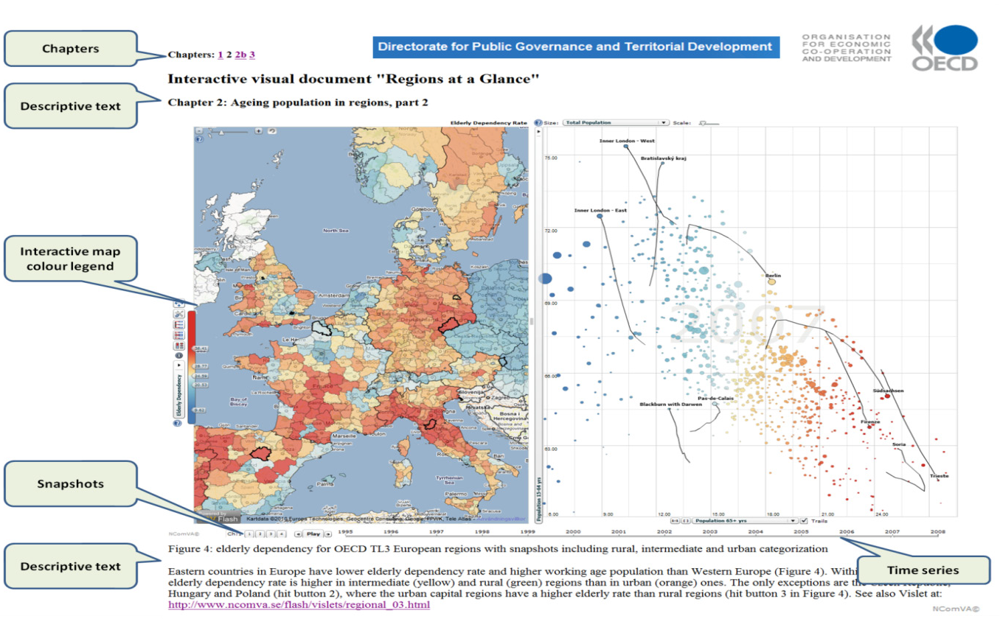
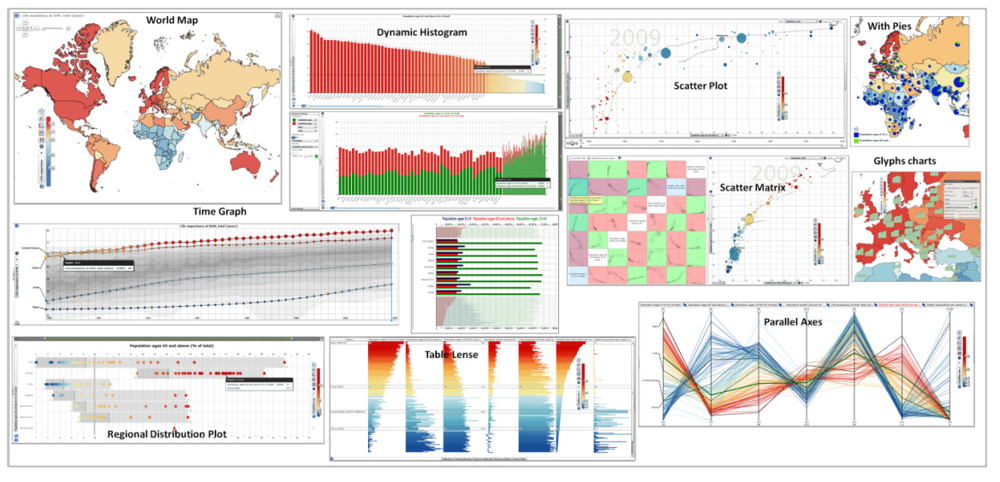
4.1.2. The Geovisual Analytics Used in the Study

The Open Statistics eXplorer platform’s conceptual approach to the authoring and publishing concept is based on three complementary activities: data uploading, storytelling and publishing. It is customized from the Web-enabled GAV Flash class library, programmed in Adobe’s object-oriented language ActionScript, and includes a collection of innovative geographic and information visualizations tailored to statistics data handling [20]. Data are normally preloaded with a set of basic indicators such as demographics, economic indicators, education statistics, etc. but the user can also upload external data through optional database interfaces such as Statistical Data and Metadata exchange (SDMX), PC-AXIS or other application program interface (API) solutions to be mixed with the preloaded data (Figure 2).
The statistics visualizations facilitate information and geographical visualization methods (e.g., choropleth maps, dynamic histograms, table lenses, parallel-axes plots or “profile plots”, scatter plots, scatter matrices, time graphs, and pie graphs, time glyphs and flow maps) (Figure 3) applied and customized for statistics data; they also show hidden data or trends. The bubble plot shows trends but, in contrast to the time graph, no details. The distribution plot presents evidence-based facts on regions and allows comparison within countries. Interactive features that support a spatial analytical reasoning process are applied, such as tooltips, brushing, highlight, visual inquiry and conditioned statistics filter mechanisms that help detect outliers.
Figure 2. The Open Statistics eXplorer provides open data architecture for flexibility. This data interface is based on a programmed application program interface (API) to the World dataBank.
Futureinternet 04 00022 g002
Figure 3. Different methods used with the platform’s information and geographical visualization tools.
Futureinternet 04 00022 g003
The authoring is supported by an innovative mechanism in the visualization toolkit. This in turn supports the capture and storage of interactive events through “memorized interactive visualization views” or “snapshots” that can be captured at any time during the explorative data analysis process in Open Statistics eXplorer and represents an important task of the authoring analytical reasoning process. Publisher is the application tool that imports a story produced by Open Statistics eXplorer and generates the HyperText markup language (HTML) code that represents the story with regions selected and associated indicators. The HTML code is then inserted into a blog or web page (Figure 4). The published material is called a “Vislet”. Vislet is short for Visualization and booklet–a visualized digital small book.
Figure 4. The seamless integration of a teacher authoring tool: importing data, storytelling and publishing interactive education documents for official statistics.
Futureinternet 04 00022 g004
The methodological concept (see Figure 5) allows the educator to;
Choose educational content: The educator’s task starts with choosing data, based on educational goals, and importing them from the World dataBank directly into the Open Statistics eXplorer platform. Statistical indicators and related geographical regions (countries, counties, municipalities, etc.) are uploaded to the platform.
Use the multiple linked views: The educator can simultaneously explore the content and highlight trends and knowledge through:
an interactive map with different interactive features that support a spatial analytical reasoning process, such as tooltips, brushing, highlight, and visual inquiry and conditioned statistics filter mechanisms.
a motion chart: this offers, among others, interactive possibilities to find patterns and connections and discover outliers among the indicators as well as show time series.
time series: this gives the opportunity to dynamically show indicator development over time.
Produce an educational text: the educator can orchestrate the presentation of data/indicators by using the platform’s storytelling functions to produce a descriptive text (a story) in her or his own words, highlight important areas of the content/indicators and provide challenges by asking questions for problem solving.
Create snapshots:in the educational textthe educator is able to highlight different content by including hyperlinks to the dynamically linked views or to other blogs or websites.
Publish the material: the educator can publish the story with help of the publisher tool on a blog or a web page. Now the student can interact with the Vislet which is accessible from any computer. The student has a customized learning opportunity and can start the learning process and knowledge creation.
Figure 5. Example of an interactive educational document based on public Organization for Economic Co-operation and Development (OECD) data. The document includes an educational text, as well as a map, motion chart, snapshots and time series—i.e., the methodological concept.
Futureinternet 04 00022 g005
It is important to present the tool used in a study thoroughly, design, functions and use, as tools or artifacts within the socio-cultural perspective are seen as having a significant influence on what kind of learning process that will be constructed.

4.1.3. Method and Design

The methods and design of this study are influenced by the socio-cultural perspective on learning [30], combined with perspectives on the significance of visual aspects on learning [36]. To grasp the learning conditions the study was therefore carried out in the school context. Three different primary schools in one municipality in Sweden participated, including four teachers and four social science classes (grades 4–6) with altogether 98 students aged 10–13 years. The study was divided into two phases. In the first phase, the teachers were introduced to the tool and tried to make educational plans according to the curriculum, organizing the content and the task by involving use of the Open Statistics eXplorer platform and its storytelling methods for exploring demographics indicators. This means that educational plans, Vislets, were produced based on indicators from the World dataBank. The Vislets were published on the teachers’ educational blogs on the Internet (Figure 6). In phase two, the student groups worked with the different Vislets in all their social science classes for a period of 2–4 weeks.
Figure 6. The process by which teachers converted an educational plan into interactive educational material, a Vislet, on the web, where students interacted with the content.
Futureinternet 04 00022 g006
There were 24 or 25 students working in each class in social science. In each class, one teacher instructed and supported the students. The students were grade 4, 5 and 6 students, 10–11 years, 11–12 years and 12–13 years old, respectively. To decide the setting and content of the Vislets the teachers analyzed the curriculum perspective and educational goals. The students in a class worked together in pairs at one computer. The different classes worked with the Vislets for a period of 2–4 weeks. The Vislets the teachers produced concerned three different regional levels: the national level, the continent and the whole world.
Grade 4, learnt about a region at the national level (Sweden) and the content was about living conditions–the students were supposed to compare differences and similarities between different parts of the country.
Grade 5, worked at the continental level (Europe) and the content covered; living conditions, populations (population density, age distribution, etc.) and education, work and economies.
Grade 6, penetrated global issues including; energy supply, production and use, water access and use of fresh water, population growth, life expectancy, infant deaths, and environmental issues, e.g., CO2 levels, and economic wealth.
In a study of learning within a socio-cultural perspective the focus is on the process of learning rather than the outcome or the results. In this context three concurrent factors ought to be considered, namely: How do intellectual tools develop? How does the use of physical artifacts develop? and What do communication and co-operation look like in collective human contexts [44]? To address these factors the study’s methodological position was connected to the growing body of video-based studies of social interaction and the use of technologies [45].
Related to this three different qualitative methods for collecting empirical data were chosen, (1) video observations to (a) follow the students when working with the tool, and (b) focus on the communication between the children, and (c) the ways the children were interacting with the tool and each other; (2) speak-aloud interviews to investigate the students’ experiences, learning processes and understanding when using the Vislets; and (3) document collection of the students’ own work produced from their learning process, in order to analyze mediation and meaning making. The method of data collection was selected so as to give an insight into how intellectual tools develop, how the use of physical artifacts develops and what the communication and cooperation looked like in a collective human working context–the school. Both the video observations and the speak-aloud interviews were done with Camtasia software (published by TechSmith, Okemos, Michigan) which offers the possibility to collect sound and images using web-cams on the computers and at the same time record what is happening on the screen. This allowed us to collect data on a combination of the students’ usage, communication, mediation and signs of learning.
Consent for the data collection was obtained by asking the participating teachers, students and their parents for consent. They were all informed about the study, that participation was voluntary and that they could leave the study at any time. The empirical material has been treated as one unity and no comparisons have been made among the different grades.

4.2. Overview of Findings in This Study

The aim of this paper was to discuss theoretical perspectives that make itpossible to answer questions about teachers’ management of Geovisual Analtyics when used in education and as educational material; about the tools’ usability for learners’ knowledge construction and meaning making and about the processes of how visualized information turns into knowledge for the learners. It was not to answer these kinds of questions. The presented study was described to illustrate implications of the advocated socio-cultural theoretical perspective, implications for the set up of a study, not to give a report on its results. Anyway, an account of the result in the presented study is of course of interests also in the view of the advocated theory of learning.
Therefore an overview of the results from the study, and what they indicate, is given below. It is not a full account of the results, as such a presentation with an in depth analysis and interpretation is seen as beyond the scope of this paper. The focus in this overview is on the students’ use and experiences of the Geovisual Analytics–the Vislets and their learning by using the tool. This is presented to give an example of what kind of results a study like this can give.
Students’ use of and interaction with the Vislets:the video observations showed that it is easy for students to understand and adjust to the interactive functions and indicators, as well as using the tool to understand connections between the statistical data. The students were able to understand and learn to use the interactive tools, such as zooming, and reading opacity and transparency maps. All students understood the possibilities of finding, choosing, adjusting and controlling the indicators at the dynamically linked views. The students had few problems understanding the function of the dynamically linked views. This means that they understood the connection between a region/country on the map and the corresponding bubble in the scatter plot. They were also able to add information from the color a chosen region and bubble had, to measure the volume or quantity shown for an indicator/variable on the scatter plot. Size (of the dots on the scatter plot) as a measurement of quantity of different indicators was a difficult concept for some students at the beginning; some first associated this with the size of a country but after using the tool a few times, they learned to interpret the dot size correctly.
Students’ meaning making and knowledge construction:the analyses of the video observations showed that the Vislets constituted an adequate learning environment for the students. They supported the students in their efforts to deal with information and correctly interpret it. The learning environment supported them in analyzing and synthesizing information, to draw conclusions and turn information into knowledge. By following the learning sequences it was possible to catch the students’ interpretations of the representations. They discussed with each other and at the same time interacted with the Vislet to prove that their statements about the content were correct. In this way they mediated the information and tried to make meaning. To gain a deeper understanding of the students’ signs of learning, their meaning making was studied by collecting their worksheets and any written materials from these lessons. These showed that the students were able to compare information from different indicators and to connect this with spatial as well as temporal data. Using the Vislet’s visualizations and their own visualizations to synthesize information, they were able to draw surprisingly clear conclusions. The study revealed, from analyses of the students discussions during the video observations, that factors causing problems were students’ lack of prior knowledge about what the indicators, or concepts, showed; a lack of background in and familiarity with connections between indicators; not having an understanding of abbreviations or units; and trouble when solving more complex problems involving several mental stages. It is hard to identify the causal connections (relations) of these problems since they occur in all educational setups. All this confirms earlier research–namely, the importance of building on students’ (and other users’) prior knowledge [30,46]. The Geovisual Analytics tool creates new and different opportunities but for students to benefit and take full advantage of such tools, they need to be well integrated in the ordinary school setting.
Students’ experiences when using the Geovisual Analytics tool in their learning: the speak-aloud interviews showed that the students’ experiences of using the Vislets were positive, as was their apprehension of the learning taking place when using this tool. They expressed a strong conviction that using the Vislets led to good learning and, furthermore, that the learning process differed from the one they were used to. They said that this was a faster and easier way to find and handle information compared with normal lessons. They also said that the Vislet gave them access to a larger amount of information, which was possible for them to sort and handle, compared with conventional teaching. The information was distinct and was presented prominently. There was no tiresome searching–you “chose, clicked and got the information and everything was displayed immediately”. This show the opposite to earlier research on Web based information searching which shows that those environments could become overwhelming to the extent that students may even risk to become “losers” through the Web [11,12]. The students also felt that working in this context was straightforward and the effort of problem solving was tiny compared with their regular circumstances. This points at that, the used Geovisual Analytics offer opportunities to save time and energy in transforming the digital information flow into meaning in the students school activities. They have not the apprehension that, as Jedeskog [13,14] pointed at, they are left with their information from the seeking sequence without help or questioning discussions. The tool supported them in the way that there was time for discussions among the students as well as explanations from the teachers. Among the thoughts expressed by the students were the following: “working with a Vislet is fast and easy” and “this creates a feeling of fun and then it is good learning”.
These kinds of results are a lot different in character than what results from a pre-and post test would give. They give us a wider and deeper understanding of the tools’ usability and the conditions created in the real learning context. They show the processes of the learners’ knowledge construction and meaning making in how the visualized information turns into knowledge. The kind of character of the results as giving an understanding as both “wider and deeper” can, also to be said, to be more complex and difficult to interpret.

5. Conclusion

This paper has raised new questions and approaches to understanding and studying learning with technology. It has argued that in a study of learning with Geovisual Analytics, adopting a cognitivistic theoretical approach would limit the questions that can be answered owing to the narrow apprehensions of learning seen with this approach. Instead, the socio-cultural theoretical perspective has been advocated for studying learning with multimedia environments such as Geovisual Analytics. Learning, in this kind of theoretical perspective is seen as a social process with internalization of cultural signs and symbols, which is dependent on culture and social relationships. Learning is furthermore embedded within social events and occurs as individuals interact with other people, with objects and with the environment. Learning takes place in sequences over time and in interaction with the surroundings. Consequently, to follow a process of learning, we have to examine the external social world of the individuals taking part in a study. The design and methods are about following the learners’ interactions in their process of learning, in their ordinary context and over some time in their practice. We can collect signs of the learning through the participants’ language, mediation andmeaning making [35,42]. To be able to do this, qualitative methods such as observations and interviews are suggested [39].
Through a study aiming to examine learning with a Geovisual Analytics–the Opened Statistics eXplorer platform, it has been illustrated that the socio-cultural perspective on learning is useful as a theoretical starting point. The students’ interpretation of visual information, their mediation, their meaning making and learning were therefore followed in their real working context for a period of 2–4 weeks. Data were collected with qualitative methods including video observations and speak-aloud interviews. This approach revealed much about the learning processes. It showed how the learners used the technology as the theory and methods also take into consideration the fact that people differ in what and how they learn. We propose that using this approach, design and method makes it possible to gain deep insight into the learning taking place. This kind of study gives an authentic and more complex view of learning in practice, which “shifts the research focus to a different understanding of agency, activity and the character of everyday learning when using technology” [47]. It gives the opportunity to answer the following question: Under what circumstances, with which design factors, for which learners, performing which tasks and expecting what outcomes, is learning in a multi-representational environment sufficient [3,19,26,44]?
Therefore this paper proposes that studying and understanding learning with Geovisual Analytics requires a study of the interactions between technology, the workplace where the learning takes place, and learners’ specific knowledge formation. As Geovisual Analytics are much more than neutral tools enabling transmission of messages or providing access to information resources, our understanding needs to be founded on a well-formulated perspective on the nature of learning with technical artifacts.
In essence, the socio-cultural theoretical perspective has much to offer and calls for empirical research efforts to analyze how specific communities such as schools use various Geovisual Analytics to evaluate information and create knowledge in the age of visual modality.

Acknowledgements

This research was carried out in co-operation with NCVA and the OECD and Statistics Sweden who supplied data and comprehensive evaluation of the statistical storytelling system. The research was in part supported by funding from the Swedish Agency for Innovation Systems (VINNOVA), the Visualization Program and The Research School of Childhood, Learning and Didactics (RSCLD), Educational Sciences (grant No. 721-2007-3671), both co-ordinated by the Swedish Knowledge Foundation.

References

  1. Keim, D.A. Visual exploration of large data sets. Commun. ACM 2001, 44, 38–44. [Google Scholar]
  2. Gustavsson, B. Vad är Kunskap? En Diskussion om Praktisk Och Teoretisk Kunskap; 2002; Statens skolverk: Stockholm, Sweden. [Google Scholar]
  3. Kress, G.R. Multimodality a Social Semiotic Approach to Contemporary Communication; 2010; Routledge: London, UK. [Google Scholar]
  4. Kress, G.R. Literacy in the New Media Age; 2003; Routledge: London, UK. [Google Scholar]
  5. Keim, D.; Andrienko, G.; Fekete, J.-D.; Görg, C.; Kohlhammer, J.; Melançcon, G. Visual Analytics: Definition,Process,and Challenges Information Visualization; Kerren, A., Stasko, J., Fekete, J., North, C., Eds., Eds.; 2008; Information Visualization; Springer: Berlin/Heidelberg, Germany. [Google Scholar]
  6. Andrienko, G.; Andrienko, N.; Dykes, J.; Fabrikant, S.I.; Wachowicz, M. Geovisualization of dynamics, movement and change: Key issues and developing approaches in visualization research. Inf. Vis. 2008, 7, 173–180. [Google Scholar] [CrossRef]
  7. Tomaszewski, B. Producing geo-historical context from implicit sources: A geovisual analytics approach. Cartogr. J. 2008, 45, 165. [Google Scholar] [CrossRef]
  8. Andrienko, G.; Andrienko, N.; Demsar, U.; Dransch, D.; Dykes, J.; Fabrikant, S.R.; Jern, M.; Kraak, M.H.; Schumann, H.; Tominski, C. Space, time and visual analytics. Int. J. Geogr. Inf. Sci. 2010, 24, 1453–1600. [Google Scholar] [CrossRef]
  9. Jern, M. Collaborative Educational Geoanalytics Applied to Large Statistics Temporal Data. In. In Proceedings of CSEDU 2010—2nd International Conference on Computer Supported Education, Valencia, Spain, 7–10 April 2010.
  10. Sundin, O.; Julien, H.; Limberg, L.; Rieh, S.Y. Credibility and authority of information in learning environments. Proc. Am. Soc. Inf. Sci. Technol. 2008, 45, 1–5. [Google Scholar]
  11. Alexandersson, M.; Limberg, L.; Lantz-Andersson, A.; Kylemark, M. Textflytt och Sökslump—Informationssökning via Skolbibliotek; 2007; Myndigheten för skolutveckling: Stockholm, Sweden. [Google Scholar]
  12. Eds.; Lantz-Andersson, A.; Alexandersson, M.; Limberg, L. To be Lost and to be a Loser Through the Web. Handbook of Research on Digital Information Technologies: Innovations, Methods, and Ethical Issues; 2008; pp. 249–263. IGI Global: Hershey, PA, USA. [Google Scholar]
  13. Jedeskog, G. "Maila mig sen!": Lärarintentioner och Förändrade Gränser för Elevers Arbete; 2001; Linköping University: Linköping, Sweden. [Google Scholar]
  14. Jedeskog, G. Ny i Klassen - Förhållandet Mellan Lärarroll och Datoranvändning Beskrivet i Internationell Forskning; 2000; Ekelunds förlag: Solna, Sweden. [Google Scholar]
  15. de Jong, T.; Joolingen, W.R. Scientific discovery learning with computer simulations of conceptual domains. Rev. Educ. Res. 1998, 68, 179–201. [Google Scholar]
  16. Moreno, R.; Mayer, R.E. A coherence effect in multimedia learning: The case for minimizing irrelevant sounds in the design of multimedia instructional messages. J. Educ. Psychol. 2000, 92, 117–125. [Google Scholar] [CrossRef]
  17. Ainsworth, S.; Bibby, P.; Wood, D. Examining the effects of different multiple representational systems in learning primary mathematics. J. Learn. Sci. 2002, 11, 25–61. [Google Scholar] [CrossRef]
  18. Ainsworth, S. DeFT: A conceptual framework for considering learning with multiple representations. Learn. Instr. 2006, 16, 183–198. [Google Scholar] [CrossRef]
  19. Ainsworth, S. How Should We Evaluate Multimedia Learning Environments? In Understanding Multimedia Documents; Rouet, J., Lowe, R., Schnotz, W., Eds., Eds.; 2008; Springer: New York, NY, USA. [Google Scholar]
  20. Åström, T.; Jern, M.; Lundblad, P.; Ho, Q. A web-enabled visualization toolkit for geovisual analytics visualization and data analysis. Proc. SPIE 2011, 7868. [Google Scholar] [CrossRef]
  21. Sweller, J. Cognitive load during problem solving: Effects on learning. Cogn. Sci. 1988, 12, 257–285. [Google Scholar] [CrossRef]
  22. Sweller, J.; Merrienboer, J.J.G.; Paas, F.G.W.C. Cognitive architecture and instructional design. Educ. Psychol. Rev. 1998, 10, 251–296. [Google Scholar] [CrossRef]
  23. Mayer, R.E.; Moreno, R. A split-attention effect in multimedia learning: Evidence for dual processing systems in working. J. Educ. Psychol. 1998, 90, 312–320. [Google Scholar] [CrossRef]
  24. Mayer, R.E.; Moreno, R. Aids to computer-based multimedia learning. Learn. Instr. 2002, 12, 107–119. [Google Scholar] [CrossRef]
  25. Moreno, R.; Mayer, R.E. Designing Multimedia Presentations with Animation: What Does the Research Say? In Proceedings of IEEE Multimedia Systems 1999, Florence, Italy, 7–11 June 1999.
  26. Goldman, S. Learning in complex domains: When and why do multiple representations help? Learn. Instr. 2003, 13, 239–244. [Google Scholar] [CrossRef]
  27. Vygotskij, L.S. Mind in Society: The Development of Higher Psychological Processes; Cole, M., Ed., Eds.; 1978; Harvard University Press: Cambridge, MA, USA. [Google Scholar]
  28. Vygotsky, L. Thought and language. Ann. Dyslexia 1964, 14, 97–98. [Google Scholar]
  29. Wertsch, J.V. Vygotsky and the Social Formation of Mind; 1985; Harvard University Press: Cambridge, MA, USA. [Google Scholar]
  30. Vygotskij, L.S. Thought and Language; Kozulin, A., Ed., Eds.; 1986; MIT Press: Cambridge, MA, USA. [Google Scholar]
  31. Wertsch, J.V. Mind as Action; 1998; Oxford University Press: New York, NY, USA. [Google Scholar]
  32. Driscoll, M.P. Psychology of Learning for Instruction: Learning and Instructional Technology; 1993; Allyn and Bacon: Boston, MA, USA. [Google Scholar]
  33. Gallimore, R.; Tharp, R.G. Rousing Minds to Life: Teaching,Learning,and Schooling in Social Context; 1988; Cambridge University Press: Cambridge, MA, USA. [Google Scholar]
  34. Prizant, B.M.; Crais, E.R.; Wetherby, A.M.; Kublin, K.S. Prelinguistic Dynamic Assessment: A Transactional Perspective. In Transitions in Prelinguistic Communication; Wetherby, A.M., Warren, S.F., Reichle, J., Eds., Eds.; 1989; pp. 285–289. Paul H. Brookes: Baltimore, MD, USA. [Google Scholar]
  35. Säljö, R. Lärande i Praktiken - ett Sociokulturellt Perspektiv; 2010; Norstedt: Stockholm, Sweden. [Google Scholar]
  36. Gibson, J.J. Våra Sinnen som Perceptuella System; 1969; Beckman: Stockholm, Sweden. [Google Scholar]
  37. Jewitt, C. Technology,Literacy and Learning: A Multimodal Approach; 2005; Routledge: New York, NY, USA. [Google Scholar]
  38. Kress, G.R.; Selander, S. Design för Lärande: Ett Multimodalt Perspektiv; 2010; Norstedt: Stockholm, Sweden. [Google Scholar]
  39. Berger, A.A. Media and Communication Research Methods: An Introduction to Qualitative and Quantitative Approaches; 2011; SAGE Publications: Thousand Oaks, CA, USA. [Google Scholar]
  40. Bandura, A. Social Foundations of Thought and Action: A Social Cognitive Theory; 1986; Prentice-Hall: Englewood Cliffs, NJ, USA. [Google Scholar]
  41. Moreno, R. Decreasing cognitive load for novice students: Effects of explanatory versus corrective feedback in discovery-based multimedia. Instr. Sci. 2004, 32, 99–113. [Google Scholar] [CrossRef]
  42. Van Leeuwen, T. Discourse and Practice: New Tools for Critical Discourse Analysis; 2008; Oxford University Press: New York, NY, USA. [Google Scholar]
  43. Jern, M.; Stenliden, L. Educating Official Statistics Using Geovisual Analytics Storytelling Methods. In. In Proceedings INTED2010; International Association of Technology,Education and Development (IATED).
  44. Rystedt, H. ,Säljö,R.,Eds. Kunskap och Människans redskap: Teknik och Lärande; 2008; Studentlitteratur: Stockholm, Sweden. [Google Scholar]
  45. Eds.; Luff, P.; Heath, C. Technology-in-Action; 2000; Cambridge University Press: New York, NY, USA; Cambridge, UK. [Google Scholar]
  46. Gil, A.; Bruner, J.S. The Relevance of Education; 1971; Norton: New York, NY, USA. [Google Scholar]
  47. Talja, S. Jean Lave’s Practice Theory. In Critical Theory for Library and Information Science: Exploring the Social from Across the Disciplines; Eds., Buschman, J.E., Given, L.M., Leckie, G.J., Eds.; 2010; Libraries Unlimited: Santa Barbara, CA, USA. [Google Scholar]

