Abstract
The advances in sensor network, linked data, and service-oriented computing has indicated a trend of information technology, i.e., toward an open, flexible, and distributed architecture. However, the existing information technologies show a lack of effective sharing, aggregation, and cooperation services to handle the sensors, data, and processing resources to fulfill user's complicated tasks in near real-time. This paper presents a service-orientated architecture for proactive geospatial information services (PGIS), which integrates the sensors, data, processing, and human services. PGIS is designed to organize, aggregate, and co-operate services by composing small scale services into service chains to meet the complicated user requirements. It is a platform to provide real-time or near real-time data collection, storage, and processing capabilities. It is a flexible, reusable, and scalable system to share and interoperate geospatial data, information, and services. The developed PGIS framework has been implemented and preliminary experiments have been performed to verify its performance. The results show that the basic functions such as task analysis, managing sensors for data acquisition, service composition, service chain construction and execution are validated, and the important properties of PGIS, including interoperability, flexibility, and reusability, are achieved.1. Introduction
Nowadays, the trend of geospatial information (GI) technology is toward an open (share and interoperation), web-based and distributed structure [1,2]. Three typical mechanisms have been discussed in the past decade to help in implementing this task: sensor web [3]; linked data [4]; and service-oriented computing [5].
Sensor Web Enablement (SWE) is a framework published by the Open Geospatial Consortium (OGC), which specifies the interoperability interfaces, protocols, and metadata encodings enabling near real-time integration of heterogeneous sensor webs into the geospatial information infrastructure [3]. SWE helps navigate through the increasing amounts of data acquired from a wide variety of in-situ and dynamic sensors.
Linked data enables links to be set between items in different data sources and therefore connected for discovery, accessing, integration, and use of data [4]. It connects data into a globe data space.
Service-oriented computing is a promising approach to change the existing geospatial information processing methods into geospatial information services [5]. It allows manual data processing tasks to be automated through geospatial information service chains (GISC) [6].
From data to service is the common goal of the above mentioned techniques. The term “service” has also been extended to human or citizen recently. Human/citizen sensor network is a new paradigm to strengthen data collection by Internet or Web-enabled mobile sensors and powerful computing ability. Humans as citizens on the ubiquitous Web, acting as sensors and sharing their observations and views using mobile devices and Web 2.0 services [7], i.e., “all for one and one for all” [8].
However, most of the existing approaches are either simple data-centered or sensor-centered, which lead to unsatisfactory data sharing and interoperation. The raw data collected from the sensors cannot be processed in depth enough to satisfy complex and flexible user demands in term of knowledge discovery. They cannot be shared and fused to achieve more integrated goals in term of scalability either. The contrast between the increasing ability to acquire data and insufficient abilities to process data becomes more serious. The problem “data-rich but analysis-poor” [8] is worsening. The fundamental reason behind this problem is not due to the lack of processing approaches to deal with those tremendous datasets, but the shortage of effective sharing, aggregation, and cooperation service mechanisms to handle the sensors, data, and processes focusing on user's complex tasks in near real-time [9].
With regard to the problem mentioned above, this paper presents a service-oriented architecture for Proactive Geospatial Information Service (PGIS) based on our previous works [9–12]. The PGIS is an aggregation and cooperation mechanism to integrate all the sensor, data, processing, and social resources to satisfy complicated user requirements. The rest of this paper is organized as follows. After giving a literature review on the related works in Section 2, the fundamentals of the proactive geospatial information service are discussed in Section 3. Section 4 discusses the details of the service-orientated architecture for PGIS. Section 5 presents an actual geospatial information service application with regard to the Wenchuan earthquake in China and the preliminary experimental results. Finally, the concluding remarks are presented and future work discussed in Section 6.
2. Related Works
In the past decade, various investigations have been pursued in the fields of sensor network, linked data, and service-oriented computing.
In the sensor network field, the works mainly focus on two aspects, network city [13,14] and sensor Web [1,15]. The increasing deployment of sensors and hand-held devises in recent years enhanced the capabilities to sense the environment. The way we describe and understand the environment is being revolutionary changed [16]. There are lots of projects designed to collect near real-time data, such as the weather and pollution data in cities, by wireless sensor network or pervasive computing devises. For instance, the “LIVE Singapore!” provides useful near real-time information about Singapore city for its citizens. It includes an open platform in order to collect, elaborate, and distribute near real-time data reflecting urban activities.
Traditional sensors are described as tiny data detectors, receivers and transporters. They are limited in detecting range, due to restricted power supply, poor computing capacities, and narrow communication capabilities. In the Sensor Web framework, the sensors have been extended to Earth Observing sensors on a global scale. For instance, the Sensor Management for Applied Research Technologies (SMART) project, developed by National Aeronautics and Space Administration (NASA) Marshall Space Flight Center, integrates both Earth observations and forecast model output into new data acquisition and assimilation strategies.
With the help of various sensors, huge amounts of geospatial data have been collected. There is also a remarkable number of government organizations, research institutions, and private companies providing open datasets to the general public free of charge [17]. For example, Earth Observing System (EOS) satellites are currently collecting several hundreds of terabytes of data annually, and many of those datasets can be accessed through internet in platforms such as NASA, and United States Geological Survey (USGS) [18]. OGC has published the Web Map Service (WMS) [19], Web Feature Service (WFS) [20] and Web Coverage Service (WCS) [21] specifications to encourage researchers and organizations developing standard protocols and tools to publish, interoperate, and share geospatial datasets. Web Processing Service (WPS) specifications [22] also define standardized interfaces that facilitates the publishing of geospatial processes and the discovery of and binding to those processes by user. For example, NASA developed a WMS server to manage the massive amounts of satellite data for climate and environmental monitoring. OGC WMS Server List [23] from Skylab Mobile systems shows that there were 994 WMSs and 339,254 layers available in the Internet [11] and more than 14,038 WMSs were registered [24] with the GOS by April 2011.
To make sure the data can be exchanged and interoperated, standardization organizations have published a serial of standardizations. New database technologies coupled with emerging Web-based technologies may hold the key to lowering the cost of geospatial information service generation and allow it to become a more integral part of the scientific process [25]. Service-oriented computing focusing on service composition and services chain technology indicates a promising method to handle this problem.
The recent developments in linked data [26], sensor network [27], wireless sensor network [28], sensor web framework (SWE) [29], and services-oriented computing [5] have shown the great potential of prompting the evolution from geospatial information systems to geospatial information services. However, how to link these modules has not yet been fully discussed. The proactive geospatial information services (PGIS) presented in this paper endeavors to provide a framework to link the sensor services, data services, processing services, and even human services together, and try to offer solutions for some actual applications such as disaster response.
3. Proactive Geospatial Information Services (PGIS)
3.1. Concept of PGIS
Most of the traditional geospatial information services only provide simple data dissemination functions, which cannot meet the requirements in modern geospatial applications as discussed in this paper. For example, there are gaps between GIS systems and remote sensing platforms and gaps among different GIS systems, i.e., users have to spend lots of effort to transform data from one system to another. Facing the increasing explosion of data, information, and knowledge nowadays, it is desirable to develop a new GI paradigm with a simple interface but powerful capability to achieve complex tasks. One way to provide complicated GI services is to aggregate various types of GI service resources from small granularities based on user's specific demands. This on-demand aggregating service is defined as proactive geospatial information service (PGIS).
The fundamental characteristics of PGIS include autonomy, self-adaptation, and aggregation and cooperation. Autonomy describes the capability of reaction to user's demands and achievement of the demands automatically or semi-automatically. For instance, an ideal PGIS system should be able to find appropriate sensor, data, and processing services by itself with little or no human interaction. Self-adaptation represents the capability of adjusting the system structure and behavior according to the changes in user's demands or system running environments. Aggregation and cooperation require to comprehensively share, aggregate and cooperate with various geospatial services to satisfy proactive and complex user demands.
3.1.1. Typical Geospatial Information Services in PGIS
Four typical geospatial information services are defined in PGIS. They are sensor web services, data services, processing services, and social services.
The sensor web services are built based on the SWE (Sensor Web Enablement) framework. Various sensor web applications, based on the SWE framework, have been reported in the past, including environmental monitoring [30], applications using satellite and airborne sensors [1], webcam, and vehicle-mounted sensors. For the sensor web services presented in this paper, variable sensors such as the satellite sensors, airborne sensors, traffic monitors, environmental monitors, and web cameras are connected based on SWE specifications (i.e., the interoperability interfaces, protocols, and metadata encodings). The sensor web services acquire data on the environment through these sensors.
From the above sensor web services, huge amounts of data about the environment can be acquired. Ideally, users should not have to worry about heterogeneous formats, sensors and sources of data. An interoperable system of sensor data would allow users to focus on analysis tasks rather than data handling. The use of standards can help machines to communicate without human intervention. However, creating standards is challenging. The Web Ontology Language (WOL) [31] is used in this research to enable data sharing and exchange. A more challenging problem is how those data services can be linked as a whole. Linked data [26] has been presented for this task. Linked data is a platform connecting all data sets in the internet. It uses the Web to connect related data previously not linked, which has gathered awesome results by linking with other Semantic Web databases. The data services in PGIS aims at providing a well-described and linked platform for data accessing based on the above discussed technologies.
Processing services deal with raw data on-line to support more throughout, flexible and complexity functions. The services chain technology is employed to achieve this task. The current services chain description languages follow two separate standards: the Web Service Flow Language (WSFL) of IBM and the eXtensible Markup Language (XML) LANGuage (XLANG) of Microsoft. The Business Process Execution Language (BPEL) is a new language in addition to the above two separate standards, which is based on technologies of Web Service Description Language (WSDL), XML Schema, and XML Path Language (XPath). BPEL itself defines the syntax for an XML-based programming language. The result of the complete definition of a process is a BPEL script that will be interpreted by an orchestration engine such as the Oracle BPEL Process Manager. The engine can be considered as a runtime environment that interprets the BPEL script.
Social services refer to an interconnected network of people who actively observe, report, collect, analyze, and disseminate information via text, audio, or video messages through smart devices. Social service is a combination of human-in-the-loop sensing, Web 2.0, and mobile computing [7]. In particular, Web 2.0 fostered the applications for tagging, blogging, wikis, and social networking sites that have made information consumption, production, and sharing incredibly easy. Recent significant developments in mobile computing facilitated the social services, such as the technology of Global Positioning System (GPS) and cameras on-board the mobile devices. Hence, the human sensor, i.e., social services should be an extensive data source for the PGIS.
3.1.2. Workflow of PGIS
There are mainly three steps to implement a PGIS application. The first step is task explanation, which is the procedure of understanding user's demands according to the related context and obtaining exact information as to what the user requires (labeled as 1 in Figure 1). The key problem in this step is to appropriately describe user's demands and map them to appropriate data descriptions. A common way to achieve this is to decompose the complex task into small simple tasks and map them to a series of data dimensions. For instance, a disaster monitoring task can be mapped to data dimensions such as temporal data (e.g., satellite images on a specific date), spatial data (e.g., satellite images covering the disaster area with a resolution of 1 m/pixel), and spectrum data (e.g., satellite images with visible bands and infrared band).
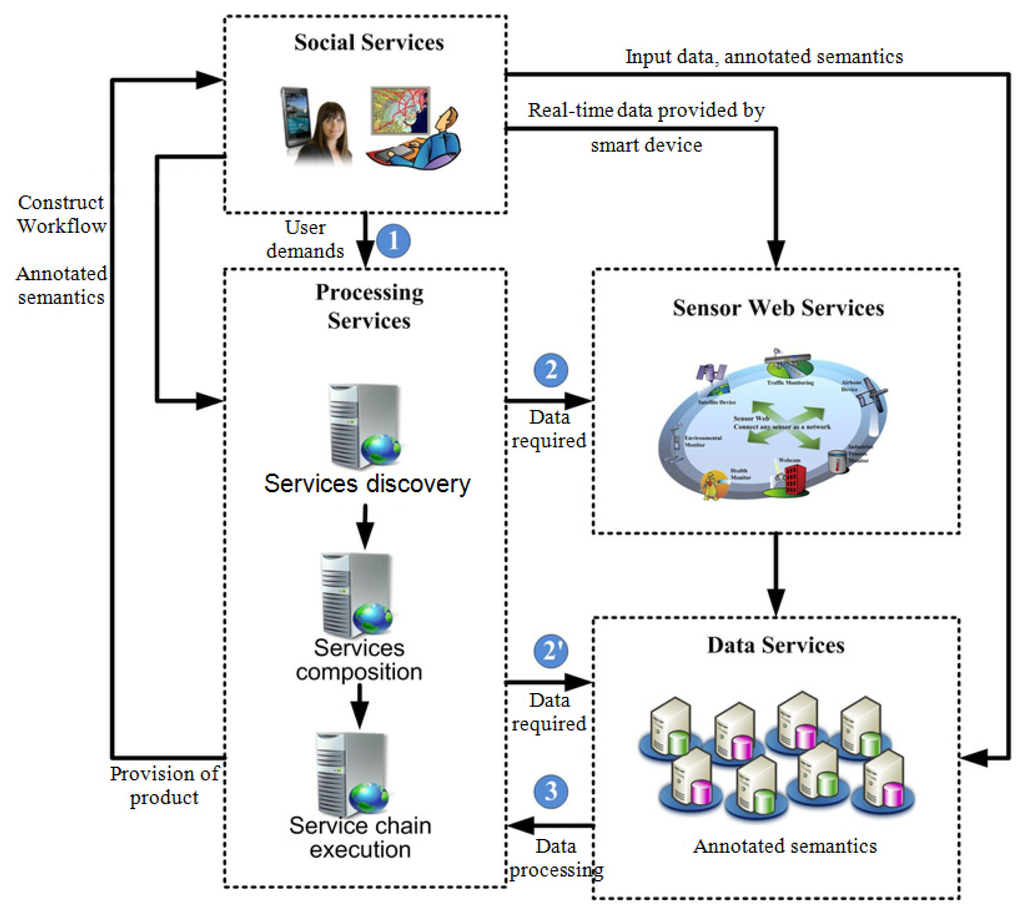
The second step is data acquisition. In PGIS, data can be acquired from two sources. One is to collect data using sensors (labeled as 2 in Figure 1). The other is to retrieve historical data from the existing GI infrastructure (labeled as 2′ in Figure 1). The key issues in this step are to schedule and cooperate with appropriate sensors according to the tasks and to share and interoperate the existing geospatial data appropriately.
The third step is automated data processing. In PGIS, data processing allows manual data processing tasks to be automated via a geo-information processing service chain (GIPSC) [6]. This can be achieved by aggregating and combining small granularity GI services into complex processing service chains (PSC), able to provide on-demand GI services flexibly (labeled as 3 in Figure 1). Technologies such as service-oriented computing [5] and cloud computing [32] are promised methods to help build an automated data processing system in PGIS.
3.2. Linked Services in PGIS
To maximize the usage of the geospatial information services, an important idea is to link all the services together. Figure 2 illustrates the connections among the above mentioned four types of services. For the data services in the middle of Figure 2, the inputs are the data collected from sensor web services and the user demands from the social services, and the outputs are the commands to the processing services and the derived results to the social services. For the sensor web services, they can be controlled by the users in the social services and out collected data to the data services. The processing services deal with data from the data services and output the processing results to the data services or to the users in the social services directly. The social services manage data such as reading, editing, and writing data, control the sensor web services and provide data as a part of sensor web, and share the data and knowledge in the social environment.
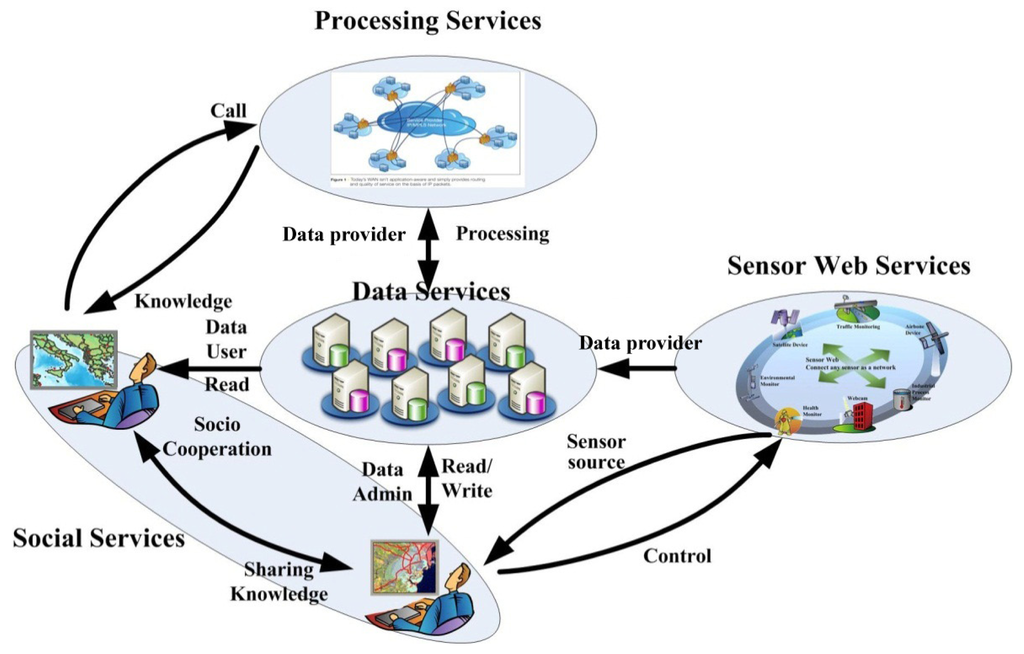
The services can also be linked on different levels. By connecting the data services with the sensor web services, users can become aware of the environment in near real-time. By connecting the data services, sensor web services, and processing services together, users can analyze near real-time data and discover useful information and knowledge. By connecting the data services, sensor web services, processing services, and social services altogether users are both data providers and knowledge providers through the service chain.
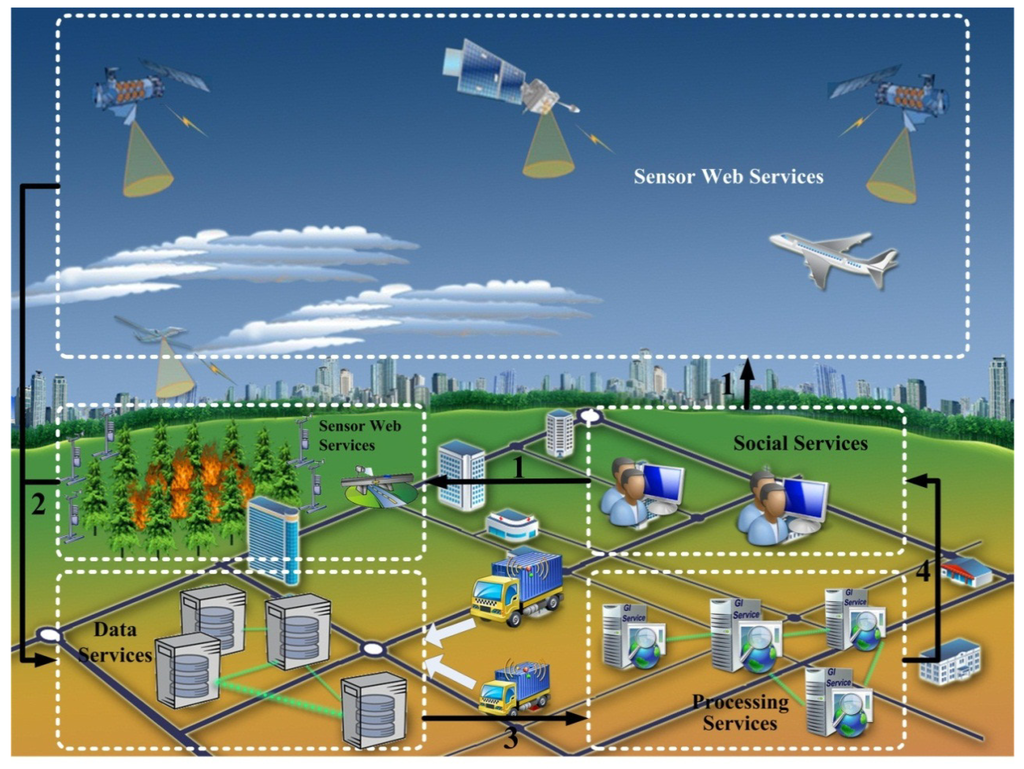
Figure 3 gives an example illustrating the connections of the four types of services. Assuming there is a fire accident in a suburbian area. The users in the social service layer send data requirements to the sensor web services to ask for related data, such as satellite images of the fire domain and the nearby traffic data. This step is labeled as 1 in the figure. Then, the sensors in the sensor web services will acquire related data in near real-time and send them to the data servers. This step is labeled as 2 in the figure. The data services will then store, describe, and publish data in a well-defined standard manner, and then send data to the processing service layer. This step is labeled as 3. Finally, the processing services process data by service chain in a distributed way, and send the final results to the users in the social service layer, which is labeled as 4. These four steps form a closure circle in response to the geospatial information services in a fire accident.
3.3. Service Patterns in PGIS
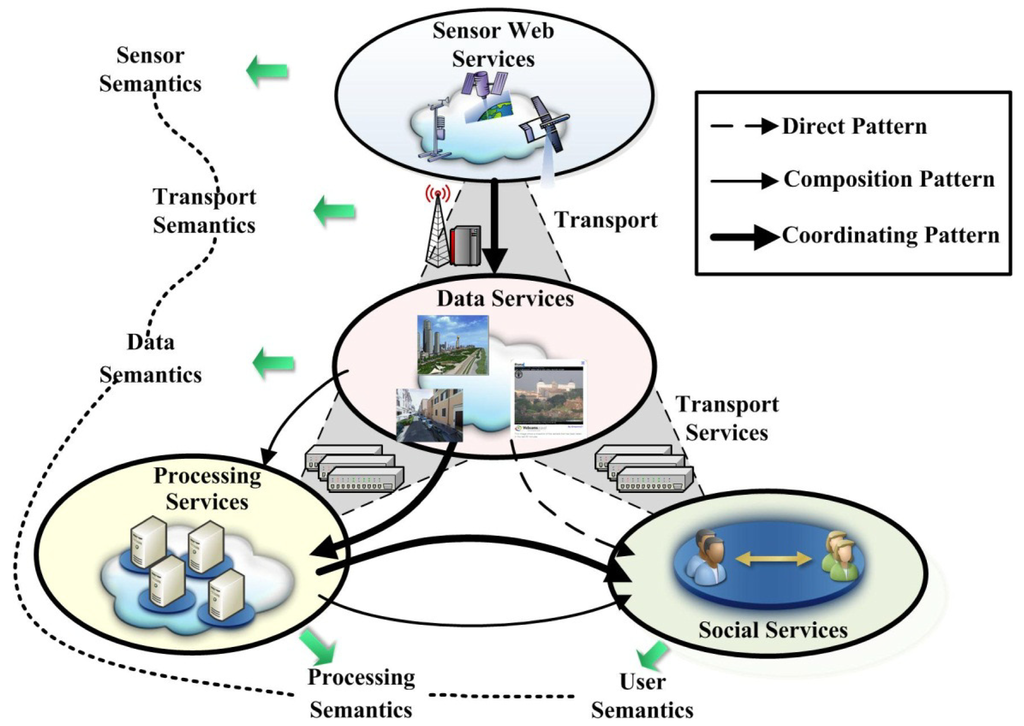
There are three service patterns defined in PGIS from simple to complex; these are direct pattern, composition pattern, and coordinating pattern. Direct pattern means that the existing geospatial data can satisfy user's demands directly via data services. The data will be sent to the user without any processing. The involved services in direct pattern are data services. For composition pattern, user's demands cannot be directly satisfied by the existing geospatial data. Additional processing by service chain is required, which aggregates small granularity services. The involved services in composition pattern include data services and processing services. Coordinating pattern indicates that for a specific user demand, there is no existing geospatial data available and processing by service chain as well as data transportation are also required. The coordinating service pattern covers the whole workflow from new data acquiring through sensor services, to data processing by service chain, and to the final data dissemination through transport network services. The involved services in coordinating pattern are sensor services, data services, processing services, and transport network services. The three service patterns in PGIS are illustrated in Figure 4.
4. Service-Orientated Architecture for PGIS
This section introduces a service-orientated architecture for PGIS based on the defined services and the characteristics of the services as described in the previous section. This architecture for PGIS includes four layers: infrastructure layer at the bottom, description layer and service engine layer in the middle, and application layer on the top. Figure 5 shows the four layers and their relationships.
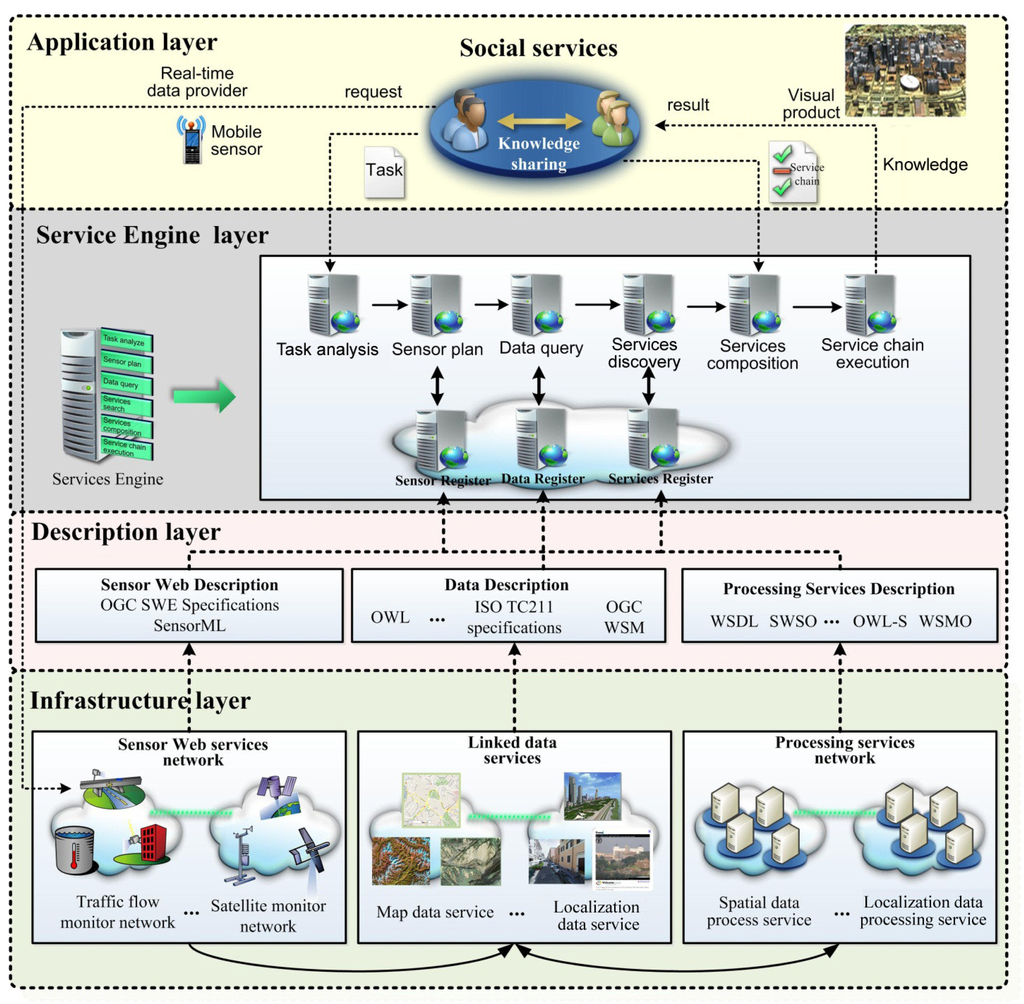
4.1. Infrastructure Layer
The infrastructure layer includes three parts: sensor web service network, linked data service network, and processing service network.
Sensor web creates a near real-time link between the cyber world and the physical world. The SWE specifications, which includes lots of service protocols and data encodings, establish a well-defined and uniform interface for sensor web. Based on the SWE specifications, various sensor web systems form an observation network, which is the so called sensor web service network. It can collect and access sensor data in near real-time in a controllable way [33].
With the help of sensor web service network, huge amounts of geospatial data can be obtained and various data services can be provided. However, a challenging problem is how those data services can be linked as a whole. This paper uses the basic theory of linked data [26] and forms the linked data services, which enables exposing, sharing, and connecting data, information, and knowledge through the Internet. The basic theory of linked data has two aspects: open data and standard description. Open data means that data can be accessed freely. Nowadays, there are a large number of geospatial data openly available through the internet. For instance, Data.gov ( http://www.data.gov/) hosts 379,953 raw and geospatial datasets. Geospatial One-Stop ( http://gos2.geodata.gov/wps/portal/gos) published 14,487 live data and maps, and 467,568 downloadable data sets. Standard description employs the idea of standardization to enable seamless data exchange and interoperability. For example, The DBpedia ( http://wiki.dbpedia.org/) currently describes more than 3.5 million things, out of which 1.67 million are classified in a consistent Ontology. The open data and standard description help to provide linked data services for better data sharing, exchange, and interoperability. Section 4.2 describes the detailed data description standards.
The processing service network employs the geospatial information service chain (GISC) technology into the data processing and analysis. It chains the small scale services into a complex service to solve a complicated real world problem. Recently, OGC has specified the Web processing service (WPS) interface to enable the processing of data. It offers a generic interface that can be used to conduct a large variety of geo-processing operations. The join, aggregation, normalization, and classification functions have been implemented as WPS operations.
4.2. Description Layer
Description layer is responsible for describing the data, commands, and services using standard methods which machines can understand. Standardization organizations have published a series of standardizations, such as W3C (World Wide Web Consortium), OGC and ISO (International Organization for Standardization). For instance, Sensor Model Language (SensorML) includes standard models which describe sensor systems and processes information with XML Schema. SensorML also provides information needed for discovery of sensors, location of sensor observations, processing of low-level sensor observations. Those standards can be easily mapped to each other. The relationships among the standards are shown in Figure 6.
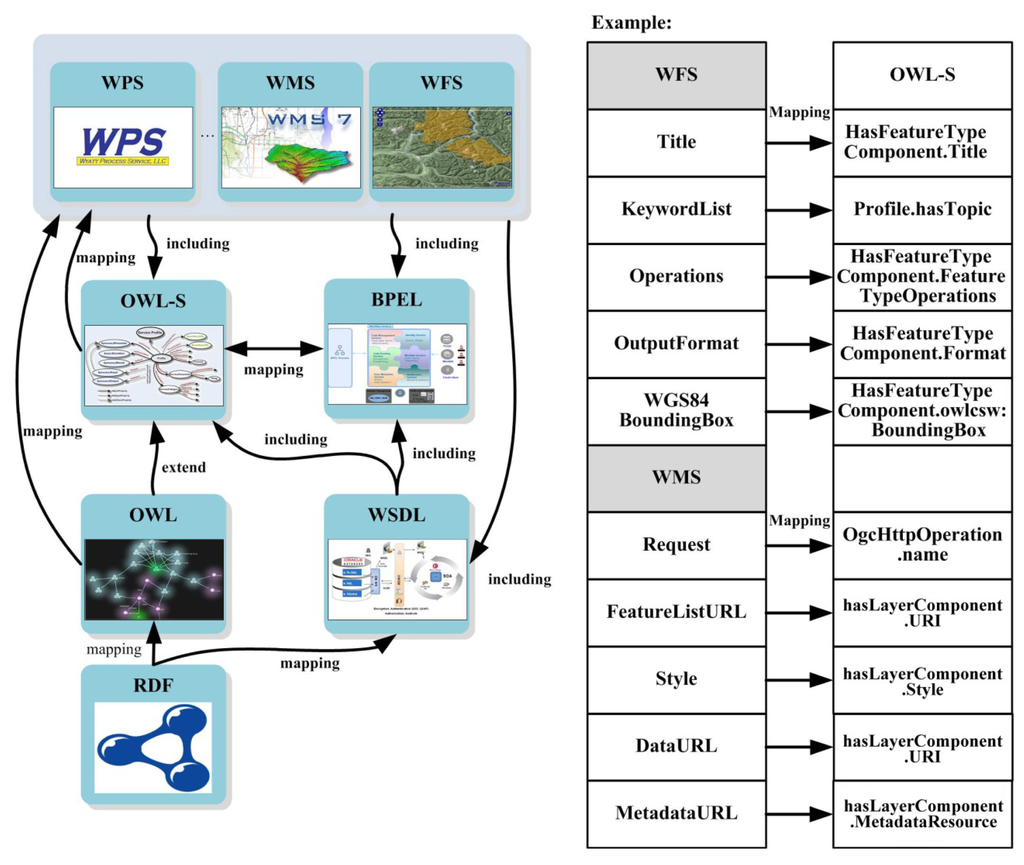
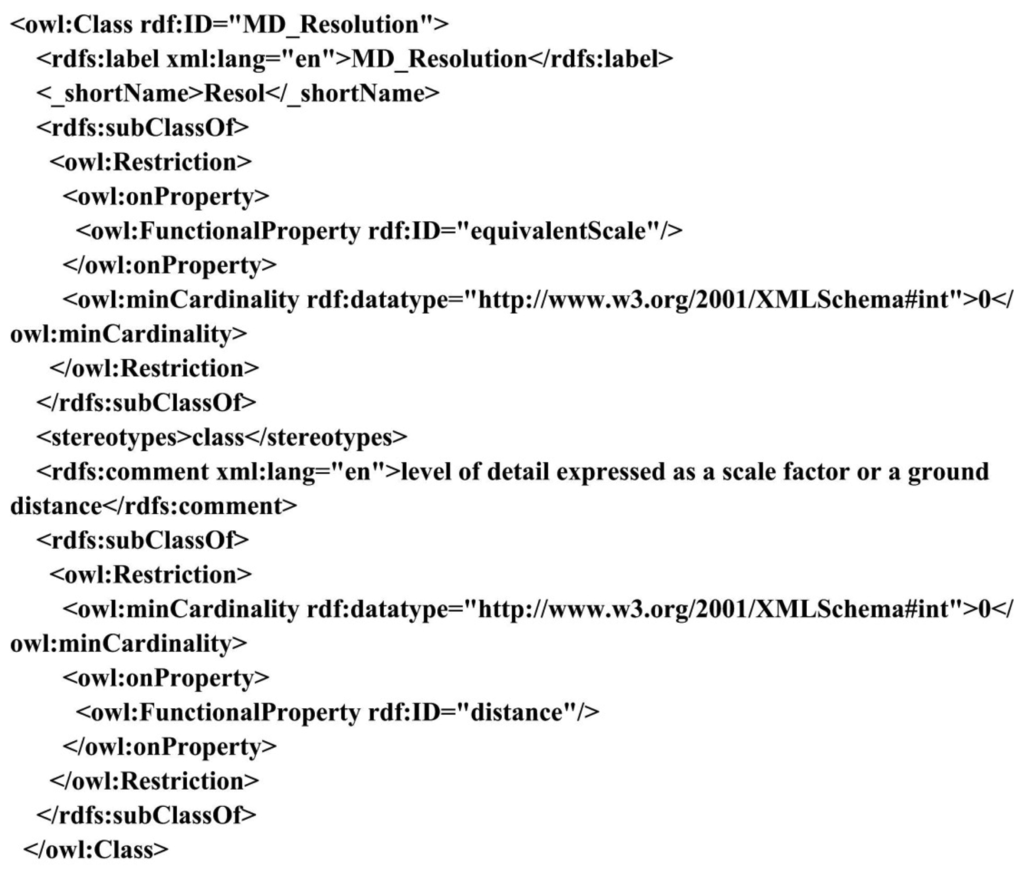
In data services, Web Ontology Language (OWL) [31] from W3C is used to model the ontologies providing the structure to the RDF (Resource Description Framework) information, which is available in Linked Data datasets. It is designed for applications that need to process the content of information instead of just presenting information to users supported by XML, RDF [34], and RDF Schema (RDF-S) by providing additional vocabulary along with a formal semantics. Figure 7 shows an example of the OWL.
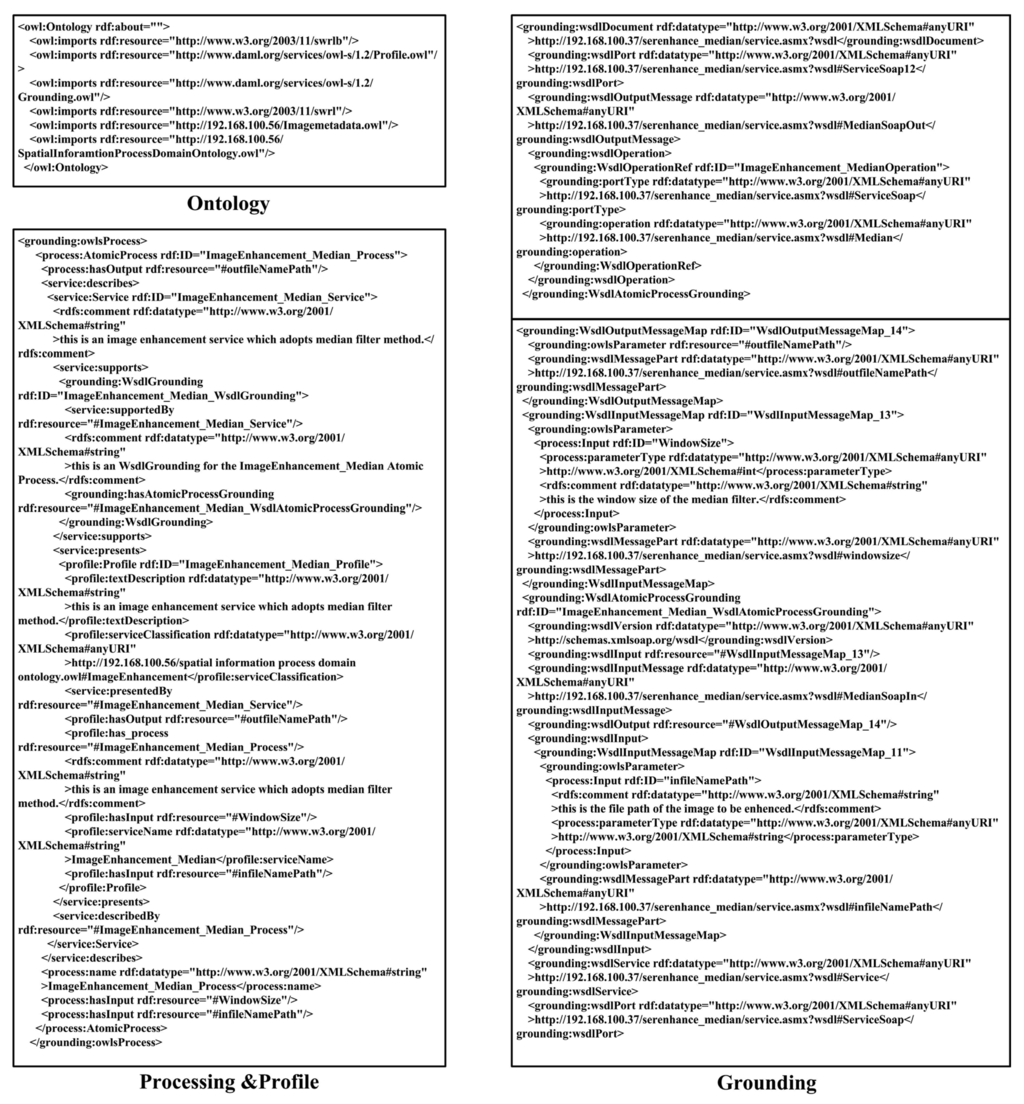
The main GISC description language used in this paper is the Business Process Execution Language (BPEL) and its extension for Web Services (BPEL4WS). A BPEL model is an abstraction of the GISC functions that involves multiple processes. In the BPEL, each service can be described using Web Service Description Language (WSDL) in syntax and Web Ontology Language for Services (OWL-S) in semantics.
There are three basic elements (ontologies) in the OWL-S, which are service profile, service process, and service grounding. Service profile tells “what the service does”, in a way that is suitable for a service-seeking agent to determine whether or not the service meets its needs. Service process tells a client how to use the service, by detailing the semantic content of requests, the conditions under which particular outcomes will occur, and the step by step processes leading to those outcomes. Service grounding specifies a communication protocol, message formats, and other service-specific details such as port numbers used in contacting the service.
Figure8 shows an example of the OWL-S structure.
4.3. Service Engine Layer
The services engine is the core component in the architecture to aggregate and co-operate the services; it is a scheduler or planner of the services in the lifecycle of data processing. It should be noted that a service engine is a very complex system, and some topics (e.g., automatic services discovery and composition) are still open questions in the field. Therefore, this paper only introduces the functions of the main steps of the service engine in PGIS, which include task analysis, sensor plan, services discovery, services composition, and service chain execution.
(1) Task analysis
There is a semantic gap between the task requirements and services description. The purpose of task analysis is to build a connection between task semantics and services. In the proposed architecture, task analysis decomposes a complex task to several simple tasks and connects those tasks with different requirements based on the geospatial attributes, such as the temporal attributes, resolution attributes, and spectrum attributes for remote sensing images.
(2) Sensor plan
Sensor plan is a module mapping the tasks to the sensors and managing the sensors to finish the tasks. The function of sensor plan is to schedule and optimize sensors to implement the task. In SWE, sensor plan is a standard web service interface for requesting user-driven acquisitions and observations, to (re-)calibrate a sensor or to finish the task using the sensors [3].
(3) Services discovery
This step deals with finding suitable services to fill in the roles in the adaptation service chain. To achieve this task, a semantically rich description for the capabilities of each service is needed first. OWL-S, in combination with the domain ontology, is used to describe the services in this paper. Finding candidate services is based on the OWL-S description of the services, more specifically on the Service Profiles which states what a service does. Each of the roles in the service chain contains information about the required input and output parameter types and values of a manipulation step. Using the OWL-S service profiles, it is then possible to select candidate services that suit the necessary roles. The result of the selection process is a list of services matching the roles in the services chain. This process is repeated for every service chain until all roles in the list are filled with services.
(4) Services composition
Services composition is the process that chains small scale services to complex services, i.e., using the GISC to implement user's complicated tasks. In the proposed architecture, the GISC is represented using a straightforward action-driven model consisting of operations and data objects. Data objects model the changes of data attributes after each service process. A reasoning system is used to derive a service chain from a set of attributes of the source data during the design stage.
(5) Service chain execution
After the services composition, the service chain has to be combined and executed, which is the GISC execution. GISC execution is an optimization procedure according to QoS property of services [35]. An important issue in GISC execution is monitoring and recovering after failures, especially for detecting and replacing failing services, in which the correct behavior of services prior or later in the chain is essential.
4.4. Application Layer
The widely available sensors, data, and processing services enable various geospatial information service applications. There are no limited applications in the proposed architecture, i.e., it is dynamic and variable. All the applications can be decomposed as flexible and reusable services and further expressed as services chains.
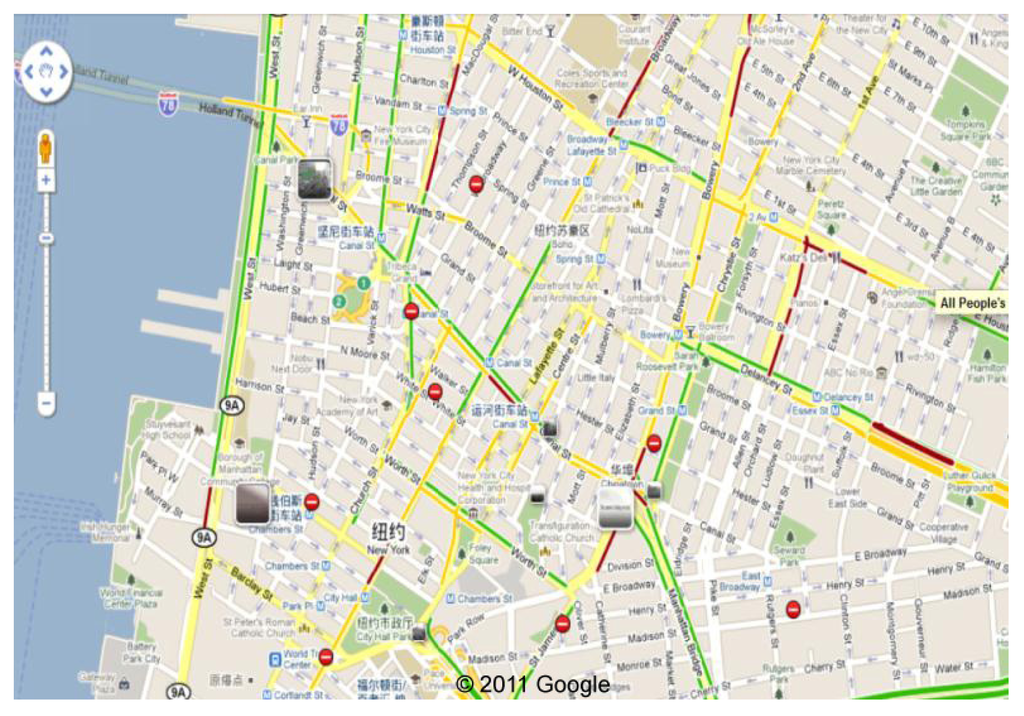
Moreover, in the proposed architecture, people are not only a user or customer, but also a data creator or provider. This type of role change provides a new type of service, which is the so called social service. Social services are critical to the applications related to people, such as the location-based services and traffic navigation. Figure 9 shows a near real-time traffic map in the New York City, of which the data is collected by mobile phones carried by people. In Figure 9, the red lines represent traffic jams; the orange lines mean middle traffic flow; and the green lines stand for low traffic flow.
5. Use Case and Experiments
The presented approaches have been implemented and experimented using the actual case of the Wenchuan earthquake. The Wenchuan earthquake was a deadly earthquake that measured at 8.0 Ms which occurred on May 12, 2008 in Sichuan province of China, killing an estimated 68,000 people. To study the damages of the earthquake, there are a large number of space-borne, air-borne, and terrestrial data collected during or after the earthquake. For example, the CBERS-02/02B satellite gathered 186 scenes of images from May 13 to June 7, and 504 scenes of images before the earthquake. The Beijing-1 satellite collected multispectral images at a resolution of 32 m covering all the disaster areas (1.39 million km2) before the earthquake, and covering the 3.49 million km2 areas from May 13 to June 4. Different government departments involved in disaster mitigation used various geospatial information techniques to provide decision making support [9].
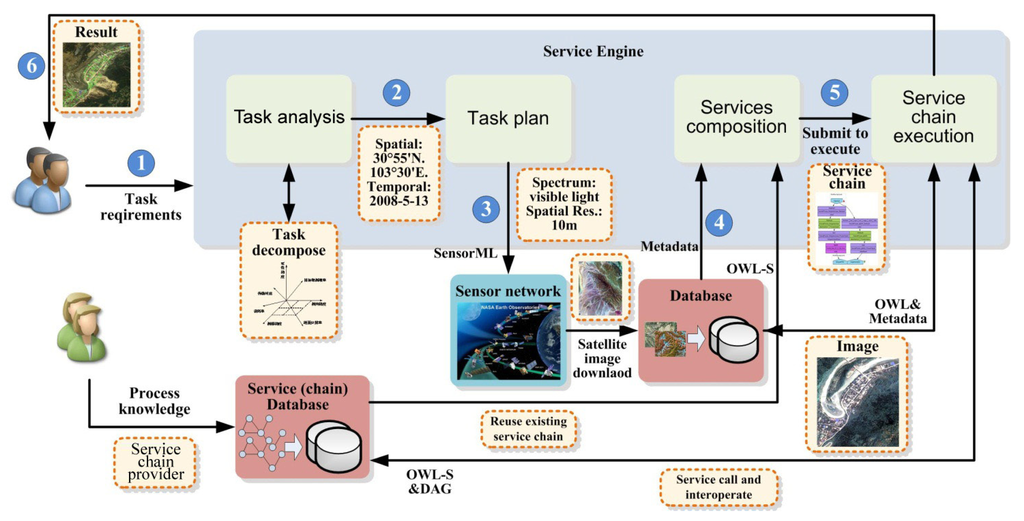
Using the approaches developed in this paper to find out the damage information in the earthquake region, six steps were implemented based on the PGIS architecture as illustrated in Figure 10.
Step 1
User submits task information. In the ideal situation, the submitted information should be simple and natural. For instance, the user task in this case might be described as “information about disaster damage in Wenchuan region”.
Step 2
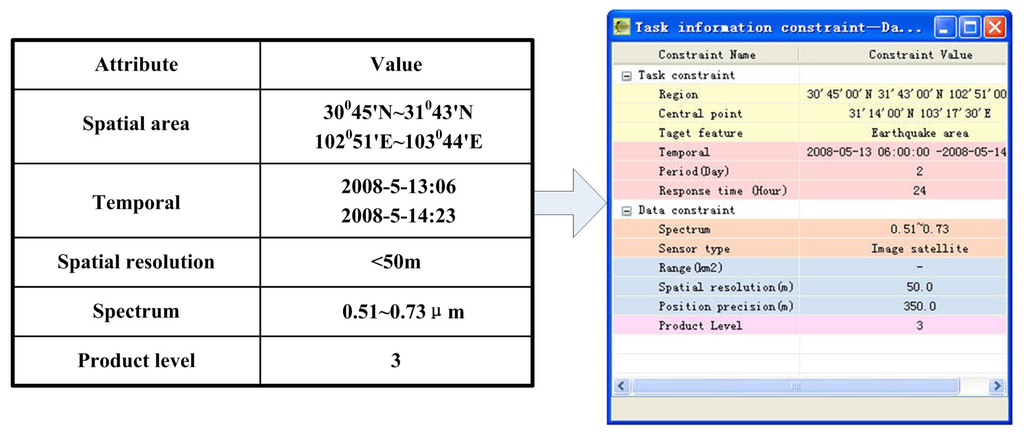
Task analyses. By using task templates and ontology technology, the user's tasks are mapped to a five dimension attribute vector related to the attributes of the geospatial data including area, temporal, spatial resolution, spectrum, and product level, as shown in Figure 11. This step corresponds to the task analysis step in the service engine layer mentioned in Section 4.3.
Step 3
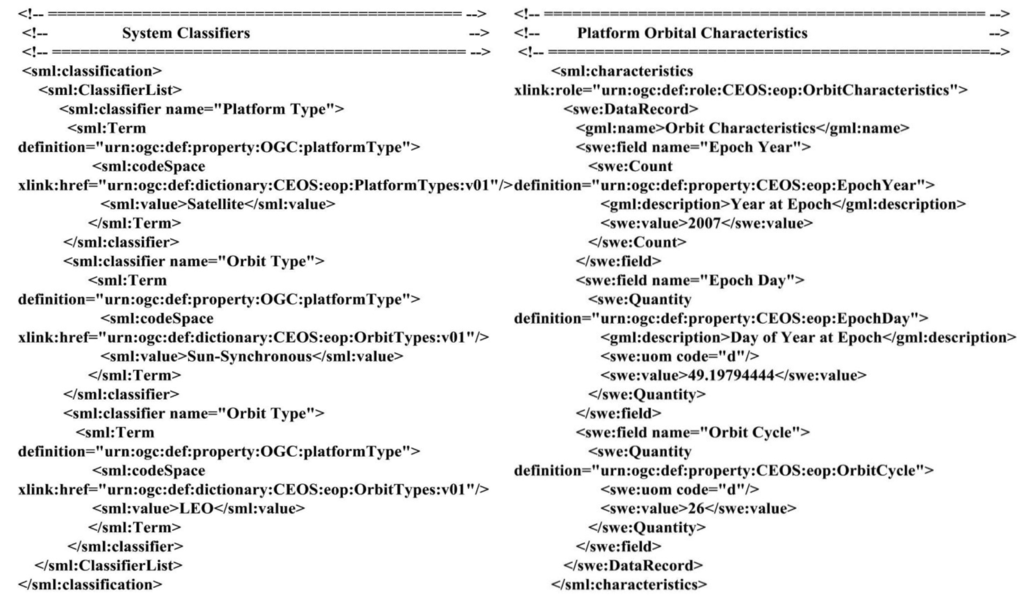
Task plan. According to the area, temporal, spatial resolution, spectrum information of the task, the task plan module queries the sensor registration information using the SensorML, and retrieves the sensors satisfying the demands. Then, the data acquiring demands are sent to the sensors. An example of the SensorML code is shown in Figure 12. This step can be considered as the sensor plan step in the service engine layer in Section 4.3.
Step 4
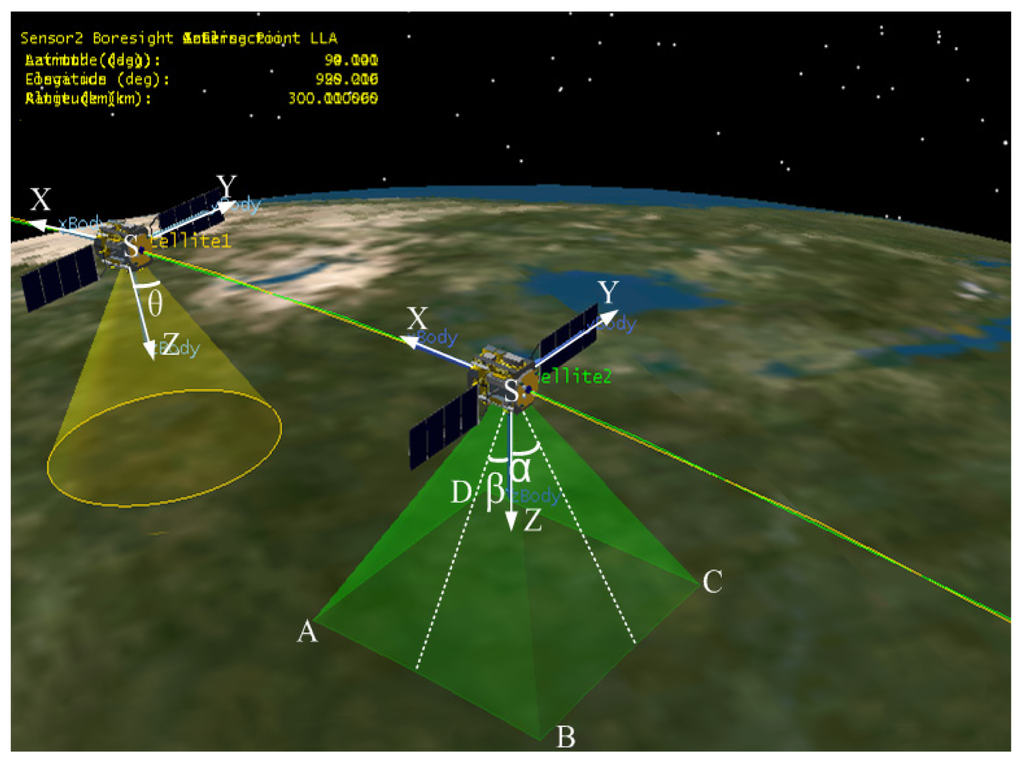
Data acquisition by sensors. When the sensors receive the tasks, they will observe the area following the pre-defined attributes (see in Figure 13). The acquired data will be sent to the ground and stored in the database with standard descript language, for example OWL. After all these processes are finished, notifications will be sent to the service engine again for data processing.
Step 5
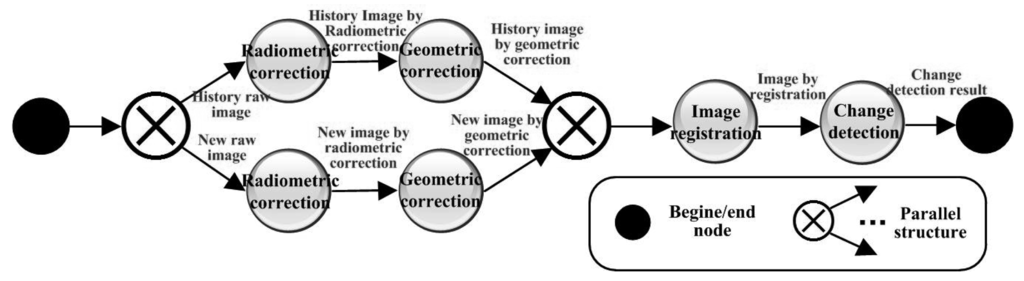
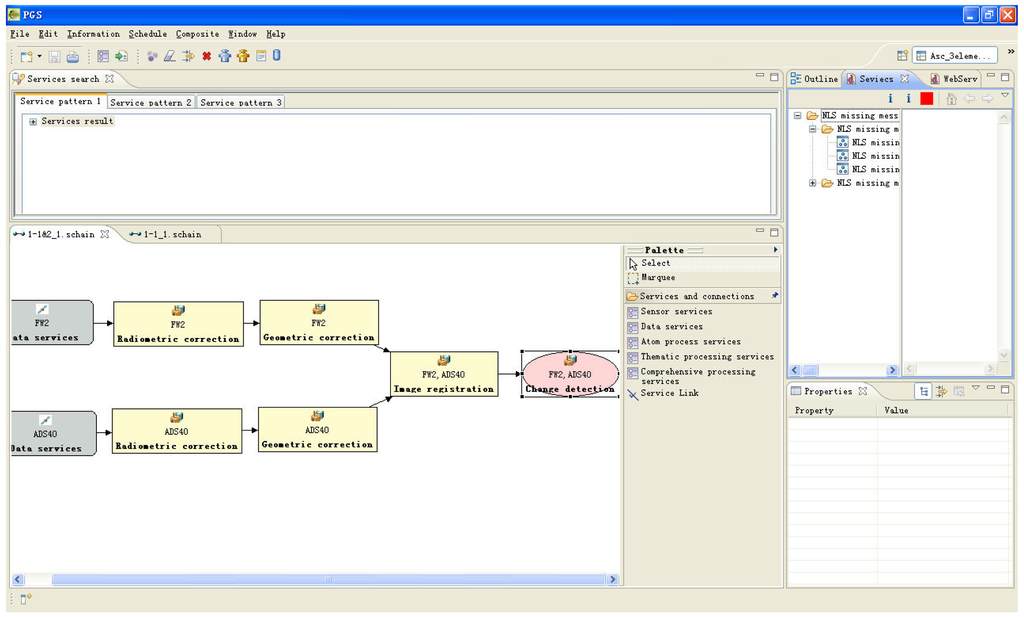
Service composition. When the service engine receives the demands, it then begins to compose services for the services chain. In this case, the change detention method by comparing the remote sensing images before and after the earthquake is an effective approach to obtain the overall damage information. Therefore, a change detection service chain is implemented as shown in Figure 14. In the composition process, the service engine performs querying, matching, and selecting services (chain) in the services (chain) database. The results of the service chain after the service composition are shown in Figure 15. The steps of services discovery and services composition in service engine layer in Section 4.3 are included in this step.
Step 6
Service chain execution. Once the GISC has been generated, the last task is to bind every service logically to actual services distributed in the internet. The active BPEL engine is used for GISC execution. After the services chain has been executed, the results will be sent to the users. This step corresponds to the service chain execution in the service engine layer mentioned in Section 4.3.
The above steps were implemented and used for damage estimation in the Wenchuan earthquake. The basic functions of PGIS such as task analysis, managing sensors for data acquisition, service composition, service chain construction and execution were implemented. Preliminary experimental results show that the PGIS is capable of providing valuable geospatial services to support decision making in disaster estimation and mitigation, and the important properties of service-oriented geospatial information services including data interoperability, flexibility, and reusability can be achieved. It should be noted that the complete implementation of an actual PGIS application is a huge task since it covers various aspects as described in this paper. The next step of the implementation will focus on the autonomy of the system, self-adaptation of the services, and the efficient aggregation and cooperation of the service chain. More geospatial and socioeconomic data from the Wenchuan earthquake will be employed for experimental analysis. More detailed geospatial services (e.g., the situations and analysis about building collapse, landslide dam, and vegetation destruction due to the earthquake) will be implemented and integrated in the PGIS system. The performance and efficiency of using the PGIS for decision making purposes will be quantitatively evaluated.
6. Conclusions and Future Work
This paper presents a service-orientated architecture for proactive geospatial information services (PGIS), integrating the sensor, data, processing, and human services. PGIS is able to organize, aggregate, and co-operate services by composing small scale services into service chains to meet complicated user requirements. It is a flexible, reusable, and scalable system to share and interoperate geospatial data and information extensively. The developed PGIS framework has been implemented and preliminary experiments have been performed to verify its performance. The results show that the important properties of PGIS including interoperability, flexibility, and reusability can be achieved.
The actual problem of service-oriented geospatial applications is much more complicated than the testbed shows. Further detailed research and developments will be performed in order to achieve a PGIS solution valid for actual complicated geospatial applications in different contexts and domains. Future efforts also include the development and evaluation of techniques for creation of workflows considering special constraints related to particular geospatial information services. Exploiting human input's role in the PGIS architecture will be emphasized. Investigation of the use of specialized tools to reduce the processing time is also of interest.
Acknowledgments
This work described in this paper was supported by a grant from the Research Grants Council of Hong Kong (Project No: PolyU 5312/10E), the National Natural Science Foundation of China (NSFC: 41001220), and the Postdoctoral Research Foundation of the Central South University.
References
- Di, L.P.; Moe, K.; van Zyl, T.L. Earth Observation Sensor Web: An Overview. IEEE J. Appl. Earth Obs. Remote Sens. 2010, 3, 415–417. [Google Scholar]
- Gough, N.R.; Yaffe, M.B. Conquering the Data Mountain. Sci. Signal. 2011, 4. eg.2. [Google Scholar]
- Botts, M.; Percivall, G.; Reed, C.; Davidson, J. OGC (R) Sensor Web enablement: Overview and high level architecture. Geosens. Netw. 2008, 4540, 175–190. [Google Scholar]
- Heath, T.; Bizer, C. Linked Data: Evolving the Web into a Global Data Space; Morgan & Claypool Publishers: San Rafael, CA, USA, 2011. [Google Scholar]
- Foster, I. Service-Oriented Science. Science 2005, 308, 814–817. [Google Scholar]
- Alameh, N. Chaining geographic information Web services. IEEE Internet Comput. 2003, 7, 22–29. [Google Scholar]
- Sheth, A. Citizen Sensing, Social Signals, and Enriching Human Experience. IEEE Internet Comput. 2009, 13, 80–85. [Google Scholar]
- Clery, D.; Voss, D. All for one and one for all. Science 2005, 308, 757. [Google Scholar]
- Li, H.; Zhu, Q.; Yang, X. Hierarchical Constraint Model for Focused Geospatial Information services. Proceedings of the International Conference on Earth Observation Data Processing and Analysis, Wuhan, China, 28–30 December 2008.
- Li, H.; Yang, X. A Min-Conflict Heuristic-Based Web Service Chain Reconfiguration Approach. Intell. Inf. Manag. 2010, 2, 597–607. [Google Scholar]
- Li, H.; Zhu, Q.; Zhu, X.; Sui, H. Task-Oriented Remote Sensing Information Focused Services. In Earth Observing and Navigating; Science Press: Beijing, China, 2010. [Google Scholar]
- Li, H.; Zhu, Q.; Yang, X.; Xu, L. Geo-information processing service composition for concurrent tasks: A QoS-aware game theory approach. Comput. Geosci. 2011. [Google Scholar] [CrossRef]
- Castells, M.; Cardoso, G. The Network Society: From Knowledge to Policy; Center for Transatlantic Relations: Washington, DC, USA, 2006. [Google Scholar]
- Craven, P.; Wellman, B. The Network City. Sociol. Inq. 2007, 43, 57–88. [Google Scholar]
- Yu, G.N.; Di, L.P.; Zhang, B.; Wang, H.L. Coordination through Geospatial Web Service Workflow in the Sensor Web Environment. IEEE J. Appl. Earth Obs. Remote Sens. 2010, 3, 433–441. [Google Scholar]
- Cheung, S.-Y.; Varaiya, P. Traffic Surveillance by Wireless Sensor Networks: Final Report. Institute of Transportation Studies; University of California: Berkeley, CA, USA, 2007. [Google Scholar]
- Murray-Rust, P. Open Data in Science. Nat. Proc. 2008, 34, 1–23. [Google Scholar]
- Rees, A.; Espinoza, J. Online Databases and Paleomaps. Proceedings of Geoinformatics 2006, Reston, VA, USA, 10–12 May 2006.
- de la Beaujardiere, J. Web Map Service (WMS) Implementation Specification; Open Geospatial Consortium, Inc.: Wayland, MA, USA, 2004; p. 85. [Google Scholar]
- Vretanos, P. Web Feature Service (WFS) Implementation Specification; Open Geospatial Consortium, Inc.: Wayland, MA, USA, 2005; p. 131. [Google Scholar]
- Evans, J.D. Web Coverage Service (WCS); Open Geospatial Consortium, Inc.: Wayland, MA, USA, 2003; no. OGC 03–065r6. Available online: https://portal.opengeospatial.org/ (accessed on 5 June 2011).
- Schut, P. Web Processing Service (WPS) Implementation Specification; Open Geospatial Consortium, Inc.: Wayland, MA, USA, 2007; p. 45. [Google Scholar]
- OGC WMS Server List. Available online: http://www.skylab-mobilesystems.com/en/wms_serverlist.html (accessed on 12 December 2011).
- WMS Results Report. Available online: http://registry.fgdc.gov/statuschecker/wmsResultsReport.php (accessed on 12 December 2011).
- Fox, P.; Hendler, J. Changing the Equation on Scientific Data Visualization. Science 2011, 331, 705–708. [Google Scholar]
- Bizer, C.; Heath, T.; Berners-Lee, T. Linked Data–The Story So Far. Int. J. Semant. Web Inf. Syst. 2009, 5, 1–22. [Google Scholar]
- Gershenfeld, N.; Krikorian, R.; Cohen, D. The Internet of things. Sci. Am. 2004, 291, 76–81. [Google Scholar]
- Yick, J.; Mukherjee, B.; Ghosal, D. Wireless sensor network survey. Comput. Netw. 2008, 52, 2292–2330. [Google Scholar]
- Reed, C.; Botts, M.; Davidson, J.; Percivall, G. OGC (R) Sensor Web Enablement: Overview and high level architecture. IEEE Autotestcon 2007, 372–380. [Google Scholar]
- Gibbons, P.B.; Karp, B.; Ke, Y.; Nath, S.; Seshan, S. IrisNet: An architecture for a worldwide sensor web. IEEE Perv. Comput. 2003, 2, 22–33. [Google Scholar]
- Antoniou, G.; Harmelen, F.V. Web Ontology Language: OWL. In Handbook on Ontologies; Staab, S., Studer, R., Eds.; Springer: Berlin, Germany, 2003; pp. 67–92. [Google Scholar]
- Yau, S.S.; An, H.G. Software Engineering Meets Services and Cloud Computing. Computer 2011, 44, 46–52. [Google Scholar]
- Broering, A.; Echterhoff, J.; Jirka, S.; Simonis, I.; Everding, T.; Stasch, C.; Liang, S.; Lemmens, R. New Generation Sensor Web Enablement. Sensors 2011, 11, 2652–2699. [Google Scholar]
- Stuckenschmidt, H. Towards distributed processing of RDF path queries. J. ACM 2005, 32, 112–124. [Google Scholar]
- Zeng, L.; Benatallah, B.; Ngu, A.H.H.; Dumas, M.; Kalagnanam, J.; Chang, H. QoS-Aware Middleware for Web Services Composition. IEEE Trans. Softw. Eng. 2004, 30, 311–327. [Google Scholar]
© 2011 by the authors; licensee MDPI, Basel, Switzerland. This article is an open access article distributed under the terms and conditions of the Creative Commons Attribution license (http://creativecommons.org/licenses/by/3.0/).