
Exploring Time-Series Forecasting Models for Dynamic Pricing in Digital Signage Advertising


Faculty of Information Science and Technology, Multimedia University, Melaka 75450, Malaysia
*
Author to whom correspondence should be addressed.
Future Internet 2021, 13(10), 241; https://doi.org/10.3390/fi13100241
Submission received: 26 August 2021
/
Revised: 13 September 2021
/
Accepted: 13 September 2021
/
Published: 22 September 2021
(This article belongs to the Special Issue Big Data Analytics, Privacy and Visualization)
Abstract
:Audience attention is vital in Digital Signage Advertising (DSA), as it has a significant impact on the pricing decision to advertise on those media. Various environmental factors affect the audience attention level toward advertising signage. Fixed-price strategies, which have been applied in DSA for pricing decisions, are generally inefficient at maximizing the potential profit of the service provider, as the environmental factors that could affect the audience attention are changing fast and are generally not considered in the current pricing solutions in a timely manner. Therefore, the time-series forecasting method is a suitable pricing solution for DSA, as it improves the pricing decision by modeling the changes in the environmental factors and audience attention level toward signage for optimal pricing. However, it is difficult to determine an optimal price forecasting model for DSA with the increasing number of available time-series forecasting models in recent years. Based on the 84 research articles reviewed, the data characteristics analysis in terms of linearity, stationarity, volatility, and dataset size is helpful in determining the optimal model for time-series price forecasting. This paper has reviewed the widely used time-series forecasting models and identified the related data characteristics of each model. A framework is proposed to demonstrate the model selection process for dynamic pricing in DSA based on its data characteristics analysis, paving the way for future research of pricing solutions for DSA.

1. Introduction
Audience attention is a factor that has the most significant impact on the pricing decision of Digital Signage Advertising (DSA) [1]. Generally, the higher the attention level received by a digital signage advertisement, the higher the profit expectancy. Various environmental factors can influence the audience attention level, including location popularity, temperature and air humidity, weather condition, social class of the surrounding community, and others [2]. These factors are important in determining the pricing decision for DSA to maximize revenue and increase advertising effectiveness.
The current pricing solutions of DSA show some deficiencies in obtaining the optimal pricing decision. Commonly, the pricing mechanisms applied to DSA are the fixed-price strategy or the auction-based pricing strategy [1,3]. In a fixed-price strategy, the advertising spot in a specific digital signage is charged with a fixed predetermined price. It can be in the form of direct sales or a guaranteed contract from the service provider. The price is commonly established based on the audience attention level of an advertisement spot. However, the changes of attention level toward the spot in time due to the changes in the surrounding environmental factors are not considered, resulting in sub-optimal pricing. In an auction-based pricing strategy, the price varies based on contextual information such as the location and time, the number of detected mobile devices nearby, and others. This information is used as the factors to generate a bid, and the advertising spot will be sold to the highest bidders. This approach is beneficial in the sense of better utilizing the resources of the service provider. However, using such a scheme might be inefficient for the advertiser because it requires time-consuming bidding actions. Thus, dynamic pricing solutions need to create a significant benefit to the service provider as well as the advertiser [4].
With recent technology advancements, more dynamic pricing solutions are emerging, applying time-series forecasting methods to predict future activities based on historical data [5]. They provide a strong foundation for time-series forecasting dynamic pricing solutions using statistical, AI, and hybrid models [6,7]. There are several ways to categorize the time-series forecasting models. Wang suggested three main categories of time-series forecasting methods as statistical models, Artificial Intelligence (AI) models, and hybrid models [6]. On the other hand, Neha Sehgal and Krishan classified the time-series forecasting models as stochastic models, AI models, and regression models. However, both the regression and stochastic models are using similar statistical inferences to establish the relationship between the price and other relevant factors. Hence, both stochastic and regression models are classified under the subcategories of statistical models in our review. Figure 1 elucidates the classification tree of the seven most widely used time-series forecasting models on price estimation.
The existing price forecasting methods that applied the time-series forecasting models are exemplified in different domains for its applicability. However, as a real-world problem is often complicated, no single model can perform the best in every situation [8]. With an increasing number of models, the model selection decision is also difficult, especially when vital information and knowledge are insufficient. Hence, a model selection framework is crucial for identifying a suitable approach for different data characteristics. From the review, there are four relevant essential data characteristics: namely, data linearity, stationarity, volatility, and the size of the dataset. These data characteristics are essential factors in selecting the optimal forecasting model for pricing decisions, particularly in its usage and interpretability in DSA.
This review aims to structurally analyze the data characteristics of different time-series forecasting models, along with a proposed framework for the optimal model selection of dynamic pricing in DSA. The main contributions of this paper are summarized as follows:
- -
- To review the widely used time-series forecasting models, providing an abstract of the different models that can potentially be applied for dynamic pricing.
- -
- To discuss the relationship of data characteristics to the time-series forecasting models from each category.
- -
- To investigate the applicability of the model selection framework based on the data characteristics of the dataset in DSA.
This paper is divided into four sections. Section 2 presents the review of time-series forecasting models based on the data characteristics. Section 3 shows a summary of the suitable data characteristics for the time-series forecasting models and a proposed framework for optimal model selection based on the data characteristic analysis of DSA. Conclusions are drawn in Section 4.
2. Review on Time-Series Forecasting Studies
Time-series forecasting is used to predict future activities based on current historical data [9]. Commonly, the time-series data have the following characteristics: linearity, stationarity, and volatility. Linearity refers to the linear relationships of the time-series data to the time [10]. Stationary time-series data can be recognized as a property that does not depend on the time [11]. Generally, non-stationary time-series data include observations with trend and seasonality. The trend indicates the general movement of the data in each observed time frame without considering the data seasonality. Seasonality indicates a periodic fluctuation, which can be affected by time, magnitude, and direction. Volatility refers to the unexpected rise or fall of time-series data, which is also known as heteroscedasticity, where the time-series data variance comprises rapid changes between extremely high and low values [12]. As there are many available time-series forecasting models, the optimal model selection could be difficult. Thus, the above-mentioned data characteristics are essential in selecting an optimal time-series forecasting model, as the different models have different capabilities in handling different data characteristics. Apart from the three data characteristics, we included the size of the dataset as another consideration in selecting the optimal model, as it can influence the model performance, as will be seen shortly.
The evolution of seven time-series forecasting models over the past two decades was studied to discover the popular models for dynamic pricing. Table 1 shows the listing of the studies. Figure 2 illustrates the distribution of the studies, showing the evolution of the model application in different domains. The Autoregressive Integrated Moving Average (ARIMA) and Generalized Autoregressive Conditional Heteroscedasticity (GARCH) regression models, as a subcategory of the statistical models, have been applied since 2003. The regression model applications spanned over two decades. Stochastic models, such as Hidden Markov Model (HMM), have been used since 2007. The application of this model does not show any spike during the studied period. However, it was noted that the application of both regression and stochastic models were enhanced or combined with other approaches, such as the AI model, into the hybrid models starting from the 2010s to complement its shortcomings.
Machine Learning (ML) models (of the AI models) have been applied since 2006, including Random Forest (RF) and Support Vector Machine (SVM). It was noted that these approaches were becoming more widespread in the 2010s as AI receives more attention. In addition, Deep Learning (DL) models, as a subcategory of the AI models, including Artificial Neural Network (ANN) and Recurrent Neural Network (RNN), were introduced in the early 2000s, although not much attention was given to the application of DL models until the 2010s. From the review, the application of DL models in the 2000s was less than the application of the regression and stochastic models, as shown in Figure 2a. During that time, researchers were investigating new ways to improve the model performance. Thus, different combinations of hybrid models have been proposed and presented. More attention was given to the hybrid models from the 2010s due to their robustness and the availability of computing resources.
Notably, the stock and electricity markets have always been a focus of time-series forecasting, as shown in Figure 2b. Different models have a relatively higher application count in these two fields, which is likely due to the market complexity that is highly volatile. It is also noted that the application of time-series forecasting is extending to other domains for dynamic pricing recently. The following section introduces the statistical model, AI model, and hybrid model for dynamic pricing solutions.
2.1. Statistical Model
A statistical model is a mathematical model that can be used for time-series forecasting [96]. It is classified into two categories of regression and stochastic models.
2.1.1. Regression Model
A regression model is a statistical technique that is used for finding the relationship between the data. It is widely applicable as it is simpler to compute [5,10]. This model can establish the relationship between the time-series data and the predicted price. The most popularly used regression models, including Autoregressive Integrated Moving Average (ARIMA) and Generalized Autoregressive Conditional Heteroscedasticity (GARCH), are introduced in this section.
Autoregressive Integrated Moving Average (ARIMA)
ARIMA is a linear regression model that works efficiently with stable correlated time-series data [82]. It can be applied to time-series forecasting problems in any domain based on the principle of univariate analysis. The model works well on stationary time-series data. The theoretical background of ARIMA is explained in [97].
Some studies have exemplified the applicability of ARIMA in forecasting time-series in different domains such as cryptocurrencies [13], stock [14,15,16], rubber and latex [17,18], agricultural and e-commerce products [19,20,21,27], gold [22,23], and electricity [24,25,26] from 2003 to 2019 and demonstrated exceptionally promising results. From the studies made, ARIMA has difficulty when handling non-stationary time-series data, as it is trying to model the changes based on the historical time-series data with linearity assumptions when performing forecasting. It is noticed that the following factors will affect the model performance: sudden fluctuation [23], nonlinear and non-stationary time-series data [21], and multi-step ahead forecasting [98]. There are other variations of ARIMA introduced, such as ARIMA with the independent variable (ARIMAX) [17] and Seasonal ARIMA (SARIMA) [18] for multivariate modeling and seasonal time-series data problems, respectively. It is noticeable that ARIMA produces an exceptional performance when the data are linear and stationary. Table 2 summarizes the studies applying the ARIMA.
Generalized Autoregressive Conditional Heteroscedasticity (GARCH)
GARCH is refined from the ARCH model, as proposed by Bollerslev [99]. This model overcomes the weaknesses of the ARCH model, as the ARCH model is of a very high order with huge number of parameter estimations [12]. GARCH is widely applied for economic and financial series forecasting. This model was found to have higher efficiency in forecasting when working with data of high volatility compared to ARIMA. The latter is limited in the autoregressive heteroscedasticity (ARCH) effect and is of linear time-series data, as it is assumed that the future value is in a linear relationship to time [12,100].
From the review, GARCH has been deployed in different domains for forecasting data with high volatility, such as the prices of gold [28,29], stocks and the financial market [30,31,32,33], agricultural products [34], and power and electricity [12,35] from 2005 to 2021. GARCH is proven to have better performance than ARIMA if the data have high volatility. This can be verified by conducting the Lagrange Multiplier (LM) test [28,34]. The results indicate that ARIMA cannot predict well due to the volatility of the data. There are different refinements of GARCH, including Exponential GARCH (EGARCH) [12] (capturing asymmetric volatility of the data) and nonparametric GARCH (NPGARCH) [33] (removing the parameterized assumptions, which indicates that the data are in the relationship of square linear and stochastically volatile). Overall, GARCH is suitable for data with high volatility. However, for cases where the time-series data have a linear relationship, this model may not be able to model the time-series data well compared to the ARIMA approach. Table 3 summarizes the review on the studies of GARCH.
2.1.2. Stochastic Model
The stochastic model is widely applied for time-series forecasting [7] to draw inferences of the characteristics of the time-series data [5]. Different from the regression model, the inferences made using the stochastic model are based on the principles of probabilities. On the other hand, the regression model is used to identify the linear relationship between the time-series data and the price outcome. One of the stochastic models, Hidden Markov Model (HMM) is explained in this section.
Hidden Markov Model (HMM)
HMM was first introduced in 1996 by Baum and Petrie [101]. HMM is a double stochastic process that introduces the hidden states with the unobservable underlying stochastic process. HMM has been applied to time-series forecasting in different domains such as forecasting prices of stock and option [36,37,38], commodity market [39], electricity [40,41], crude oil [42], and currency exchange rate [43] from 2007 to 2018. As the real-life market is complex and highly volatile with nonlinear relationships, HMM helps model the time-series data with the hidden states. The model can find the hidden states of the time-series data to improve its forecasting capability and accuracy [102]. HMM is suitable for data with high volatility, as hidden states of the model can simulate different volatility regimes. In addition, the model considered the times-series data correlation in interpreting the data characteristic. Hence, the model is suitable for dynamic pricing when the time-series data are non-stationary and high in volatility. It is noticed that HMM has a better performance compared to regression models such as GARCH when the data are high in volatility and has a larger sample size [38,103]. HMM can also outperform some Deep Learning (DL) models due to its utterly probabilistic state architecture [36,104]. In addition, the model does not require a huge amount of training data as DL models do. In short, HMM is suitable for nonlinear and highly volatile data, as it can capture the changes of every time step well. Table 4 summarizes the studies using HMM.
2.2. Artificial Intelligence Model (AI)
Artificial Intelligence (AI) refers to a machine that can mimic or act like a human when provided with the human-like capabilities such as perception, manipulation, communication, learning, and problem-solving [105]. Comparing to the statistical models, the AI model learns from past data to improve its performance instead of identifying the optimal parameters based on probability as in the statistical models. In addition, the AI models are widely applied in time-series forecasting to identify the hidden data patterns to make an accurate approximation [8]. Two subcategories of AI models are the Machine Learning (ML) models and Deep Learning (DL) models.
2.2.1. Machine Learning Model (ML)
ML models can produce reliable predictions by identifying the hidden patterns of the historical data for trends and relationships [106]. It can be used for time-series forecasting as it can extract the information from the time-series data during the learning process and learn from the extracted information to perform future forecasting [107]. The two most widely applied machine learning approaches are Support Vector Machine (SVM) and Random Forest (RF).
Support Vector Machine (SVM)
V. Vapnik first proposed Support Vector Machine (SVM) in 1995 [108]. SVM is a type of learning algorithm proposed to improve the neural network’s generalizability to achieve the global optimum solutions. SVM was first introduced for classification tasks, and it is extended for regression and time-series forecasting problems with excellent outcomes [47,109].
SVM has been applied in various domains for price forecasting, such as crude oil [44,45,46,47], rubber [48], gold [49], and electric [50,51,52,53], agricultural [54], and stock [55] from 2005 to 2021. SVM can avoid the over-fitting problem and model the nonlinear relationships stably, as it applied the risk minimization principle in training. SVM has been tested and compared to statistical models such as ARIMA and has shown a better performance [47,49]. The interpreted result suggests that SVM performs better for capturing nonlinear relationships and in handling irregularities than statistical models. However, SVM has lower transparency with very high dimensionalities, where the score of the results cannot be represented as a simple parametric function [110]. The model also requires many steps to get to the best parameters to fit the model. Nevertheless, SVM generally will not work well on a large dataset, as it is constrained by time and memory optimization [111]. From the review, the SVM is robust in modeling the nonlinear data. Table 5 shows the studies on the SVM models.
Random Forest (RF)
Random Forest (RF) is an ensemble method formed by many decision trees that are used for both classification and regression processes, which was introduced by Breiman in 2001 [112]. RF has been applied in time-series forecasting for dynamic pricing, including forecasting the prices of power load [56] and electricity [57], diamond [58], exchange rate [59], gold [60], and stock [61] from 2006 to 2021. RF works better for data with high volatility and randomness, such as exchange rate, and it has outperformed the SVM [59]. In addition, RF can work faster and better on large training samples, with the training time significantly faster than the SVM. However, some studies have shown that RF performed worse than the regression models in modeling linear data [55,113]. In short, it is suitable for nonlinear, stationary, and highly volatile data. Table 6 included the studies of the RF models.
2.2.2. Deep Learning Model
Unlike the ML model, the DL model is inspired by the human neurological structure, and it is composed of a collection of neurons that are connected between layers to form a network [114]. However, both ML and DL models learn from the data to improve their performance. In addition, the DL model works exceptionally well compared to the statistical methods in nonlinear data forecasting [114]. Artificial Neural Network (ANN) and Recurrent Neural Network (RNN) are explained in the following section.
Artificial Neural Network (ANN)
Warren and Walter proposed the ANN in 1943 [115], which is a computational model inspired by the human biological nerve system. It is composed of layers of connected neurons. ANN has been applied in many domains for time-series forecasting, including the forecasting of prices for the agricultural product [62], electricity [63,64,65,66], gold [67], and stock [68,69,70] from 2004 to 2020. The application of ANN is more robust than the statistical models in capturing the trends and seasonality of the data—the non-stationarity of the data [62]. ANN is proven to work better than the statistical model with the time-series data that are nonlinear, stationary, and have sudden changes through the layering hierarchy [70]. Despite its superior result, the one significant drawback of ANN is its black-box nature [116]. The computational process of ANN is complex, and how the model decides is hardly understandable. There is also the risk of overfitting when there are too few data observations. The model will only memorize the unique data features, which means that it does not learn the underlying relationship of the data, resulting in lower generalizability. Table 7 summarizes the studies of ANN time-series forecasting.
Recurrent Neural Network (RNN)
RNN is a variation of ANN [117] with a feedback architecture that contains a feedback loop for later layers of the network to go back to the input layer. RNN has been proven to be a suitable method for time-series forecasting, as exemplified by the studies in forecasting the prices of stock [71,72,73,74,75], Bitcoin [76], fuel [77], gold [78], electricity [79,80,81], and agricultural [82] from 2006 to 2020. The introduced hidden state in RNN with the ability to memorize previous information helps improve its forecasting capability, even though the data scale is more extensive [82]. Long short-term Memory (LSTM) is introduced also as a refinement of RNN in remembering values for longer or shorter times [72]. From the reviews, RNN has shown an excellent result in nonlinear time-series forecasting as compared to the statistical model. RNN can model both the nonlinear and high volatile data well. Therefore, RNN would be a good choice for time-series forecasting for the above-mentioned data characteristic, provided that there are sufficient data observations. Table 8 shows the summarized review on the studies of RNN for time-series forecasting.
2.3. Hybrid Model
Hybrid models are generally a combination of two or more models from the statistical and AI categories. The hybrid model is usually more robust than the single models, as it combines and complements the advantages of a single model to improve the forecasting accuracy. The hybrid model is widely used in different domains for dynamic pricing schemes, including the domain of stock [83,84,85,94,95], crude oil [86,88,89], energy [90], carbon [87,91], electricity [92], and gold [93] from 2004 to 2021. Different combinations have been proven to successfully integrate the advantages of different models to improve the performance. For example, ANN-GARCH [93] accepted data nonlinearity and volatility. The proposed model demonstrated a significant advantage in modeling highly non-stationary and nonlinear time-series data by outperforming any of the single models. From these studies, the hybrid model is proven to have better forecasting capability for time-series data.
Although the hybrid model has demonstrated a promising outcome, such a model is usually highly complex and computationally intensive [118]. The determination of the models for combination is often tricky and challenging, as it requires an in-depth understanding of each method. Thus, a strong background of different models should be mastered and well-understood to decide on a suitable hybrid architecture. The hybrid models also have lower flexibility, since it is specifically designed to handle a particular problem. Table 9 shows the reviewed studies for the hybrid models.
3. Discussion
After reviewing the different time-series forecasting models presented in Section 2, it can be concluded that the data characteristics analysis is an important step in deciding the optimal model for forecasting, as each of them performs better on particular data characteristics. Consequently, in order to determine the optimal model selection for DSA, data characteristics analysis is performed. This section presents a summary of the suitable data characteristics for the models introduced in Section 2, which is followed by the DSA data analysis and a proposed framework for optimal model selection based on the result analysis.
3.1. Summary of Suitable Data Characteristics for the Included Models
In the review of the seven forecasting models, the importance of the different data characteristics in the optimal model selection for price forecasting is emphasized. Table 10 shows the suitability of data characteristics for each model. Each model has varying performance for the different data characteristics. The large dataset is generally built up with more than 100,000 observations, and the small dataset has fewer observations. This section presents a summary of the strengths and weaknesses of the models.
First, for regression models, ARIMA is suitable for linear and stationary data, whereas the GARCH model has a better performance when the data are high in volatility and is adaptable to non-stationary data. However, when the data have a linear relationship, ARIMA will have a better performance than GARCH. The stochastic model, HMM, introduced the hidden states that can simulate different volatility regimes. Therefore, it has better performance than a regression model such as GARCH when the data are high in volatility and there is a larger sample size. However, it should be noted that the hidden parameters of HMM are difficult to determine, and the algorithm will probably stop at a local maximum before reaching the most satisfactory result. Hence, this results in lower accuracy in price forecasting.
As one of the ML models, SVM is more effective than statistical models such as ARIMA and GARCH in the sense of its better capability of working with the nonlinear, non-stationary, and highly volatile data. Unlike the regression models, SVM is not limited to working with data having a linear relationship or high volatility, the algorithm is convex optimized. This means that it can find the global optimum of the result. Therefore, it is better than HMM in reaching the most promising result. It can generalize well to previously unseen data, overcoming the existing problems such as forecasting a sudden fluctuation. However, if the dataset is too large, SVM might not perform well due to the memory and optimization constraints. The main advantage of RF compared to SVM is its ability in handling massive datasets. RF has a good capability of avoiding overfitting by limiting the generalization error with an important requirement of a large dataset with less noise. However, when estimating the linear data, RF might have lower performance as compared to SVM and ARIMA due to its random behavior, and the prediction is computed based on the average values.
DL models such as ANN and RNN are both neural network models inspired by the human neuro system. They have a few pros and cons in common, such as good generalizability and good performance on nonlinear and non-stationary data modeling. However, these models are also black box in nature, which results in low model transparency. Both DL models have shown better results compared to ML models when the dataset size is sufficient for training. Among ANN and RNN, RNN has demonstrated a better result than ANN in forecasting data with high volatility.
Moreover, the hybrid model has demonstrated its robustness as a model that combines two or more models, complementing the advantages of the single model. Therefore, a hybrid model can better model the underlying relationship and obtain a more accurate result than any single model. In the case that any single model cannot take care of the different data characteristics, the application of the hybrid model is more appropriate.
The discussed models are generally being applied widely in different areas and have achieved outstanding results. Moreover, different comparative studies have pointed to the suitability of a particular model on certain data characteristics. In conclusion, this section has comprehensively shown the suitable data characteristics for each model.
3.2. DSA Data Analysis and Proposed Framework for Optimal Model Selection
As the data characteristics can influence the model performance, a study is conducted based on a collected dataset of DSA. As the attention level toward signage can greatly influence the pricing decision, the dependency and relationship of the environmental factors related to the attention level should be carefully considered. The environmental factors included in this study are location, weather, and temperature. These factors have significant impacts on the attention level and the final pricing decision [2]. Table 11 shows two examples of how the environmental factors impact the attention level and consequently the pricing of the DSA.
Realizing the environmental factors impacts on the pricing decision, the collected dataset is composed of three attributes including the temperature, air humidity level, and the popularity index of the surrounding business environment based on the two environmental factors, as shown in Table 11. They were collected from 13 locations of digital signage in Malaysia using data scraping methods from April to June 2021. The temperature and humidity data were obtained from OpenWeather API, while the popularity index was scraped from Google Maps.
These data characteristics are used to measure the index representing the attention level, which indirectly affects the price forecast of the DSA. Thus, this study aims to investigate the collected DSA data characteristics daily, monthly, and as a whole. The signage being analyzed was selected randomly. The signage with ID 1000, which was located at Negeri Sembilan, Malaysia, with coordinates (101.9119, 2.70179) was investigated in the study. The results for other signages were not presented in this article to avoid repetitive information.
3.2.1. Location
The location is the most applied factor in the traditional pricing scheme for DSA, such as a fixed price strategy and auction-based pricing mechanism [1]. The geographical environment and facilities surrounding the digital signage are the most crucial factors, as they strongly affect the accessibility and visibility of the digital signage, determining the audience attention level. For example, a higher rating of surrounding businesses can increase the crowd of a particular location, which indirectly increases the attention level toward the advertisement. Thus, the more prosperous a location is, the higher the attention level that can be obtained to improve the effectiveness of the advertisement. The different days and times also have a direct impact on the crowd size of the location. For example, the crowd on weekends will commonly be higher than the working days. Hence, it increases the demand for a DSA spot and results in higher prices. These indexes are indeed imperative in affecting the pricing decision. Considering its relationship with the attention level that can be obtained, the higher the value of these indexes, the higher the price.
Figure 3 illustrated the comparison of the popularity indices of the signage with ID 1000 for 24 h on weekdays and during the weekend. The popularity indices show different peak hours of the weekdays and weekend. Notably, the popularity index is higher on weekends compared to weekdays. Thus, this exemplifies the assumption that the signage will be attracting higher attention levels during the weekend than on weekdays, resulting in higher prices for DSA.
There is clearly a seasonal trend in the monthly and whole-dataset plots of the DSA data, as shown in Figure 4 and Figure 5. This represents a non-stationary data characteristic. Generally, both figures show the same seasonal trend, with the popularity index rising and falling cyclically, affecting the amount of audience attention that can be grabbed. Thus, a dynamic pricing scheme can be applied for DSA to maximize profit.
3.2.2. Weather and Temperature
The weather and temperature have a significant impact on the crowd size of a location, especially for outdoor environments. The changes in the weather include changes in the air humidity and temperature [119]. The weather can have many changes in a short duration. With fast-changing weather, an hourly update to precisely calculate the prices of an advertising spot can be performed. As bad weather will negatively affect outdoor activities and events, this will result in lower prices of the advertisements at those spots.
The temperature and air humidity data are analyzed. The data are complementary to each other. When the values of air humidity go down, the values of temperature go up. Figure 6 shows the changes in temperature and air humidity over 24 h on a randomly selected day to illustrate how these attributes change in a day. The data show an irregular movement in a longer time frame of 30 days and in the plot for the whole dataset, as shown in Figure 7 and Figure 8, respectively. Generally, the temperature and air humidity show a movement that is contradictory to each other. The weather can affect the crowd size. An extremely high or low temperature will result in the crowd of a location to decrease. Notably, the environmental factors show a different data characteristic.
Therefore, we observe that the data for each factor of the DSA show different characteristics. Based on the review studies, a framework is developed to analyze the data for optimal model selection. A list of procedures and tests can be used to determine the data characteristics. A linearity test can be conducted through data visualization using a scatter plot by observing if the point cluster forms a diagonal line. The data stationarity can be checked by using the Augmented Dickey–Fuller (ADF) test [120]. A Lagrange Multiplier (LM) test is used to check the existence of the ARCH effect to assess the volatility in the dataset [5]. The p-values of both ADF and LM tests are used to indicate if the null hypotheses of the test are accepted to determine the stationarity and volatility of the data. In addition, dataset size is determined based on the number of observations in the dataset. Based the result from each test, the optimal price-forecasting method for each case can be determined. Note that the hybrid model is not included in the framework, as the hybrid models are the combination of two or more single models targeting different data characteristics, depending on the specific forecasting problems handled. Figure 9 illustrates the proposed framework, with the corresponding tests to determine the optimal model selection.
From the above analysis, it is noticeable that each data point has different movements in time. The linearity, stationarity, and volatility tests for the environmental factors of the DSA dataset are performed to examine the data characteristics for each. Following the steps as illustrated in Figure 9, Table 12 shows the test results. Figure 10 shows the data visualization of the linearity test for the popularity index, temperature, and air humidity data. Based on Figure 10b,c, it is noticeable that the temperature and air humidity data show a linear relationship, respectively, as the points cluster along the diagonal line.
From the interpreted results, SVM is the optimal model for modeling the popularity index, while ARIMA is suitable for modeling both temperature and air humidity. Multiple models can forecast the respective environmental factors instead of using a single model to fit all the factors. As the environmental factors affect the attention level and consequently the pricing decisions, using multiple models for different data characteristics is better in forecasting the future values of the data for pricing decisions. In our case, where the pricing label is not available, a rule-based system can be applied by setting a threshold value for each environmental factor to generate the price. This can help effectively forecast the important factors that will affect the attention level and pricing decision for DSA. With the optimal models used, a better pricing decision can be made.
4. Conclusions and Future Work
This paper presented a list of widely used time-series forecasting models for dynamic pricing based on an extensive literature review. These models have been proven to have outstanding achievement in different domains. From the review, each model has its strength in dealing with different data characteristics. The advantages and disadvantages of each model are discussed and presented. In addition, the relationships between the models and the different data characteristics are investigated to suggest the optimal model selection for the price forecasting of DSA. From there, an optimal model selection framework is proposed based on the data characteristics analysis of DSA data. This structured review provides a solution of dynamic pricing using time-series forecasting, paving the way for future research on dynamic pricing in DSA.
For future work, an experimental study shall be carried out to examine the applicability of the proposed optimal model selection framework. More time-series data shall be collected to conduct the experimental study for dynamic pricing in DSA to investigate the effectiveness of the optimal model selection framework. Moreover, a customer behavioral targeting approach can be considered in identifying their preferences for better advertising effects [121].
Author Contributions
Funding acquisition, M.-C.L.; Investigation, Y.-F.T.; Project administration, M.-C.L.; Supervision, L.-Y.O.; Visualization, Y.-X.G.; Writing—original draft, Y.-F.T.; Writing—review and editing, L.-Y.O. and M.-C.L. All authors have read and agreed to the published version of the manuscript.
Funding
This research was funded by Telekom Malaysia Research & Development, grant number RDTC/191001 (MMUE/190086) and Multimedia University.
Data Availability Statement
Not Applicable, the study does not report any data.
Conflicts of Interest
The authors declare no conflict of interest.
References
- Bauer, C.; Dohmen, P.; Strauss, C. A conceptual framework for backend services of contextual digital signage. J. Serv. Sci. Res. 2012, 4, 271–297. [Google Scholar] [CrossRef]
- O’Driscoll, C. Real-Time, Targeted, Out-Of-Home Advertising with Dynamic Pricing. Trinity College Dublin. 2019. Available online: https://www.scss.tcd.ie/publications/theses/diss/2019/TCD-SCSS-DISSERTATION-2019-012.pdf (accessed on 12 September 2021).
- Choi, H.; Mela, C.; Balseiro, S.; Leary, A. Online Display Advertising Markets: A Literature Review and Future Directions. Inf. Syst. Res. 2020, 31, 556–575. [Google Scholar] [CrossRef]
- Zhang, F.; Wang, C. Dynamic pricing strategy and coordination in a dual-channel supply chain considering service value. Appl. Math. Model. 2018, 54, 722–742. [Google Scholar] [CrossRef]
- Athiyarath, S.; Paul, M.; Krishnaswamy, S. A Comparative Study and Analysis of Time Series Forecasting Techniques. SN Comput. Sci. 2020, 1, 175. [Google Scholar] [CrossRef]
- Wang, D.; Luo, H.; Grunder, O.; Lin, Y.; Guo, H. Multi-step ahead electricity price forecasting using a hybrid model based on two-layer decomposition technique and BP neural network optimized by firefly algorithm. Appl. Energy 2017, 190, 390–407. [Google Scholar] [CrossRef]
- Sehgal, N.; Pandey, K.K. Artificial intelligence methods for oil price forecasting: A review and evaluation. Energy Syst. 2015, 6, 479–506. [Google Scholar] [CrossRef]
- Gao, W.; Aamir, M.; Shabri, A.B.; Dewan, R.; Aslam, A. Forecasting Crude Oil Price Using Kalman Filter Based on the Reconstruction of Modes of Decomposition Ensemble Model. IEEE Access 2019, 7, 149908–149925. [Google Scholar] [CrossRef]
- Mahalakshmi, G.; Sridevi, S.; Rajaram, S. A survey on forecasting of time series data. In Proceedings of the 2016 International Conference on Computing Technologies and Intelligent Data Engineering (ICCTIDE’16), Kovilpatti, India, 7–9 January 2016; pp. 1–8. [Google Scholar]
- Montgomery, D.C.; Peck, E.A.; Vining, G.G. Introduction to Linear Regression Analysis; John Wiley & Sons: Hoboken, NJ, USA, 2021. [Google Scholar]
- Hyndman, R.J. Forecasting: Principles and Practice, 2nd ed.; OTexts: Melbourne, Australia, 2018. [Google Scholar]
- Lama, A.; Jha, G.K.; Paul, R.K.; Gurung, B. Modelling and Forecasting of Price Volatility: An Application of GARCH and EGARCH Models. Agric. Econ. Res. Rev. 2015, 28, 73. [Google Scholar] [CrossRef]
- Mittal, R.; Gehi, R.; Bhatia, M.P.S. Forecasting the Price of Cryptocurrencies and Validating Using Arima. Int. J. Inf. Syst. Manag. Sci. 2018, 1, 5. [Google Scholar]
- Ariyo, A.A.; Adewumi, A.O.; Ayo, C.K. Stock Price Prediction Using the ARIMA Model. In Proceedings of the 2014 UKSim-AMSS 16th International Conference on Computer Modelling and Simulation, Cambridge, UK, 26–28 March 2014; IEEE: Washington, DC, USA, 2014; pp. 106–112. [Google Scholar]
- Rotela Junior, P.; Salomon, F.L.R.; de Oliveira Pamplona, E. ARIMA: An Applied Time Series Forecasting Model for the Bovespa Stock Index. Appl. Math. 2014, 5, 3383–3391. [Google Scholar] [CrossRef] [Green Version]
- Wahyudi, S.T. The ARIMA Model for the Indonesia Stock Price. Int. J. Econ. Manag. 2017, 11, 223–236. [Google Scholar]
- Cherdchoongam, S.; Rungreunganun, V. Forecasting the Price of Natural Rubber in Thailand Using the ARIMA Model. King Mongkut’s Univ. Technol. North. Bangk. Int. J. Appl. Sci. Technol. 2016, 7. [Google Scholar] [CrossRef]
- Udomraksasakul, C.; Rungreunganun, V. Forecasting the Price of Field Latex in the Area of Southeast Coast of Thailand Using the ARIMA Model. Int. J. Appl. Eng. Res. 2018, 13, 550–556. [Google Scholar]
- Verma, V.K.; Kumar, P. Use of ARIMA modeling in forecasting coriander prices for Rajasthan. Int. J. Seed Spices 2016, 6, 42–45. [Google Scholar]
- Jadhav, V.; Reddy, B.V.C.; Gaddi, G.M. Application of ARIMA Model for Forecasting Agricultural Prices. J. Agric. Sci. Technol. 2017, 19, 981–992. [Google Scholar]
- KumarMahto, A.; Biswas, R.; Alam, M.A. Short Term Forecasting of Agriculture Commodity Price by Using ARIMA: Based on Indian Market. In Advances in Computing and Data Sciences; Singh, M., Gupta, P.K., Tyagi, V., Flusser, J., Ören, T., Kashyap, R., Eds.; Communications in Computer and Information Science; Springer: Singapore, 2019; Volume 1045, pp. 452–461. ISBN 9789811399381. [Google Scholar]
- Bandyopadhyay, G. Gold Price Forecasting Using ARIMA Model. J. Adv. Manag. Sci. 2016, 4, 117–121. [Google Scholar] [CrossRef]
- Yang, X. The Prediction of Gold Price Using ARIMA Model. In Proceedings of the 2nd International Conference on Social Science, Public Health and Education (SSPHE 2018), Sanya, China, 28–27 November 2018; Atlantis Press: Sanya, China, 2019. [Google Scholar]
- Contreras, J.; Espinola, R.; Nogales, F.J.; Conejo, A.J. ARIMA models to predict next-day electricity prices. IEEE Trans. Power Syst. 2003, 18, 1014–1020. [Google Scholar] [CrossRef]
- Zhou, M.; Yan, Z.; Ni, Y.; Li, G. An ARIMA approach to forecasting electricity price with accuracy improvement by predicted errors. In Proceedings of the IEEE Power Engineering Society General Meeting, Denver, CO, USA, 6–10 June 2004; Volume 2, pp. 233–238. [Google Scholar]
- Jakasa, T.; Androcec, I.; Sprcic, P. Electricity price forecasting—ARIMA model approach. In Proceedings of the 2011 8th International Conference on the European Energy Market (EEM), Zagreb, Croatia, 25–27 May 2011; pp. 222–225. [Google Scholar]
- Carta, S.; Medda, A.; Pili, A.; Reforgiato Recupero, D.; Saia, R. Forecasting E-Commerce Products Prices by Combining an Autoregressive Integrated Moving Average (ARIMA) Model and Google Trends Data. Future Internet 2018, 11, 5. [Google Scholar] [CrossRef] [Green Version]
- Ping, P.Y.; Miswan, N.H.; Ahmad, M.H. Forecasting Malaysian gold using GARCH model. Appl. Math. Sci. 2013, 7, 2879–2884. [Google Scholar] [CrossRef]
- Yaziz, S.R.; Zakaria, R. Suhartono ARIMA and Symmetric GARCH-type Models in Forecasting Malaysia Gold Price. J. Phys. Conf. Ser. 2019, 1366, 012126. [Google Scholar] [CrossRef]
- Xing, D.-Z.; Li, H.-F.; Li, J.-C.; Long, C. Forecasting price of financial market crash via a new nonlinear potential GARCH model. Phys. Stat. Mech. Appl. 2021, 566, 125649. [Google Scholar] [CrossRef]
- Tripathy, S.; Rahman, A. Forecasting Daily Stock Volatility Using GARCH Model: A Comparison Between BSE and SSE. IUP J. Appl. Financ. 2013, 19, 71–83. [Google Scholar]
- Virginia, E.; Ginting, J.; Elfaki, F.A.M. Application of GARCH Model to Forecast Data and Volatility of Share Price of Energy (Study on Adaro Energy Tbk, LQ45). Int. J. Energy Econ. Policy 2018, 8, 131–140. [Google Scholar]
- Li, H.; Xiong, H.; Li, W.; Sun, Y.; Xu, G. A power price forecasting method based on nonparametric GARCH model. In Proceedings of the 2008 Third International Conference on Electric Utility Deregulation and Restructuring and Power Technologies, Nanjing, China, 6–9 April 2008; pp. 285–290. [Google Scholar]
- Bhardwaj, S.P.; Paul, R.K.; Singh, D.R.; Singh, K.N. An Empirical Investigation of Arima and Garch Models in Agricultural Price Forecasting. Econ. Aff. 2014, 59, 415. [Google Scholar] [CrossRef]
- Garcia, R.C.; Contreras, J.; vanAkkeren, M.; Garcia, J.B.C. A GARCH Forecasting Model to Predict Day-Ahead Electricity Prices. IEEE Trans. Power Syst. 2005, 20, 867–874. [Google Scholar] [CrossRef]
- Hassan, M.R.; Nath, B. Stock market forecasting using hidden Markov model: A new approach. In Proceedings of the 5th International Conference on Intelligent Systems Design and Applications (ISDA’05), Warsaw, Poland, 8–10 September 2005; pp. 192–196. [Google Scholar]
- Hassan, M.R. A combination of hidden Markov model and fuzzy model for stock market forecasting. Neurocomputing 2009, 72, 3439–3446. [Google Scholar] [CrossRef]
- Dimoulkas, I.; Amelin, M.; Hesamzadeh, M.R. Forecasting balancing market prices using Hidden Markov Models. In Proceedings of the 2016 13th International Conference on the European Energy Market (EEM), Porto, Portugal, 6–9 June 2016; pp. 1–5. [Google Scholar]
- Date, P.; Mamon, R.; Tenyakov, A. Filtering and forecasting commodity futures prices under an HMM framework. Energy Econ. 2013, 40, 1001–1013. [Google Scholar] [CrossRef] [Green Version]
- Valizadeh Haghi, H.; Tafresh, S.M.M. An Overview and Verification of Electiricity Price Forecasting Models. In Proceedings of the 2007 International Power Engineering Conference (IPEC 2007), Singapore, 3–6 December 2007. [Google Scholar]
- Zhang, J.; Wang, J.; Wang, R.; Hou, G. Forecasting next-day electricity prices with Hidden Markov Models. In Proceedings of the 2010 5th IEEE Conference on Industrial Electronics and Applications, Taichung, Taiwan, 15–17 June 2010; pp. 1736–1740. [Google Scholar]
- Bon, A.T.; Isah, N. Hidden Markov Model and Forward-Backward Algorithm in Crude Oil Price Forecasting. IOP Conf. Ser. Mater. Sci. Eng. 2016, 160, 012067. [Google Scholar] [CrossRef] [Green Version]
- Shaaib, A.R. Comparative Study of Artificial Neural Networks and Hidden Markov Model for Financial Time Series Prediction. Int. J. Eng. Inf. Technol. 2015, 1, 7. [Google Scholar]
- Xie, W.; Yu, L.; Xu, S.; Wang, S. A New Method for Crude Oil Price Forecasting Based on Support Vector Machines. In Computational Science—ICCS 2006; Alexandrov, V.N., van Albada, G.D., Sloot, P.M.A., Dongarra, J., Eds.; Lecture Notes in Computer Science; Springer: Berlin/Heidelberg, Germany, 2006; Volume 3994, pp. 444–451. ISBN 978-3-540-34385-1. [Google Scholar]
- Qi, Y.-L.; Zhang, W.-J. The Improved SVM Method for Forecasting the Fluctuation of International Crude Oil Price. In Proceedings of the Electronic Commerce and Business Intelligence International Conference, Beijing, China, 6–7 June 2009. [Google Scholar]
- Khashman, A.; Nwulu, N.I. Support Vector Machines versus Back Propagation Algorithm for Oil Price Prediction. In Advances in Neural Networks—ISNN 2011; Liu, D., Zhang, H., Polycarpou, M., Alippi, C., He, H., Eds.; Lecture Notes in Computer Science; Springer: Berlin/Heidelberg, Germany, 2011; Volume 6677, pp. 530–538. ISBN 978-3-642-21110-2. [Google Scholar]
- Yu, L.; Zhang, X.; Wang, S. Assessing Potentiality of Support Vector Machine Method in Crude Oil Price Forecasting. EURASIA J. Math. Sci. Technol. Educ. 2017, 13, 7893–7904. [Google Scholar] [CrossRef]
- Jing Jong, L.; Ismail, S.; Mustapha, A.; Helmy Abd Wahab, M.; Zulkarnain Syed Idrus, S. The Combination of Autoregressive Integrated Moving Average (ARIMA) and Support Vector Machines (SVM) for Daily Rubber Price Forecasting. IOP Conf. Ser. Mater. Sci. Eng. 2020, 917, 012044. [Google Scholar] [CrossRef]
- Makala, D.; Li, Z. Prediction of gold price with ARIMA and SVM. J. Phys. Conf. Ser. 2021, 1767, 012022. [Google Scholar] [CrossRef]
- Swief, R.A.; Hegazy, Y.G.; Abdel-Salam, T.S.; Bader, M.A. Support vector machines (SVM) based short term electricity load-price forecasting. In Proceedings of the 2009 IEEE Bucharest PowerTech, Bucharest, Romania, 28 June–2 July 2009; pp. 1–5. [Google Scholar]
- Mohamed, A.; El-Hawary, M.E. Mid-term electricity price forecasting using SVM. In Proceedings of the 2016 IEEE Canadian Conference on Electrical and Computer Engineering (CCECE), Vancouver, BC, Canada, 15–18 May 2016. [Google Scholar]
- Saini, D.; Saxena, A.; Bansal, R.C. Electricity price forecasting by linear regression and SVM. In Proceedings of the 2016 International Conference on Recent Advances and Innovations in Engineering (ICRAIE), Jaipur, India, 23–25 December 2016; pp. 1–7. [Google Scholar]
- Ma, Z.; Zhong, H.; Xie, L.; Xia, Q.; Kang, C. Month ahead average daily electricity price profile forecasting based on a hybrid nonlinear regression and SVM model: An ERCOT case study. J. Mod. Power Syst. Clean Energy 2018, 6, 281–291. [Google Scholar] [CrossRef]
- Akın, B.; Dizbay, İ.E.; Gümüşoğlu, Ş.; Güdücü, E. Forecasting the Direction of Agricultural Commodity Price Index through ANN, SVM and Decision Tree: Evidence from Raisin. Ege Acad. Rev. 2018, 18, 579–588. [Google Scholar]
- Kumar, M. Forecasting Stock Index Movement: A Comparision of Support Vector Machines and Random Forest. Available online: https://ssrn.com/abstract=876544 (accessed on 1 July 2021).
- Lahouar, A. Day-ahead load forecast using random forest and expert input selection. Energy Convers. Manag. 2015, 103, 1040–1051. [Google Scholar] [CrossRef]
- Mei, J.; He, D.; Harley, R.; Habetler, T.; Qu, G. A random forest method for real-time price forecasting in New York electricity market. In Proceedings of the 2014 IEEE PES General Meeting|Conference & Exposition, National Harbor, MD, USA, 27–31 July 2014; pp. 1–5. [Google Scholar]
- Sharma, G.; Tripathi, V.; Mahajan, M.; Kumar Srivastava, A. Comparative Analysis of Supervised Models for Diamond Price Prediction. In Proceedings of the 2021 11th International Conference on Cloud Computing, Data Science & Engineering (Confluence), Noida, India, 28–29 January 2021; pp. 1019–1022. [Google Scholar]
- Ramakrishnan, S.; Butt, S.; Chohan, M.A.; Ahmad, H. Forecasting Malaysian exchange rate using machine learning techniques based on commodities prices. In Proceedings of the 2017 International Conference on Research and Innovation in Information Systems (ICRIIS), Langkawi, Malaysia, 16–17 July 2017; pp. 1–5. [Google Scholar]
- Liu, D.; Li, Z. Gold Price Forecasting and Related Influence Factors Analysis Based on Random Forest. In Proceedings of the Tenth International Conference on Management Science and Engineering Management; Xu, J., Hajiyev, A., Nickel, S., Gen, M., Eds.; Advances in Intelligent Systems and Computing; Springer: Singapore, 2017; Volume 502, pp. 711–723. ISBN 978-981-10-1836-7. [Google Scholar]
- Khaidem, L.; Saha, S.; Dey, S.R. Predicting the direction of stock market prices using random forest. arXiv 2016, arXiv:1605.00003. [Google Scholar]
- Jha, G.K.; Sinha, K. Agricultural Price Forecasting Using Neural Network Model: An Innovative Information Delivery System. Agric. Econ. Res. 2013, 26, 229–239. [Google Scholar]
- Yamin, H.; Shahidehpour, S.; Li, Z. Adaptive short-term electricity price forecasting using artificial neural networks in the restructured power markets. Int. J. Electr. Power Energy Syst. 2004, 26, 571–581. [Google Scholar] [CrossRef]
- Ozozen, A.; Kayakutlu, G.; Ketterer, M.; Kayalica, O. A combined seasonal ARIMA and ANN model for improved results in electricity spot price forecasting: Case study in Turkey. In Proceedings of the 2016 Portland International Conference on Management of Engineering and Technology (PICMET), Honolulu, HI, USA, 4–8 September 2016; pp. 2681–2690. [Google Scholar]
- Ranjbar, M.; Soleymani, S.; Sadati, N.; Ranjbar, A.M. Electricity Price Forecasting Using Artificial Neural Network. Int. J. Electr. Power Energy Syst. 2011, 33, 550–555. [Google Scholar]
- Sahay, K.B.; Singh, K. Short-Term Price Forecasting by Using ANN Algorithms. In Proceedings of the 2018 International Electrical Engineering Congress (iEECON), Krabi, Thailand, 7–9 March 2018. [Google Scholar]
- Verma, S.; Thampi, G.T.; Rao, M. ANN based method for improving gold price forecasting accuracy through modified gradient descent methods. IAES Int. J. Artif. Intell. IJ-AI 2020, 9, 46. [Google Scholar] [CrossRef]
- Laboissiere, L.A.; Fernandes, R.A.S.; Lage, G.G. Maximum and minimum stock price forecasting of Brazilian power distribution companies based on artificial neural networks. Appl. Soft Comput. 2015, 35, 66–74. [Google Scholar] [CrossRef]
- Prastyo, A.; Junaedi, D.; Sulistiyo, M.D. Stock price forecasting using artificial neural network: (Case Study: PT. Telkom Indonesia). In Proceedings of the 2017 5th International Conference on Information and Communication Technology (ICoIC7), Melaka, Malaysia, 17–19 May 2017; pp. 1–6. [Google Scholar]
- Wijesinghe, G.W.R.I.; Rathnayaka, R.M.K.T. ARIMA and ANN Approach for forecasting daily stock price fluctuations of industries in Colombo Stock Exchange, Sri Lanka. In Proceedings of the 2020 5th International Conference on Information Technology Research (ICITR), Moratuwa, Sri Lanka, 2–4 December 2020; pp. 1–7. [Google Scholar]
- Sun, X.; Ni, Y. Recurrent Neural Network with Kernel Feature Extraction for Stock Prices Forecasting. In Proceedings of the 2006 International Conference on Computational Intelligence and Security, Guangzhou, China, 3–6 November 2006; pp. 903–907. [Google Scholar]
- Li, W.; Liao, J. A comparative study on trend forecasting approach for stock price time series. In Proceedings of the 2017 11th IEEE International Conference on Anti-counterfeiting, Security, and Identification (ASID), Xiamen, China, 27–29 October 2017; pp. 74–78. [Google Scholar]
- Wang, Y.; Liu, Y.; Wang, M.; Liu, R. LSTM Model Optimization on Stock Price Forecasting. In Proceedings of the 2018 17th International Symposium on Distributed Computing and Applications for Business Engineering and Science (DCABES), Wuxi, China, 19–23 October 2018; pp. 173–177. [Google Scholar]
- Siami-Namini, S.; Tavakoli, N.; Siami Namin, A. A Comparison of ARIMA and LSTM in Forecasting Time Series. In Proceedings of the 2018 17th IEEE International Conference on Machine Learning and Applications (ICMLA), Orlando, FL, USA, 17–20 December 2018; pp. 1394–1401. [Google Scholar]
- Du, J.; Liu, Q.; Chen, K.; Wang, J. Forecasting stock prices in two ways based on LSTM neural network. In Proceedings of the 2019 IEEE 3rd Information Technology, Networking, Electronic and Automation Control Conference (ITNEC), Chengdu, China, 15–17 March 2019; pp. 1083–1086. [Google Scholar]
- Tandon, S.; Tripathi, S.; Saraswat, P.; Dabas, C. Bitcoin Price Forecasting using LSTM and 10-Fold Cross validation. In Proceedings of the 2019 International Conference on Signal Processing and Communication (ICSC), Noida, India, 7–9 March 2019; pp. 323–328. [Google Scholar]
- Chaitanya Lahari, M.; Ravi, D.H.; Bharathi, R. Fuel Price Prediction Using RNN. In Proceedings of the 2018 International Conference on Advances in Computing, Communications and Informatics (ICACCI), Bangalore, India, 19–22 September 2018; pp. 1510–1514. [Google Scholar]
- Vidya, G.S.; Hari, V.S. Gold Price Prediction and Modelling using Deep Learning Techniques. In Proceedings of the 2020 IEEE Recent Advances in Intelligent Computational Systems (RAICS), Thiruvananthapuram, India, 3–5 December 2020; pp. 28–31. [Google Scholar]
- Mandal, P.; Senjyu, T.; Urasaki, N.; Yona, A.; Funabashi, T.; Srivastava, A.K. Price Forecasting for Day-Ahead Electricity Market Using Recursive Neural Network. In Proceedings of the 2007 IEEE Power Engineering Society General Meeting, Tampa, FL, USA, 24–28 June 2007; pp. 1–8. [Google Scholar]
- Zhu, Y.; Dai, R.; Liu, G.; Wang, Z.; Lu, S. Power Market Price Forecasting via Deep Learning. In Proceedings of the IECON 2018 —44th Annual Conference of the IEEE Industrial Electronics Society, Washington, DC, USA, 21–23 October 2018; pp. 4935–4939. [Google Scholar]
- Ugurlu, U.; Oksuz, I.; Tas, O. Electricity Price Forecasting Using Recurrent Neural Networks. Energies 2018, 11, 1255. [Google Scholar] [CrossRef] [Green Version]
- Weng, Y.; Wang, X.; Hua, J.; Wang, H.; Kang, M.; Wang, F.-Y. Forecasting Horticultural Products Price Using ARIMA Model and Neural Network Based on a Large-Scale Data Set Collected by Web Crawler. IEEE Trans. Comput. Soc. Syst. 2019, 6, 547–553. [Google Scholar] [CrossRef]
- Tang, L.; Diao, X. Option pricing based on HMM and GARCH model. In Proceedings of the 2017 29th Chinese Control and Decision Conference (CCDC), Chongqing, China, 28–30 May 2017; pp. 3363–3368. [Google Scholar]
- Wang, Y.; Guo, Y. Forecasting method of stock market volatility in time series data based on mixed model of ARIMA and XGBoost. China Commun. 2020, 17, 205–221. [Google Scholar] [CrossRef]
- Pai, P.-F.; Lin, C.-S. A hybrid ARIMA and support vector machines model in stock price forecasting. Omega 2005, 33, 497–505. [Google Scholar] [CrossRef]
- Zhang, J.-L.; Zhang, Y.-J.; Zhang, L. A novel hybrid method for crude oil price forecasting. Energy Econ. 2015, 49, 649–659. [Google Scholar] [CrossRef]
- Zhu, B.; Wei, Y. Carbon price forecasting with a novel hybrid ARIMA and least squares support vector machines methodology. Omega 2013, 41, 517–524. [Google Scholar] [CrossRef]
- Shabri, A.; Samsudin, R. Daily Crude Oil Price Forecasting Using Hybridizing Wavelet and Artificial Neural Network Model. Math. Probl. Eng. 2014, 11. [Google Scholar] [CrossRef] [Green Version]
- Safari, A.; Davallou, M. Oil price forecasting using a hybrid model. Energy 2018, 148, 49–58. [Google Scholar] [CrossRef]
- Bissing, D.; Klein, M.T.; Chinnathambi, R.A.; Selvaraj, D.F.; Ranganathan, P. A Hybrid Regression Model for Day-Ahead Energy Price Forecasting. IEEE Access 2019, 7, 36833–36842. [Google Scholar] [CrossRef]
- Huang, Y.; Dai, X.; Wang, Q.; Zhou, D. A hybrid model for carbon price forecasting using GARCH and long short-term memory network. Appl. Energy 2021, 285, 116485. [Google Scholar] [CrossRef]
- Shafie-khah, M.; Moghaddam, M.P.; Sheikh-El-Eslami, M.K. Price forecasting of day-ahead electricity markets using a hybrid forecast method. Energy Convers. Manag. 2011, 52, 2165–2169. [Google Scholar] [CrossRef]
- Kristjanpoller, W.; Minutolo, M.C. Gold price volatility: A forecasting approach using the Artificial Neural Network–GARCH model. Expert Syst. Appl. 2015, 42, 7245–7251. [Google Scholar] [CrossRef]
- Hassan, M.R.; Nath, B.; Kirley, M. A fusion model of HMM, ANN and GA for stock market forecasting. Expert Syst. Appl. 2007, 33, 171–180. [Google Scholar] [CrossRef]
- Chen, Q.; Zhang, W.; Lou, Y. Forecasting Stock Prices Using a Hybrid Deep Learning Model Integrating Attention Mechanism, Multi-Layer Perceptron, and Bidirectional Long-Short Term Memory Neural Network. IEEE Access 2020, 8, 117365–117376. [Google Scholar] [CrossRef]
- Nisha, K.G.; Sreekumar, K. A Review and Analysis of Machine Learning and Statistical Approaches for Prediction. In Proceedings of the 2017 International Conference on Inventive Communication and Computational Technologies (ICICCT), Coimbatore, India, 10–11 March 2017. [Google Scholar]
- Young, W.L. The Box-Jenkins approach to time series analysis and forecasting: Principles and applications. RAIRO-Oper. Res. 1977, 11, 129–143. [Google Scholar] [CrossRef] [Green Version]
- Babu, C.N.; Reddy, B.E. Selected Indian stock predictions using a hybrid ARIMA-GARCH model. In Proceedings of the 2014 International Conference on Advances in Electronics Computers and Communications, Bangalore, India, 10–11 October 2014; pp. 1–6. [Google Scholar]
- Bollerslev, T. Generalized autoregressive conditional heteroskedasticity. J. Econom. 1986, 31, 307–327. [Google Scholar] [CrossRef] [Green Version]
- Zhang, X.; Xue, T.; Eugene Stanley, H. Comparison of Econometric Models and Artificial Neural Networks Algorithms for the Prediction of Baltic Dry Index. IEEE Access 2019, 7, 1647–1657. [Google Scholar] [CrossRef]
- Baum, L.E.; Petrie, T. Statistical Inference for Probabilistic Functions of Finite State Markov Chains. Ann. Math. Stat. 1966, 37, 1554–1563. [Google Scholar] [CrossRef]
- Liu, D.; Cai, Z.; Li, X. Hidden Markov Model Based Spot Price Prediction for Cloud Computing. In Proceedings of the 2017 IEEE International Symposium on Parallel and Distributed Processing with Applications and 2017 IEEE International Conference on Ubiquitous Computing and Communications (ISPA/IUCC), Guangzhou, China; 2017; pp. 996–1003. [Google Scholar]
- Mamon, R.S.; Erlwein, C.; Bhushan Gopaluni, R. Adaptive signal processing of asset price dynamics with predictability analysis. Inf. Sci. 2008, 178, 203–219. [Google Scholar] [CrossRef]
- Ky, D.X.; Tuyen, L.T. A Higher order Markov model for time series forecasting. Int. J. Appl. Math. Stat. 2018, 57, 1–18. [Google Scholar]
- Williams, C. A brief introduction to Artificial Intelligence. In Proceedings of the OCEANS ’83, San Francisco, CA, USA, 29 August–1 September 1983. [Google Scholar]
- Angra, S.; Ahuja, S. Machine learning and its applications: A review. In Proceedings of the 2017 International Conference on Big Data Analytics and Computational Intelligence (ICBDAC), Chirala, India, 23–25 March 2017; pp. 57–60. [Google Scholar]
- Ramírez-Amaro, K.; Chimal-Eguía, J.C. Machine Learning Tools to Time Series Forecasting. In Proceedings of the 2007 Sixth Mexican International Conference on Artificial Intelligence, Special Session (MICAI), Aquascalientes, Mexico, 4–10 November 2007; pp. 91–101. [Google Scholar]
- Cortes, C.; Vapnik, V. Support-vector networks. Mach. Learn. 1995, 20, 273–297. [Google Scholar] [CrossRef]
- Syntaktische Merkmale und Kategorien. Deutsche Syntax Deklarativ; DE GRUYTER: Berlin, Germany, 1999; pp. 1–13. ISBN 978-3-484-30394-2. [Google Scholar]
- Auria, L.; Moro, R.A. Support Vector Machines (SVM) as a Technique for Solvency Analysis. SSRN Electron. J. 2008, 20, 577–588. [Google Scholar] [CrossRef] [Green Version]
- Wang, H.; Hu, D. Comparison of SVM and LS-SVM for Regression. In Proceedings of the 2005 International Conference on Neural Networks and Brain, Beijing, China, 13–15 October 2005; Volume 1, pp. 279–283. [Google Scholar]
- Breiman, L. Random Forests. Mach. Learn. 2001, 45, 5–32. [Google Scholar] [CrossRef] [Green Version]
- Felizardo, L.; Oliveira, R.; Del-Moral-Hernandez, E.; Cozman, F. Comparative study of Bitcoin price prediction using WaveNets, Recurrent Neural Networks and other Machine Learning Methods. In Proceedings of the 2019 6th International Conference on Behavioral, Economic and Socio-Cultural Computing (BESC), Beijing, China, 28–30 October 2019; pp. 1–6. [Google Scholar]
- Istiake Sunny, M.A.; Maswood, M.M.S.; Alharbi, A.G. Deep Learning-Based Stock Price Prediction Using LSTM and Bi-Directional LSTM Model. In Proceedings of the 2020 2nd Novel Intelligent and Leading Emerging Sciences Conference (NILES), Giza, Egypt, 24–26 October 2020; pp. 87–92. [Google Scholar]
- Mcculloch, W.S.; Pitts, W. A logical calculus of the ideas immanent in nervous activity. Bull. Math. Biol. 1943, 5, 115–133. [Google Scholar] [CrossRef]
- Dumitru, C.; Maria, V. Advantages and Disadvantages of Using Neural Networks for Predictions. Ovidius Univ. Ann. Econ. Sci. Ser. 2013, 13, 444–449. [Google Scholar]
- Welch, R.L.; Ruffing, S.M.; Venayagamoorthy, G.K. Comparison of feedforward and feedback neural network architectures for short term wind speed prediction. In Proceedings of the 2009 International Joint Conference on Neural Networks, Atlanta, GA, USA, 14–19 June 2009. [Google Scholar]
- Deb, C.; Zhang, F.; Yang, J.; Lee, S.E.; Shah, K.W. A review on time series forecasting techniques for building energy consumption. Renew. Sustain. Energy Rev. 2017, 74, 902–924. [Google Scholar] [CrossRef]
- Kothapalli, S.; Totad, S.G. A real-time weather forecasting and analysis. In Proceedings of the 2017 IEEE International Conference on Power, Control, Signals and Instrumentation Engineering (ICPCSI), Chennai, India, 21–22 September 2017; pp. 1567–1570. [Google Scholar]
- Cheung, Y.-W.; Lai, K.S. Lag order and critical values of the augmented Dickey–Fuller test. J. Bus. Econ. Stat. 1995, 13, 277–280. [Google Scholar]
- Saia, R.; Boratto, L.; Carta, S. A Latent Semantic Pattern Recognition Strategy for an Untrivial Targeted Advertising. In Proceedings of the 2015 IEEE International Congress on Big Data, New York, NY, USA, 27 June–2 July 2015; pp. 491–498. [Google Scholar]
Figure 1.
Classification tree of price forecasting models.
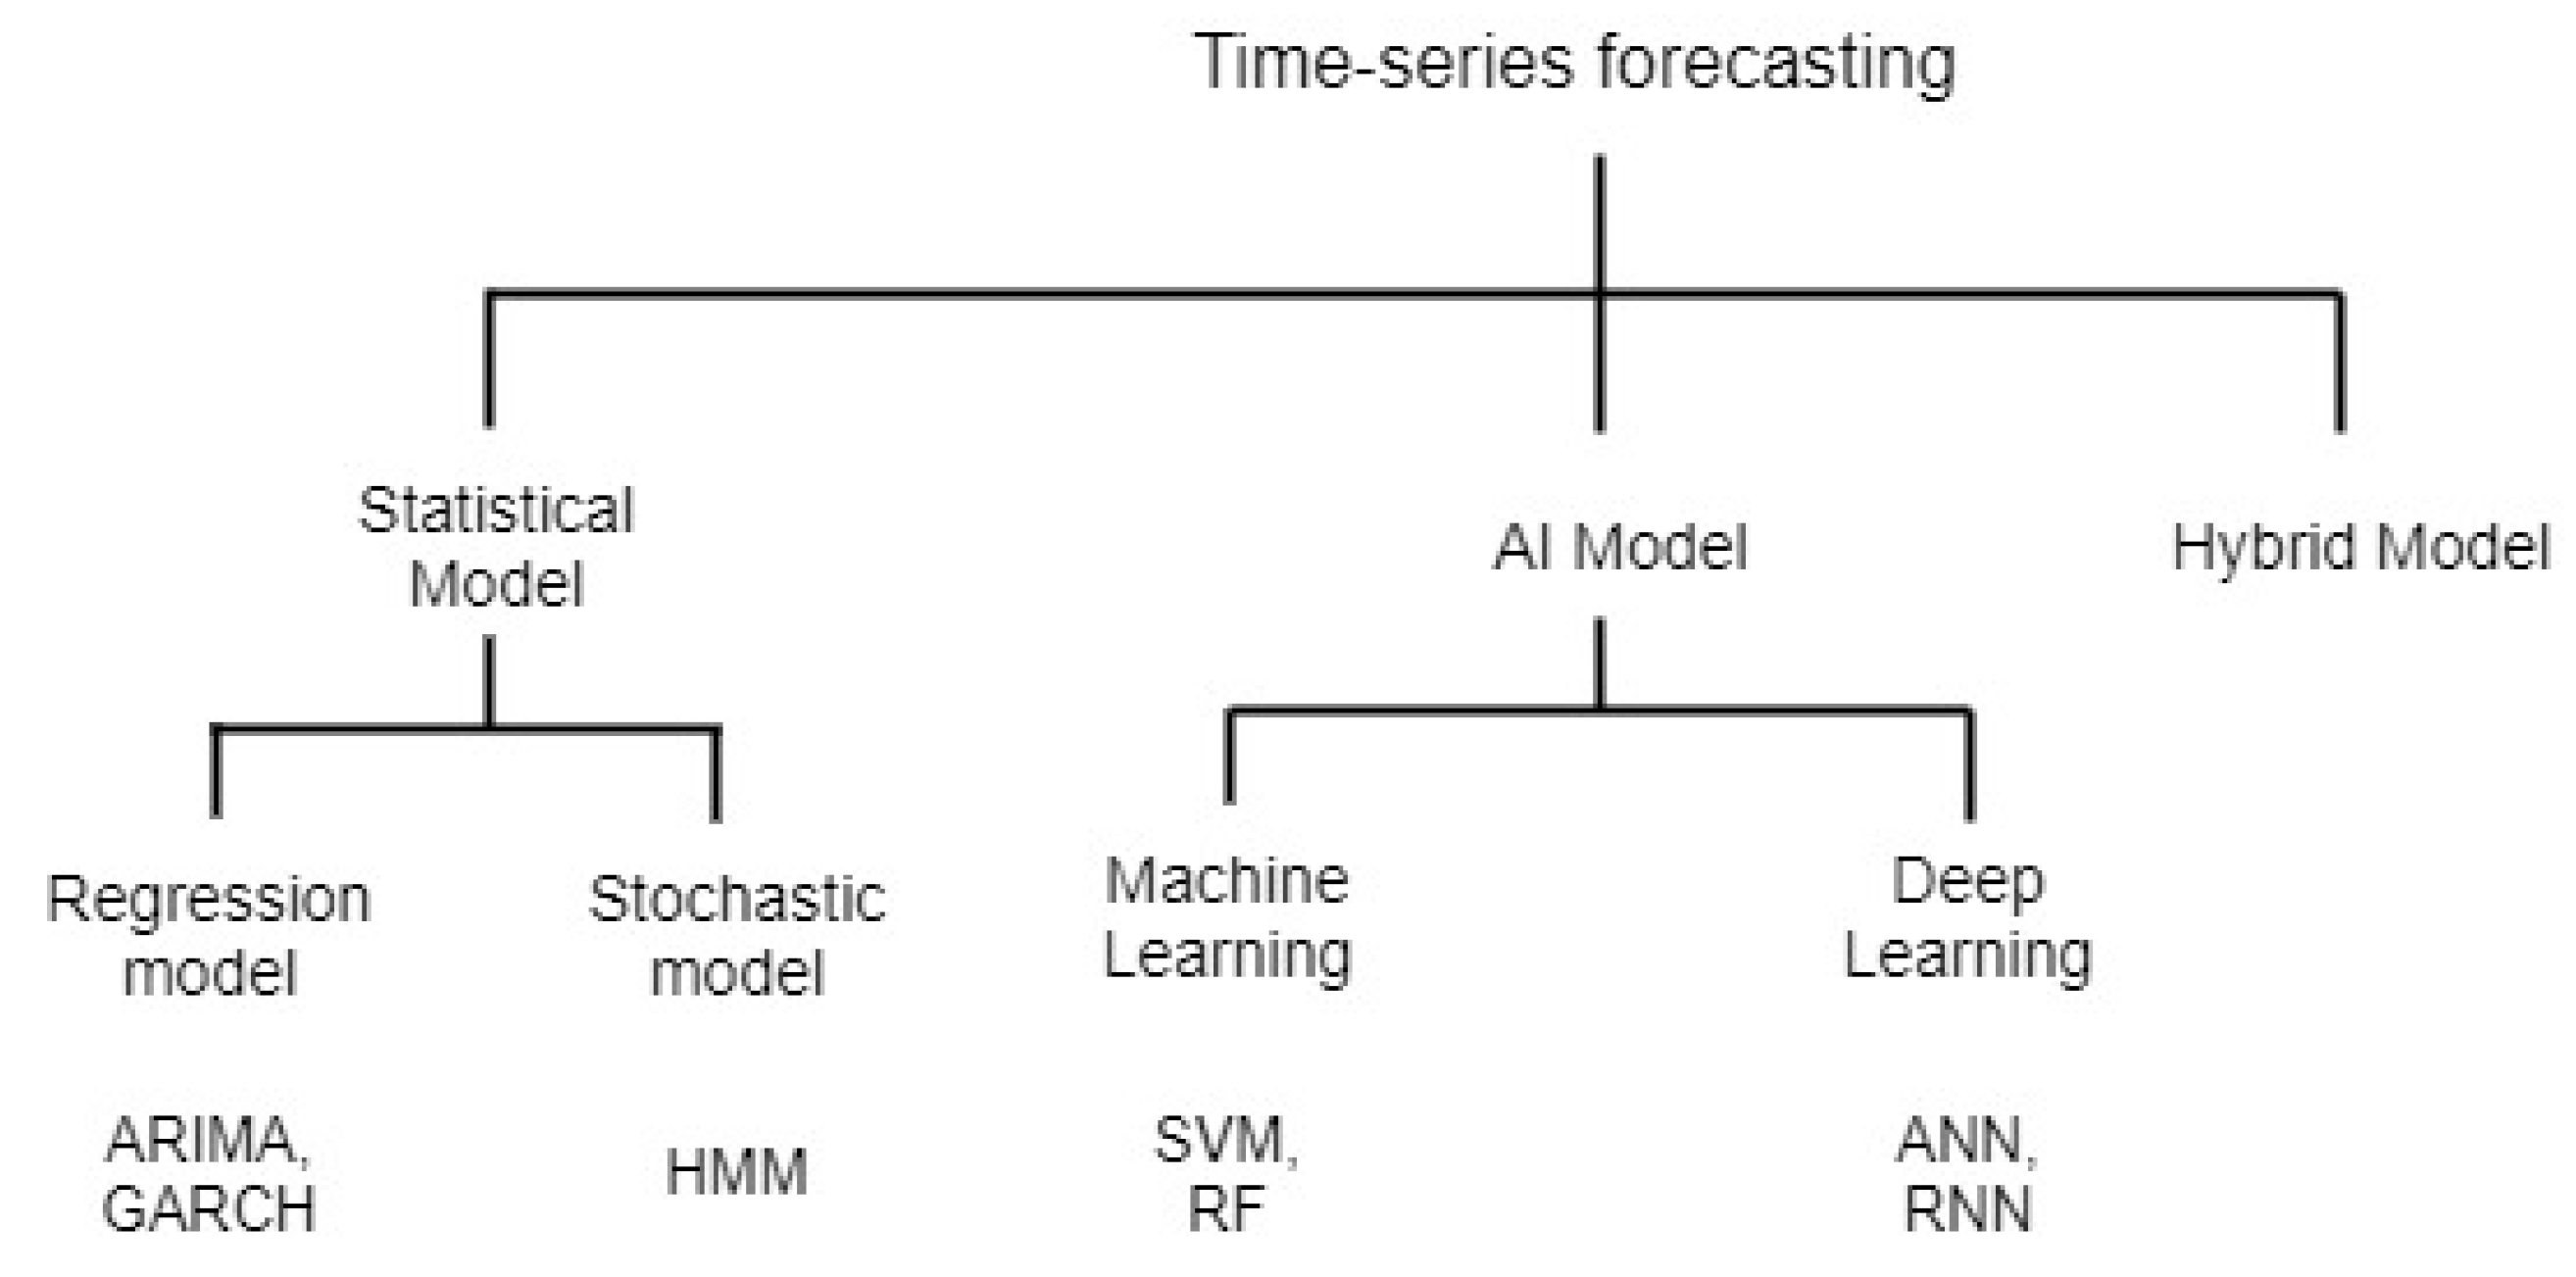
Figure 2.
The evolution of time-series forecasting models in different domains over two decades.
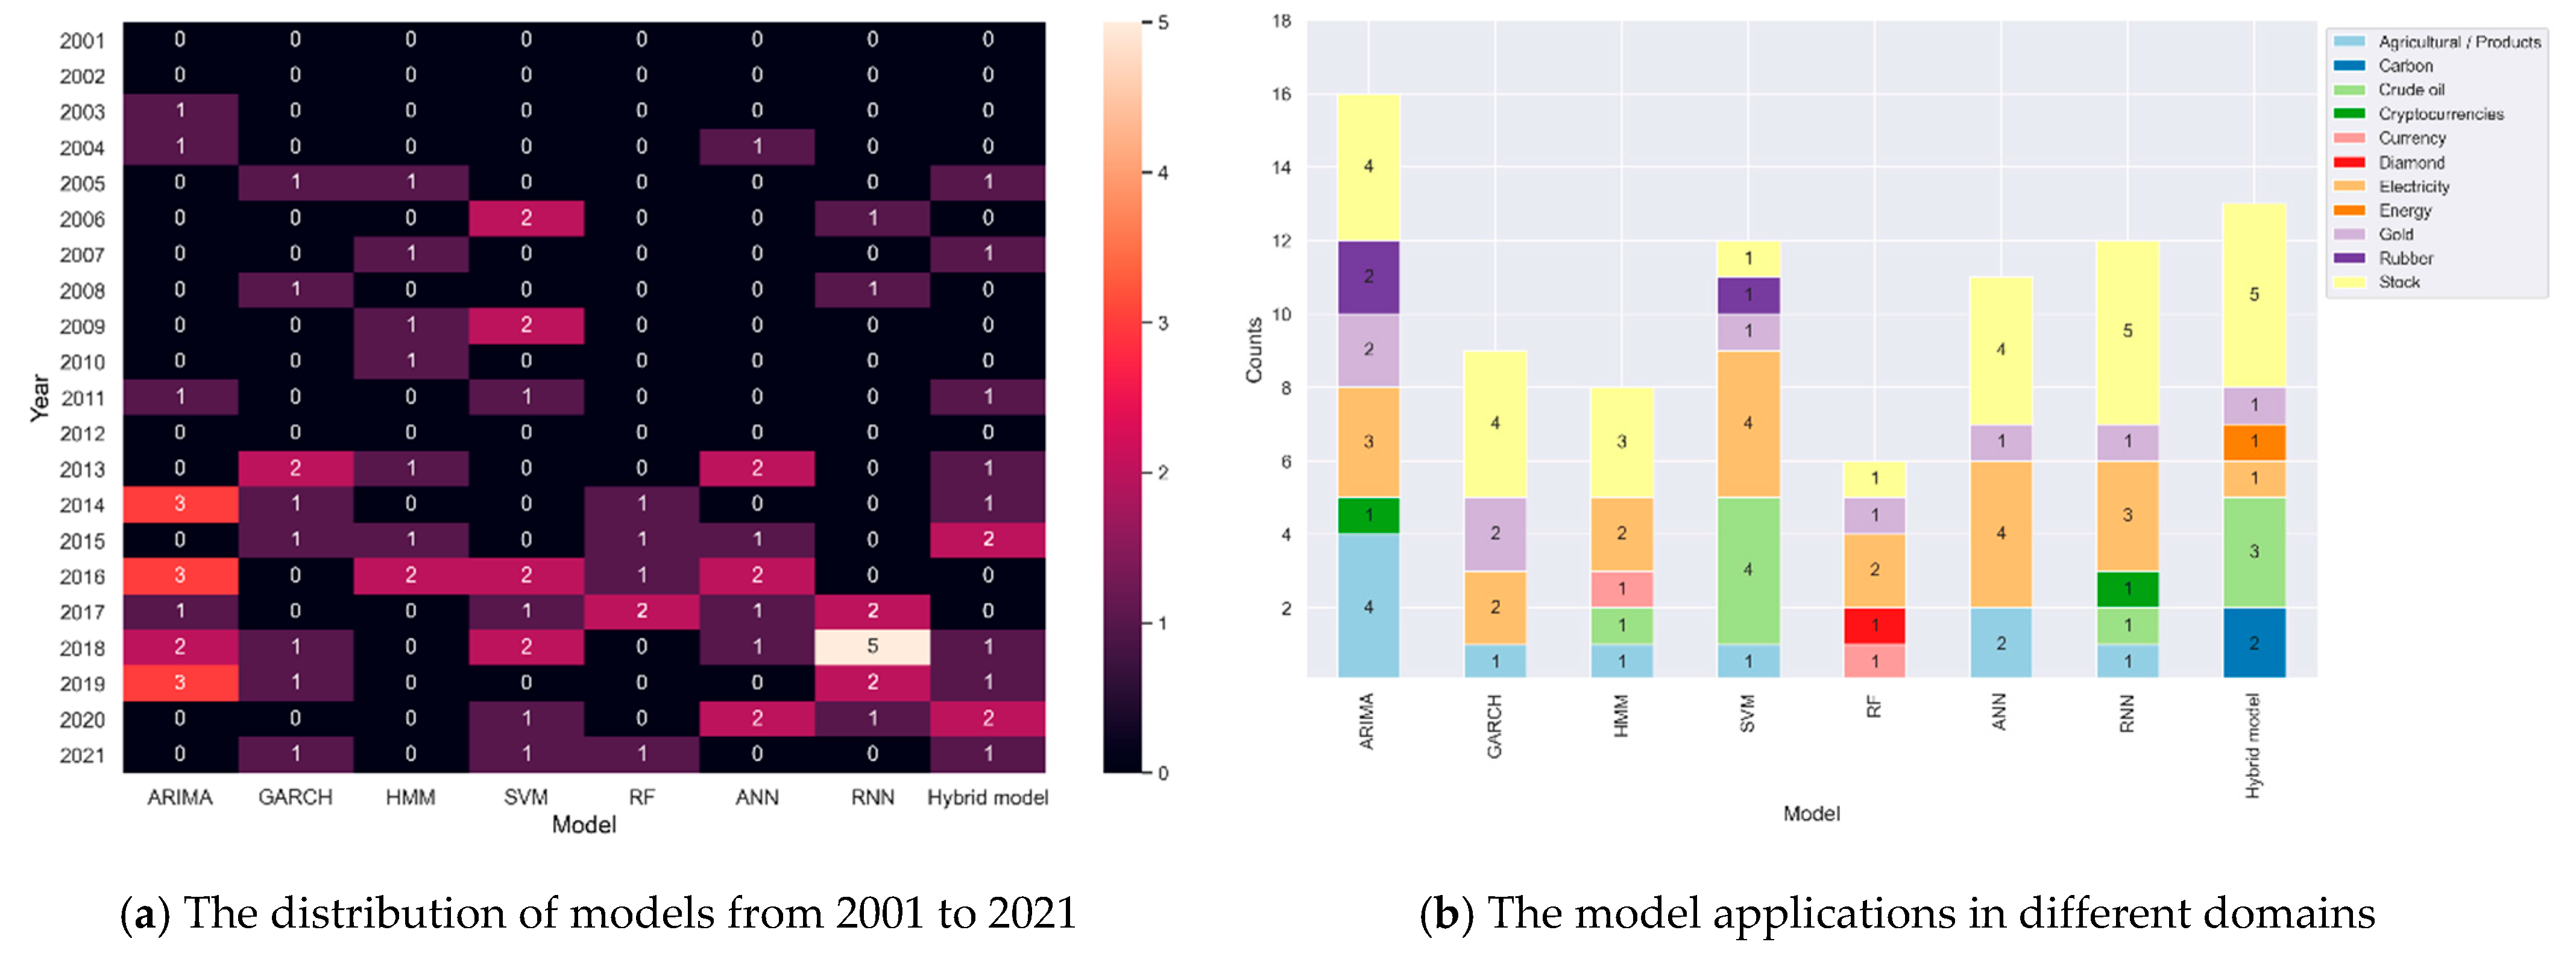
Figure 3.
Popularity index comparison over 24 h for both weekdays and weekends.
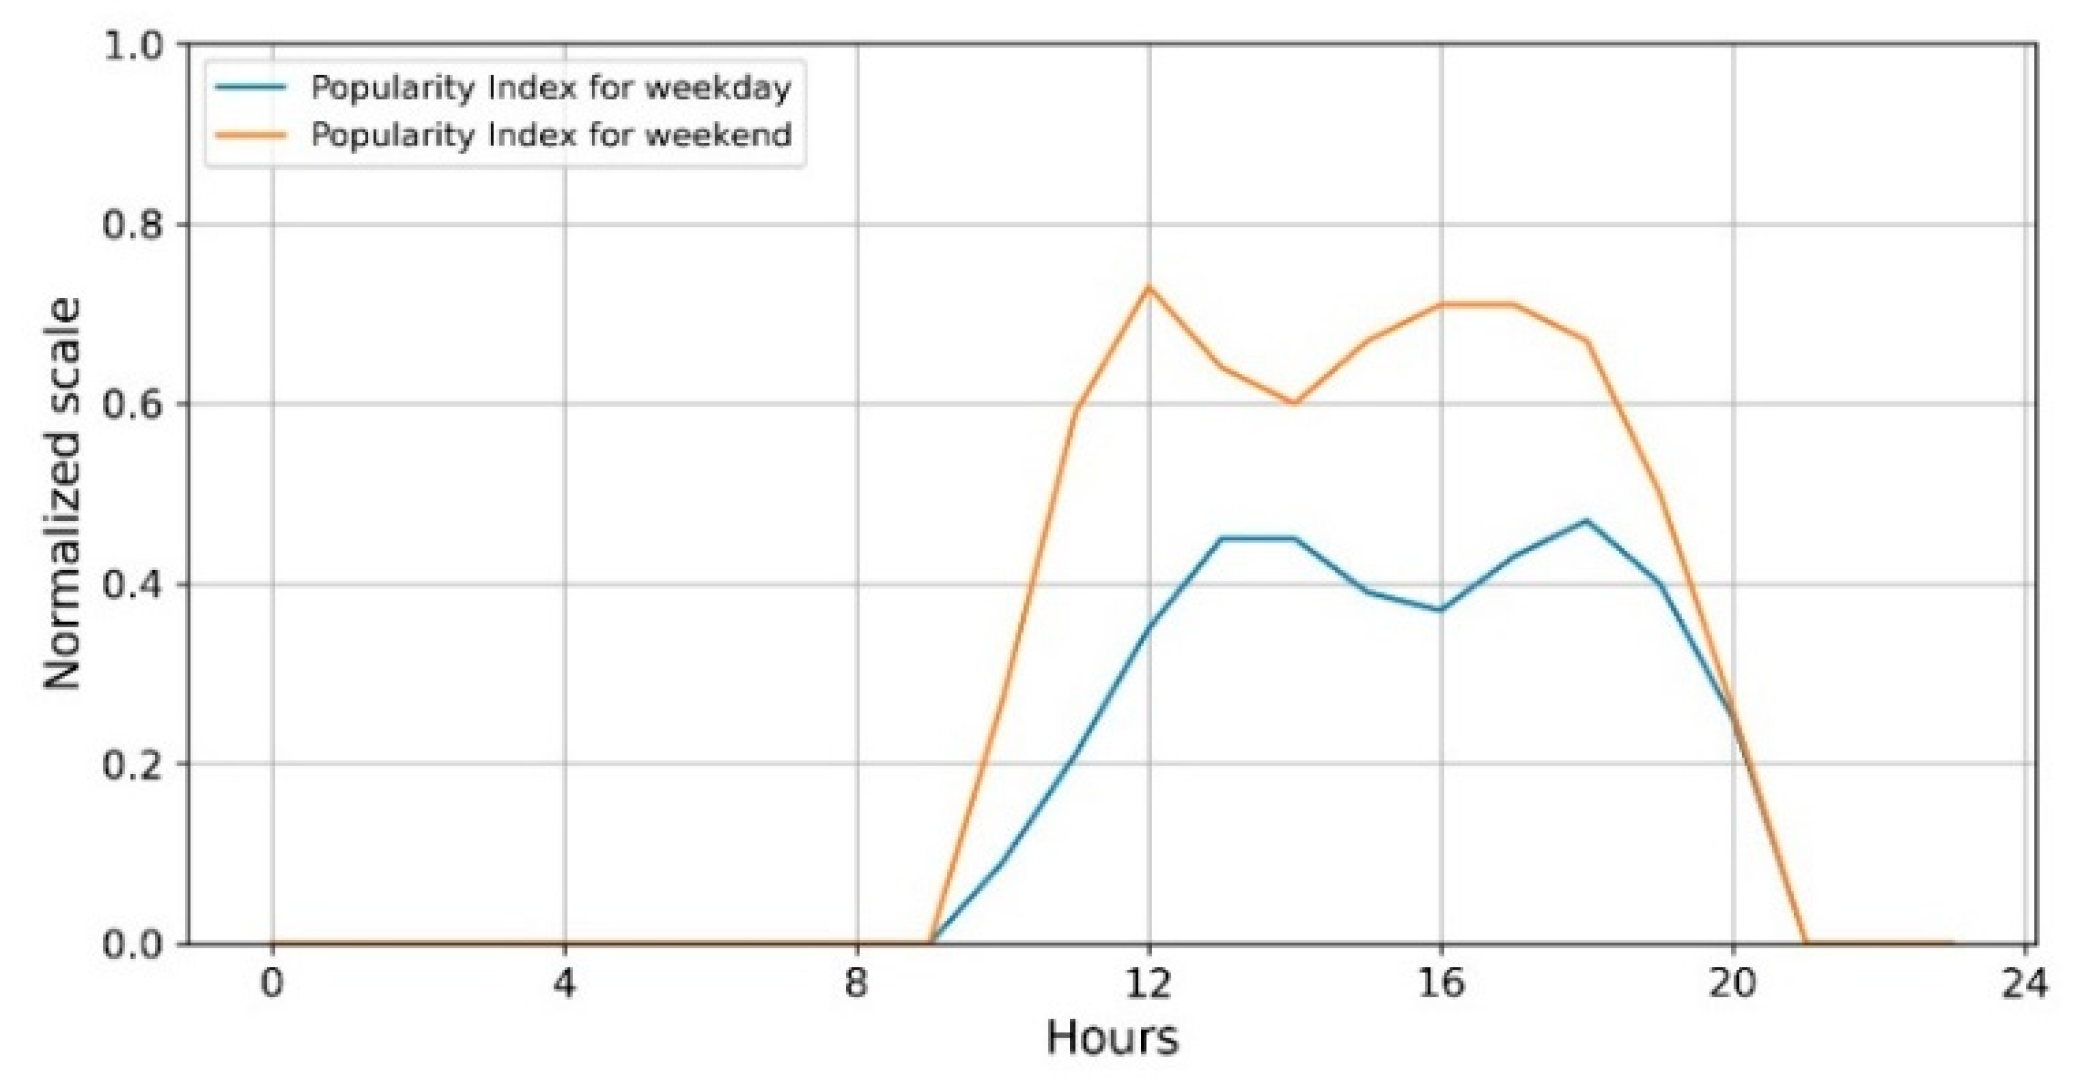
Figure 4.
Popularity index changes in 30 days.
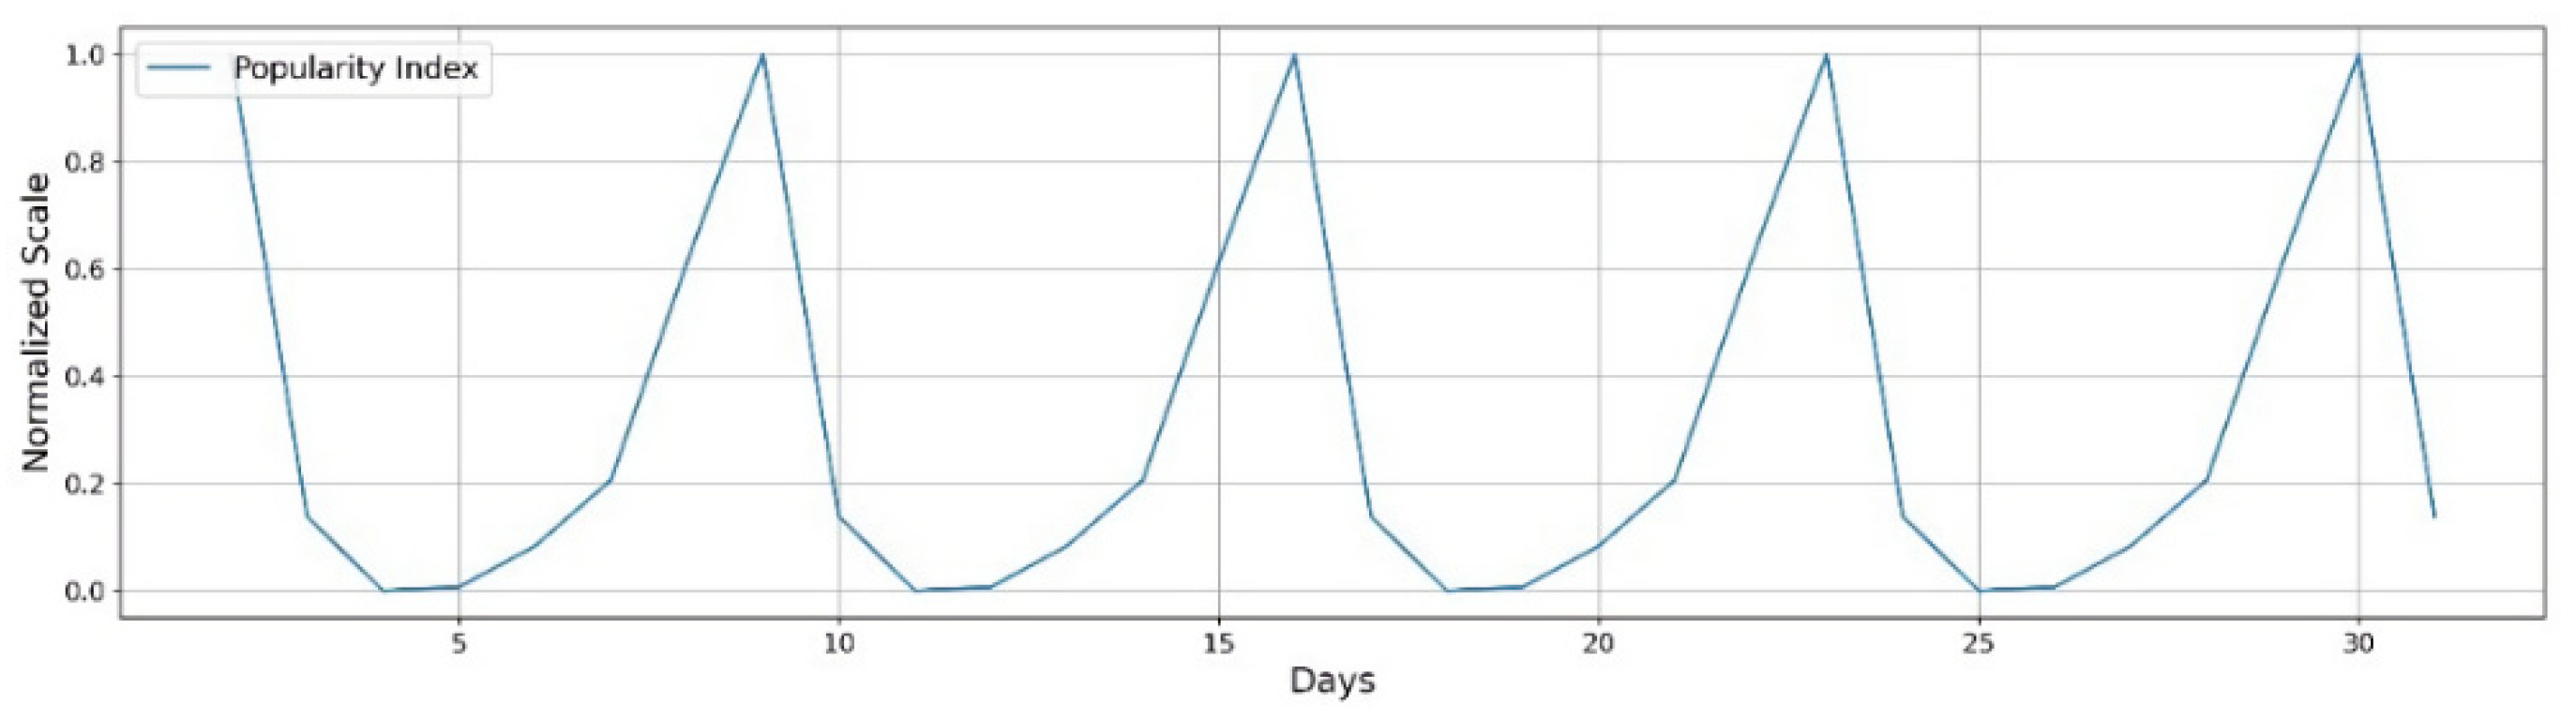
Figure 5.
Popularity index changes for the whole dataset.

Figure 6.
Temperature and air humidity in 24 h.
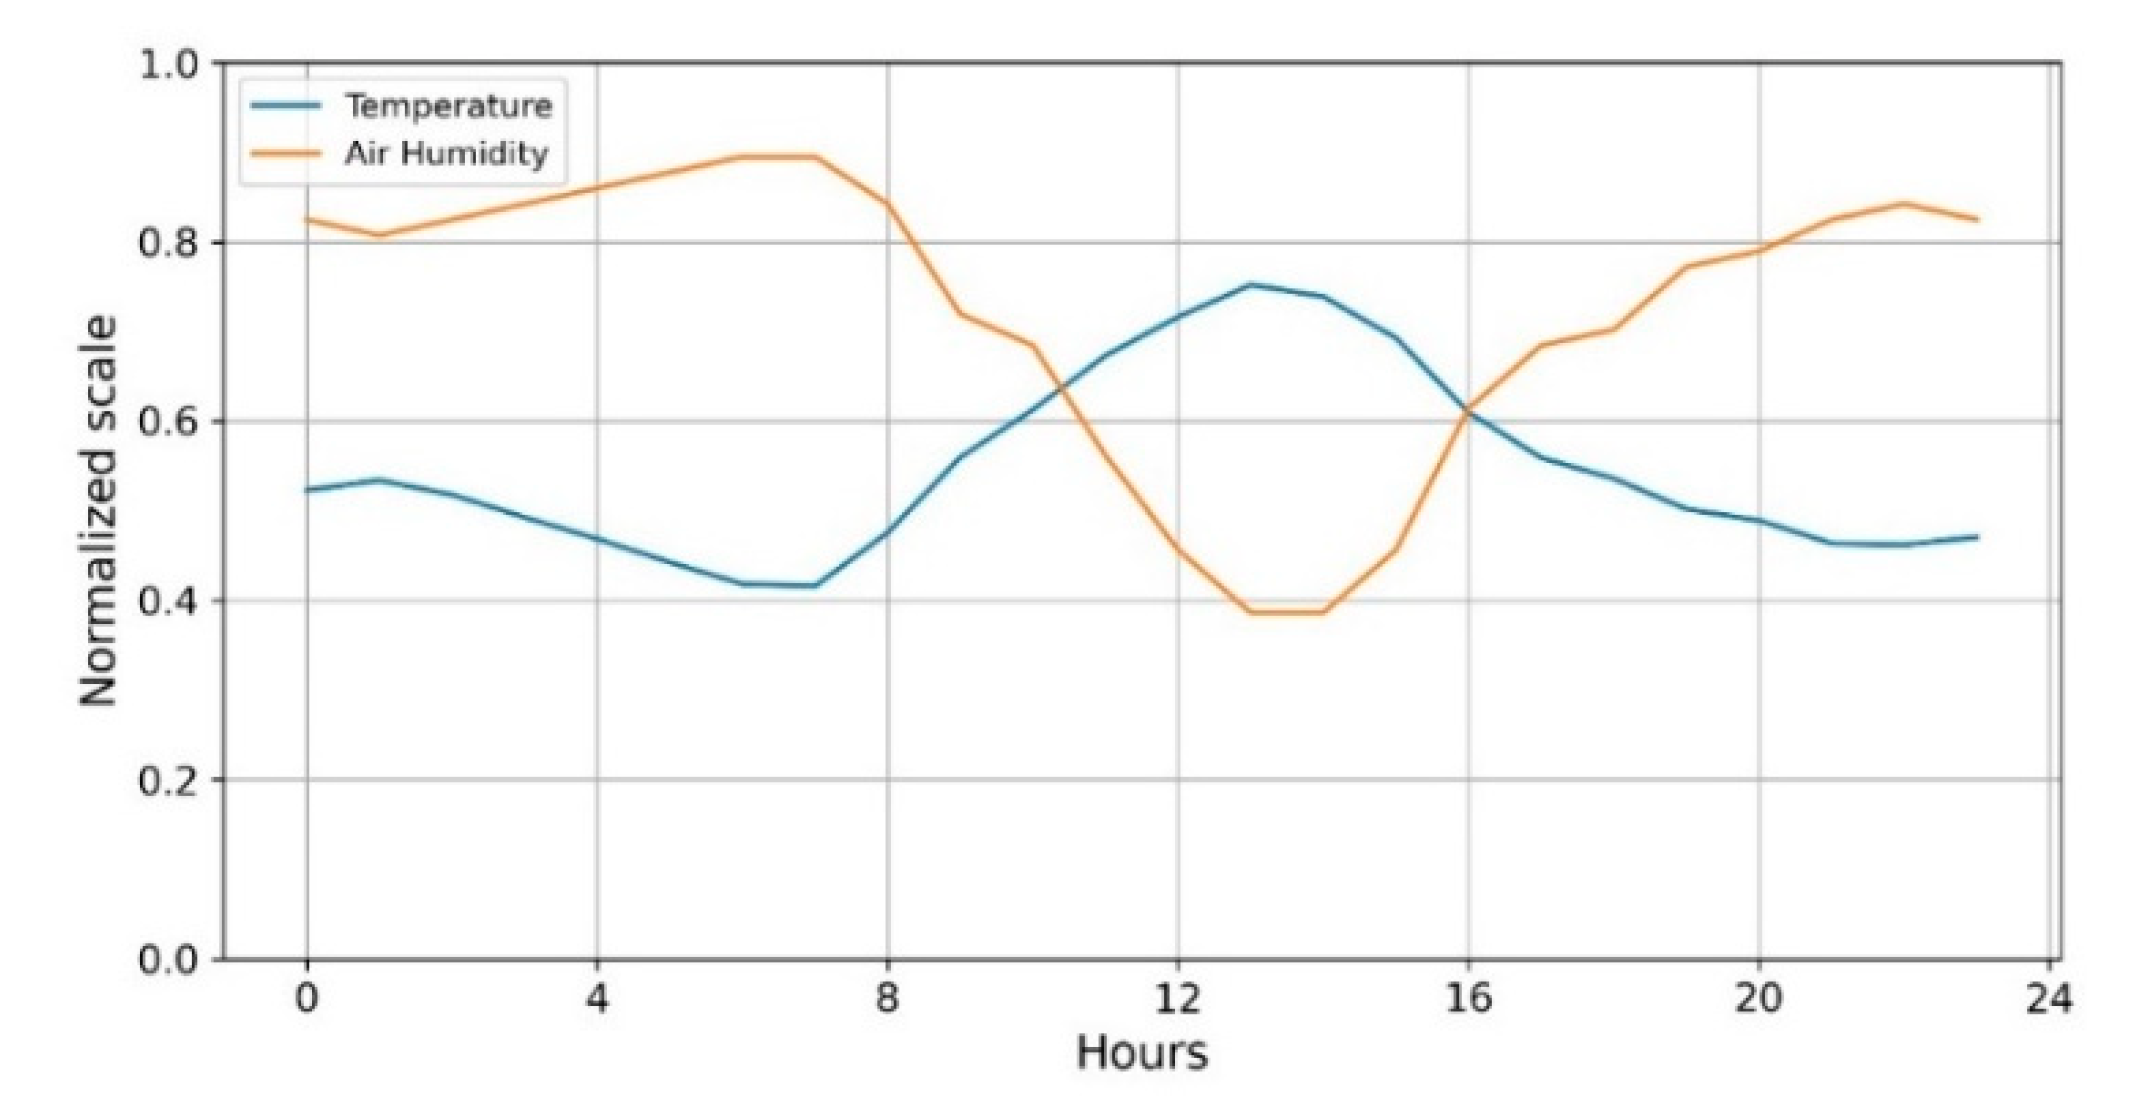
Figure 7.
Temperature and air humidity in 30 days.
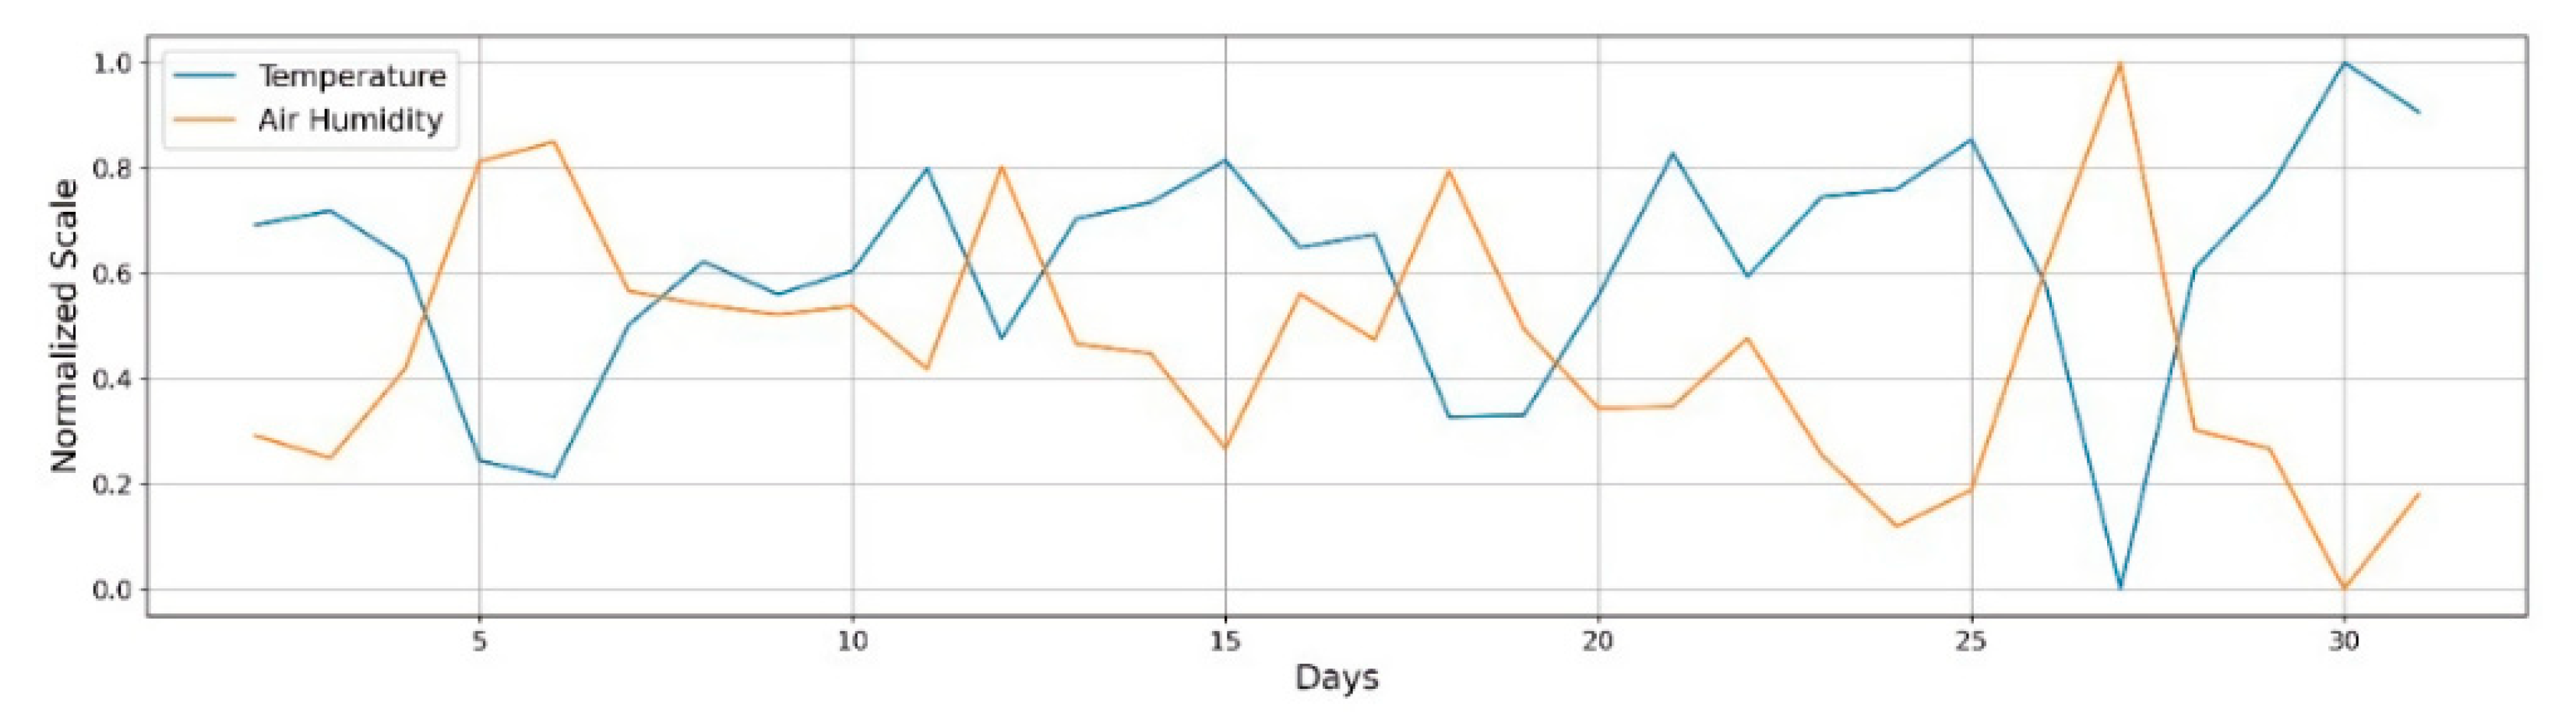
Figure 8.
Temperature and air humidity for the whole dataset.

Figure 9.
Proposed framework for optimal model selection.
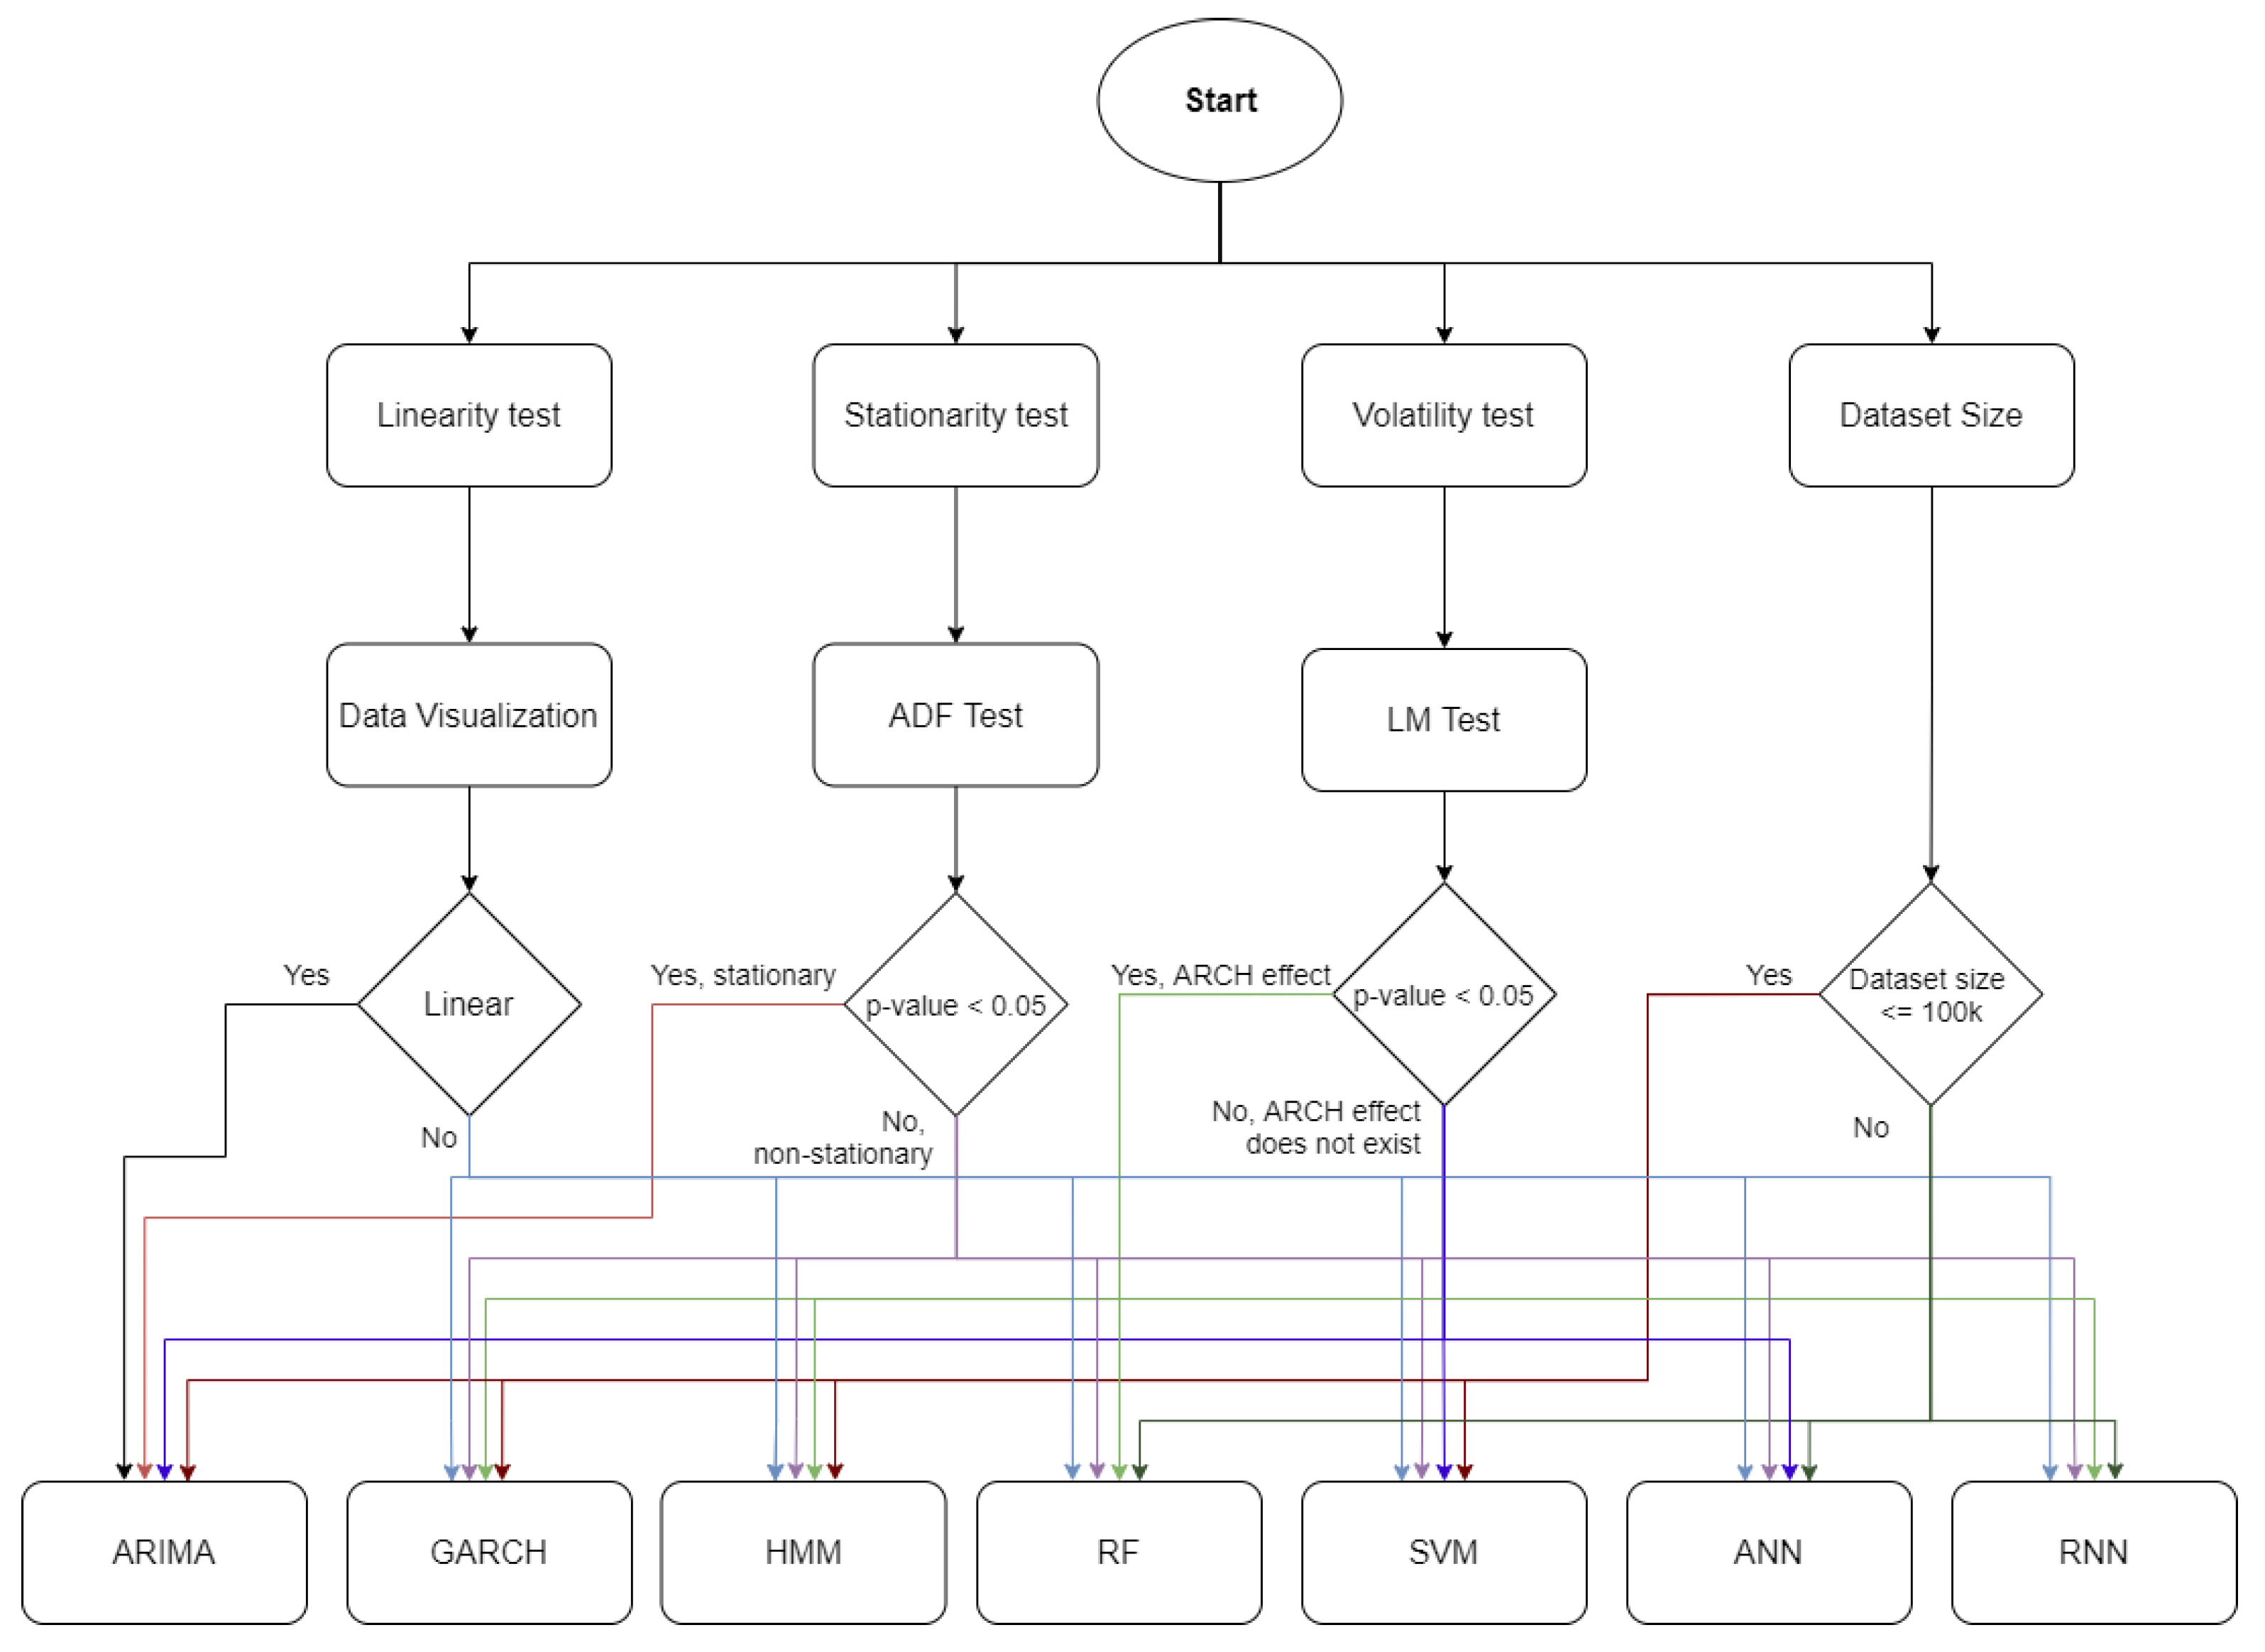
Figure 10.
Scatter plot for popularity index, temperature, and air humidity.


Table 1.
Review on time-series forecasting studies for dynamic pricing from 2001 to 2021.
| Category | Model | Count | Time Range | References |
|---|---|---|---|---|
| Regression Model | ARIMA | 14 | 2003–2019 | [13,14,15,16,17,18,19,20,21,22,23,24,25,26,27] |
| GARCH | 9 | 2005–2021 | [12,28,29,30,31,32,33,34,35] | |
| Stochastic Model | HMM | 8 | 2007–2016 | [36,37,38,39,40,41,42,43] |
| Machine Learning | SVM | 12 | 2005–2021 | [44,45,46,47,48,49,50,51,52,53,54,55] |
| RF | 6 | 2006–2021 | [56,57,58,59,60,61] | |
| Deep Learning | ANN | 10 | 2004–2020 | [62,63,64,65,66,67,68,69,70] |
| RNN | 12 | 2006–2020 | [71,72,73,74,75,76,77,78,79,80,81,82] | |
| Hybrid Model | Regression + Stochastic | 1 | 2017 | [83] |
| Regression + ML | 4 | 2005–2021 | [84,85,86,87] | |
| Regression + DL | 6 | 2014–2021 | [88,89,90,91,92,93] | |
| Stochastic + DL | 1 | 2007 | [94] | |
| DL + DL | 1 | 2020 | [95] |
Table 2.
ARIMA time-series forecasting from 2003 to 2019.
| Domain | Author | Dataset | Model | Result |
|---|---|---|---|---|
| Cryptocurrencies | Mittal et al., 2018 [13] | Cryptocurrencies (2013 to May 2018) | ARIMA | Accuracy of 86.424 |
| Stock | Ayodele et al., 2014 [14] | New York Stock Exchange and Nigerian Stock Exchange | ARIMA | R2 of 0.0033 and 0.9972 |
| Rotela Junior et al., 2014 [15] | Bovespa Index (January 2000 to December 2012) | ARIMA | MAPE of 0.064 | |
| Setyo, 2017 [16] | Indonesia Composite Stock Price Index | ARIMA | MAPE of 0.8431 | |
| Rubber | Sukanya and Vichai, 2016 [17] | Bangkok and World natural rubber price (January 2002 to December 2015) | ARIMAX | MAPE of 1.11 |
| Latex | Chalakora and Vichai, 2018 [18] | Central Rubber Market of Hat Yai, Thailand | SARIMA | MAPE of 24.60 and RMSE of 14.90 |
| Agricultural and e-commerce product | Verma et al., 2016 [19] | Agricultural Produce Market Committee, Ramganj (May 2003 to June 2015 | ARIMA | MAPE of 6.38 |
| Jadhav et al., 2017 [20] | Price of cereal crops in Karnataka (2002 to 2016) | ARIMA | MAPE of 2.993, 1.859, 1.255 paddy, ragi, and maize, respectively | |
| Carta et al., 2018 [27] | Amazon product’s prices, with Google Trends data used as exogenous features | ARIMA | Achieves the lowest average MAPE of 4.77 | |
| Anil Kumar et al., 2019 [21] | Price in market Kadiri, India (January 2011 to December 2015) | ARIMA | MAPE of 2.30 | |
| Gold | Banhi and Gautam, 2016 [22] | Multi Commodity Exchange of India (November 2003 to January 2014) | ARIMA | MAPE of 3.145 |
| Yang, 2019 [23] | World Gold Council (July 2013 to June 2018) | ARIMA | Relative error of less than 1.2% | |
| Electricity | Contreras et al., 2003 [24] | Spanish and Californian electricity market of 2000 | ARIMA | Mean errors of less than 11% |
| Mingzhou et al., 2004 [25] | California power market of 1999 | ARIMA | MSE of 0.1148 | |
| Tina et al., 2011 [26] | EPEX power exchange | ARIMA | MAPE of 3.55 |
Table 3.
GARCH time-series forecasting from 2005 to 2021.
| Domain | Author | Dataset | Model | Result |
|---|---|---|---|---|
| Oil | Lama et al., 2015 [12] | Cotlook A (April 1982 to March 2012) | GARCH, EGARCH | EGARCH achieved the best performance with RMSE of 14.41 |
| Gold | Ping et al., 2013 [28] | Kijaang Emas prices (July 2001 to September 2012) | GARCH | MAPE of 0.809767 |
| Yaziz et al., 2019 [29] | Malaysia gold price (January 2003 to June 2014) | ARIMA, GARCH, ARIMA-GARCH | ARIMA-GARCH achieved the most optimal result with a price error less than 2 | |
| Stock | Xing et al., 2021 [30] | West Texas Intermediate (January 2015 to May 2018) and CSI300 (May 2015 to 2016) | GARCH with nonlinear function | AIC of −1119.77 and −11373.6 for CSI300 and WTI dataset |
| Tripathy and Raahman, 2013 [31] | Bombay Stock Exchange and Shanghai Stock Exchange (1990 to 2013) | GARCH | AIC of −5.512662 and −5.260705 for BSE and SSE dataset | |
| Erica et al., 2018 [32] | Adaro energy share price (January 2014 to December 2016) | GARCH | MAPE of 2.16 | |
| Power | Hong Li et al., 2008 [33] | Power price in California of 2000 | NP-GARCH, GARCH, ARIMA | NP-GARCH achieved the lowest MPE of 3.62 and 4.86 |
| Agricultural Product | Bhardwaj et al., 2014 [34] | Gram price in Delhi (January 2007 to April 2012) | GARCH, ARIMA | GARCH achieved the best performance with an average error of less than 2 |
| Electricity | Garcia et al., 2005 [35] | Spanish and Californian Power Market (September 1999 to November 2000) and (January 2000 to December 2000) | GARCH | FMSE of less than 6 and 69 for Spanish and Californian market |
Table 4.
HMM time-series forecasting from 2007 to 2018.
| Domain | Author | Dataset | Model | Result |
|---|---|---|---|---|
| Stock | Hassan and Nath, 2005 [36] | Four airline stock indexes | HMM | MAPE of less than 6.850 for included stocks |
| Hassan, 2009 [37] | Six different stock prices | Fuzzy logic model and HMM | MAPE of less than 4.535 | |
| Dimoulkas, 2016 [38] | Nordic BM | HMM, ARIMA | HMM has the best accuracy of 73% | |
| Commodity | Date et al., 2013 [39] | Financial market commodity prices | HMM | RMSE of 0.08502 |
| Electricity | Valizadeh Haghi and S. M. Moghaddas Tafresgu, 2007 [40] | Spanish spot market of 2005 | HMM | |
| Jianhua Zhang et al., 2010 [41] | Electricity market data of August 2009 | HMM | MAPE of 4.1598 | |
| Oil | Bon and Isah, 2016 [42] | WTI dataset for oil prices of 2015 | HMM | |
| Financial | Shaaib, 2015 [43] | Foreign currency exchange rate of Euro against USD (April 2007 to February 2011) | HMM, ANN | HMM achieved the best performance with MSE of less than 0.04 |
Table 5.
SVM time-series forecasting from 2005 to 2021.
| Domain | Author | Dataset | Model | Result |
|---|---|---|---|---|
| Crude oil | Xie et al., 2006 [44] | WTI crude oil price (January 1970 to December 2003) | SVM, ARIMA, BPNN | SVM has the best performance with RMSE of 2.1921 |
| Qi and Zhang, 2009 [45] | OPEC, DJAIS and AMEX oil index | SVM | Error rate of 16.23% | |
| Khashman and Nwulu, 2011 [46] | WTI crude oil price (2002 to 2008) | SVM, ANN | SVM has the highest correct prediction rate of 81.27 | |
| Yu et al., 2017[47] | WTI crude oil price | SVM, ARIMA, FNN, ARFIMA, MS-ARFIMA, Random walk, SVM | SVM has the best performance with highest Diebold–Mariano test score | |
| Rubber | Jing Jong et al., 2020 [48] | Bulk latex | ARIMA | ARIMA-SVM achieved the lowest MAPE of 0.3535 |
| Gold | Makala and Li, 2021 [49] | World Gold Council (1979 to 2019) | SVM, ARIMA | SVM achieved the best result with an RMSE of 0.028 |
| Electricity | Swief et al., 2009 [50] | PJM (March 1997 to April 1998) | SVM | MAPE of 1.3847 |
| Mohamed and El-Hawary, 2016 [51] | New England ISO (2003 to 2010) | SVM | MAPE of 8.0386 | |
| Saini et al., 2016 [52] | Australian Electrical Market | SVM | MAPE of less than 1.78 | |
| Ma et al., 2018 [53] | ERCOT | SVM | MAPE of 6.57 | |
| Agricultural | Akın et al., 2018 [54] | Raisin World Export dataset | SVM, ANN | SVM is better than ANN with an accuracy of 0.888 |
| Stock | Kumar et al., n.d. [55] | Financial time-series data | SVM, RF | SVM outperform the RF by 1.04% of hit ratio |
Table 6.
RF time-series forecasting from 2006 to 2021.
| Domain | Author | Dataset | Model | Result |
|---|---|---|---|---|
| Load | Lahouar and Ben Hadj Slama, 2015 [56] | Tunisian Company of Electricity and Gas (January 2009 to August 2014) | RF, ANN, SVM | RF has the lowest MAPE of less than 4.2302 |
| Electricity | Mei et al., 2014 [57] | NYISO | RF, ANN, ARIMA | RF has the lowest MAPE of 12.05 |
| Diamond | Sharma et al., 2021 [58] | Kaggle | RF, Decision Tree, Lasso, Ada Boost, Ridge Gradient Boosting, Linear Regression, Elastic Net | RF has the lowest RMSE of 581.905423 |
| Exchange rate | Ramakrishnan et al., 2017 [59] | Department of Statistic Malaysia, World Bank, Malaysia Palm Oil Council, Malaysian Rubber Export Promotion Council, Federal Reserve Bank | RF, NN, SVM | RF has the lowest RMSE of 0.018 |
| Gold | Liu and Li, 2017 [60] | DJIA, S&P500, USDX | RF | RF showed a promising result in predicting the different datasets, with prediction performance up to 0.99 |
| Stock | Khaidem et al., 2016 [61] | Samsung, GE and, Apple stock | RF | Accuracy of higher than 86.8396 |
Table 7.
ANN time-series forecasting from 2004 to 2020.
| Domain | Author | Dataset | Model | Result |
|---|---|---|---|---|
| Agricultural | Jha and Sinha, 2013 [62] | Soybean price from SOPA, rapeseed-mustard from Delhi | ANN, ARIMA, TDNN | ARIMA obtained better result for soybean price forecasting with an RMSE of 5.43, hybrid ARIMA-TDNN has better performance with an RMSE of 3.46 |
| Electricity | Yamin et al., 2004 [63] | Californian power market (January 1999 to September 1999) | ANN | MAPE of less than 9.23 |
| Ozozen et al., 2016 [64] | EPIAS (2014 to 2015) | ANN, ARIMA, ARIMA-ANN | The hybrid model achieved an MAPE of 4.08 | |
| Ranjbar et al., 2016 [65] | Ontario power market (January 2003 to December 2003) | ANN | MAPE of 9.51 | |
| Sahay and Singh, 2018 [66] | Historical power data (2007 to 2013) | Backpropagation algorithm | MAPE of 6.60 | |
| Gold | Verma et al., 2020 [67] | Gold price from investing site, (January 2015 to December 2018) | GDM, RP, SCG, LM, BR, BFGS, OSS | GDM algorithm has the lowest MAPE of 4.06 |
| Stock | Laboissiere et al., 2015 [68] | CEBR3, CSRN3 | ANN | MAE of 0.0009 and 0.0042 for CEBR3 and CSRN3 |
| Prastyo et al., 2017 [69] | Daily stock closing prices from Wanjawa and Lawrence | ANN | RMSE of 0.1830 | |
| Wijesinghe and Rathnayaka, 2020 [70] | Colombo stock exchange | ANN, ARIMA | ANN has the lowest MAPE of 0.1783 |
Table 8.
RNN time-series forecasting from 2006 to 2020.
| Domain | Author | Dataset | Model | Result |
|---|---|---|---|---|
| Stock | Sun and Ni, 2006 [71] | Yahoo Finance (April 2005 to August 2005) | RNN | Accuracy of 0.9784 |
| Li and Liao, 2017 [72] | China stock market (2008 to 2015) | RNN, LSTM, MLP | LSTM has the highest performance with an accuracy of 0.473 | |
| Wang et al., 2018 [73] | Yunnan Baiyao stock data | LSTM | Accuracy of 50–65% | |
| Sima et al., 2018 [74] | Yahoo Finance (January 1985 to August 2018) | LSTM, ARIMA | ARIMA and LSTM achieved an RMSE of 5.999 and 0.936, respectively | |
| Du et al., 2019 [75] | American Apple stock data of 2008 | LSTM | MAE of 0.155 | |
| Cryptocurrency | Tandon et al., 2019 [76] | Coin Market Cap website | LSTM, RF, Linear Regression | LSTM has the best performance with an MAE of 0.1518 |
| Fuel | Chaitanya Lahari et al., 2018 [77] | Historical data from major metropolitan cities | RNN | Accuracy of above 90% |
| Gold | S and S, 2020 [78] | World Gold Council | LSTM | RMSE of 7.385 |
| Electricity | Mandal et al., 2007 [79] | PJM | RNN | MAPE of less than 10 |
| Zhu et al., 2018 [80] | New England ISO and PJM | LSTM, SVM, DT | LSTM has the best performance with an MAPE of lower than 39 | |
| Ugurlu et al., 2018 [81] | Turkish electricity market of 2016 | LSTM, GRU, ANN | GRU has the best performance with an MAE of 5.36 | |
| Agricultural | Weng et al., 2019 [82] | Beijing Xinfadi Market (August 2015 to July 2018) | RNN, ARIMA, BPNN | The RNN achieved the best performance with the lowest AAE of 0.49, 0.21, 0.15 |
Table 9.
Hybrid model time-series forecasting from 2004 to 2021.
| Domain | Author | Dataset | Model | Result |
|---|---|---|---|---|
| Tang and Diao, 2017 [83] | WIND database (January 2010 to September 2016) | HMM-GARCH | RMSE of 0.0238 and 0.0075 | |
| Stock | Pai and Lin, 2005 [85] | Ten stocks dataset (October 202 to December 2002) | ARIMA, SVM, ARIMA-SVM | Hybrid model has the lowest MAE for the included ten stocks |
| Raiful Hassan et al., 2007 [94] | Daily stock price of Apple, IBM, and Dell from Yahoo Finance | ANN-GA-HMM | MAPE of 1.9247, 0.84871, and 0.699246 for the stock, respectively | |
| Wang and Guo, 2020 [84] | Ten stocks dataset (2015 to 2018) | DWT-ARIMA-GSXGB | RMSE of less than 20.3013 for the worst case, the general cases have an RMSE of less than 0.3 | |
| Chen et al., 2020 [95] | Yahoo Finance (September 2008 to July 2019) | MLP-Bi-LSTM with AM | MAE of 0.025393 | |
| Crude oil | Shabri and Samsudin, 2014 [88] | Brent crude oil prices and WTI crude oil prices | ANN, WANN | WANN has the best performance with MAPE of 1.31 and 1.39 for Brent and WTI dataset |
| Zhang et al., 2015 [86] | WTI and Brent crude oil (January 1986 to 2005) and (May 1987 to June 2005) | EEMD-LSSVM-PSO-GARCH | MAPE of 1.27 and 1.53 for WRI and Brent dataset | |
| Safari and Davallou, 2018 [89] | OPEC crude oil prices (January 2003 to September 2016) | ESM-ARIMA-NAR | MAPE of 2.44, obtained the lowest error compared to other single models | |
| Energy | Bissing et al., 2019 [90] | Iberian electricity market (February to July 2015) | ARIMA -MLR and ARIMA-Holt winter | ARIMA-Holt Winter has better performance with an MAPE of less than 5.07 for different day forecasting |
| Carbon | Zhu and Wei, 2013 [87] | European Climate Exchange (ECX) of December 2010 and December 2012 | ARIMA-LSSVM | RMSE of 0.0311 and 0.0309 for DEC10 and DEC12 |
| Huang et al., 2021 [91] | EUA futures from Wind database | VMD-GARCH and LSTM | VMS-GARCH has the best performance with first ranking in terms of RMSE, MAE and MAPE | |
| Electricity | Shafie-khah et al., 2011 [92] | Spanish electricity market of 2002 | Wavelet-ARIMA-RBFN | Error variances of less than 0.0049 |
| Gold | Kristjanpoller and Minutolo, 2015 [93] | Gold Spot Price and Gold Future Price from Bloomberg (September 1999 to March 2014) | ANN-GARCH | MAPE of 0.6493 and 0.6621 |
Table 10.
Optimal model selection with its suitable data characteristics.
| Model | Linear | Nonlinear | Stationary | Non-Stationary | Volatile | Non-Volatile | Large Dataset | Small Dataset |
|---|---|---|---|---|---|---|---|---|
| ARIMA | ✓ | ✓ | ✓ | ✓ | ||||
| GARCH | ✓ | ✓ | ✓ | ✓ | ||||
| HMM | ✓ | ✓ | ✓ | ✓ | ||||
| SVM | ✓ | ✓ | ✓ | ✓ | ||||
| RF | ✓ | ✓ | ✓ | ✓ | ||||
| ANN | ✓ | ✓ | ✓ | ✓ | ||||
| RNN | ✓ | ✓ | ✓ | ✓ |
Table 11.
Environmental factors and its impact on the attention level and pricing of DSA.
| Factors | Example | Attention Level | Price |
|---|---|---|---|
| Location | High popularity, High rating of surrounding public facilities, business | Increase ↑ | Increase ↑ |
| Weather and temperature | Raining, extremely high or low temperature and air humidity | Decrease ↓ | Decrease ↓ |
Table 12.
Data characteristics tests and results.
| Environmental Factor | Linearity | Stationary | Volatility | Dataset Size | Selected Model | |
|---|---|---|---|---|---|---|
| Location | Popularity index | No | No | No | ≤100 K | SVM |
| Weather | Temperature | Yes | Yes | No | ARIMA | |
| Air humidity | Yes | Yes | No | ARIMA | ||
Publisher’s Note: MDPI stays neutral with regard to jurisdictional claims in published maps and institutional affiliations. |
© 2021 by the authors. Licensee MDPI, Basel, Switzerland. This article is an open access article distributed under the terms and conditions of the Creative Commons Attribution (CC BY) license (https://creativecommons.org/licenses/by/4.0/).
Share and Cite
MDPI and ACS Style
Tan, Y.-F.; Ong, L.-Y.; Leow, M.-C.; Goh, Y.-X. Exploring Time-Series Forecasting Models for Dynamic Pricing in Digital Signage Advertising. Future Internet 2021, 13, 241. https://doi.org/10.3390/fi13100241
AMA Style
Tan Y-F, Ong L-Y, Leow M-C, Goh Y-X. Exploring Time-Series Forecasting Models for Dynamic Pricing in Digital Signage Advertising. Future Internet. 2021; 13(10):241. https://doi.org/10.3390/fi13100241
Chicago/Turabian StyleTan, Yee-Fan, Lee-Yeng Ong, Meng-Chew Leow, and Yee-Xian Goh. 2021. "Exploring Time-Series Forecasting Models for Dynamic Pricing in Digital Signage Advertising" Future Internet 13, no. 10: 241. https://doi.org/10.3390/fi13100241
Note that from the first issue of 2016, this journal uses article numbers instead of page numbers. See further details here.