Deep Learning-Based Sentimental Analysis for Large-Scale Imbalanced Twitter Data


1
School of Computer Science and Technology, Wuhan University of Technology, Wuhan 430070, China
2
Prince Abdullah bin Ghazi Faculty of Information and Technology, Al-Balqa Applied University, Al Salt 19117, Jordan
*
Author to whom correspondence should be addressed.
Future Internet 2019, 11(9), 190; https://doi.org/10.3390/fi11090190
Submission received: 10 July 2019
/
Revised: 24 August 2019
/
Accepted: 31 August 2019
/
Published: 2 September 2019
(This article belongs to the Special Issue Social Network and Artificial Intelligence)
Abstract
:Emotions detection in social media is very effective to measure the mood of people about a specific topic, news, or product. It has a wide range of applications, including identifying psychological conditions such as anxiety or depression in users. However, it is a challenging task to distinguish useful emotions’ features from a large corpus of text because emotions are subjective, with limited fuzzy boundaries that may be expressed in different terminologies and perceptions. To tackle this issue, this paper presents a hybrid approach of deep learning based on TensorFlow with Keras for emotions detection on a large scale of imbalanced tweets’ data. First, preprocessing steps are used to get useful features from raw tweets without noisy data. Second, the entropy weighting method is used to compute the importance of each feature. Third, class balancer is applied to balance each class. Fourth, Principal Component Analysis (PCA) is applied to transform high correlated features into normalized forms. Finally, the TensorFlow based deep learning with Keras algorithm is proposed to predict high-quality features for emotions classification. The proposed methodology is analyzed on a dataset of 1,600,000 tweets collected from the website ‘kaggle’. Comparison is made of the proposed approach with other state of the art techniques on different training ratios. It is proved that the proposed approach outperformed among other techniques.
1. Introduction
The human personality may be judged by different emotions which affect our daily lives, i.e., social networking, manners, behavioral attitudes, and strength of decision making. Human emotion patterns are critical to use in different applications, i.e., health [1], security [2], visual assessment of students [3], and emergency response [4]. Text is a useful source of information that may be used to detect the emotions of individuals in a given time. A huge bulk of textual data can be gathered from social media as users from different communities and cultures interact and discuss in various domains. Social media (e.g., Twitter, Facebook) offers timely information with a feedback facility to users and share of useful discussions in every second. Users post news and then different users around the globe may message to the corresponding post on social media platforms [5]. These messages are commonly known as tweets or microblogs that may enclose individual emotions such as tired, bored, happiness, sadness, anger, and depression. Thus, social media is a big corpus of the public’s data that contains rich information of people’s emotions. It is a better source of information for studying people’s emotions that may be from diverse cultures. The fast-growing base of emotion-rich textual data builds a need to identify and evaluate people’s sentiment conveyed in scripts.
Twitter is a microblogging social network website in which users post their opinions on different topics, discuss different issues, and express their views on daily products. It provides useful information that can be used to investigate crowd emotions. This analysis is further useful to study the characteristics of people’s mood and behavior [6]. The company may evaluate the quality of the corresponding product based on the users’ tweets about the product. It is very hard to gain useful patterns from an extensive collection of textual data. The intelligent text classification method is required to automate the analysis of twitter’s data. Text classification methods used a combination of information from different domains, including data mining, information retrieval, artificial intelligence, Natural Language Processing (NLP), and machine learning. This is a supervised machine learning problem where a model is trained with different examples and then use to predict the unseen piece of text. It may be used to classify the tweets emotions. Recently, countless innovations are accomplished in the NLP and machine learning domains. It dramatically improves the effectiveness of text processing techniques such as vector space model in word embedding [7], softmax based classification [8], tree booting technique [9], and neural networks [10]. However, tuning the designed algorithm for the optimal solution is still quite hard to sustain.
1.1. Challenges in Tweets’ Contents
Our target is to discover emotions in social media by categorizing text messages into two categories of emotion, i.e., positive and negative emotions. To accomplish this, the foremost challenges that must be tackled in text analysis are as follows.
- Mostly users type in casual text that may contain different spelling and grammatical mistakes [11]. Tweets may contain poor grammar, poor punctuations, and incomplete sentences.
- Different cultured users may have different types of emotions and communication barriers
- Sometimes humans cannot express their feelings in text messages because the mood is subjective, and we are interested in sentimental analysis.
- There are different fuzzy boundaries of emotions with various facial expressions, and it is difficult to read all the emotions boundaries of human behavior to automate the system [12].
- The labelling and annotating of a large number of topics in different domains discussed on social media is a challenging task that can cover all emotional states [13].
1.2. Motivation
In this paper, we designed a hybrid approach of Deep learning and PCA to classify the tweets in positive and negative emotions. The main contributions of this paper are:
- Designed a hybrid deep learning approach based on TensorFlow with Keras API to classify the emotions enclosed in tweets.
- The overfitting and class imbalance problems really affect the accuracy, loss, and misclassification values. Dropout layer, number of densely connected neurons, and activation function were applied to fine-tune the proposed deep learning model and resolve the overfitting issue. The imbalanced classes problem is tackled by using the class balancer method. We have shown with and without fine-tune configuration results the importance of these factors.
- There is a high correlation among a large number of values in tweets. The PCA technique is applied to target the issue of correlation.
- The comparison with other state of the art techniques verifies the efficiency of the proposed method.
2. Literature Review
Previously, many researchers used manual annotation methods to assess the accuracy of their models. It is quite a hard and time-consuming job that requires high energy and effort. Secondly, each researcher thinks in a different way to investigate the text. Later, text analysis researchers used NLP techniques to classify text automatically based on semantics. The hashtag is considered a useful feature to automate the labelling and classification process [14,15]. There are 50,000 tweets used with hashtags divided into six emotions such as anger, disgust, fear, happy, sad, and surprised. A lexicon database is designed that contains these emotions used for the analysis of unseen tweets. It has two basic constraints; for example, those words which do not co-occur with corresponding tags will be eliminated. Secondly, there are many domains in which hashtags are not used to show the individual’s emotions. Hence, this idea is a domain-specific [16,17]. The knowledge graphs showed a vital contribution to data training using the machine and deep learning-related tasks. In [18], six basic emotions are proposed that are used to define the facial expressions. The Profile of Mood States (POMS) is a psychological device that shows the mood states in six different dimensions. A number of emotional adjectives are merged to present each mood dimension, i.e., sweet, bitter, anger, happy, etc. The method is suggested to be better depending on how it reads the strength of each emotion in the last month [19,20].
Several data mining techniques have emerged recently that are used to extract useful patterns from tweets. In [21], the sentimental verification of tweets is a challenging task due to multilingual text messages. The preprocessing steps are used to extract the tokens from the emotional dataset, and then graph propagation algorithm is used to zoom the contribution of each token in terms of similarity. Next, the sentimental analysis method is applied to classify each token’s emotions. In [22], the data mining technique is used for the sentimental analysis of tweets data. The designed algorithm is used to classify each tweet in terms of emotions in real-time. The dataset is taken in this experiment is very small, and the algorithm does not work for a large dataset of tweets. Moreover, the data imbalance issue is not targeted in the proposed methodology. The geolocation tweets are classified based on their text. The sentimental analysis algorithm is applied to predict geolocation from tweet analysis due to differences in emotional states across different countries [23].
Previously, most researchers targeted only one emotion classification. Also, the data imbalance and sparsity features problem is not tackled before applying classification algorithms. Our proposed hybrid approach mainly solved the problem of a large scale of tweets preprocessing, data imbalance, and highly correlated data problems, which are mostly present in tweet datasets. Moreover, the designed approach answers the following questions:
- Can we label the sparse and incomplete tweet messages?
- Can we solve the imbalanced data problem in sparse tweet dataset?
- Can deep learning algorithm give better accuracy for large scale of tweets data?
- Can we retune the deep learning algorithm to get the optimal solution?
3. Proposed Methodology
Twitter is a microblogging website where millions of users around the globe posts in short text messages. The twitter Application Programming Interface (API) provides a free service to extract raw tweets from twitter with all metadata that can be further used for research purposes [24]. The proposed approach is designed to classify emotions in terms of positive and negative comments. We have collected a raw ‘emotions’ dataset (https://www.kaggle.com/kazanova/sentiment140) from the ‘kaggle’ website which contains 1,600,000 tweets extracted by twitter API. These tweets are further preprocessed to extract meaningful features using preprocessing steps. These steps include tokenization, stemming, root words extraction, and frequency details of each feature. It gives a dataset with useful features and frequencies information, as shown in Figure 1. Next, the entropy weighting technique is applied to extract weighting values for each feature [25]. These values indicate the importance of each feature in a corpus. We calculated local and global weighting features, which compute the significance of each feature in a single tweet and/or a group of tweets, respectively, as users may show their opinions in tweets with a different number of words. They may type from a few words to a few sentences, and there is no proper rule that can restrict users to post a limited number of words. As a result, it gives an imbalanced classes set. The class balancer technique is used to balance each class for better prediction. It calculates its reweight value for each class that can sum up to balance the total weight of each class. This weighting value is further used to balance each class for better prediction accuracy [26].
3.1. Principal Component Analysis
Meaningful data interpretation of a large dataset is quite challenging. The PCA is used to transform highly correlated data into a limited number of uncorrelated values comprising the actual information. It calculates Principal Components (PCs) for all variables contained in a dataset. Different numbers of PCs can be calculated such that the first PC encloses the peak variance, the next PC comprises the second uppermost variance, and so on. These PCs map the highly dimensional dataset into the simplest variables and make it easier to investigate the data for predictions purposes [27,28]. The emotions tweet data is mostly gathered in raw text, and it must be separated from noisy data. We used the PCA technique to convert the complex tweet dataset into the simplest form of PCs. Mathematically, it represents the p dimensional data with discrete coefficients as given in Equation (1).
where w indicates the single dimension and k is the linear figure. It converts every instance (ai) in ‘emotions’ data to a form of PCs values as given in Equation (2).
where t describes the mined variations from every data instance. Equation (3) shows the factors’ weights.
where i = 1,…,n and k = 1,…., l. The x represents highest conceivable variance with w factor for the respective variance. Mathematically, the PC1 is expressed as given in Equation (4).
where w is the PC and x means the number of instance in tweets. It gives scores in the standardized form in a range of −1 to +1 [29]. There are 12 different PCs extracted from the ‘emotions’ dataset, as shown in Table 1. We select eight PCs for a further experiment as it covers the maximum variance of the ‘emotion’ dataset.
3.2. Deep Learning with TensorFlow Framework and Keras
The TensorFlow is an open-source machine learning framework which is designed for large-scale training and prediction purposes. Users can easily design and deploy new algorithms using the same server architecture and APIs. It makes it easier to extend different machine and deep learning models with out of the box integration facilities. Primarily, it works in three phases: First, processing the data, and then configuring the required deep learning algorithm. After that, it trains and evaluates the configured algorithm [30,31]. A TensorFlow-based algorithm presents computations on every node in a dataflow visualized graph. It gathers each node’s information from a cluster of nodes by using different devices, i.e., Graphical Processing Units (GPUs), and multicore Central Processing Units (CPUs). It executes the designed algorithm in a multidimensional array, i.e., tensors. These tensors are base data types which offer a generalization concept to output. The queue feature is used to compute tensors asynchronously. It provides multithreading processing to speed up the operation [32,33]. We designed a complex deep learning approach based on TensorFlow and Keras Application Programming Interface (API) for the classification of tweets’ emotions. The normalized uncorrelated PC features are further used as input into the deep learning algorithm. The input reader accepts data and reads it in the same format, as shown in Figure 2. After that, the queue and the preprocessing phase receive the data. The preprocessing section preprocessed the PC data and made it available for queuing process. The queue phase provides a multithreading facility to tweets features. Further, the features are trained using the back and forward step. Also, it uses a cycle to train and fine-tune the parameters. The fine-tuning process is used to predict emotions with better accuracy. We fine-tuned the designed algorithm with dropout layers, activation function, number of neurons, each dense layer, and activation function.
It receives tensor and generates tensor based on the same shape as output. The optimization function contributes to predictions. The Adam optimizer is used to compile and optimize the proposed model. It is also called stochastic descent gradient. It works in iteration to compute and renovate the network weights. It calculates the discrete adaptive learning rates for every parameter in the deep learning network [34,35]. The decaying means of pas squared gradients are shown in Equations (5) and (6) [36].
where mt and vt are the estimated means of the first and second moment gradients, respectively. The g denotes respective gradient for each moment.
4. Results and Discussions
We take the kaggle dataset, which contains 1,600,000 emotions tweets collected using twitter API. The dataset contains user identification (id) number, date of tweet posted, username (name of user account), and tweet text columns. The target variable is set to 0 = negative, 2 = neutral and 4 = positive. The negative, neutral, and positive mean negative, neutral, and positive impressions in tweets, respectively. Tweets contain raw text which needs to be refined before being used for prediction purposes. The preprocessing steps are used to convert these tweets into useful features without noisy data. A chunk of tweets is shown in Figure 3, as it is difficult to visualize the whole dataset. There is a total of 2100 tweets shown in positive and negative emotions are 50.90% and 49.10% respectively. Tweets are mostly not an equal number of words, and there is no proper rule that restricts users to a limited number of words and no grammar rule while posting tweets. We faced two problems in the training phase. First, the class imbalance problem among minority classes and secondly high correlation among weighing features [37]. These two problems must be solved in order to get better classification accuracy. The correlation values are shown in Figure 4. The tweets emotions and classes show the dataset variables and the lower diagonal shows the visual representation of the correlation. The upper diagonal shows the correlation in numbers.
We used the class balancer technique to balance classes and zoom the minority classes. It calculates and adds the weight value of each minor class and then sums up the total to balance all features contain in a dataset. Figure 5 shows the balanced features after applying class balancer technique. The class balancer converts the dataset into 12 number of features set, as shown in the diagonal. The first is the weight variable, which is used to balance each class according to the corresponding values. We have balanced the classes, but the correlation problem is still there. The correlation among text features significantly affects the classification to accuracy. Further, we applied PCA to convert high correlated data into normalized uncorrelated scores, as shown in Figure 6.
PCA removes the high correlation among values and transforms the ‘emotions’ dataset into uncorrelated variables. There are 12 PCs extracted from the class balancer feature’s set, as shown in the diagonal. We used 8 PCs for further input to deep learning as it covers the maximum variances [38]. Mostly, the correlation values are zero shown in upper diagonal, which is a good indication for better classification accuracy. We designed a densely connected deep learning model from the TensorFlow framework. There is a total of 11 layers configured in which five are densely connected and four are dropout layers, as shown in Table 2. The first dense layers take input with Relu activation function. Each successive dense layer receives input from the previous layer. The four successive dense layers configured with 100, 80, 60, and 40 neurons respectively. Dropout layer is configured with each dense layer to solve the problem of overfitting. The 5th dense layer is configured to target the output variable with the softmax activation function. All these dense layers are densely connected with each other to train the required data [39,40]. It receives tensor as input then focuses tensor with same output shape. The Adam optimizer uses stochastic descent gradients to compile and optimize the designed deep learning model [34,35]. The proposed deep learning model is fine-tuned with activation and loss functions, dropout layer, optimizer, and learning error rate.
The deep learning algorithm with TensorFlow framework is applied on selected PCs, as shown in Figure 7. The acc, val_acc, val_loss denote accuracy, validated the accuracy, and validated loss, respectively. The accuracy and loss metrics with 100 epochs are shown with and without fine configuration, i.e., (a) and (b). The blue color presents loss and accuracy curves in both figures. Similarly, green color shows the validated accuracy and validated loss, respectively. First, we performed the experiment without fine-tuning configuration and got 80% accuracy, i.e., (a). The loss and validated curves show in a range of 0.35 to 0.7. Initially, the loss is quite high but gradually decreases up to 0.35. Similarly, accuracy and validated calculated in a range of 0.5 to 0.80. While on the hand with fine-tune configuration, we got an accuracy of 98.4%. The loss curves start at 0.7 but soon decrease to 0.025. Similarly, the accuracy curve starts from 0.3 but soon increases to 0.7 on 5 epoch. Then, it runs in the same direction with 0.7 accuracy and on 38 epoch it again increased up to 98%. Fine-tune configuration solved the overfitting problem and improved the prediction accuracy as proved from both subgraphs.
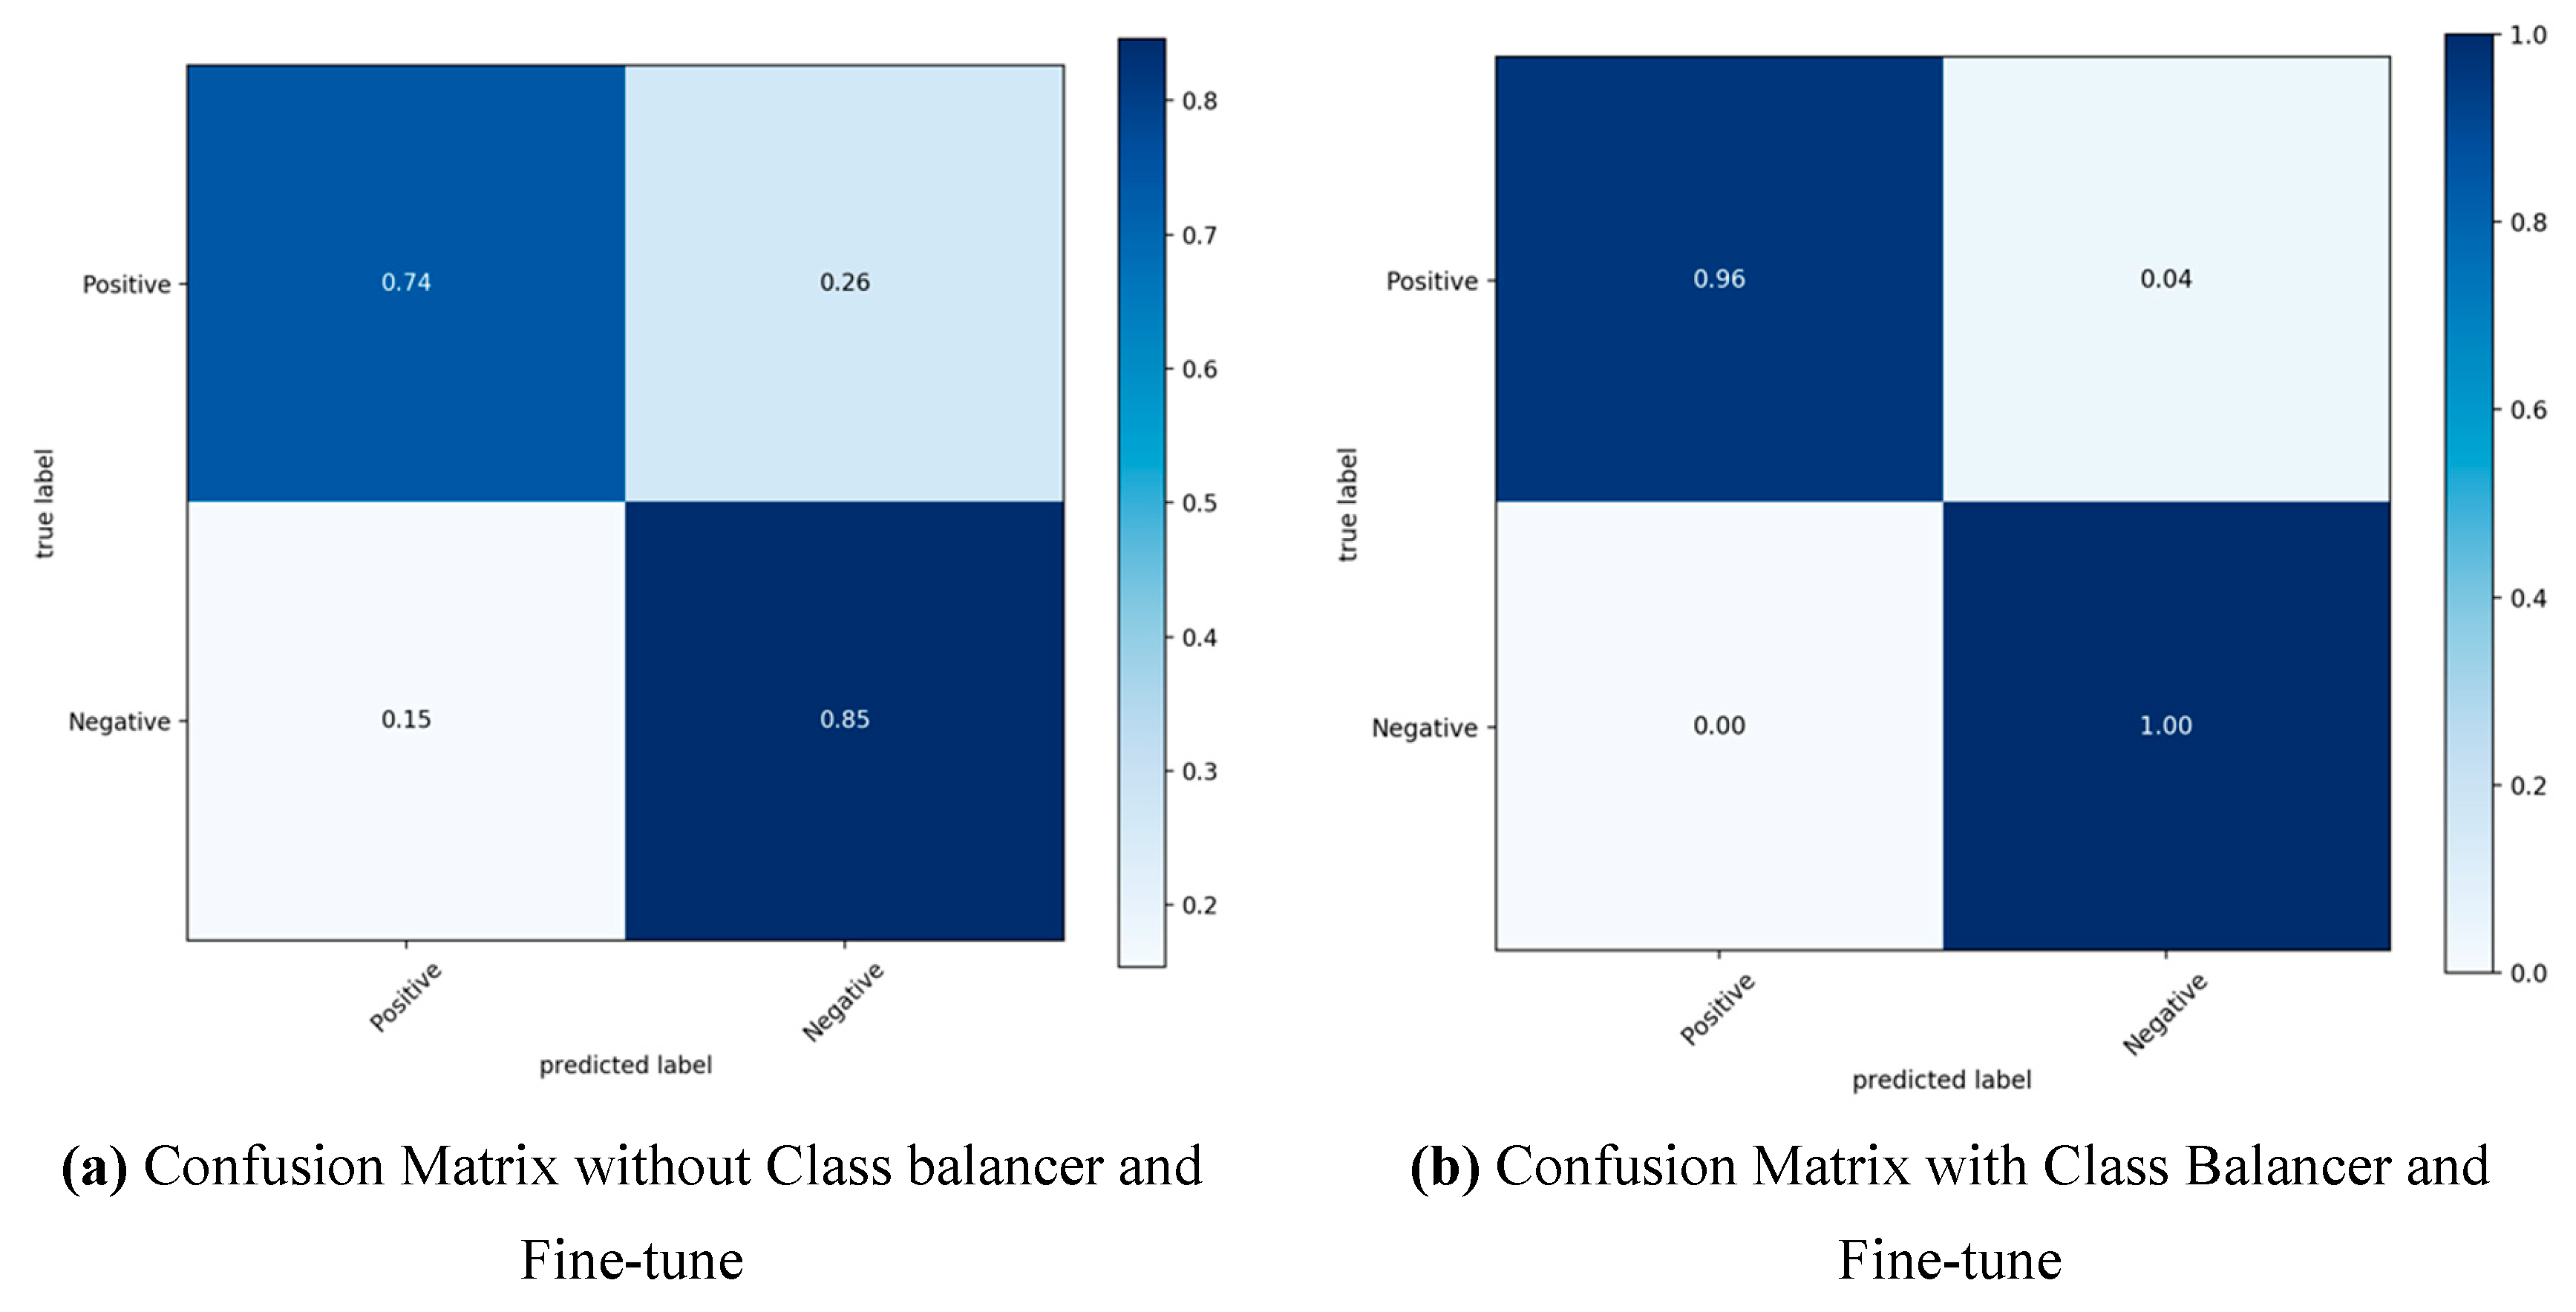
The confusion matrices are presented to compare the classification and misclassification errors with and without fine-tune configuration, as shown in Figure 8. The true label is given vertically, and the predicted label is given horizontally. The diagonal values show the predicted values in terms of percentage for emotions prediction, while other cells denote misclassification for each class. The prediction accuracy of positive tweets is 74%, and negative tweets are 85% without fine-tune configuration. The overall emotions prediction accuracy is 80%. However, after fine-tuning configuration, we got really interesting results, as shown in Figure 8b. The emotions prediction of positive emotions is 96% and for negative 100%. The overall accuracy is 98.4% after fine-tuning the designed deep learning model. Further, the proposed approach is compared in terms of percentage training ratio with other states of the art methods, i.e., Support Vector Machine (SVM), Multi-Layer perceptron (MLP), Random Forest (RF), Logit Boost, Logistic Regression (LR), and K-Nearest Neighbor (KNN), as shown in Table 3. Overall, the proposed deep learning approach outperforms in each phase of % training ratio from 90% to 30%. The maximum accuracy of the proposed approach is 98.4% with 90% training ratio and minimum 86.53% with 30% training ratio.
5. Conclusions
Effective emotions prediction from the raw text of twitter’s data is very important. This is really helpful to automate the process of useful features extraction. However, it is very hard to predict the actual information from tweets, as users are not restricted to follow a specific type of grammar rules or a number of words in tweets. Emotions have fuzzy boundaries with subjective concepts, but it may be presented in different expressions and terminologies. We proposed a hybrid TensorFlow deep learning approach with Keras API to predict meaningful emotions features from tweets. The proposed research mainly targets feature extraction from incomplete, imbalanced, and highly sparse tweets. We used preprocessing steps, class balancer, and PCA to get high-quality features from these types of tweets. The preprocessing measures are applied to extract features with frequency details. Tweets are always imbalanced as the public is not restricted to use a specific syntax and semantic structure with a limited number of words. To solve the imbalance problem, we used the class balancer technique to calculate the weight value for each class and then include this weight value with each class. The high correlation among features is another big issue that may affect prediction accuracy. The PCA technique is used to extract normalized uncorrelated features from highly correlated data. Then, the proposed TensorFlow based deep learning approach is fine-tuned to predict high-quality emotions features with an accuracy of 98.4%. We have shown accuracy, loss, classification, and misclassification errors with and without fine-tune configuration to get a better understanding of the proposed deep learning model. The designed TensorFlow deep learning approach has the following advantages compared to other methods.
- It provides excellent visualization and high computation services for a large scale of tweets data.
- TensorFlow-based algorithms can be deployed easily from a cellular device to a huge number of complex networks.
- It provides unified functions and fast updates as it is maintained by a big organization, i.e., Google.
- It has a great feature of flexibility and can be easily extendable.
- To get better accuracy, we may configure the dense layers according to our requirements in terms of a number of neurons and activation methods.
- Dropout layer configuration is another great feature which solves the overfitting problem. It can be easily fine-tuned with learning error rate and type of activation function.
Our outcomes show that the proposed approach is an efficient process to detect emotions from a large volume of raw tweets. The proposed work does not show the synthetic detail relationship among tokens used in the same tweet. Synthetic features based on NLP may be better for classification as these features indicate the relationship among words of tokens. It shows how a token is related to other tokens used in the same tweet. The n-gram technique can be used to extract these types of features. In the future, we will try to extract n-grams and word embedding features from raw tweets. Then, these features will be used to test the proposed experiments.
Author Contributions
N.J. implemented the experiment and wrote the whole manuscript. C.X. supervised and analyzed the experimental results. H.A. reviewed the manuscript.
Funding
This work was supported by the Chinese Scholarship Council, China, Wuhan, under Grants CSC N0. 2017GBJ008235
Conflicts of Interest
The authors declare no conflict of interest.
References
- Ji, X.; Chun, S.A.; Wei, Z.; Geller, J. Twitter sentiment classification for measuring public health concerns. Soc. Netw. Anal. Min. 2015, 5, 13. [Google Scholar] [CrossRef]
- Peltola, M.J.; Forssman, L.; Puura, K.; Van Ijzendoorn, M.H.; Leppänen, J.M. Attention to Faces Expressing Negative Emotion at 7 Months Predicts Attachment Security at 14 Months. Child Dev. 2015, 86, 1321–1332. [Google Scholar] [CrossRef] [PubMed]
- Whitehill, J.; Serpell, Z.; Lin, Y.-C.; Foster, A.; Movellan, J.R. The Faces of Engagement: Automatic Recognition of Student Engagementfrom Facial Expressions. IEEE Trans. Affect. Comput. 2014, 5, 86–98. [Google Scholar] [CrossRef]
- Neppalli, V.K.; Caragea, C.; Squicciarini, A.; Tapia, A.; Stehle, S. Sentiment analysis during Hurricane Sandy in emergency response. Int. J. Disaster Risk Reduct. 2017, 21, 213–222. [Google Scholar] [CrossRef] [Green Version]
- Kaplan, A.M.; Haenlein, M. Users of the world, unite! The challenges and opportunities of Social Media. Bus. Horizons 2010, 53, 59–68. [Google Scholar] [CrossRef]
- Khan, F.H.; Bashir, S.; Qamar, U. TOM: Twitter opinion mining framework using hybrid classification scheme. Decis. Support Syst. 2014, 57, 245–257. [Google Scholar] [CrossRef]
- Bel-Enguix, G.; Gómez-Adorno, H.; Reyes-Magaña, J.; Sierra, G. Wan2vec: Embeddings learned on word association norms. Semant. Web 2019, 1–16, (Preprint). [Google Scholar]
- Stein, R.A.; Jaques, P.A.; Valiati, J.F. An analysis of hierarchical text classification using word embeddings. Inf. Sci. 2019, 471, 216–232. [Google Scholar] [CrossRef]
- Olson, R.S.; Moore, J.H. TPOT: A Tree-Based Pipeline Optimization Tool for Automating Machine Learning. In Automated Machine Learning; Springer: Berlin, Germany, 2019; pp. 151–160. [Google Scholar] [Green Version]
- Hubara, I.; Courbariaux, M.; Soudry, D.; El-Yaniv, R.; Bengio, Y. Binarized neural networks. In Advances in Neural Information Processing Systems; Neural Information Processing Systems Foundation, Inc.: Barlcelona, Spain, 2016; pp. 4107–4115. [Google Scholar]
- Beigi, G.; Hu, X.; Maciejewski, R.; Liu, H. An overview of sentiment analysis in social media and its applications in disaster relief. In Sentiment Analysis and Ontology Engineering; Springer: Berlin, Germany, 2016; pp. 313–340. [Google Scholar]
- Gunes, H.; Schuller, B.; Pantic, M. Emotion representation, analysis and synthesis in continuous space: A survey. In Face and Gesture 2011; IEEE: Piscataway, NJ, USA, 2011; pp. 827–834. [Google Scholar] [Green Version]
- Hasan, M.; Rundensteiner, E. Agu Emotex: Detecting Emotions in Twitter Messages. 2014. Available online: http://web.cs.wpi.edu/~emmanuel/publications/PDFs/C30.pdf. (accessed on 29 August 2019).
- Felbo, B.; Mislove, A.; Søgaard, A.; Rahwan, I.; Lehmann, S. Using millions of emoji occurrences to learn any-domain representations for detecting sentiment, emotion and sarcasm. arXiv 2017, arXiv:1708.00524. [Google Scholar]
- Wang, W.; Chen, L.; Thirunarayan, K.; Sheth, A.P. Harnessing twitter “big data” for automatic emotion identification. In Proceedings of the 2012 International Conference on Privacy, Security, Risk and Trust and 2012 International Confernece on Social Computing, Amsterdam, The Netherlands, 3–5 September 2012. [Google Scholar]
- Mohammad, S.M.; Kiritchenko, S. Using hashtags to capture fine emotion categories from tweets. Comput. Intell. 2015, 31, 301–326. [Google Scholar] [CrossRef]
- Mohammad, S.M.; Kiritchenko, S.; Zhu, X. NRC-Canada: Building the State-of-the-Art in Sentiment Analysis of Tweets. arXiv 2013, arXiv:1308.6242. [Google Scholar]
- Ekman, P. An argument for basic emotions. Cogn. Emot. 1992, 6, 169–200. [Google Scholar] [CrossRef]
- Plutchik, R. A general psychoevolutionary theory of emotion. In Theories of Emotion; Academic Press: Cambridge, MA, USA, 1980; pp. 3–33. [Google Scholar]
- Norcross, J.C.; Guadagnoli, E.; Prochaska, J.O. Factor structure of the Profile of Mood States (POMS): Two partial replications. J. Clin. Psychol. 1984, 40, 1270–1277. [Google Scholar] [CrossRef]
- Deriu, J.; Lucchi, A.; De Luca, V.; Severyn, A.; Müller, S.; Cieliebak, M.; Hofmann, T.; Jaggi, M. Leveraging Large Amounts of Weakly Supervised Data for Multi-Language Sentiment Classification. In Proceedings of the 26th International Conference on World Wide Web, Perth, Australia, 3–7 April 2017. [Google Scholar]
- Bifet, A.; Frank, E. Sentiment knowledge discovery in twitter streaming data. In International Conference on Discovery Science; Springer: Berlin/Heidelberg, Germany, 2010; pp. 1–15. [Google Scholar]
- Summa, A.; Resch, B.; Strube, M. Microblog emotion classification by computing similarity in text, time, and space. In Proceedings of the Workshop on Computational Modeling of People’s Opinions, Personality, and Emotions in Social Media (PEOPLES), Osaka, Japan, 12 December 2016. [Google Scholar]
- Häberle, M.; Werner, M.; Zhu, X.X. Geo-spatial text-mining from Twitter – a feature space analysis with a view toward building classification in urban regions. Eur. J. Remote. Sens. 2019, 52, 2–11. [Google Scholar] [CrossRef]
- Wang, T.; Cai, Y.; Leung, H.-F.; Cai, Z.; Min, H. Entropy-based term weighting schemes for text categorization in VSM. In Proceedings of the 2015 IEEE 27th International Conference on Tools with Artificial Intelligence (ICTAI), Vietri sul Mare, Italy, 9–11 November 2015. [Google Scholar]
- Borrajo, L.; Romero, R.; Iglesias, E.L.; Marey, C.M.R. Improving imbalanced scientific text classification using sampling strategies and dictionaries. J. Integr. Bioinform. 2011, 8, 90–104. [Google Scholar] [CrossRef]
- Olive, D.J. Principal component analysis. In Robust Multivariate Analysis; Springer: Berlin, Germany, 2017; pp. 189–217. [Google Scholar]
- Jolliffe, I.T.; Cadima, J. Principal component analysis: A review and recent developments. Philos. Trans. R. Soc. A Math. Phys. Eng. Sci. 2016, 374, 20150202. [Google Scholar] [CrossRef] [PubMed]
- Vidal, R.; Ma, Y.; Sastry, S. Generalized principal component analysis (GPCA). IEEE Trans. Pattern Anal. Mach. Intell. 2005, 27, 1945–1959. [Google Scholar] [CrossRef] [PubMed] [Green Version]
- Abadi, M.; Agarwal, A.; Barham, P.; Brevdo, E.; Chen, Z.; Citro, C.; Corrado, G.S.; Davis, A.; Dean, J.; Devin, M.; et al. TensorFlow: Large-Scale Machine Learning on Heterogeneous Distributed Systems. arXiv 2016, arXiv:1603.04467. [Google Scholar]
- Sergeev, A.; Del Balso, M. Horovod: Fast and easy distributed deep learning in TensorFlow. arXiv 2018, arXiv:1802.05799. [Google Scholar]
- Abadi, M.; Barham, P.; Chen, J.; Chen, Z.; Davis, A.; Dean, J.; Devin, M.; Ghemawat, S.; Irving, G.; Isard, M.; et al. TensorFlow: A system for large-scale machine learning. In Proceedings of the 12th {USENIX} Symposium on Operating Systems Design and Implementation, Savannah, GA, USA, 2–4 November 2016. [Google Scholar]
- Baylor, D.; Breck, E.; Cheng, H.T.; Fiedel, N.; Foo, C.Y.; Haque, Z. Tfx: A tensorflow-based production-scale machine learning platform. In Proceedings of the 23rd ACM SIGKDD International Conference on Knowledge Discovery and Data Mining, Halifax, NS, Canada, 13–17 August 2017. [Google Scholar]
- Tato, A.; Nkambou, R. Improving Adam Optimizer. 2018. Available online: https://openreview.net/forum?id=HJfpZq1DM (accessed on 29 August 2019).
- Zhang, Z. Improved Adam Optimizer for Deep Neural Networks. In Proceedings of the 2018 IEEE/ACM 26th International Symposium on Quality of Service (IWQoS), Banff, AB, Canada, 4–6 June 2018. [Google Scholar]
- Ruder, S. An overview of gradient descent optimization algorithms. arXiv 2016, arXiv:1609.04747. [Google Scholar]
- Rogati, M.; Yang, Y. High-performing feature selection for text classification. In Proceedings of the eleventh international conference on Information and knowledge management, McLean, VA, USA, 4–9 November 2002. [Google Scholar]
- Ullah, F.; Wang, J.; Farhan, M.; Habib, M.; Khalid, S. Software plagiarism detection in multiprogramming languages using machine learning approach. Concurr. Comput. Pr. Exp. 2018, e5000. [Google Scholar] [CrossRef]
- Jia, C.; Carson, M.B.; Wang, X.; Yu, J. Concept decompositions for short text clustering by identifying word communities. Pattern Recognit. 2018, 76, 691–703. [Google Scholar] [CrossRef]
- Setareh, H.; Deger, M.; Petersen, C.C.H.; Gerstner, W. Cortical Dynamics in Presence of Assemblies of Densely Connected Weight-Hub Neurons. Front. Comput. Neurosci. 2017, 11, 52. [Google Scholar] [CrossRef] [PubMed]
Figure 1.
Emotions Classification using a hybrid approach of Deep Learning based on TensorFlow−Keras and Principal Component Analysis (PCA).
Figure 1.
Emotions Classification using a hybrid approach of Deep Learning based on TensorFlow−Keras and Principal Component Analysis (PCA).
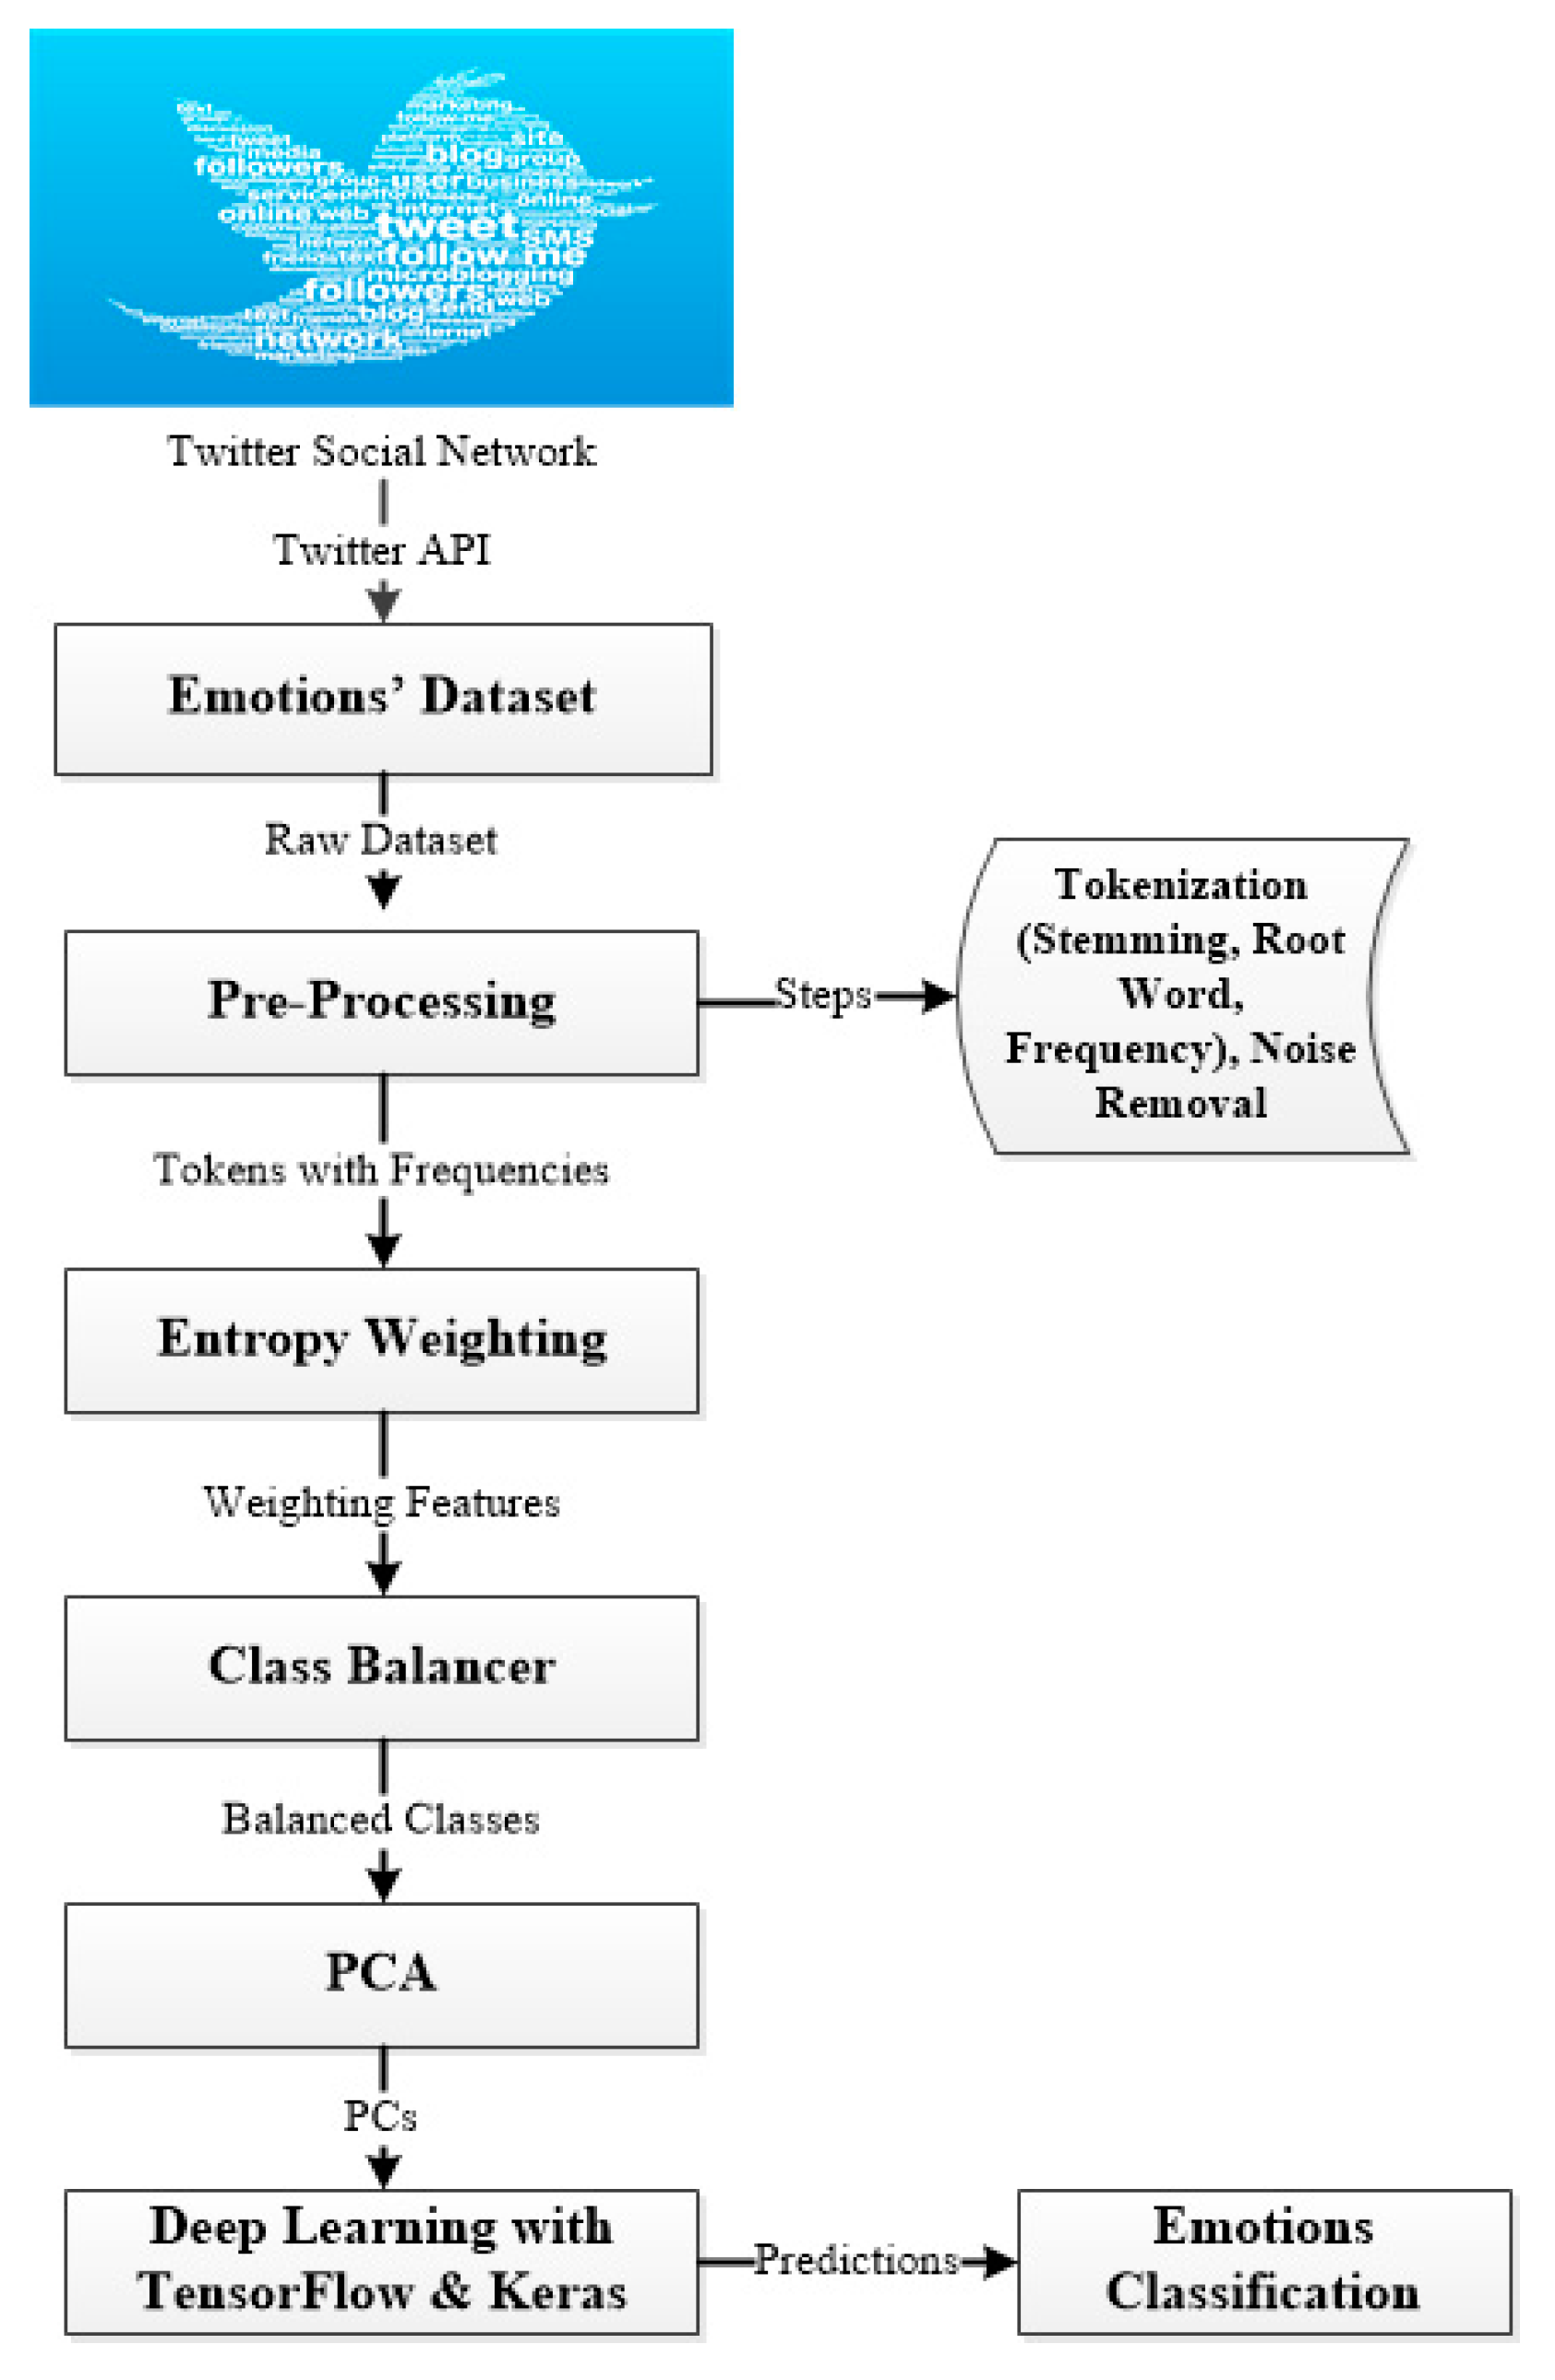
Figure 2.
TensorFlow dataflow graph for training tweets data.
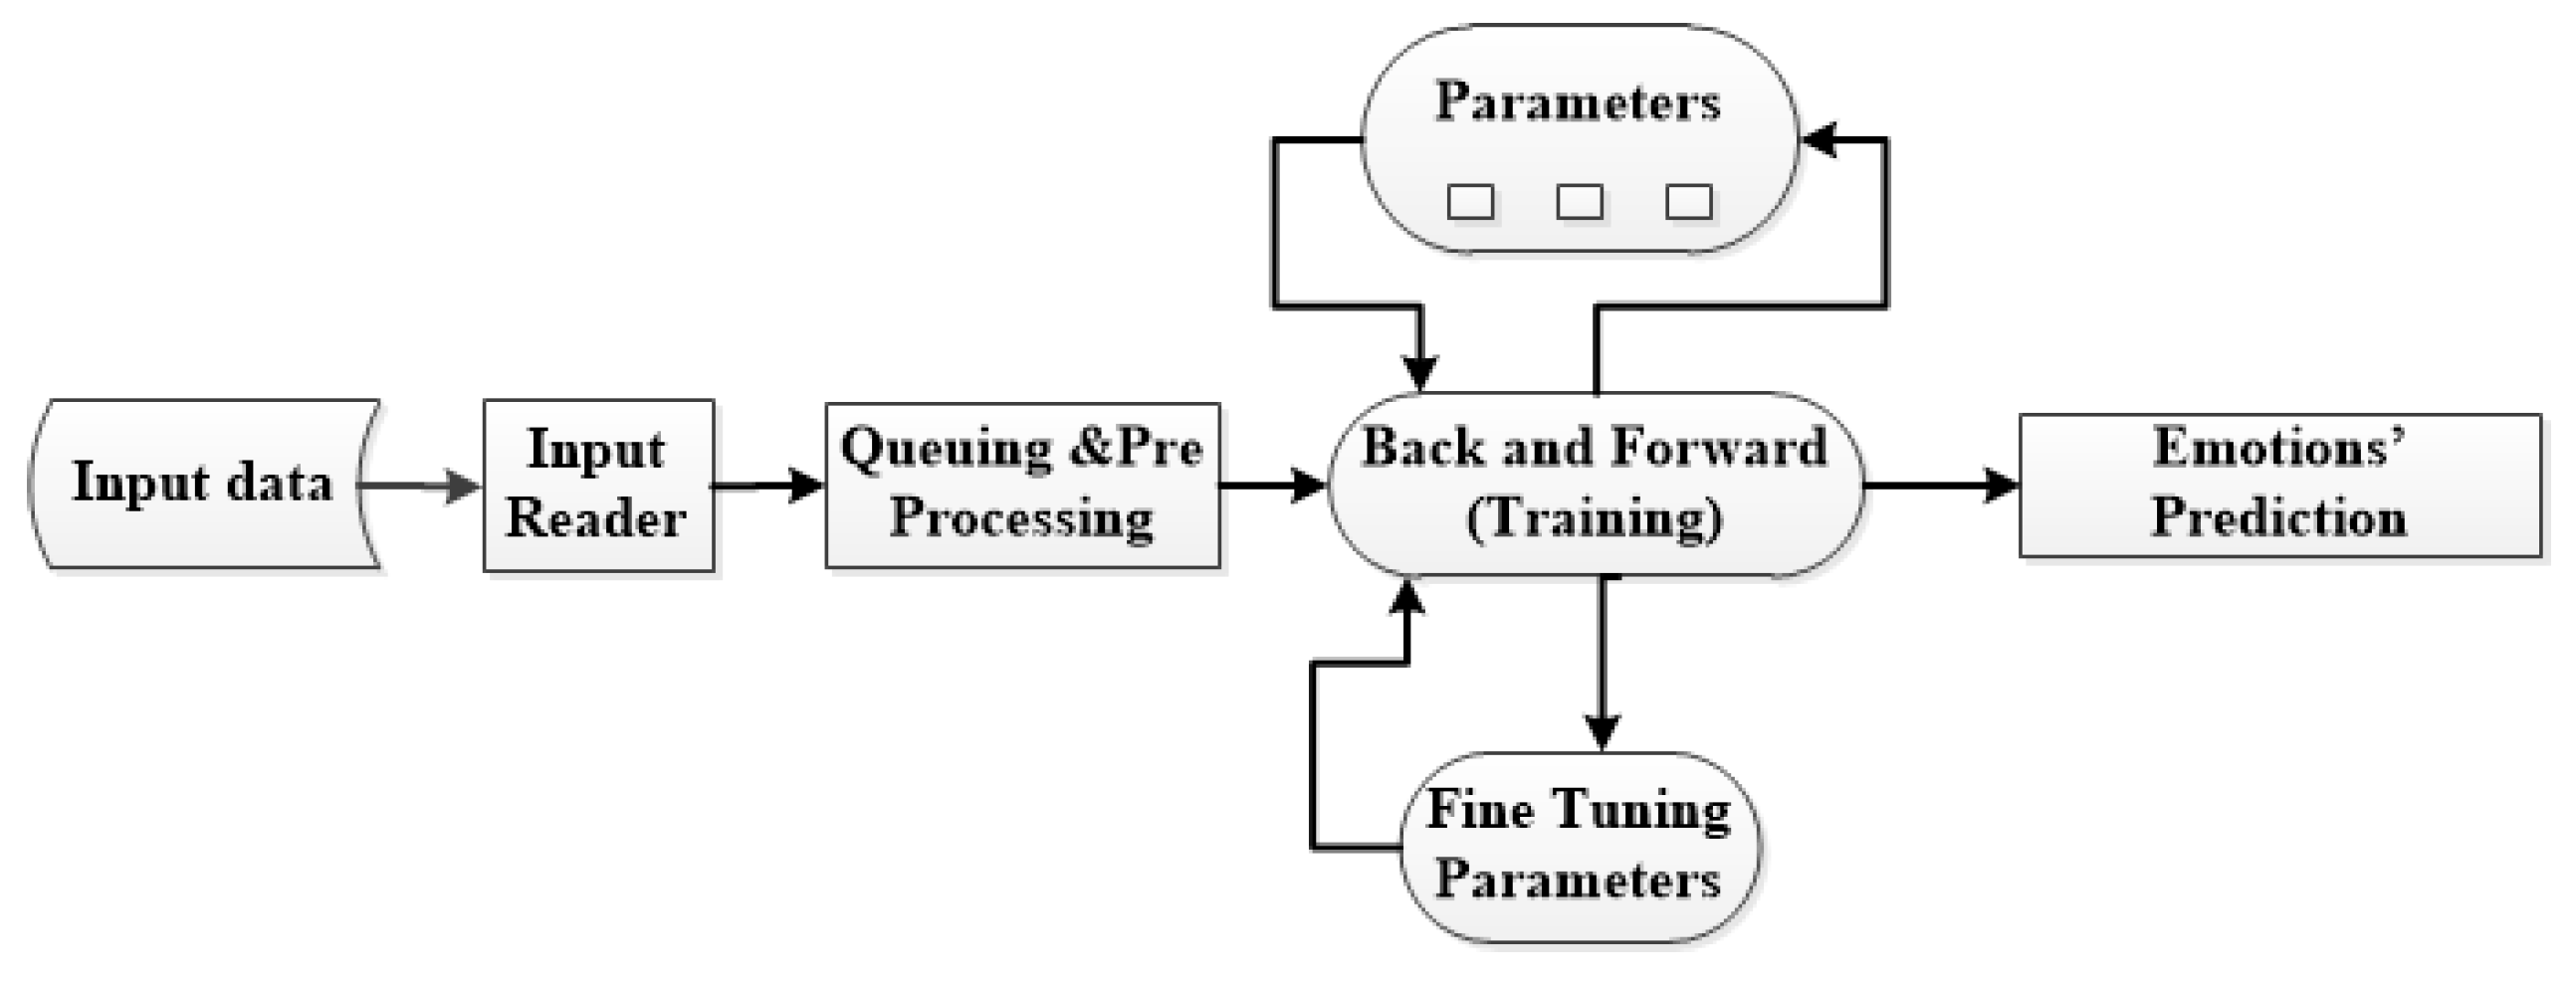
Figure 3.
Percentage ratio of positive and negative emotions tweets for training features.
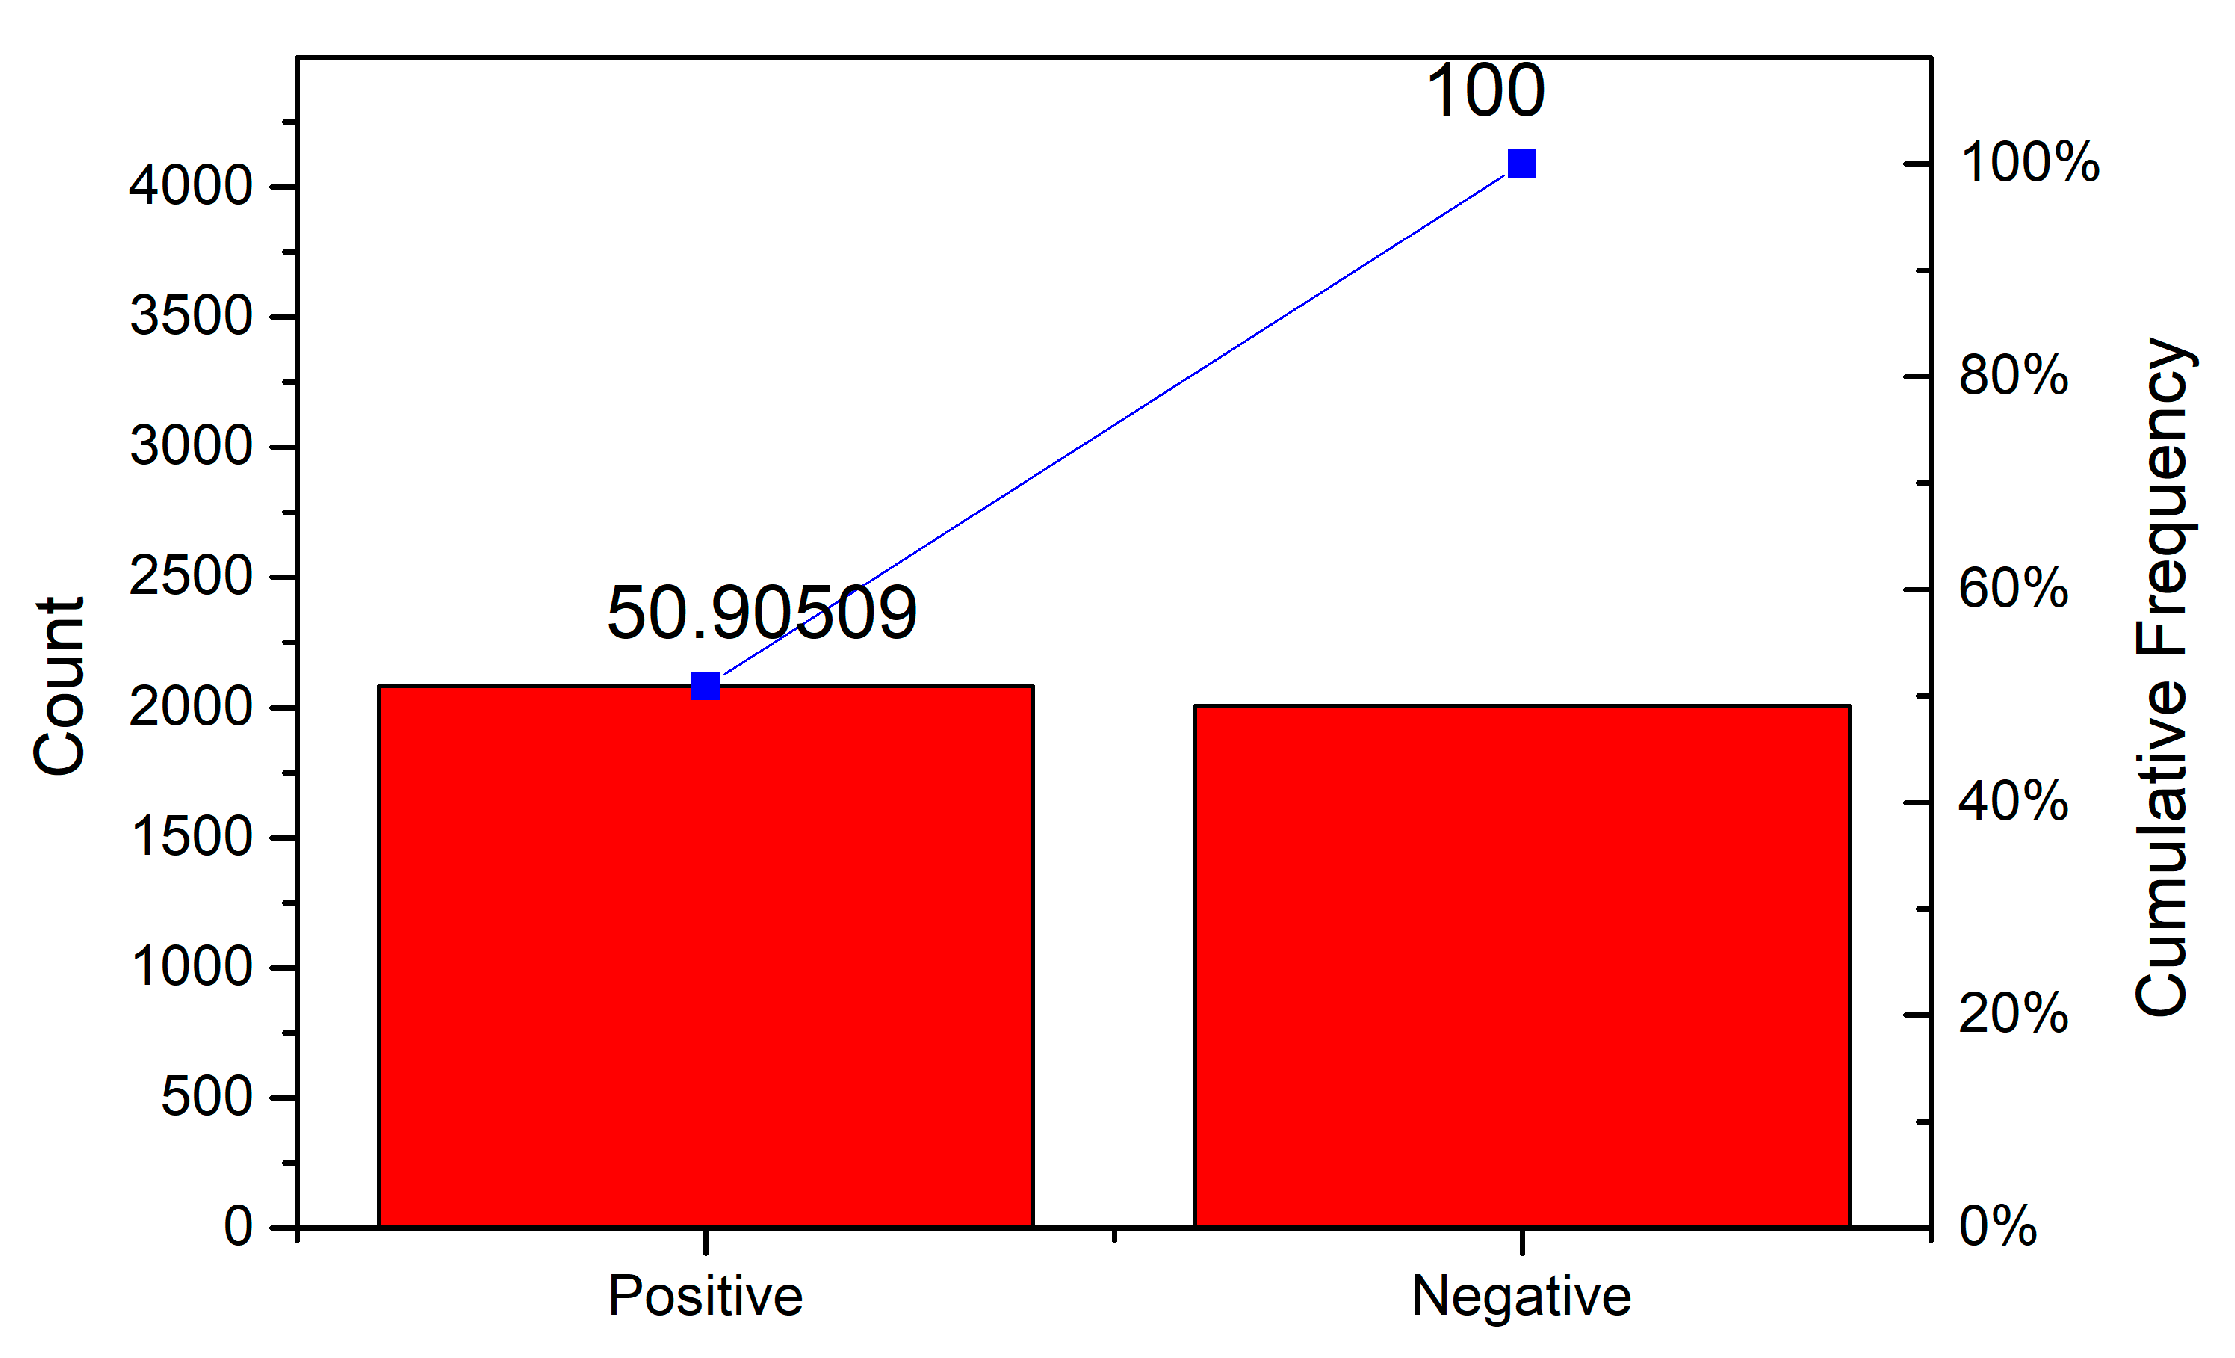
Figure 4.
Correlation among emotion tweets in a dataset.
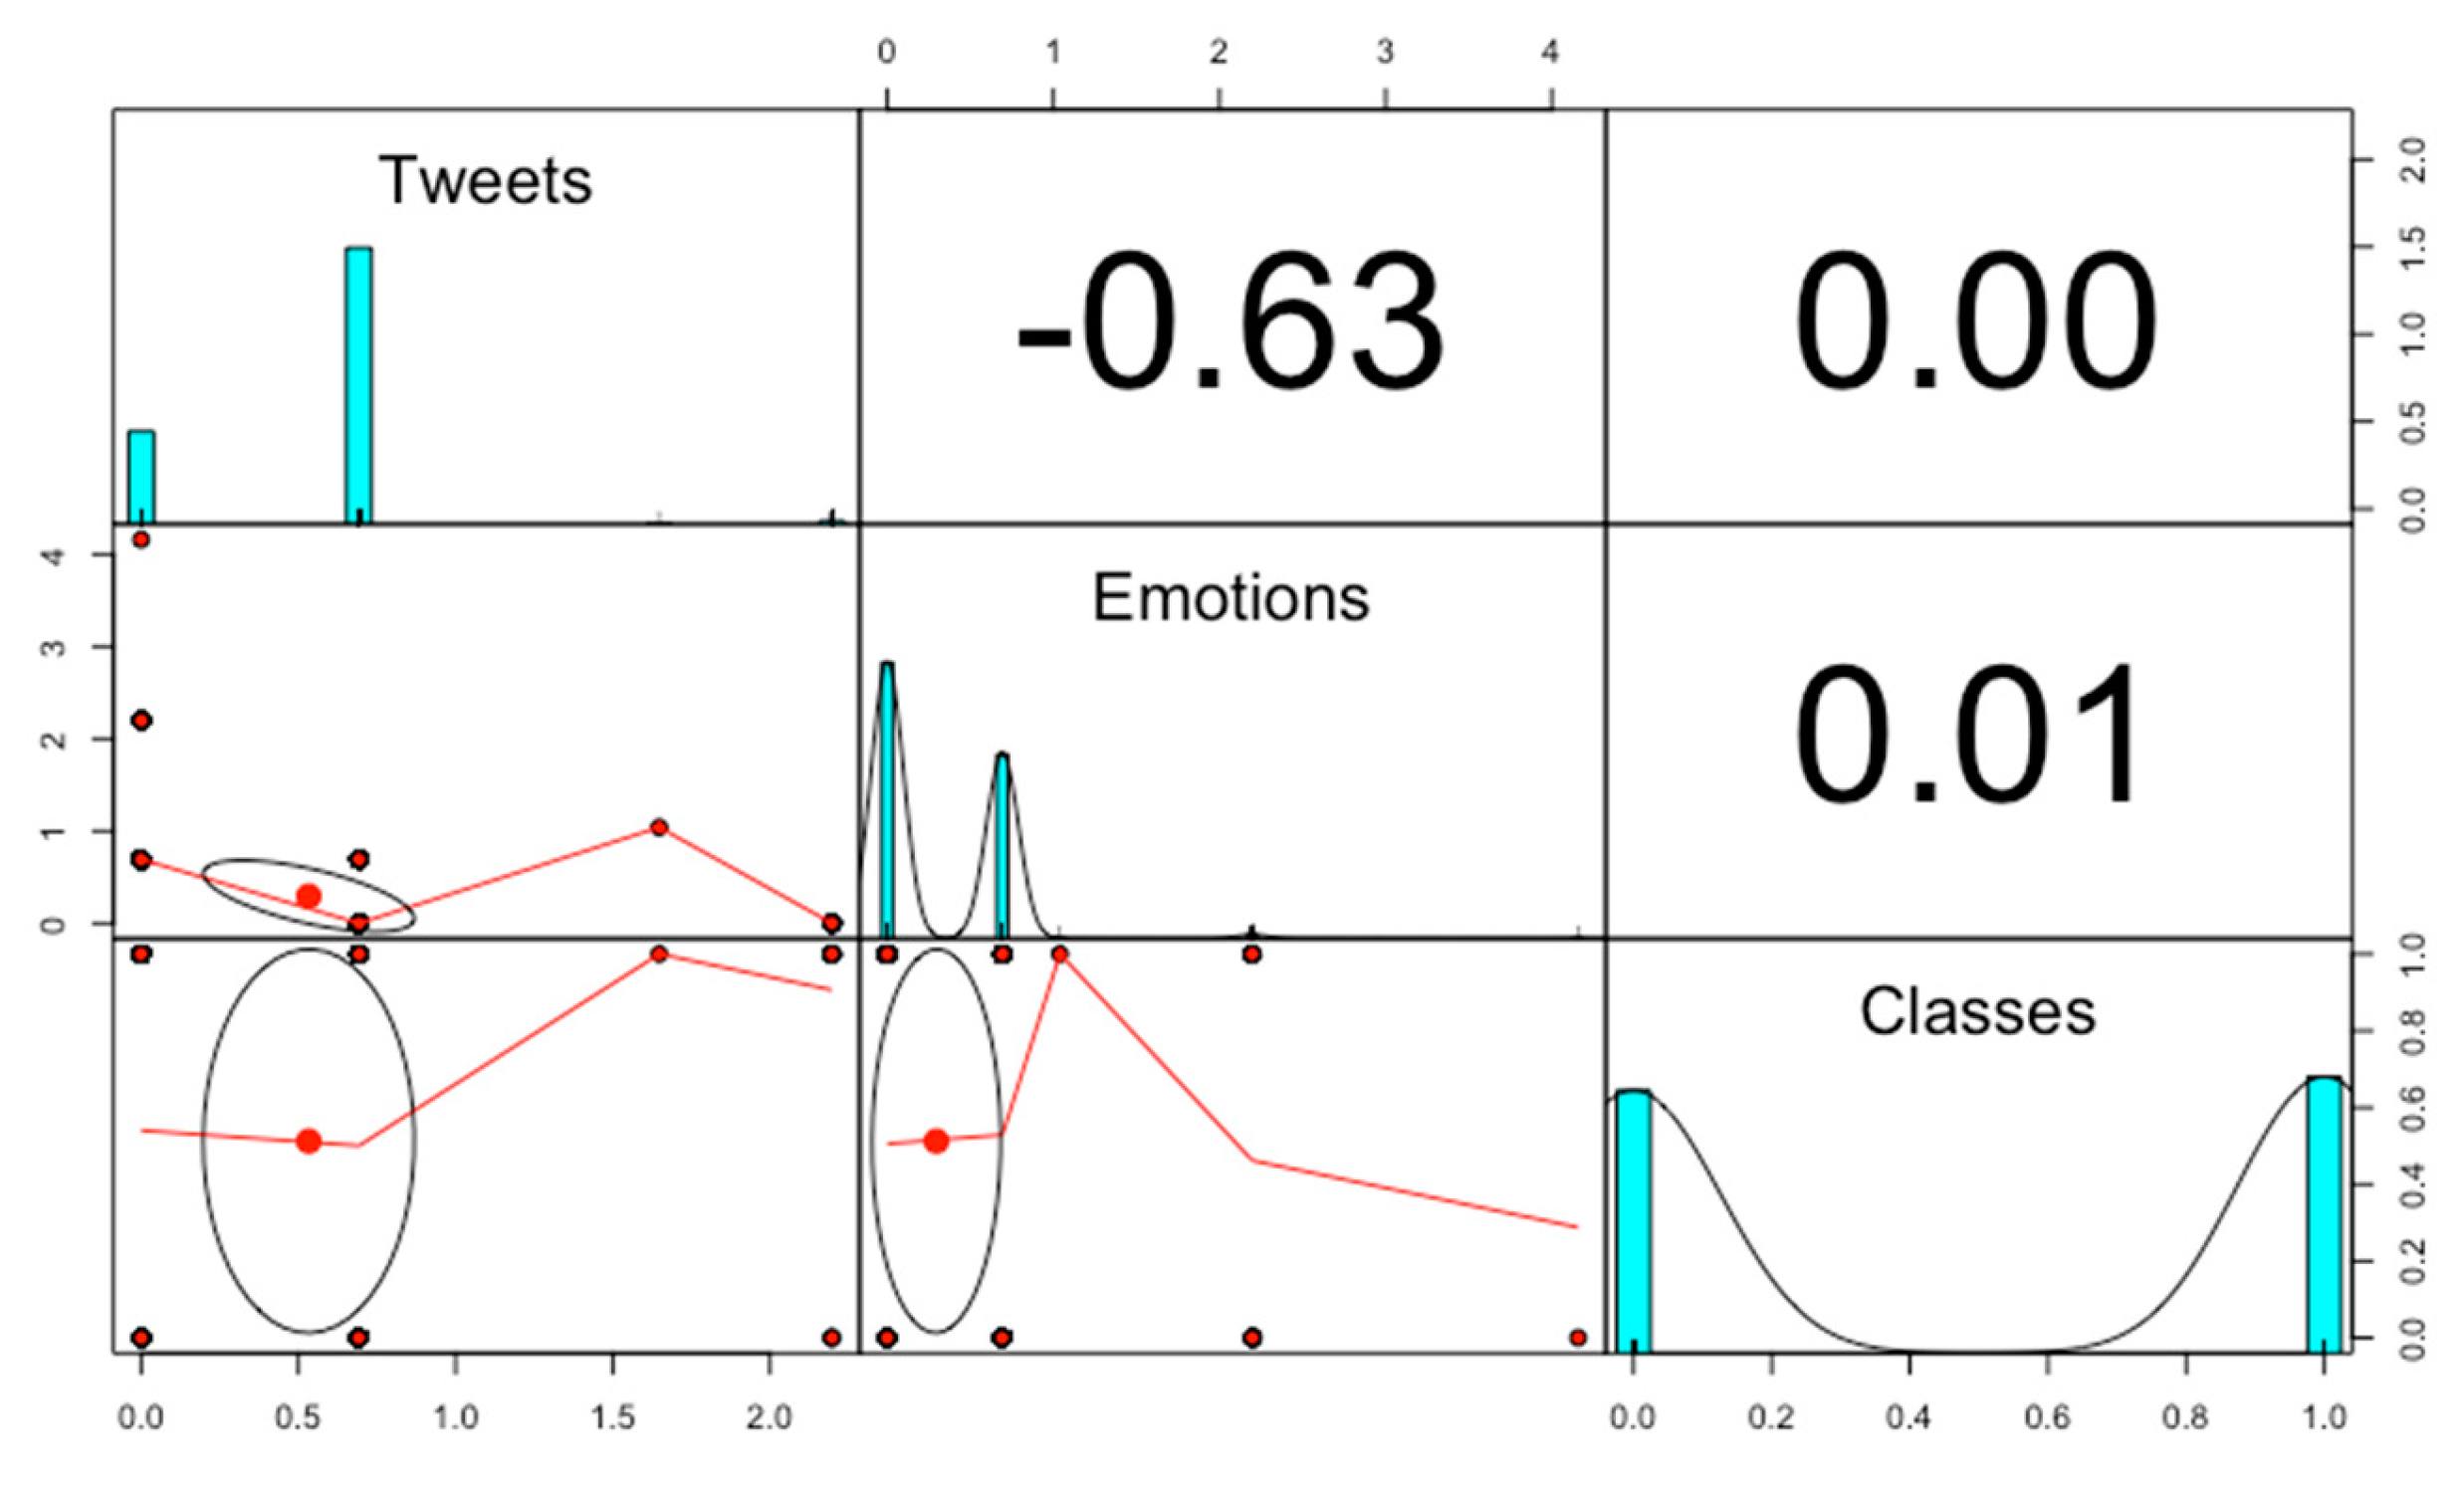
Figure 5.
The balanced weighting features after applying class balancer technique.
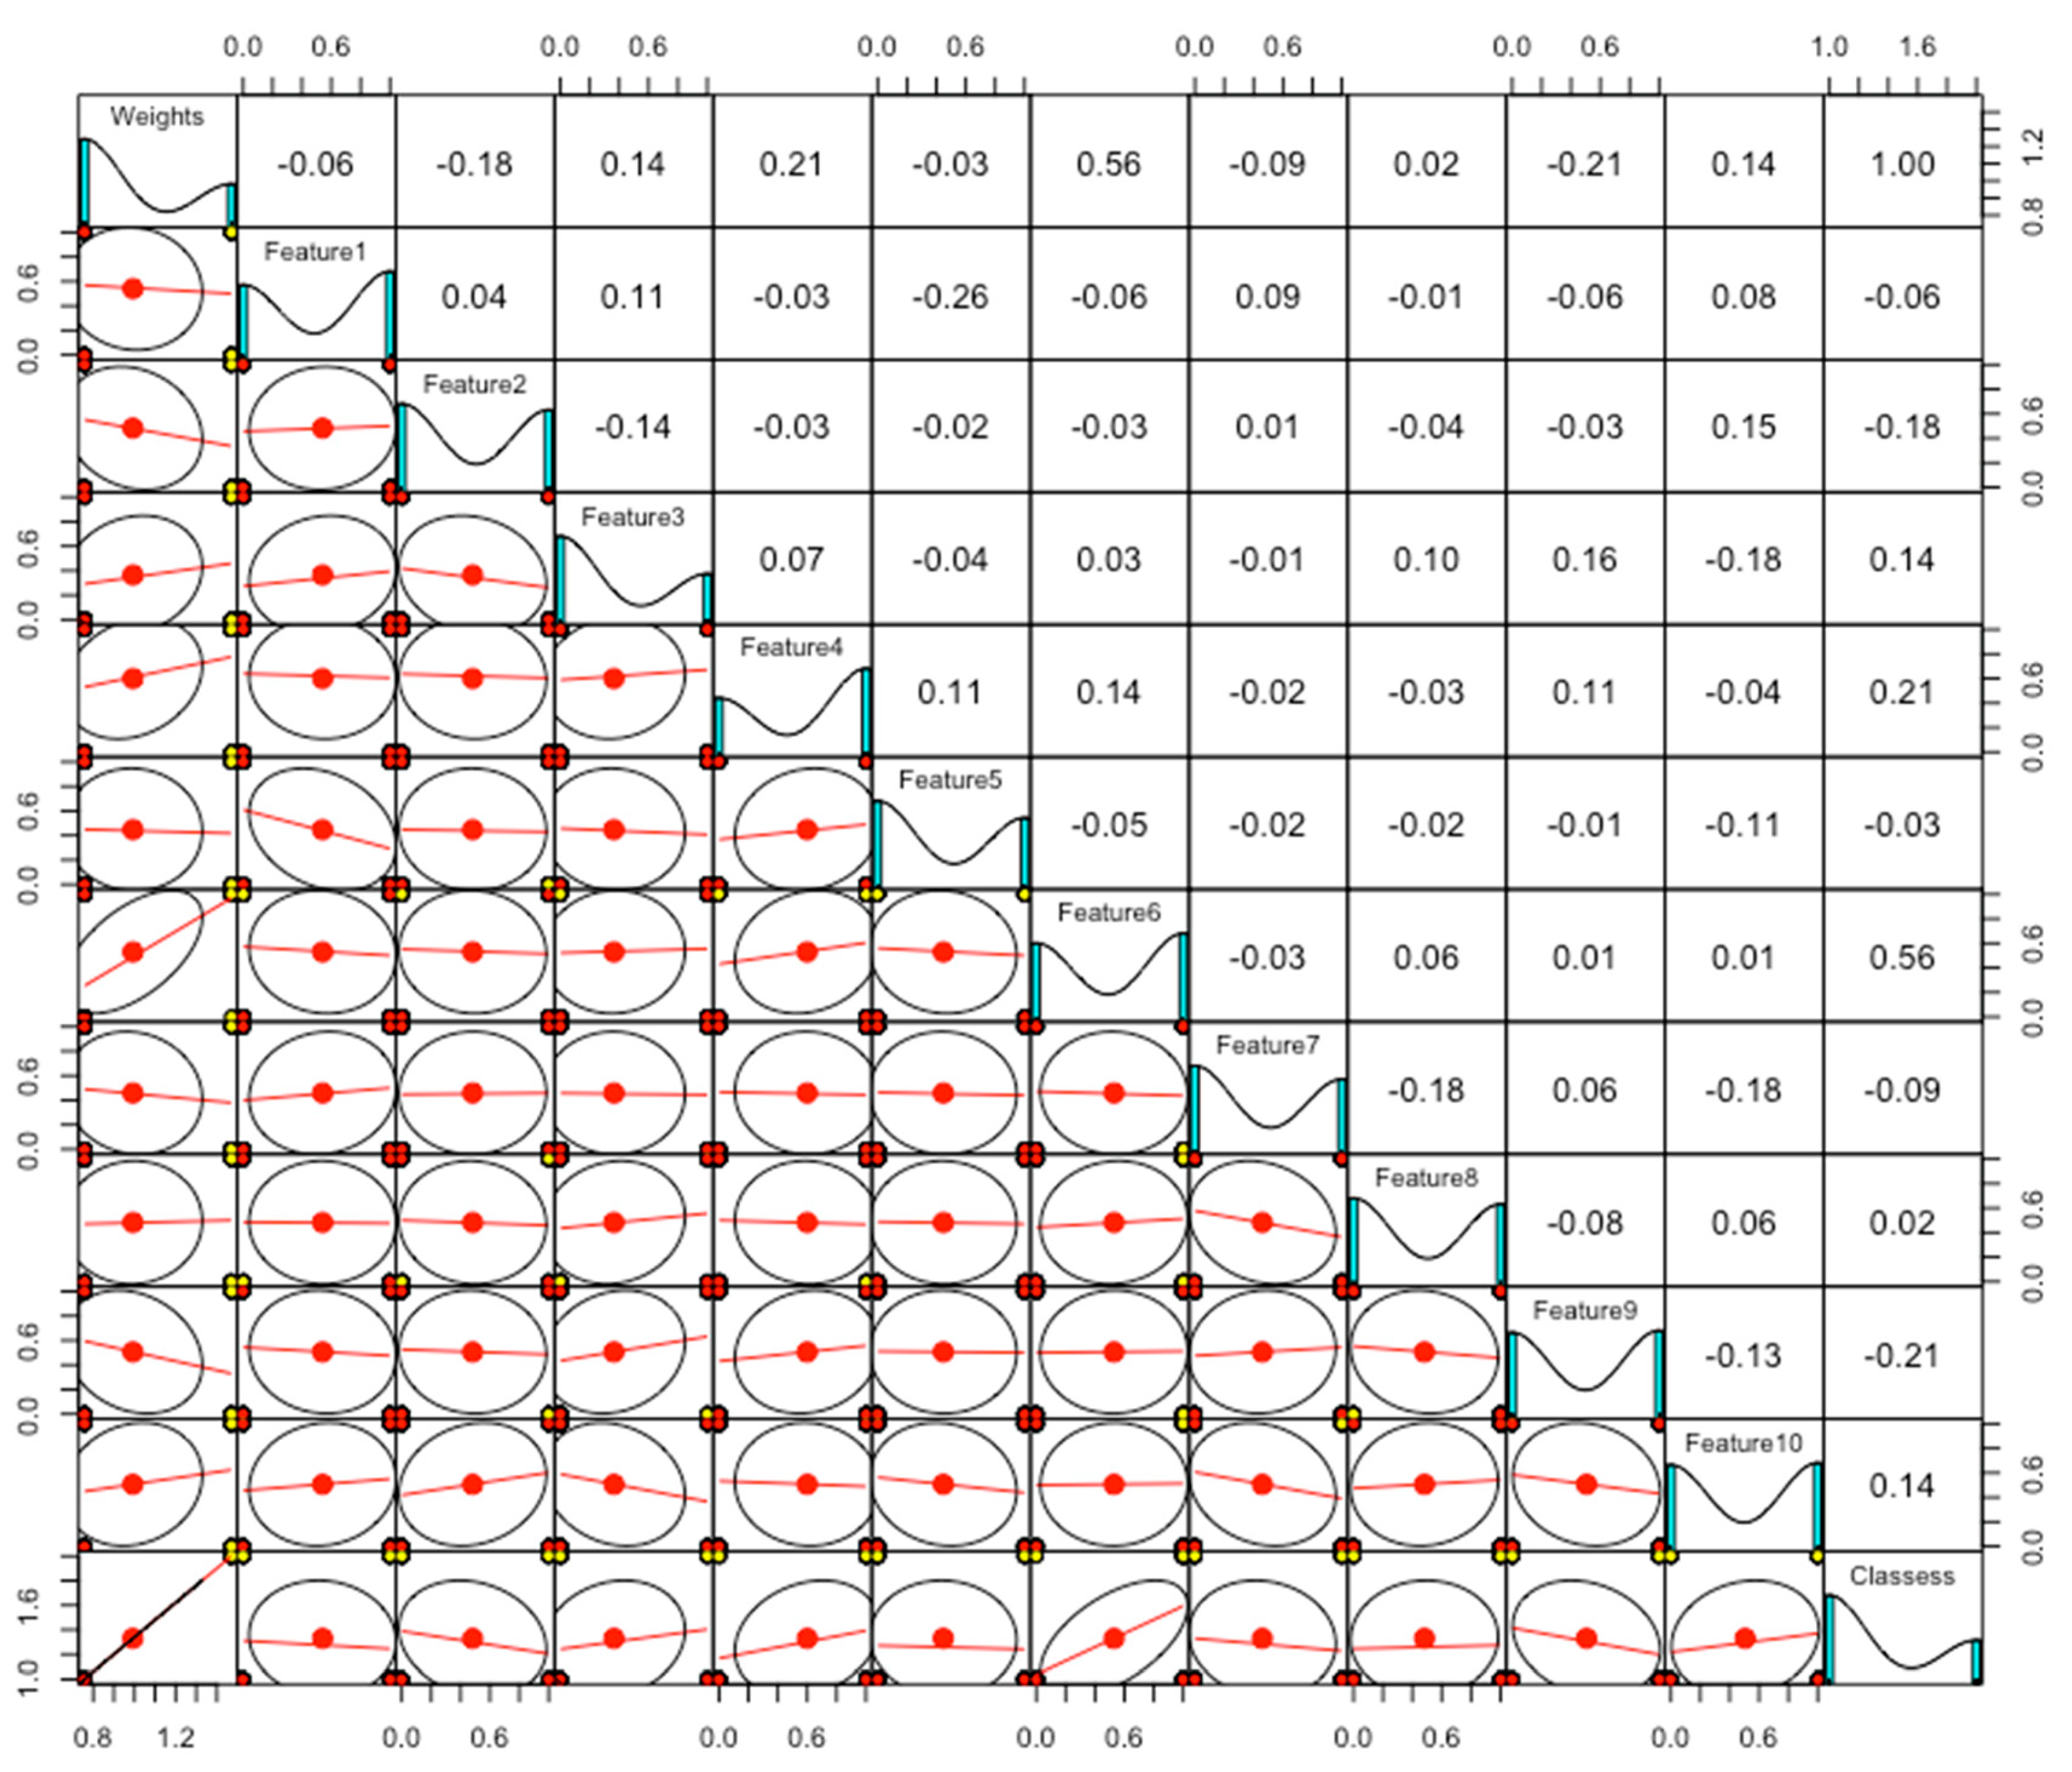
Figure 6.
The Principal Components from balanced features set.
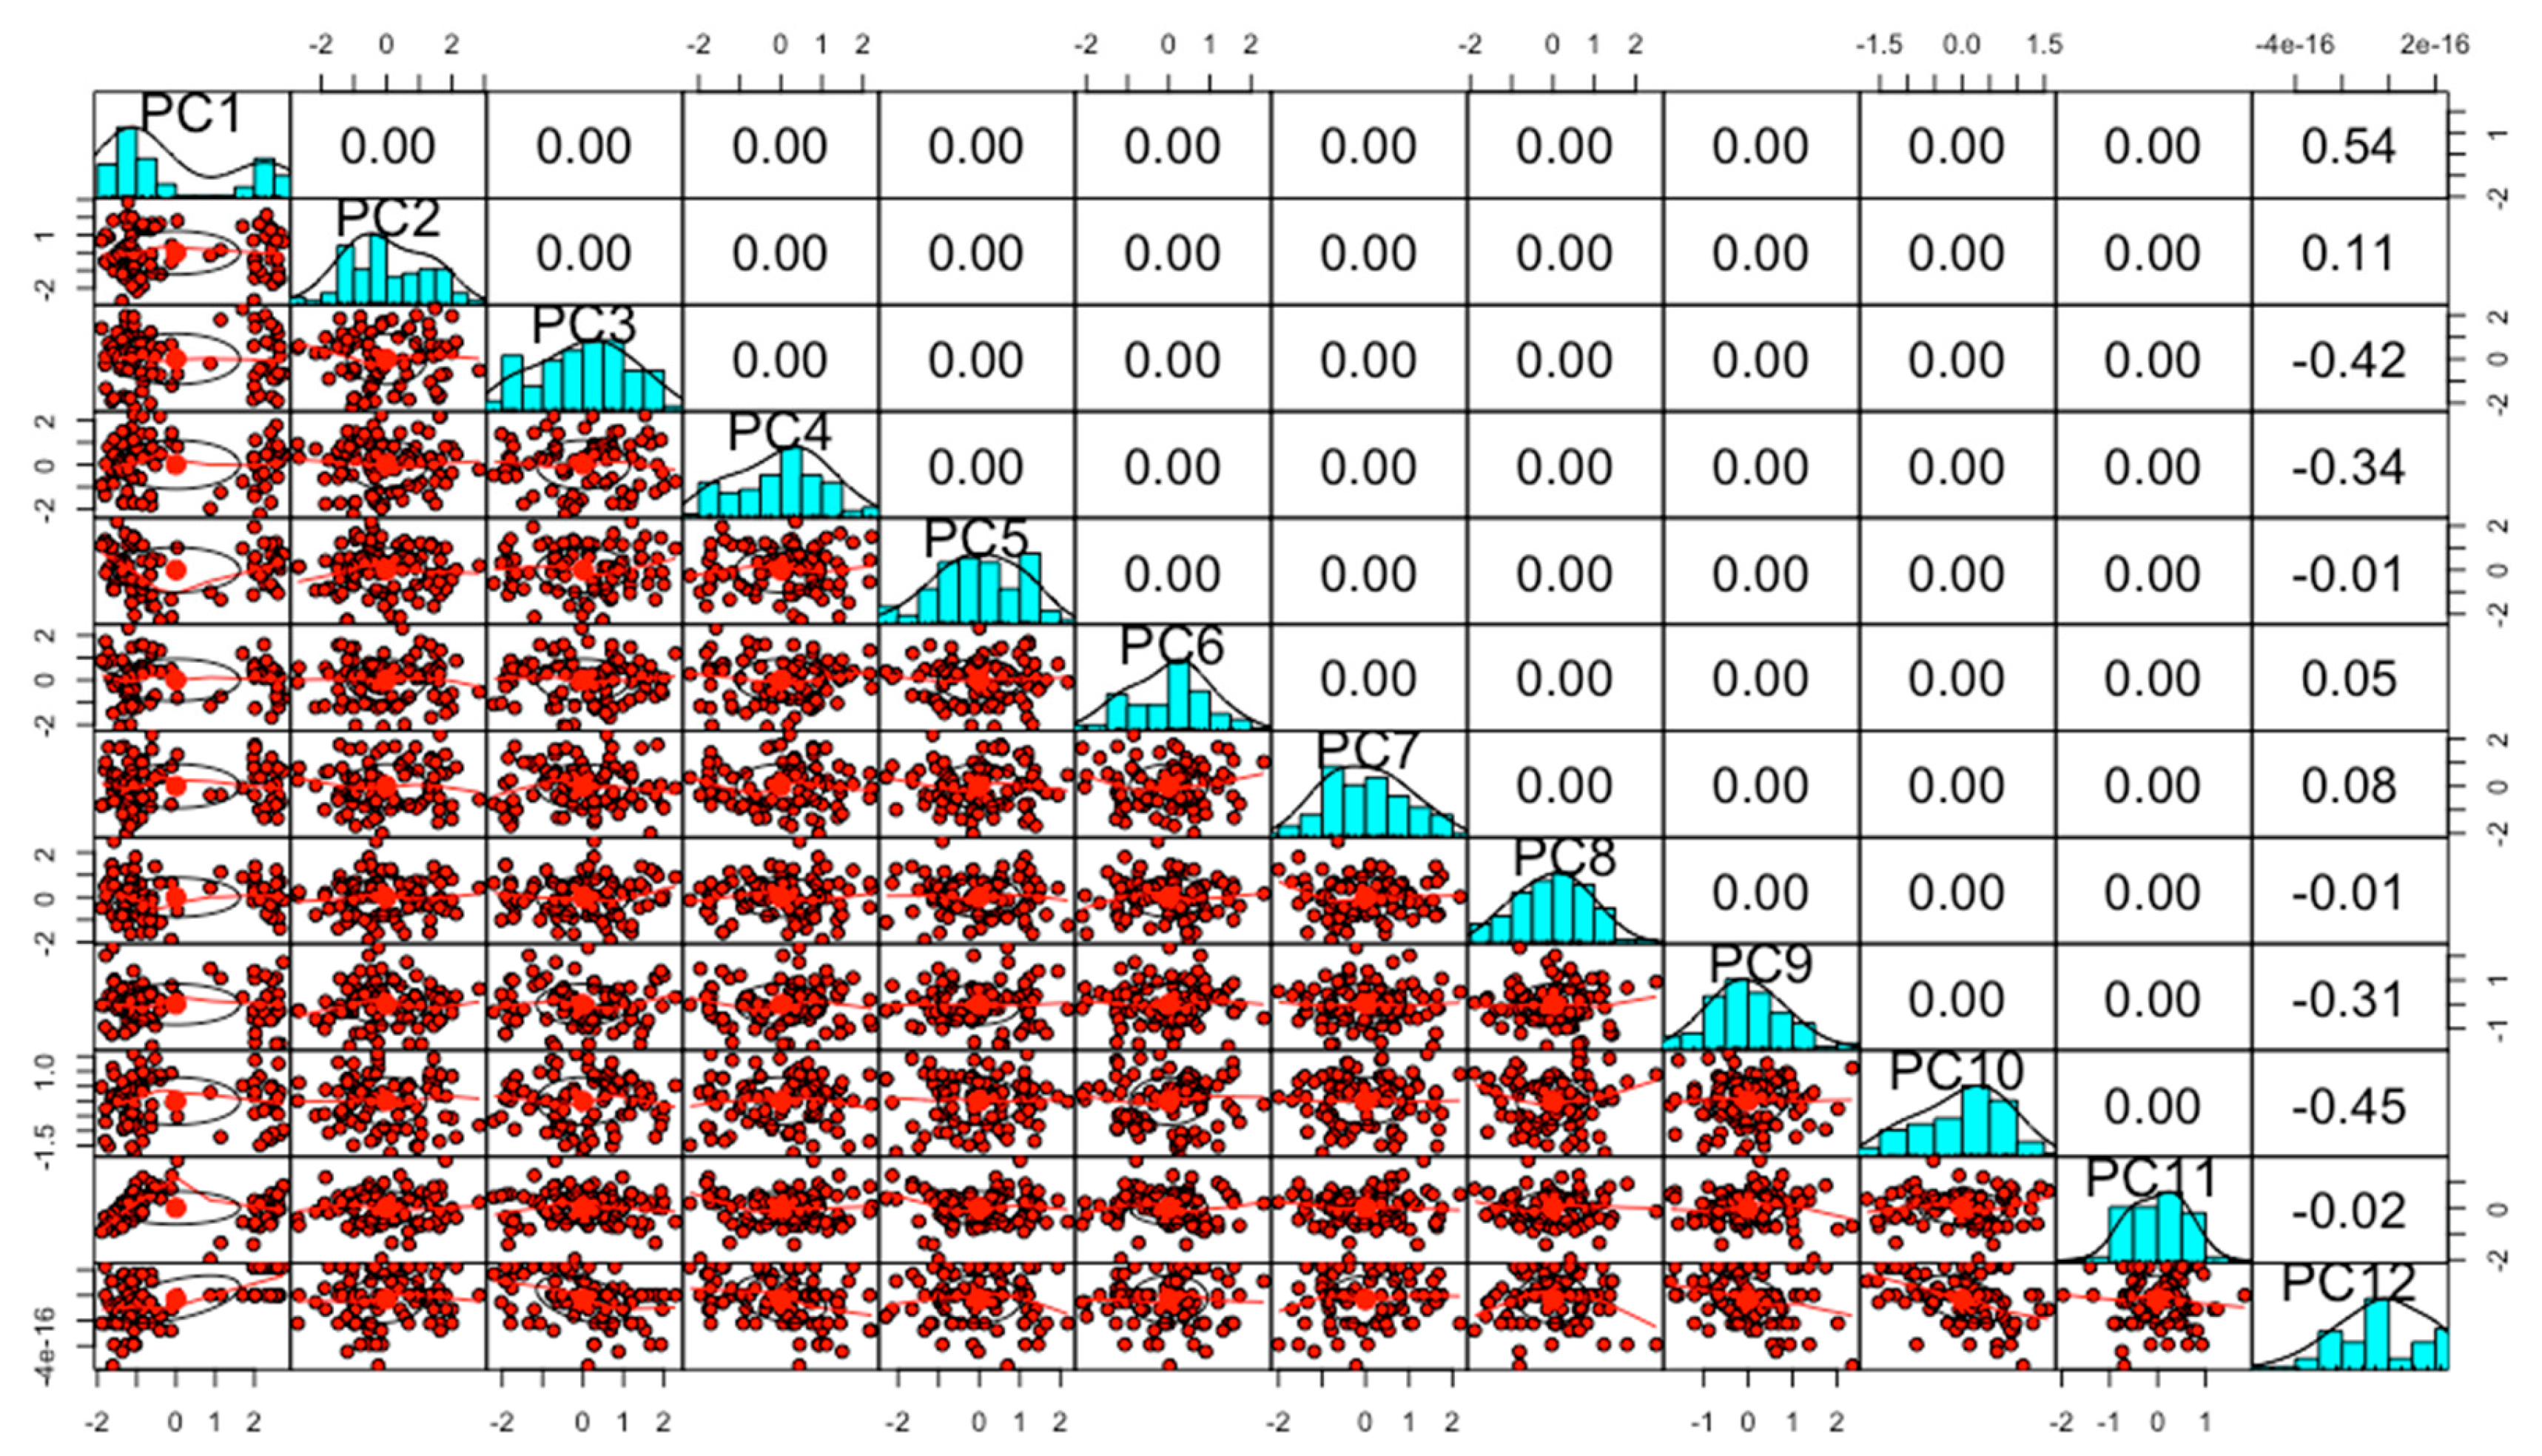
Figure 7.
Dynamic visualization of predicted loss and accuracy with 100 epochs. (a) Accuracy and Loss without Class balancer and Fine-tune. (b) Accuracy and Loss with Class balancer and Fine-tune.
Figure 7.
Dynamic visualization of predicted loss and accuracy with 100 epochs. (a) Accuracy and Loss without Class balancer and Fine-tune. (b) Accuracy and Loss with Class balancer and Fine-tune.
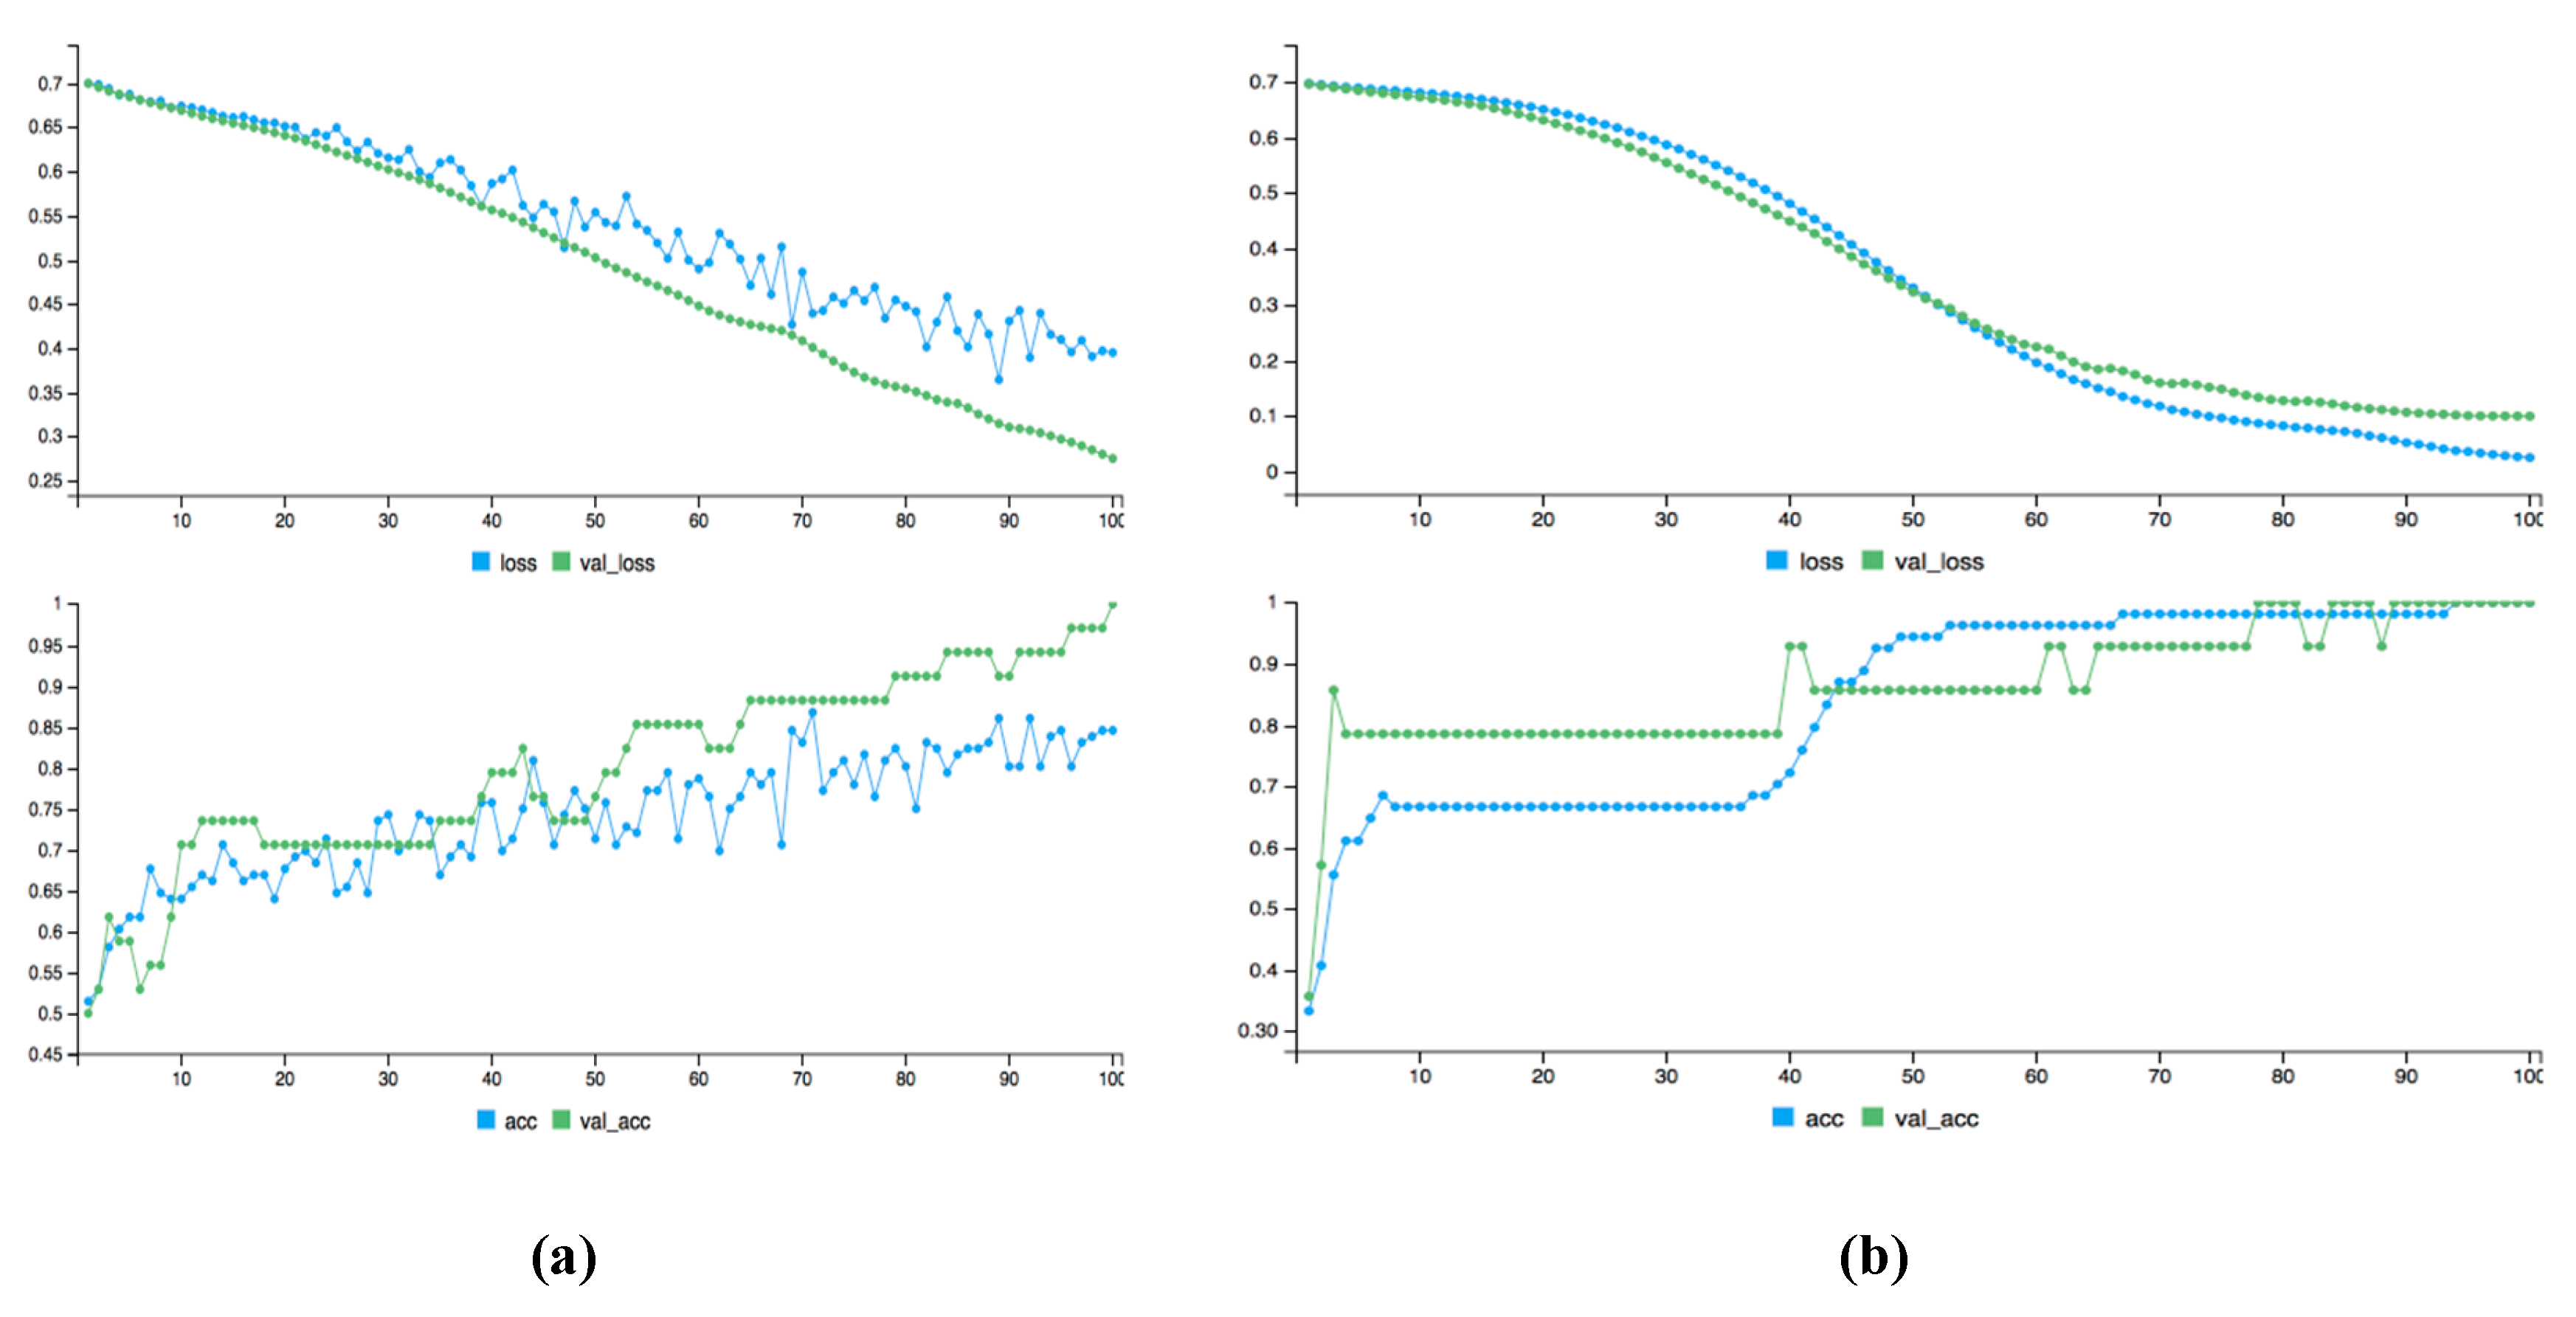
Figure 8.
Confusion matrices with and without Fine-tuned configuration. (a) Confusion Matrix without Class balancer and Fine-tune. (b) Confusion Matrix with Class Balancer and Fine-tune.
Figure 8.
Confusion matrices with and without Fine-tuned configuration. (a) Confusion Matrix without Class balancer and Fine-tune. (b) Confusion Matrix with Class Balancer and Fine-tune.

Table 1.
Principal Components with Standard Deviation, Proportion of Variance, and Cumulative Proportion.
Table 1.
Principal Components with Standard Deviation, Proportion of Variance, and Cumulative Proportion.
| Statistical Measures | PC1 | PC2 | PC3 | PC4 | PC5 | PC6 | PC7 | PC8 | PC9 | PC10 | PC11 | PC12 |
|---|---|---|---|---|---|---|---|---|---|---|---|---|
| Standard Deviation | 1.6253 | 1.2234 | 1.1529 | 1.09513 | 1.02088 | 0.94565 | 0.93161 | 0.88161 | 0.84315 | 0.79726 | 0.63662 | 2.43 × 10⁻¹⁶ |
| Proportion of Variance | 0.2201 | 0.1247 | 0.1108 | 0.09994 | 0.08685 | 0.07452 | 0.07233 | 0.06477 | 0.05924 | 0.05297 | 0.03377 | 0.00 |
| Cumulative Proportion | 0.2201 | 0.3448 | 0.4556 | 0.55555 | 0.6424 | 0.71692 | 0.78925 | 0.85402 | 0.91326 | 0.96623 | 1 | 1.00 |
Table 2.
Parameters training using Dense and Dropout layers based on TensorFlow with Keras.
| Layer | Type | Shape | Parameters |
|---|---|---|---|
| Dense 1 | Dense | 100 | 1200 |
| Dropout 1 | Dropout | 100 | 0 |
| Dense 2 | Dense | 80 | 8080 |
| Dropout 2 | Dropout | 80 | 0 |
| Dense 3 | Dense | 60 | 4860 |
| Dropout 3 | Dropout | 60 | 0 |
| Dense 4 | Dense | 40 | 2440 |
| Dropout 4 | Dropout | 40 | 0 |
| Dense 5 | Dense | 2 | 41 |
| Total Parameters | 16,621 | ||
| Trainable Parameters | 16,621 | ||
| Non-trainable | 0 |
Table 3.
Comparison of the proposed deep learning approach with other methods based on % training ratio.
Table 3.
Comparison of the proposed deep learning approach with other methods based on % training ratio.
| Technique | 90% | 80% | 70% | 60% | 50% | 40% | 30% |
|---|---|---|---|---|---|---|---|
| Support Vector Machine | 70 | 80 | 86.66 | 75 | 70 | 66.66 | 71.42 |
| Multi-Layer Perceptron | 70 | 85 | 80 | 82.54 | 84 | 81.66 | 77.14 |
| Random Forest | 60 | 75 | 76.66 | 80 | 76 | 81.66 | 77.14 |
| Logit Boost | 60 | 70 | 76.66 | 77.52 | 66 | 76.66 | 75.71 |
| Logistic Regression | 60 | 70 | 80 | 75 | 70 | 78.33 | 74.28 |
| K-Nearest Neighbor | 60 | 85 | 80 | 80 | 76 | 80 | 82.85 |
| Proposed Technique | 98.4 | 93.33 | 90.91 | 90.62 | 96.36 | 89.75 | 86.53 |
© 2019 by the authors. Licensee MDPI, Basel, Switzerland. This article is an open access article distributed under the terms and conditions of the Creative Commons Attribution (CC BY) license (http://creativecommons.org/licenses/by/4.0/).
Share and Cite
MDPI and ACS Style
Jamal, N.; Xianqiao, C.; Aldabbas, H. Deep Learning-Based Sentimental Analysis for Large-Scale Imbalanced Twitter Data. Future Internet 2019, 11, 190. https://doi.org/10.3390/fi11090190
AMA Style
Jamal N, Xianqiao C, Aldabbas H. Deep Learning-Based Sentimental Analysis for Large-Scale Imbalanced Twitter Data. Future Internet. 2019; 11(9):190. https://doi.org/10.3390/fi11090190
Chicago/Turabian StyleJamal, Nasir, Chen Xianqiao, and Hamza Aldabbas. 2019. "Deep Learning-Based Sentimental Analysis for Large-Scale Imbalanced Twitter Data" Future Internet 11, no. 9: 190. https://doi.org/10.3390/fi11090190
Note that from the first issue of 2016, this journal uses article numbers instead of page numbers. See further details here.