An Investigation into Healthcare-Data Patterns
by
 , and
, and
Aaron Boddy
*, 
William Hurst
*,
Michael Mackay
,
Abdennour El Rhalibi
,
Thar Baker
and
Casimiro A. Curbelo Montañez
Faculty of Engineering and Technology, Liverpool John Moores University, Liverpool L3 3AF, UK
*
Authors to whom correspondence should be addressed.
Future Internet 2019, 11(2), 30; https://doi.org/10.3390/fi11020030
Submission received: 4 December 2018
/
Revised: 16 January 2019
/
Accepted: 20 January 2019
/
Published: 30 January 2019
(This article belongs to the Special Issue Smart Systems for Healthcare)
Abstract
:Visualising complex data facilitates a more comprehensive stage for conveying knowledge. Within the medical data domain, there is an increasing requirement for valuable and accurate information. Patients need to be confident that their data is being stored safely and securely. As such, it is now becoming necessary to visualise data patterns and trends in real-time to identify erratic and anomalous network access behaviours. In this paper, an investigation into modelling data flow within healthcare infrastructures is presented; where a dataset from a Liverpool-based (UK) hospital is employed for the case study. Specifically, a visualisation of transmission control protocol (TCP) socket connections is put forward, as an investigation into the data complexity and user interaction events within healthcare networks. In addition, a filtering algorithm is proposed for noise reduction in the TCP dataset. Positive results from using this algorithm are apparent on visual inspection, where noise is reduced by up to 89.84%.
1. Introduction
Hospital infrastructures are classified as mission-critical infrastructures [1]. These information infrastructures have become increasingly dependent on information and communication technologies (ICT) to facilitate communication and automate services [2]. Therefore hospitals are predominantly information technology (IT) infrastructures, with an increasing reliance on electronic patient record (EPR) data [3]. Damage to network communications and losing patient data would have a detrimental impact on the healthcare services they provide. However, as with any other network, they are now more vulnerable to cyber-attackers.
1.1. Motivating Scenario
Hospital networks are frequently upgraded with new digital technologies, rather than being replaced, due to the cost involved with new developments. The security implications mean that unique custom-written systems, also known as bespoke systems, need to be put in place to safeguard and protect data. However, the reliance on legacy software, and small scale bespoke security solutions, result is an increased vulnerability to cyber-attacks from external sources [4]. For example, London hospitals lost all network connectivity due to several malware infection by the MyTob worm that occurred at the end of 2008 [5]. In 2005, a Chicago hospital lost its entire pharmacy database, and in order to reconstruct medication records for its patients, paper printouts were required to be collected from nurses’ stations [6]. And in October 2016 a UK Hospital in Lincolnshire was shut down for four days by a variant of the Globe2 ransomware [7], with all planned operations, outpatient appointments and diagnostic procedures cancelled, with patients turned away and 2800 patient appointments cancelled because of the disruption.
This risk is further exacerbated by the bring-your-own-devices (BYOD) revolution. This is a term referring to the technologies enabling employees to access and utilise internal corporate IT resources, with their personal devices [8]. BYOD policies have numerous benefits including reduced costs and improved productivity, convenience and efficiency of work, as such a significant amount of users require access to patient records to facilitate their occupation. Healthcare infrastructures may also involve temporary employees or visitors from partner organisations. The BYOD approach also means that users from visiting healthcare organisations have access to hospital networks and the Internet. However, this also carries numerous risks including data loss/leakage or theft, application security, network availability, legal liability and regulatory compliance and loss of brand identity, posing various challenges for IT departments who support and secure [8]. BYOD is a large contributor to the era of ubiquitous computing, also known as pervasive computing, where various technologies interact with one another, with potentially sensitive data being transmitted over less secure means of communication, such as wirelessly [9]. With an increased use of technology there is a corresponding risk of increased exposure to cyber security threats. These wireless vulnerabilities pose a particular risk to the healthcare network, in that potentially insecure devices are granted access to hospital infrastructure and confidential data. An attacker can use this to their advantage by hacking a BYOD to gain back-door access onto a hospital network.
1.2. Problem Statement and Contributions
This paper presents an investigation in to health care data patterns using a real-world hospital dataset. The data is comprised of transmission control protocol (TCP) socket connections to three different servers offering an electronic prescribing medicines administration (EPMA) system, a patient administration system (PAS) an active directory domain controller (DC). Data is collected from a Liverpool-based hospital, in the UK. The exact hospital is not specified to comply with data protection rules at the request of the partner hospital and due to the sensitive nature of the information. The dataset is analysed and low-risk data points present are removed using our proposed algorithm. The investigation then provides a recommendation for a visualisation approach to analyse cyber-transactions and traffic, which assists information security officers within healthcare organisations to improve the situational awareness of cyber security risks. The algorithm is evaluated using three visualisation techniques, (1) force-directed visualisation algorithms, (2) logarithmic heatmaps and (3) nonparametric statistical graphics. To the best of our knowledge this is the first time this approach has been applied to this hospital network dataset. The proposed algorithm demonstrates a novel technique that is able to remove noise by up to 89.84%. Through removing noise, situational awareness of the network is improved. Therefore, analyst attention can be focus on the most pertinent events for investigation. By presenting network data, in such a way as to highlight anomalies and identify relationships between data points, this work can be built upon. The ambition of this work is that other researchers are able to build on these techniques to advance anomaly detection within healthcare infrastructures.
1.3. Structure
The remainder of this paper is organised as follows. Section 2 reviews the literature and background research on industrial networks, healthcare security and visualisation techniques. Section 3 outlines our investigation methodology for analysing data within healthcare infrastructures, processing it to eliminate low-risk data points and visualising it in such a way that data anomalies become apparent. Section 4 presents our visualisation case study and a sample of the test data. Section 5 provide a discussion and evaluates the results of our investigation. Section 6 discusses conclusions of the presented work and paves the way for future research work.
2. Background Research
There is a tendency for organisational complacency towards the risks of cyber security [10]. Issues of reduced information visibility due to data complexity, fragmentation, interoperability and lack of specialisation, all undermine the security of these organisations [10]. Yet, visualisation techniques provide both awareness and modelling capabilities for the benefit of computing in critical infrastructures [11]. Organisations need to bridge the gap between cyber operations, resilience and the priorities of the business. Besides, information security officers and IT managers need to synthesise highly disparate data into a coherent and concise narrative [10].
The goal of security engineers is to develop tools capable of detecting malicious, multi-stage intrusion attacks, weighting the individual attacks, and comparing them against the enormous and disparate database of attacks within the network [12]. This is a ‘plain recognition’ problem and an intruder’s objectives should be determined based on the analysis of the entire dataset of attacks as a whole, rather than just an individual attack [13]. As such, in this section, a background discussion is put forward on the layout of medical infrastructures and the existing healthcare network security challenges. This background aids with the development of an approach to understanding the overall network behaviour.
2.1. Structure
Healthcare organisations have sensitive data spread across several devices. Mobile devices, such as laptops or tablets, are all used for inputting medical data. Specialised devices, such as Draeger patient monitoring systems, require network connectivity. In result, healthcare network security challenges can be summarised into four categories: system structure, mobile device, medical equipment and user-based challenges. “System structure” refers to the vulnerabilities in the physical system layout; mobile device challenges relate to issues surrounding on-demand network access; medical equipment challenges concern low security in medical and biomedical devices. Finally, user-based challenges refer to the general staff-awareness of existing cyber-threats or good cyber-security practices. For example, a hospital staff member may unsuspectingly click on a link in an email, which contains a Trojan virus and creates a back door into the hospital network.
Healthcare organisations differ from other enterprise networks through their use of medical cyber-physical systems (MCPSs). MCPSs are inexpensive personal monitoring devices that can record and transmit multiple physiological signals [14]. Encryption of this data is required for secure storage, secure transmission, and secure computation. MCPSs are comprised of four layers, which need to be considered and secured. (1) The data acquisition layer has a body area network (BAN), which are wearable sensors which facilitate the collection of patient medical information. (2) The data concentration/aggregation layer, consisting of transmitting the gathered information to a gateway server through short range wireless, such as Bluetooth, due to the low computational power of sensors with a BAN. (3) The cloud processing and storage layer consist of the long-term secure storage, processing and analytics of medical information. (4) The action layer involves either active of passive use of the data. Active usage employs an actuator using the data and the algorithms used to perform data analytics to be directly influenced by the data, such as through the use of a robotic arm in robot-assisted surgery. Passive action visualises the data to provide decision support to medical professionals [14].
Figure 1 presents a 3-layer network topology overview of how the Liverpool-based hospital network is configured. The diagram demonstrates the principle of how the network is configured; as in reality it is replicated several times over and therefore too substantial to fit on a single diagram. The diagram shows the network layers involved between the server layer and the access layer, and demonstrates that they are duplicated throughout in order to provide network resilience. The servers connect to the server switch, providing the server access layer of the network topology (aka the application layer). This then connects to the distribution layer, also known the transport layer. The transport layer connects to the core layer or the Internet layer, providing access to routing, wireless and the firewall. This then again connects to another distribution/transport layer, which finally connects to the network access layer where networked devices connect to the network.
Figure 2 presents an overview of the Liverpool-based network infrastructure for enabling remote access within the hospital. The layout enables staff the ability to work together and provide on-call services remotely. The blueprint demonstrates the locations of the LANs and VLANs within a typical hospital network. In addition, the firewall placements, in relation to the Internet, are depicted. Figure 2 also displays the relationship between a hospital’s typical ‘community of interest network’ (CoIN)/WAN and the N3 (a WAN used to connect many sites across the UK National Health Service).
The system layout leaves a vulnerability to attackers being able to eavesdrop on traffic between the network controller and the supervisor in particular. From there, messages can be injected, replay attacks can be performed, such as maliciously replaying or delaying a valid data transmission, and spoof messages can be generated [12]. In doing so, it is possible to compromise the integrity of the device operation [15]. If successful, patient privacy would be invaded and legitimate data supressed. This compromises patient privacy whilst attempting not to interfere with medical device operation.
2.2. Security Challenges
Security threats within healthcare have farther reaching implications for healthcare than other industries [16]. Due to the increased adoption of trends such as the use of mobile, social and cloud, the ease for hackers to infiltrate the healthcare infrastructure massively increases [16]. The boundaries for healthcare systems are evolving, with many patients having the option of accessing their healthcare data from home PCs and mobile devices which increase the attack surface significantly. Medical data must be private, with data misuse and violation detected in order for to release and share data to authorised parties and public institutions [17].
Medical devices are used for innovative solutions to find a cure, enabling quality of life and improving efficiency in patient care [16]. However, these devices, in particular sensors within the body, have limited resources and therefore inadequate capabilities to self-protect. Traditional approaches to endpoint security are no longer viable in the modern threat landscape [16]. Attack models have changed, from attacks on single PCs, to large-scale attacks on entities through advanced persistent threats. Such attacks involve zero data exploits; spear phishing, watering hole models and encrypted side channel methods to infect systems. In addition to attacking systems, modern malware have adopted and evolved evasion techniques, such as malware packing, obfuscation and polymorphism [16]. Modern malware models in healthcare scenarios become particularly malicious [16]. Techniques, such as ransomware, which restricts access to computer systems and demands a ransom for the restriction to be removed, can be life threatening in healthcare scenarios.
Scanning attacks involve adversaries perusing devices within the network to gather meaningful information to launch a sophisticated attack upon an infrastructure [18]. These scans commonly include, IP address scanning, port scanning and version scanning. Health Level 7 (HL7) is an interoperable standard which allows disparate healthcare application store exchange, integrate, share and retrieve clinical and administrative data [18]. With regard to healthcare infrastructures, an adversary can carry out segment scanning on HL7 information to learn personal identifiers, order numbers or patient visit information [18]. Spoofing attacks involve malicious users masquerading as legitimate [18]. Masquerading is a passive spoofing attack where attackers exhilarate legitimate account credentials and then log in. Impersonation is an active spoofing attack, sometimes known as a replay attack, wherein attackers capture authentication traffic and replay the traffic to gain access to the healthcare infrastructure.
Injection attacks involve exploiting vulnerabilities of structured query language (SQL), JavaScript and other computer programs to successfully insert untrusted data [18]. In doing so, attackers may gain access to healthcare databases, attack web users and to propagate viruses. Additionally, they may inject malicious segments commands or responses to reduce the security of healthcare infrastructures. Broken authentication and session management involve attackers exploiting vulnerabilities in authentication mechanisms to assume the identities of legitimate users [18]. A brute force attack is an example that takes advantage of weak passwords and small encryption keys, ultimately allowing a malicious user to perform all the functions available to a legitimate user. Denial of service attacks (DoS) involve exhausting system and network resources to make them unavailable [18]. For example, a flooding-based DoS sends a large number of packets to a web server, in doing so, legitimate requests are blocked as the CPU is overwhelmed.
Cyber-threat monitoring systems employ intrusion detection systems (IDSs) as network sensors [19]. IDSs statistically analyse the time of the attack, the source of the attack, the destination of the attack, and can visualise the result. Visualisations are used in order to leverage the perceptual abilities of the user, in order to find features in network structures and data. To process datasets, visualisation algorithms are employed to understand stand-out behaviours.
Security is crucial to the long-term viability of networked medical devices [15]. These medical devices have the potential to be tampered with, reprogrammed by unauthorised users or subject to device-specific hazards. Devices can be targeted through their firmware upgrades or through connections to the network interface when connected through remote attacks in addition to local attacks. For example, telemetry data of an implantable cardiac defibrillator can be read and reprogrammed remotely [15]. There are obvious physical hazards and privacy implications for these attacks. Security concerns for implanted medical devices (IMDs) are particularly challenging due to the potential for patient injury or death due to adversarial tampering [20]. Additionally, high-profile medical device malfunctioning could cause loss of life due to network compromise or medical device tampering. To detect abnormal data behaviours, visualisation techniques can be used to provide both awareness and modelling capabilities for the benefit of computing in critical infrastructures [11]. Data analytics enables meaningful inferences to be extracted from raw data, and facilitates cost savings and faster decision support [21]. Visualisation techniques allow an analyst to visualise abnormalities in a dataset due to the shape or colour of data patterns, and to do so quickly and efficiently [22].
The challenges facing healthcare security are as follows, a lack of labelled data from previous attacks; constantly evolving attacks and analyst’s limited investigative time and budget [23]. Current solutions employ either analyst driven solutions, or unsupervised machine learning solutions. Both of these solutions are not sufficient on their own. Analyst driven solutions often lead to a high number of false negatives, due to their reliance on human judgement, besides delays between attack detection and the implementation of countermeasures [23]. Similarly, unsupervised machine learning solutions are insufficient due to their high number of false positive alarms, which lead to alarm fatigue and distrust by analysts [23].
The data used in this paper is real-world network data from a Liverpool-based hospital network employing over 4000 staff. The data collected is a snapshot of the network infrastructure using the network statistics (netstat) command-line in order to capture incoming and outgoing transmission control protocol (TCP) data. TCP data was captured as it allows for two hosts to establish a connection and exchange data streams. This TCP data was captured using the netstat command with the command line utility. This was done for ease of use and data simplicity to demonstrate the proof-of-concept. In future work, the intention is to use information rich data packets, captured using a packet sniffing network monitoring tool. As the investigation shows, the volume and type of data within healthcare infrastructures presents a significant challenge for security analytics.
AI2 is a cyber-security machine learning system, which improves its accuracy over time through feedback from security analysts [23]. AI2 consists of the following four components. Firstly, a big data processing system, which quantifies the behaviours and features of raw data [23]. Secondly, an outlier detection system, which learns a descriptive model of data features extracted via unsupervised learning, using either density, matrix decomposition or replicator neural networks [23]. Thirdly, a feedback mechanism and continuous learning, which incorporate analyst input through a user interface [23]. The system highlights the top k outlier events or entities and tasks the analyst with identifying whether they are malicious; the feedback is then input back into the supervised learning module. Fourthly, a supervised learning model, which predicts whether a new incoming event is normal or malicious, and uses analysts feedback to refine the model [23]. Raw data is input into AI2 which computes features describing the entities of the data set. Using these features, an unsupervised machine learning module identifies extreme and rare events in the data. These events are then ranked based upon a pre-defined metric and presented to the analyst, who ranks the behaviours as normal or malicious (and as pertaining to a particular attack type). Finally, these labels are input to the supervised learning module [23].
2.3. Data
In this section, a sample of TPC socket connection data from a real-world hospital is presented. A sample of netstat snapshot data conducted on three servers, the Active Directory Domain Controller, the Electronic Prescribing System and the Patient Administration System is presented. Additionally, for each dataset, the most recurring items for both local and foreign addresses are shown. The hospital has currently 274 servers, a combination of both physical and virtual servers, providing specialist applications and functions across the hospital network. The three servers used for the purpose of this proof-of-concept paper are chosen from two reasons; (1) they are the most active servers on the network, and (2) their potential value to a malicious attacker. For example, if the attacker is able to infiltrate the active directory domain controller, then they have access to an authentication certificate and access to the wider hospital network. By accessing the electronic prescribing system, the attacker has access large quantities of pharmaceutical drugs. Additionally, by accessing the patient administration system, intrinsically valuable and confidential medical data would be reachable. If an attacker were to, instead, attempt to shut down any of these servers through a DDoS attack, it could limit the ability of legitimate medical professionals to provide appropriate patient care and could potentially lead to patient harm.
The data used for this research is a single snapshot of the domain controller server and comprises of 590 established connections of 5688 total ports. The data is gathered using the netstat command and is further discussed in Section 5.1. In Table 1, a sample of analysed netstat data is shown displaying (i) the connection type, (ii) the IP source connecting to the DC, (iii) the target of the IP address (the DC server), and (iv) the state of the connection. All data presented is anonymised. The data is a single snapshot of the domain controller server and comprises of 590 established connections of 5688 total ports.
In Table 1 a sample of the netstat data is shown, displaying the connection type, the IP source connecting to the EP, the target of the IP address (the EP server) and the state of the connection. The data is a single snapshot of the domain controller server and comprises 18 established connections of 88 total ports.
3. Investigation Methodology
As the background demonstrates, there is a clear need to address the lack of situational awareness by cyber security professionals within healthcare infrastructures. Therefore, in this section, several approaches are put forward for visualising data within healthcare infrastructures, in such a way that data anomalies become apparent. Visualising data highlights potentially malicious activity in a broad overview of the current network. From here, the analyst can explore the visualisation and the highlighted data points. Interaction with the visualisation allows in-depth exploration of the data, providing detailed technical information regarding the data points and providing insight as to why the data were ranked as potentially malicious by the advanced data analytics. Subsequently, the analyst can analyse and label the remaining data points as either normal or as pertaining to a particular attack signature, and in doing so provide a feedback loop, using advanced data analytics to improve continuously the data analysis and visualisation. As such, three visualisation techniques are investigated in this paper. The algorithms selected are considered standards for network visualisation, data exploration and map making [24]. Additionally there is a focus on live spatialisation, enabling the user to observe and understand network effects through interaction in real-time.
3.1. Force Directed Visualisation Algorithm
Force directed visualisation algorithms are regularly employed in a network visualisation setting. As such, the following visualisation algorithms are employed in this paper; ForceAtlas2 [24], Yifan Fu [25] and Fruchterman-Reingold [26]. Both are force directed placement algorithms allowing the display complex graph structures, by sorting and placing nodes into structured topologies satisfying several visual requirements such as even distribution, symmetry, non-overlapping edges and minimising distance between close nodes. ForceAtlas2, for example, is a force directed layout algorithm, simulating a physical system in order to specialise a network [24]. Nodes repulse one another and edges attract nodes, which ultimately creates a balanced state and allows for a visual representation of data structure. This enables data communities with denser relations to appear as groups of nodes.
Yifan Fu is a graph drawing algorithm combining a multilevel approach, to overcome local minimums, and the Barnes–Hut octree technique, to approximate short and long-range forces [25]. Yifan Hu uses the repulsive forces on one node from a cluster of distant nodes. The algorithm uses a spring-electrical model to calculate both the attraction and repulsion forces to visually demonstrate the component nodes within a hospital network structure. The repulsive force is global and proportional to the inverse of the (physical) distance between vertices. The attractive force (the spring force) is only between neighboring vertices [25]. The effect of this is that one node may be attracted to two other nodes, but those nodes may be repelling each other. This leads to a stretching effect.
The repulsion Fr formula is mathematically defined as:
Here, d represents the distance between the two nodes, while the attraction Fa formula is expressed as:
Typically, this multilevel approach has three levels as presented Algorithm 1 below;
| Algorithm 1 Yifan Hu Multilevel algorithm |
| 1) Coarsest Graph Layout, which is as modelled as follows: |
| 2) The Coarsening Phase, calculated as outlined: |
| and 3) the Prolongation and Refinement Phase, where prolongation is employed to acquire initial layout: |
The starting point is the original graph, G0 = G and ni = | Vi | is the coefficient for the number of vertices in the ith level graph, represented as Gi. xi is defined as the coordinate vector for the vertices in Vi. Gi is represented by a symmetric matrix Gi, where all entries of the matrix act as the edge weights. Gi+1 to Gi is the continuation operator, also represented by a matrix Pi, of dimension ni * ni+1.
Fruchterman-Reingold is an algorithm which produces undirected graphs through distributing vertices evenly, making edge lengths uniform and reflecting symmetry [26]. Furthermore, the following two principles are adhered to. Firstly, that vertices connected by an edge should be drawn near each other, and secondly, that vertices should not be drawn too close to each other [26]. In addition to these criteria, the Fruchterman-Reingold algorithm adds even vertex distribution and treats vertices as atomic particles or celestial bodies, exerting attractive and repulsive force from one another [27]. In other words, the algorithm distributes vertices evenly, makes edge lengths uniform and reflects symmetry by placing spring-like attractive forces on each edge, and letting the system stabilise. The principles that the Fruchterman-Reingold algorithm aim to achieve are, firstly, vertices connected by an edge should be drawn near each other, and secondly, vertices should not be drawn too close to each other (depending on how many there are and how much space is available) [26]. The algorithm is considered a standard in graph-drawing algorithms. The Fruchterman-Reingold algorithm is an iterative algorithm determining the position of all the nodes and the distance between the nodes connected by an edge, using the sum of force vectors to calculate the direction and distance a node should be moved at each step, and updating the forces between them, until stability (i.e. minimum energy) is reached.
The distance between two vertices d and the optimal distance between two vertices k is defined as:
where C is the constant to be found experimentally and represents the width step a node is moved at each iteration.
The Fruchterman-Reingold attractive force is defined as:
The Fruchterman-Reingold repulsive force is defined as:
Finally, OpenOrd is an open-source graph-drawing algorithm specialised for drawing large-scale real-world graphs incorporating edge-cutting, a multi-level approach, average-link clustering and a parallel implementation of a force-directed method [28]. It is based upon an implementation of the Fruchterman-Reingold algorithm known as the VxOrd. All of these visualisation algorithms are employed and evaluated as part of the data processing techniques outlined in the following methodology.
3.2. Logarithmic Heatmaps
Logarithmic heatmaps are an effective way of presenting data with significant value ranges. By converting values to their logarithm, it is possible to display changes that happen across disparate scales. A visualisation is typically constructed using a logarithmic algorithm, outlined in (6).
where the base b logarithm of x is equal to f(x). Lower-scale values are not compressed down into the congested section of the graph where the unique values would be challenging to identify. In this sense, a logarithmic heat-map is appropriate as the log scales enable a significant range of coefficients to be displayed.
3.3. Nonparametric Statistical Graphics
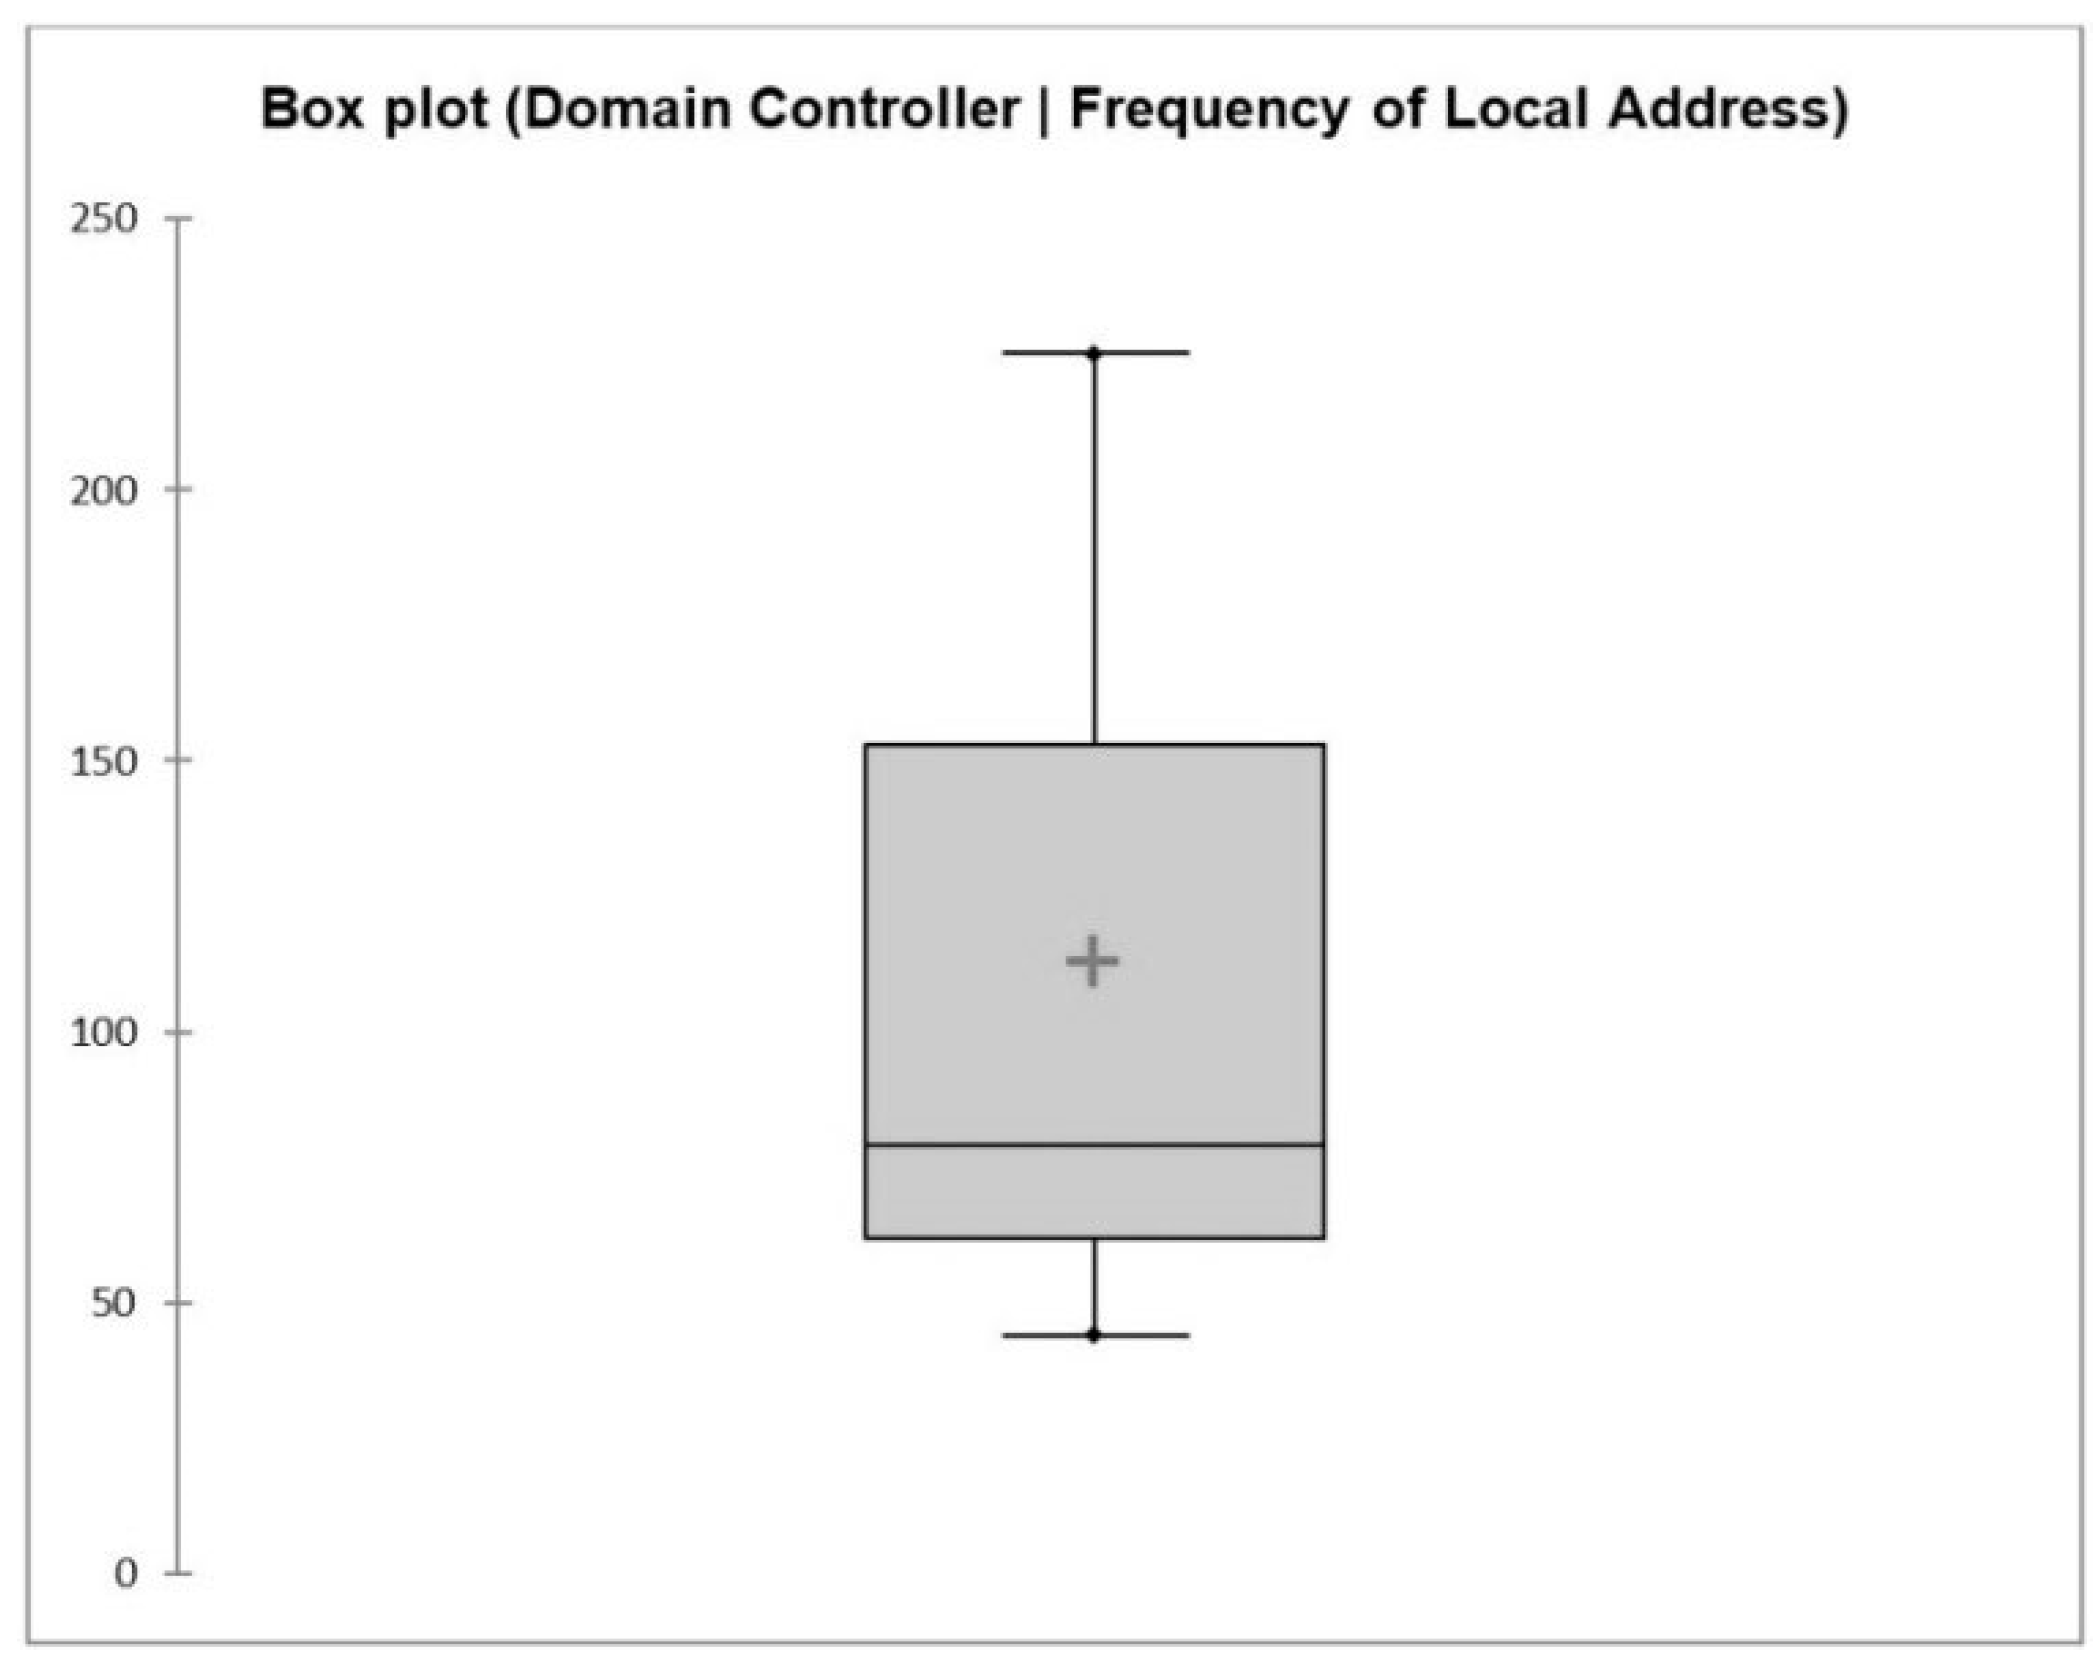
Nonparametric statistical graphs, are data visualisations where the dataset is not required to fit a normal distribution. For example, the techniques may make use of data which does not necessarily contain numbers, but rather ordinal data. Nonparametric statistical approaches are ideal for settings in which data might have no clear numerical interpretation. The two techniques employed in this research involve the use of boxplots and Sankey diagrams to visualise the TCP socket connection counts. A boxplot requires five components of information, the lowest value (L), lower quartiles (Q1), median (Q2), upper quartile (Q3) and the highest value (H). A Sankey diagram is typically used to show a visualisation of flow quantity, where the width of the arrows are proportionate to the flow measure.
In the following section, a case study is presented, which is comprised of a visualisation of the TCP-socket data, using each of the techniques outlined in this section.
4. Visualisation Case Study
In this section, various visualisation techniques are implemented on the dataset to determine the best method of visualising hospital network data. The four techniques are (1) force-directed layout algorithms, (2) heatmaps, (3) boxplots and (4) Sankey diagrams.
4.1. Force-Directed Layout Algorithms
Visualisations the hospital’s active directory domain controller are presented in Figure 3a,b. The visualisations presented are of the raw data connections for the PAS system at the Liverpool hospital. The nodes, depicted by black circles, represent devices connecting to the domain controller. In Figure 3a, the algorithm performed on the data is a ForceAtlas2 [24,29]. The fundamentals of ForceAtlas2 are intended to be simplistic, nodes repulse and edges attract continuously, while the layout is running and can be manipulated by the user while running. This ‘live’ spatialisation provides the user with an intuitive understanding of the layout process, whilst allowing the user to employ a trial–error approach in exploring the data. Figure 3b displays the algorithm performed on the data using the Yifan Hu Multilevel layout [25]. In this case, the repulsive forces on a node from a cluster of nodes are approximated by a Barnes-Hut calculation [29], which treats them as a super-node. As the graph shows, visualising the raw data provides a challenging insight into security detection. The identification of anomalous behaviour for one device is arduous due to the volume of data present. Additionally, there is no clear differentiation between low-risk data, and medium to high-risk data, which may indicate a potentially malicious device. Therefore, the visualisation of the data without being pre-filtered provides a limited insight into network behaviour; as the data is dense, with no clear indication of anomalous data points to be highlighted for security analysts.
Figure 3c,d depict visualisations of data connections for the EP system at the Liverpool hospital. In Figure 3c the data is processed through the Frutcherman–Reingold layout algorithm, which simulates the graph as a system of mass particles [26]. The nodes are mass particles and the edges are springs between the particles. The arrows on the visualisation represent weighted edges, where there are two or more edges between two vertices, with the larger arrows representing more edges. In Figure 3d the algorithm performed on the data is the Yifan Hu Multilevel layout [25]. Figure 3c,d demonstrates that, at a glance, current industry standard visualisation algorithms cannot present the data in a meaningful way without first pre-processing the data. Advanced data analytics techniques would, therefore, allow the data to be filtered in such a way that the resulting visualisations would highlight the potential security risks more clearly in the data [30].
Figure 3e,f presents visualisations of data connections for the PAS system at the Liverpool hospital. Figure 3e displays the PAS data visualised through the ‘OpenOrd layout’ algorithm, which expects undirected weighted graphs and aims to distinguish clusters of data [28]. It is based on the Frutcherman–Reingold [26] algorithm. In Figure 3f, the Yifan Fu layout algorithm is applied. In Figure 3e,f, even with a much smaller dataset, it is shown the data is still unmanageable. It is unreasonable to expect the user to identify which operators are potentially high-threat, what the data points tell the user about the overall state of the system, and the anomalies within it.
In order to demonstrate the interconnectivity of the three datasets, the data is combined into a single dataset and visualised. Figure 4 presents visualisations of data connections for the DC, EP and PAS systems at the Liverpool hospital. In Figure 4a, the data is visualised through the Frutcherman–Reingold layout. In Figure 4b, the OpenOrd layout algorithm is used to visualise the data. In Figure 4c, the Yifan Hu Multilevel layout algorithm is presented.
The visualised data presents snapshots from three servers of the hospital networks, representing only a small section of the hospital network infrastructure. The hospital has currently 274 servers, a combination of both physical and virtual servers, providing specialist applications and functions across the hospital network. Of these, there are 5 domain controller servers, 4 patient administration system servers and 2 electronic prescribing servers. With the ultimate aim of the process to capture snapshots at regular intervals on all the hospital servers the visualised data demonstrates that this is problematic due to the sheer quantity of data. Once the data has been visualised, interactions between the user and the visualisation itself are a challenge. For this reason, captured network data needs to be pre-filtered in order to simplify the visualisation and the visualisation process.
4.2. Heatmaps
In Figure 5, several heatmaps are presented, comparing frequency of local address and foreign address counts in the datasets. Additionally, in Figure 5, a comparison of IP addresses (converted to integer values) are presented.
Calculating the integer value of an IP address is calculated by breaking the address into 4 octets and using the following equation:
Representing the data as a logarithmic heat-map is an approach for identifying data points of interest. Using a logarithmic scale, lower-scale values are not compressed down into the congested section of the graph where the unique values would be challenging to identify. However, the density of the dataset prohibits valuable insights from being derived. Producing a real-time heatmap would be inefficient, as frequencies would need to be calculated in real time. IP addresses would also need to be converted into integers in real time, and this is a computationally intensive process. Additionally, as many of the IP values are within the same range, as they are communicating locally within the hospital. In comparison to Figure 4, individual data points cannot be visualised separately, as they all fall on the same point on the heatmap, with only colour range to represent density. This approach is inefficient for visualising hospital network data.
4.3. Boxplots
Figure 6 presents histograms of the most frequent items of local and foreign address values in the domain controller dataset. Displayed in Figure 6a the frequency for local addresses’ on the domain controller is shown. The output is varied, where the most significant IP address item counts comprise around 4% of the local IP address ports. Of the IP addresses, 89.84% in the dataset are unique values. In Figure 6b, the common most value is that of an asterisk due to the port not having been established indicating that at this time the domain controller had approximately 11.4% of its ports connected is presented.
These ports are comprised of unique values displaying the port number of the remote computer to which the socket is connected. In the case of this dataset, all port numbers begin with the IP ranges used within the hospital, which indicates that all devices connected to the domain controller are devices on site and hospital network.
Figure 6c,d presents the most frequent items of local and foreign address values in the electronic prescribing dataset. Displayed in Figure 6c the most frequent items for local addresses’ on the electronic prescribing is shown. The output is varied with the largest IP address item counts comprise around 7% of the local IP address ports. There are 3 sets of two value counts, with the rest being unique values; however, the electronic prescribing dataset is the smallest of the three datasets. Figure 6d depicts the most frequent value is that of an asterisk due to the port not having been established.
There are comparable data patterns between the data trends in foreign address frequencies for the electronic prescribing data in Figure 6d and for the domain controller displayed in Figure 3b. Similarly, open port values such as 0.0.0.0:0 and [::]:0 are available indicating that the electronic prescribing had approximately 21.5% of its ports connected. This indicates both the electronic prescribing and domain controller, in that at any given time, most ports are open and waiting for a connection.
Figure 6e,f presents the most frequent items of the local and foreign address values in the patient administration system dataset. Displayed in Figure 6e the most frequent items for local addresses’ on the patient administration are shown. Uniquely here, the output is largely comprised of a single port, accounting for almost 37% of the total local address connections. This number then quickly decreases and the majority of the IP addresses are unique values much like the electronic prescribing dataset. Figure 6f shows the most frequent value is that of the 0.0.0.0:0 port, the [::]:0 port and the asterix due to the port not having been established indicating that at this time the patient administration system had approximately 54.5% of its ports connected. Again, similarly to the domain controller and electronic prescribing datasets, the values for the foreign address have more than half the ports open. This indicates that each server has a large number of open ports, waiting for a connection to a device.
4.4. Sankey Diagrams
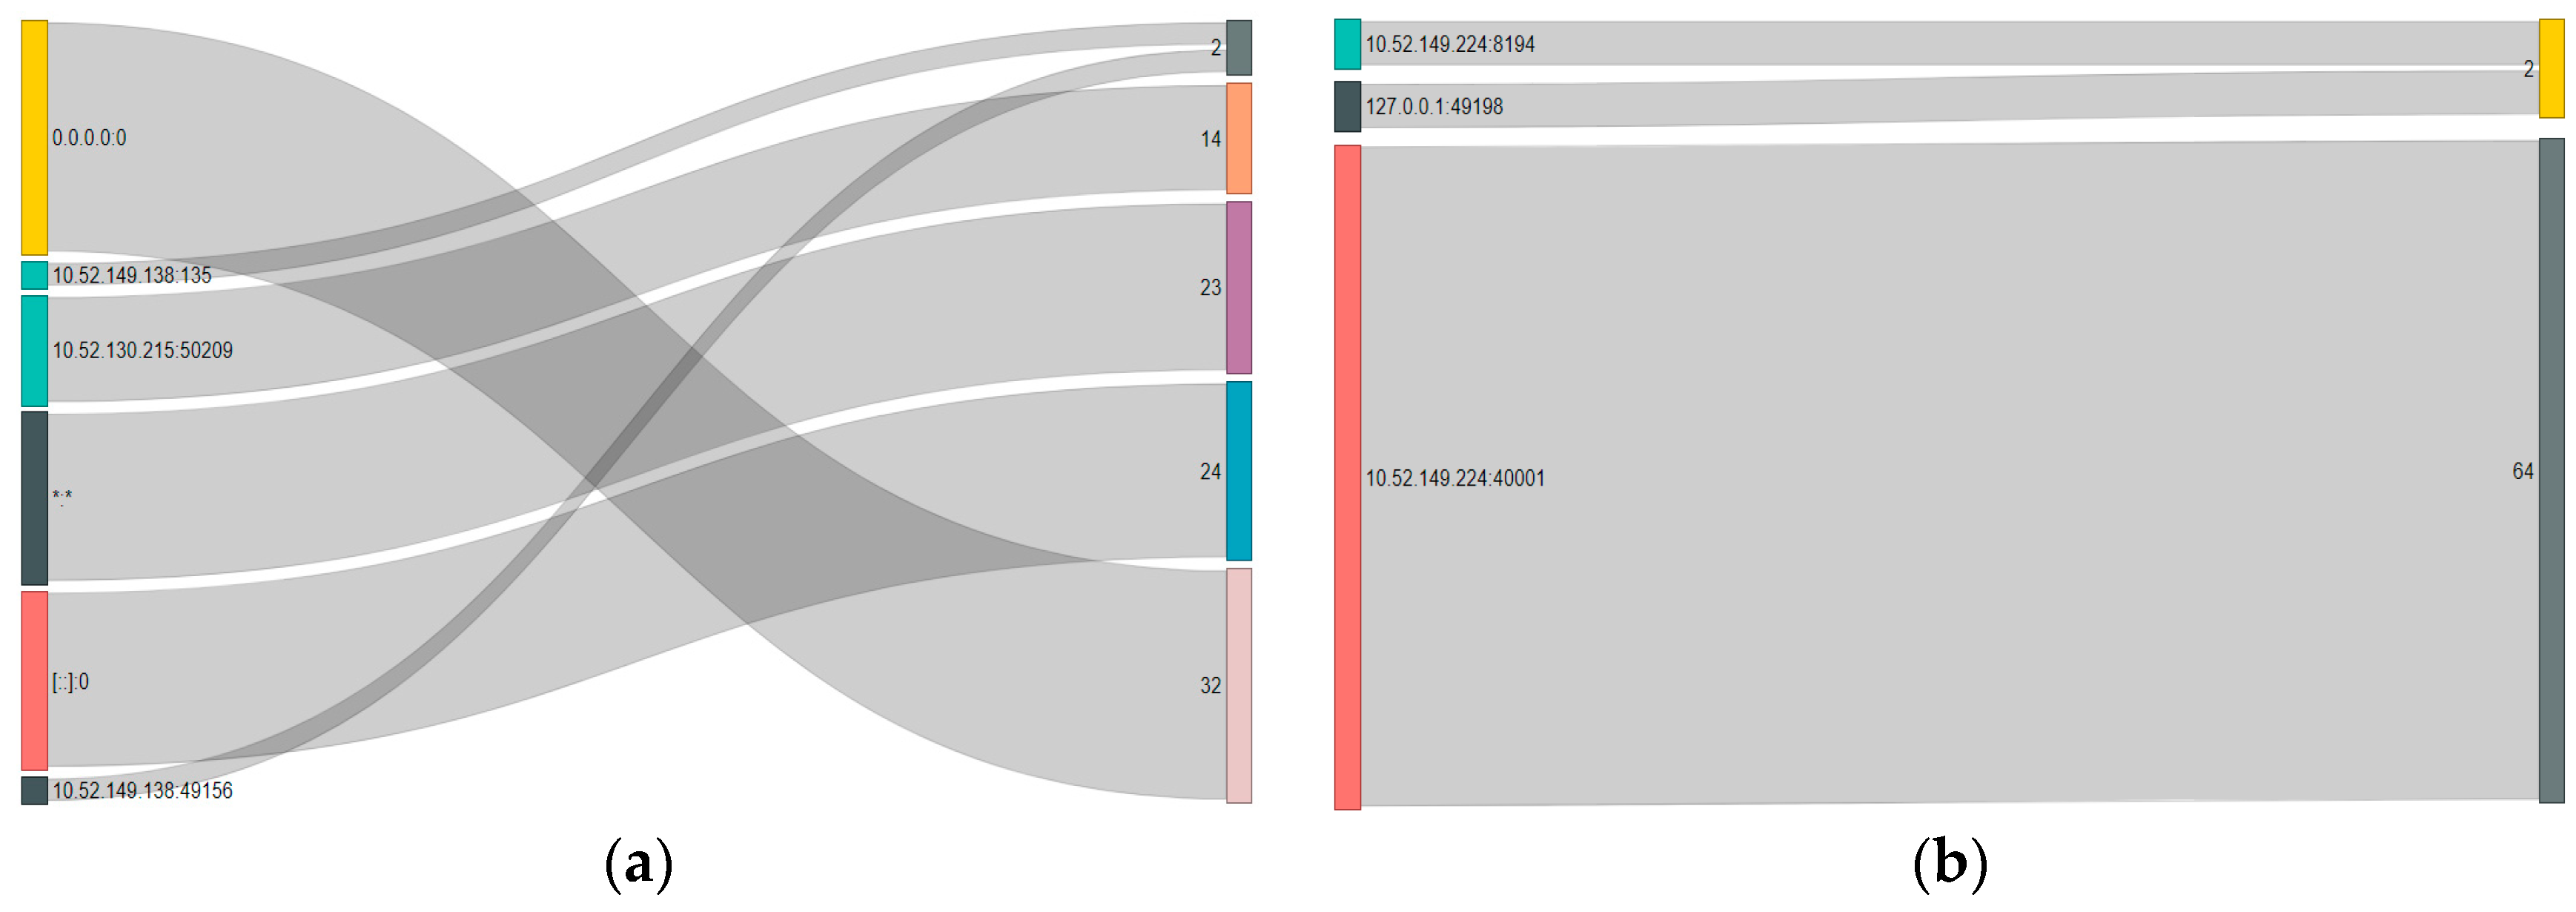
Figure 7 shows a Sankey Diagram for the data. The IP address on the left hand side (source) and the count of connections on the right hind side (destination). The size of each link created is correlated to the frequency of connection of each IP address to the server. Thus, the bigger the number of connections the wider the link stablished in the Sankey is. Table 2 outlines the sankey diagram counts for each dataset.
In the following section, a discussion of the various techniques is presented, and a proposed algorithm for visualising the data is articulated in pseudocode. Finally, results are presented and discussed.
5. Discussion and Proposed Algorithm
The visualisations cluster together salient points and use size to indicate potential threat levels. This gives the analyst a broad overview of the current network security at a glance. From here, the visualisation can be interacted with, explored by the analyst to investigate the data points and find in-depth technical information about each data point. The contribution of this paper is the application of the visualisation techniques to hospital network data, and the unique algorithm proposed in Section 5.2.
5.1. Visualisations
Situational awareness of network data enables end users to be able to identify where further cyber security systems need to be put in place. In addition, identifying where best practices and policies can be implemented minimises the risk of a cyber-attack; such as scanning attacks, injection attacks and jamming attacks (as detailed in Section 2, B), on highly confidential personal data.
Through removing irrelevant data from the dataset, only pertinent and useful data is analysed. For example, each of the datasets used have more than half of their foreign address data points ‘Open’, waiting for a connection to be made. When processed, this creates a large amount of unwanted noise in the visualisation which can be removed and potentially replaced with a figure representing the percentage of the dataset whose data points are open. This allows cyber security analysts attention to be focused on the more important, and potentially threatening data points. In addition to running a netstat command [31] using the command-line tool on the servers, a number of additional parameters were included in the command (–nab). These parameters are defined as follows:
- –n—This parameter displays the active TCP connections expressed numerically (in order to quantify the foreign address values for visualisation purposes).
- –a—This parameter displays all the active connections and TCP and UDP ports on which the server is listening.
- -–b—This parameter defines the binary (executable) program name involved in creating the connection or listening port.
For each of the three datasets, four separate netstat commands were executed. The four netstat commands were conducted firstly without any parameters, secondly with the parameters –nab, thirdly with the parameters –b, and finally with the parameter –n. The first command returns a dataset which attempts to determine the names of the foreign address’s, so that the devices which the servers are connected to are known. The –nab command displays all TCP connections numerically alongside the executable involved in creating the connection. The –b command displays TCP connections with named foreign address values. Finally the –n command produces a clean dataset for visualisation purposes and to compare to the first three command datasets.
Advanced data analytics techniques are used to further refine the data, removing the low-threat data from the unique data points above. This allows cyber security analysts to focus their attention on only the data points that are presenting any clear potential of moderate to high level threat, and differentiating between the two at the within top level visualisation. These algorithms filter the initial datasets in order to remove noise from the visualisation in order to present salient points to the analyst. The analyst then explores the visualisation and marks the highlighted data as either safe, or as malicious and pertaining to a certain attack type. Additionally, through the use of information rich packet data captured at regular minute intervals, the visualisation draws from a wider database and highlight commonalities between them. Rather than simply showing clusters of all data, data has been processed and cleaned, so that only clusters with moderate to high level threats are present. As such, the visualisations further enable the situational awareness of network activity, over time, to become clearer. The visualisation clearly highlights any unidentified foreign address IP, regularly connecting to a local address IP or several IP addresses, for further investigation.
Comparing the four netstat command datasets, for each server after initially processing the data, enables it to become clearer. For example, with regards to the domain controller dataset, once the data has been processed for most frequent IP values as in Figure 8, this data can be investigated further. This process would identify and remove superfluous low-risk data connections in order to present further, refined data visualisations. Doing so would present the data without unnecessary noise cluttering the visualisation and leaving only the relevant and potentially malicious data connections highlighted for the situational awareness analysts.
For example, with a value count of 225, representing almost 4% of the local address IP values are of a single IP Address open on port 445. This data point therefore, can be isolated in the four separate netstat command datasets to determine which foreign address devices these are connecting to and which processes are running, in order to determine their potential risk. Once this data point is isolated it becomes clear that this local IP Address is connecting to a number of hospital devices with the hospital prefix, and that foreign addresses that were resolving to a device name with a hospital device name prefix, initially suggesting that this could be ignored. The netstat was unable to obtain ownership information of the binary program involved in the creation of the connection on every value of these IP connections using the netstat –b parameter. This is due to netstat not having the necessary administration privileges to call this information. Through the use of the hospital’s resource monitor, and checking the active TCP Connections against current processes with network activity, the process running on this port can be determined as the server message block (SMB). The SMB operates as an application-layer network protocol, which is used for providing shared access between nodes on a network, such as access to shared files, printers and serial ports. In May 2017, the WannaCry ransomware campaign exploited an SMB vulnerability on Port 445. The exploit enabled the malware to use worm-like network propagation, encrypting files and demanding ransom payment, unless the system had been patched by Microsoft security bulletin MS17-010. The attack resulted in network downtime for 48 UK hospitals, with 6 suffering disruption lasting several days [7].
5.2. Algorithm
The pseudocode for the proposed algorithm is presented below in Algorithm 2. The aim of the algorithm is to remove low-risk data points, with the aim of producing medium-high risk data points to be visualised for the benefit of the security analyst. It performs 4 key steps to achieve this, (1) selection control, (2) data pre-processing, (3) data analysis, and (4) visualisation.
| Algorithm 2 Algorithm Pseudocode: Data Filtering |
| Function: Remove Low-Risk Data Points |
| Input: Netstat–nab data for AD, EPMA and PAS |
| Output: Medium/High-Risk Data Points for each Data Type do Selection Control |
| if Data Type = AD/EPMA/PAS then Forward Data |
| else Temp Data Store end |
| Data Pre-Processing |
| if Data Type = AD/EPMA/PAS then Clean Data then Temp Data Store |
| else Temp Data Store Normalisation |
| end |
| Data Analysis for each Data Type Data Optimisation then Data Representation then Data Evaluation then end |
| Visualisation for each Data Type Data Interpretation then Data Consolidation then Visualise Data in User Interface end |
The algorithm is also presented visually in Figure 9.
5.3. Results
Having isolated the foreign address values not resolving to a hospital device or server name with a known prefix, there were two discernible data points worth investigating further. The first is a connected to a device/server with a notably unusual name. While this may be benign it would still be worthwhile leaving in data points like this in the visualisation system, in order to highlight this unusual data connection to a cyber security analyst and the hospital IT team. A noteworthy factor is a foreign address value, to which the device name cannot be resolved by netstat; it returns an IP Address. So this connection is established to the most frequent IP address value assigned by the domain controller. Yet the device name cannot be resolved by netstat, nor can the program which initiated the connection. Through filtering the data in this way, a prominent data point becomes apparent.
The other most common address values present in the domain controller dataset, in Figure 9, have value counts of 153, 79, 62 and 44 respectively. With the exception of a value of count 3, all other local address IP values in the dataset have counts of 2 or fewer. The local address value with the count of 153 are all running the lsass.exe process. The lsass.exe process is the local security authority subsystem service and it verifies the validity of logons to the server, handles password changes and creates access tokens. It is a critical system process but is sometimes targeted by malware because of this. All but two of the IP address are resolving to known hospital devices. So these can all be categorised as low-risk connections initially and filtered from the dataset and the two connections with unresolved foreign address device names can be isolated and visualised for further investigation.
The Manufacturer and User Facility Device Experience (MAUDE) database is a publicly-available database managed by the Food and Drug Administration (FDA) [32]. It was established through the Safe Medical Devices Act of 1990 which requires sites in which medical devices are used to report device-related fatalities and serious adverse events to the FDA. The data has been publicly available since 1995. Attackers can attempt to masquerade malicious software through techniques such as naming their file Isass.exe (with a capital I rather than lower case l). If an lsass.exe file is located in a folder other than C:\Windows\system32 it can be considered malware. Anti-malware software is a potential solution for malware security risks such as this; however in 2016 a medical device monitoring a patient’s physiological data whilst undergoing a heart catheterisation procedure shut down and required a reboot. This caused a 5 minute delay to patient care, and was due to an anti-malware software performing hourly scans [31].
The local address value with a count of 79 are all resolving to known hospital network devices and running the lsass.exe process. The local address value with a count of 62 are largely resolving to known hospital network device and running the lsass.exe process. In this case there are some more unusual device names being returned suggesting that it is connected to some more niche hospital devices and some hospital servers. There are a further 7 unresolved foreign IP address values in this subsection of the dataset. Finally, the local address values, with a count of 44, are primarily resolving to known hospital network device names. Albeit similarly to the previous count, some more unusual device names, and there are a further 6 unresolved foreign IP address values. The process involved in creating these connections is the svchost.exe process. The svchost.exe process is the ‘Service Host’ and is a critical Windows component. It allows a number of services to share a process in order to reduce resource consumption. Often with a number working in tandem, to prevent a failure in one causing a full system crash. From our research, comparable to lsass.exe, malicious attackers sometimes masquerade their malware to look like the svchost.exe process and, if it is located in a folder other than C:\Windows\system32, it can be considered malware. In addition to reporting the process svchost.exe the netstat –b command also returns in this instance the process RPCSS. RPCSS are remote procedure call system services, which is a service control manager for servers. It performs activation requests, object exporter resolution and distributed garbage collection designed to make client/server interaction easier and safer by factoring out these common tasks.
Of the remaining data therefore, there are no further unresolved foreign address device names, however these connections were initiated by some interesting and unique processes in the dataset on these connections and as they are running on unique local IP addresses, they have been included in the refined dataset for the visualisation in Figure 10.
In Figure 10 the data is visualised again, with the data points identified as low risk, as above, removed from the data set to reduce noise, in addition to removing the data points of the listening UDP ports. It is worth noting that in the interim between running the netstat –b command (the dataset executables, for investigation purposes), and running the netstat –n command (the numerical dataset, for visualisation purposes), a few of the connections disconnected. Therefore some anomaly data connections identified in the netstat –b dataset were no longer present in the netstat –n dataset.
As these preliminary results show, the process has the capability to dramatically reduce the noise present in the datasets, in order to highlight the most important and potentially threatening data points for further investigation.
Figure 11, Figure 12 and Figure 13 present the local and Foreign address Sankey plots for DC, EPMA and PAS respectively. For the DC local results, it can be observed that the visualisation looks messy as the number of connections with frequency equal one over represents the remaining frequencies. Therefore, the following plots represent all the connection counts except those equal to one.
6. Conclusions and Future Work
With healthcare organisations using electronic records, cyber-based transactions and mobile electronics, the risk of a data breach is an increasing concern. Healthcare data is intrinsically valuable; the repercussions of data compromise within healthcare infrastructures can range from loss of patient privacy and fraud, to patient injury or potentially death. Therefore, protecting private patient data and preventing data compromise is critically important. Visualisation can be used as a tool for cyber security officers within healthcare organisations to increase their situational awareness of data flow and actively address this issue. Additionally, visualisation tools allow system operators to be proactive about cyber security within healthcare organisations. This is in contrast to the accepted and fundamentally flawed approach of reactivity to cyber security attacks, which do not attempt to address the underlying security flaws within healthcare organisations.
In this paper, an investigation into data visualisation techniques within healthcare infrastructures is presented. Three real-world datasets were analysed and visualised and are presented as a study to demonstrate the scale of the research challenge. These datasets demonstrate that detecting anomalous data behaviours in healthcare infrastructures is challenging. Even once data has been visualised it is challenging to manage and manipulate in meaningful ways in order to identify irregular and anomalous data which may indicate potentially malicious behaviour and prevent data compromise. As more data is provided by the Liverpool-based hospital, a real-world practical case of an attack will be analysed, but this data is currently unavailable. Future work will build on the investigation into visualisation techniques for healthcare infrastructures through using virtual reality to explore the datasets. Complex numerical network analysis will also be explored. Additionally, future work will involve the use of machine learning data filtering techniques to simplify the visualisation of normal network traffic. This will facilitate understanding patterns of data behaviours and highlight abnormal data behaviours in the network, which are the result of an attack taking place using machine learning algorithms.
Author Contributions
Conceptualization, A.B., and W.H.; methodology, A.B., W.H. and C.A.C.M.; software, A.B., W.H. and C.A.C.M.; validation, A.B. and W.H.; formal analysis, A.B.; investigation, A.B.; data curation, A.B.; writing—original draft preparation, A.B. and W.H.; writing—review and editing, A.B., W.H., C.A.C.M. and T.B.; visualization, A.B., W.H. and C.A.C.M.; supervision, W.H., M.M. and A.E.R.; project administration, A.B.
Funding
This research received no external funding.
Conflicts of Interest
The authors declare no conflict of interest.
References
- Fanucchi, R.Z.; Bessani, M.; Camillo, M.H.M.; London, J.B.A.; Maciel, C.D. Failure rate prediction under adverse weather conditions in an electric Distribution System using Negative Binomial Regression. In Proceedings of the International Conference on Harmonics and Quality of Power, ICHQP, Belo Horizonte, Brazil, 16–19 October 2016; pp. 478–483. [Google Scholar]
- Eusgeld, I.; Nan, C. Creating a simulation environment for critical infrastructure interdependencies study. In Proceedings of the 2009 IEEE International Conference on Industrial Engineering and Engineering Management, Hong Kong, China, 8–11 December 2009; pp. 2104–2108. [Google Scholar]
- Wang, J.-Y.; Ho, H.-Y.; Chen, J.-D.; Chai, S.; Tai, C.-J.; Chen, Y.-F. Attitudes toward inter-hospital electronic patient record exchange: Discrepancies among physicians, medical record staff, and patients. BMC Health Serv. Res. 2015, 15, 264. [Google Scholar] [CrossRef] [PubMed]
- Kruse, C.S.; Frederick, B.; Jacobson, T.; Monticone, D.K. Cybersecurity in healthcare: A systematic review of modern threats and trends. Technol. Health Care 2017, 25, 1–10. [Google Scholar] [CrossRef] [PubMed] [Green Version]
- Alazab, M.; Broadhurst, R. An Analysis of the Nature of Spam as Cybercrime. In Cyber-Physical Security; Springer International Publishing: Cham, Switzerland, 2017; pp. 251–266. [Google Scholar]
- De Cauwer, H.; Somville, F.; Sabbe, M.; Mortelmans, L.J. Hospitals: Soft Target for Terrorism? Prehosp. Disaster Med. 2017, 32, 94–100. [Google Scholar] [CrossRef]
- Boddy, A.; Hurst, W.; Mackay, M.; el Rhalibi, A. A Study into Data Analysis and Visualisation to increase the Cyber-Resilience of Healthcare Infrastructures. Internet Things Mach. Learn. 2017. [Google Scholar] [CrossRef]
- Ogie, R. Bring Your Own Device: An overview of risk assessment. IEEE Consum. Electron. Mag. 2016, 5, 114–119. [Google Scholar] [CrossRef]
- Jing, Q.; Vasilakos, A.V.; Wan, J.; Lu, J.; Qiu, D. Security of the Internet of Things: Perspectives and challenges. Wirel. Netw. 2014, 20, 2481–2501. [Google Scholar] [CrossRef]
- Stoll, J.; Bengez, R.Z. Visual structures for seeing cyber policy strategies. In Proceedings of the 2015 7th International Conference on Cyber Conflict: Architectures in Cyberspace, Tallinn, Estonia, 26–29 May 2015; pp. 135–152. [Google Scholar]
- Chen, A.S.; Khoury, M.; Savic, D.A.; Vamvakeridou-Lyroudia, L.S.; Djordjevic, S. Interactive 3D visualisation of flood impact to critical infrastructure. Procedia Eng. 2017, 212, 1631–1633. [Google Scholar]
- Schukat, M. Securing critical infrastructure. In Proceedings of the DT 2014—10th International Conference on Digital Technologies 2014, Zilina, Slovakia, 9–11 July 2014; pp. 298–304. [Google Scholar]
- Boddy, A.; Hurst, W.; MacKay, M.; el Rhalibi, A. A Study into Detecting Anomalous Behaviours within HealthCare Infrastructures. In Proceedings of the 2016 9th International Conference on Developments in eSystems Engineering (DeSE), Liverpool, UK, 31 August–2 September 2016. [Google Scholar]
- Kocabas, O.; Soyata, T.; Aktas, M.K. Emerging Security Mechanisms for Medical Cyber Physical Systems. IEEE/ACM Trans. Comput. Biol. Bioinform. 2016, 13, 401–416. [Google Scholar] [CrossRef]
- Camara, C.; Peris-Lopez, P.; Tapiador, J.E. Security and privacy issues in implantable medical devices: A comprehensive survey. J. Biomed. Inform. 2015, 55, 272–289. [Google Scholar] [CrossRef] [Green Version]
- Vargheese, R. Dynamic Protection for Critical Health Care Systems Using Cisco CWS: Unleashing the Power of Big Data Analytics. In Proceedings of the 2014 Fifth International Conference on Computing for Geospatial Research and Application, Washington, DC, USA, 4–6 August 2014; pp. 77–81. [Google Scholar]
- Chui, K.T.; Alhalabi, W.; Pang, S.S.H.; Pablos, P.O.; Liu, R.W.; Zhao, M. Disease Diagnosis in Smart Healthcare: Innovation, Technologies and Applications. Sustainability 2017, 9, 2309. [Google Scholar] [CrossRef]
- Chen, Q.; Lambright, J. Towards Realizing a Self-Protecting Healthcare Information System. In Proceedings of the 2016 IEEE 40th Annual Computer Software and Applications Conference (COMPSAC), Atlanta, GA, USA, 10–14 June 2016; pp. 687–690. [Google Scholar]
- Thamilarasu, G. iDetect: An intelligent intrusion detection system for wireless body area networks. Int. J. Secur. Netw. 2016, 11, 82. [Google Scholar] [CrossRef]
- Skowyra, R.; Bahargam, S.; Bestavros, A. Software-Defined IDS for securing embedded mobile devices. In Proceedings of the 2013 IEEE High Performance Extreme Computing Conference (HPEC), Waltham, MA, USA, 10–12 September 2013; pp. 1–7. [Google Scholar]
- Ullah, F.; Habib, M.A.; Farhan, M.; Khalid, S.; Durrani, M.Y.; Jabbar, S. Semantic interoperability for big-data in heterogeneous IoT infrastructure for healthcare. Sustain. Cities Soc. 2017, 34, 90–96. [Google Scholar] [CrossRef]
- Elder, J.; Ong, E.-J.; Bowden, R. IVACS—Interactive Visual Analytics for Cyber Security. In Proceedings of the Institute of Electrical and Electronics Engineers Vision Conference (IEEE VIS), Chicago, IL, USA, 25–30 October 2015; pp. 4–5. [Google Scholar]
- Veeramachaneni, K.; Arnaldo, I.; Korrapati, V.; Bassias, C.; Li, K. AI2: Training a Big Data Machine to Defend. In Proceedings of the 2nd IEEE International Conference on Big Data Security on Cloud, IEEE BigDataSecurity 2016, 2nd IEEE International Conference on High Performance and Smart Computing, IEEE HPSC 2016 and IEEE International Conference on Intelligent Data and S, New York, NY, USA, 9–10 April 2016; pp. 49–54. [Google Scholar]
- Jacomy, M.; Venturini, T.; Heymann, S.; Bastian, M. ForceAtlas2, a Continuous Graph Layout Algorithm for Handy Network Visualization Designed for the Gephi Software. PLoS ONE 2014, 9, e98679. [Google Scholar] [CrossRef] [PubMed]
- Hu, Y. Efficient, High-Quality Force-Directed Graph Drawing. Math. J. 2005, 10, 37–71. [Google Scholar]
- Fruchterman, T.M.J.; Reingold, E.M. Graph drawing by force-directed placement. Softw. Pract. Exp. 1991, 21, 1129–1164. [Google Scholar] [CrossRef] [Green Version]
- Kobourov, S.G. Force-directed drawing algorithms. In Handbook of Graph Drawing and Visualization (Discrete Mathematics and Its Applications); CRC Press: Abingdon, UK, 2013; pp. 383–408. [Google Scholar]
- Martin, S.; Brown, W.M.; Klavans, R.; Boyack, K.W. OpenOrd: An open-source toolbox for large graph layout. Proc. SPIE 2011, 7868, 786806. [Google Scholar]
- Barnes, J.; Hut, P. A hierarchical O(N log N) force-calculation algorithm. Nature 1986, 324, 446–449. [Google Scholar] [CrossRef]
- Promrit, N.; Merabti, M.; Mingkhwan, A.; Hurst, W. Advanced Feature Extraction for Evaluating Host Behaviour in a Network. In Proceedings of the 15th Annual Conference Convergence Telecommunication Networks Broadcast, Liverpool, UK, June 2014; Available online: https://www.researchgate.net/profile/William_Hurst5/publication/267391862_Advanced_Feature_Extraction_for_Evaluating_Host_Behaviour_in_a_Network/links/546c9aff0cf2c4819f229dab.pdf (accessed on 29 January 2019).
- Kramer, D.B.; Baker, M.; Ransford, B.; Molina-Markham, A.; Stewart, Q.; Fu, K.; Reynolds, M.R. Security and privacy qualities of medical devices: An analysis of FDA postmarket surveillance. PLoS ONE 2012, 7, e40200. [Google Scholar] [CrossRef] [PubMed]
- FDA. Merge Healthcare Merge Hemo Programmable Diagnostic Computer. MAUDE Adverse Event Report. 2016. Available online: https://www.accessdata.fda.gov/scripts/cdrh/cfdocs/cfmaude/detail.cfm?mdrfoi__id=5487204 (accessed on 8 December 2016).
Figure 1.
3-layer network topology.
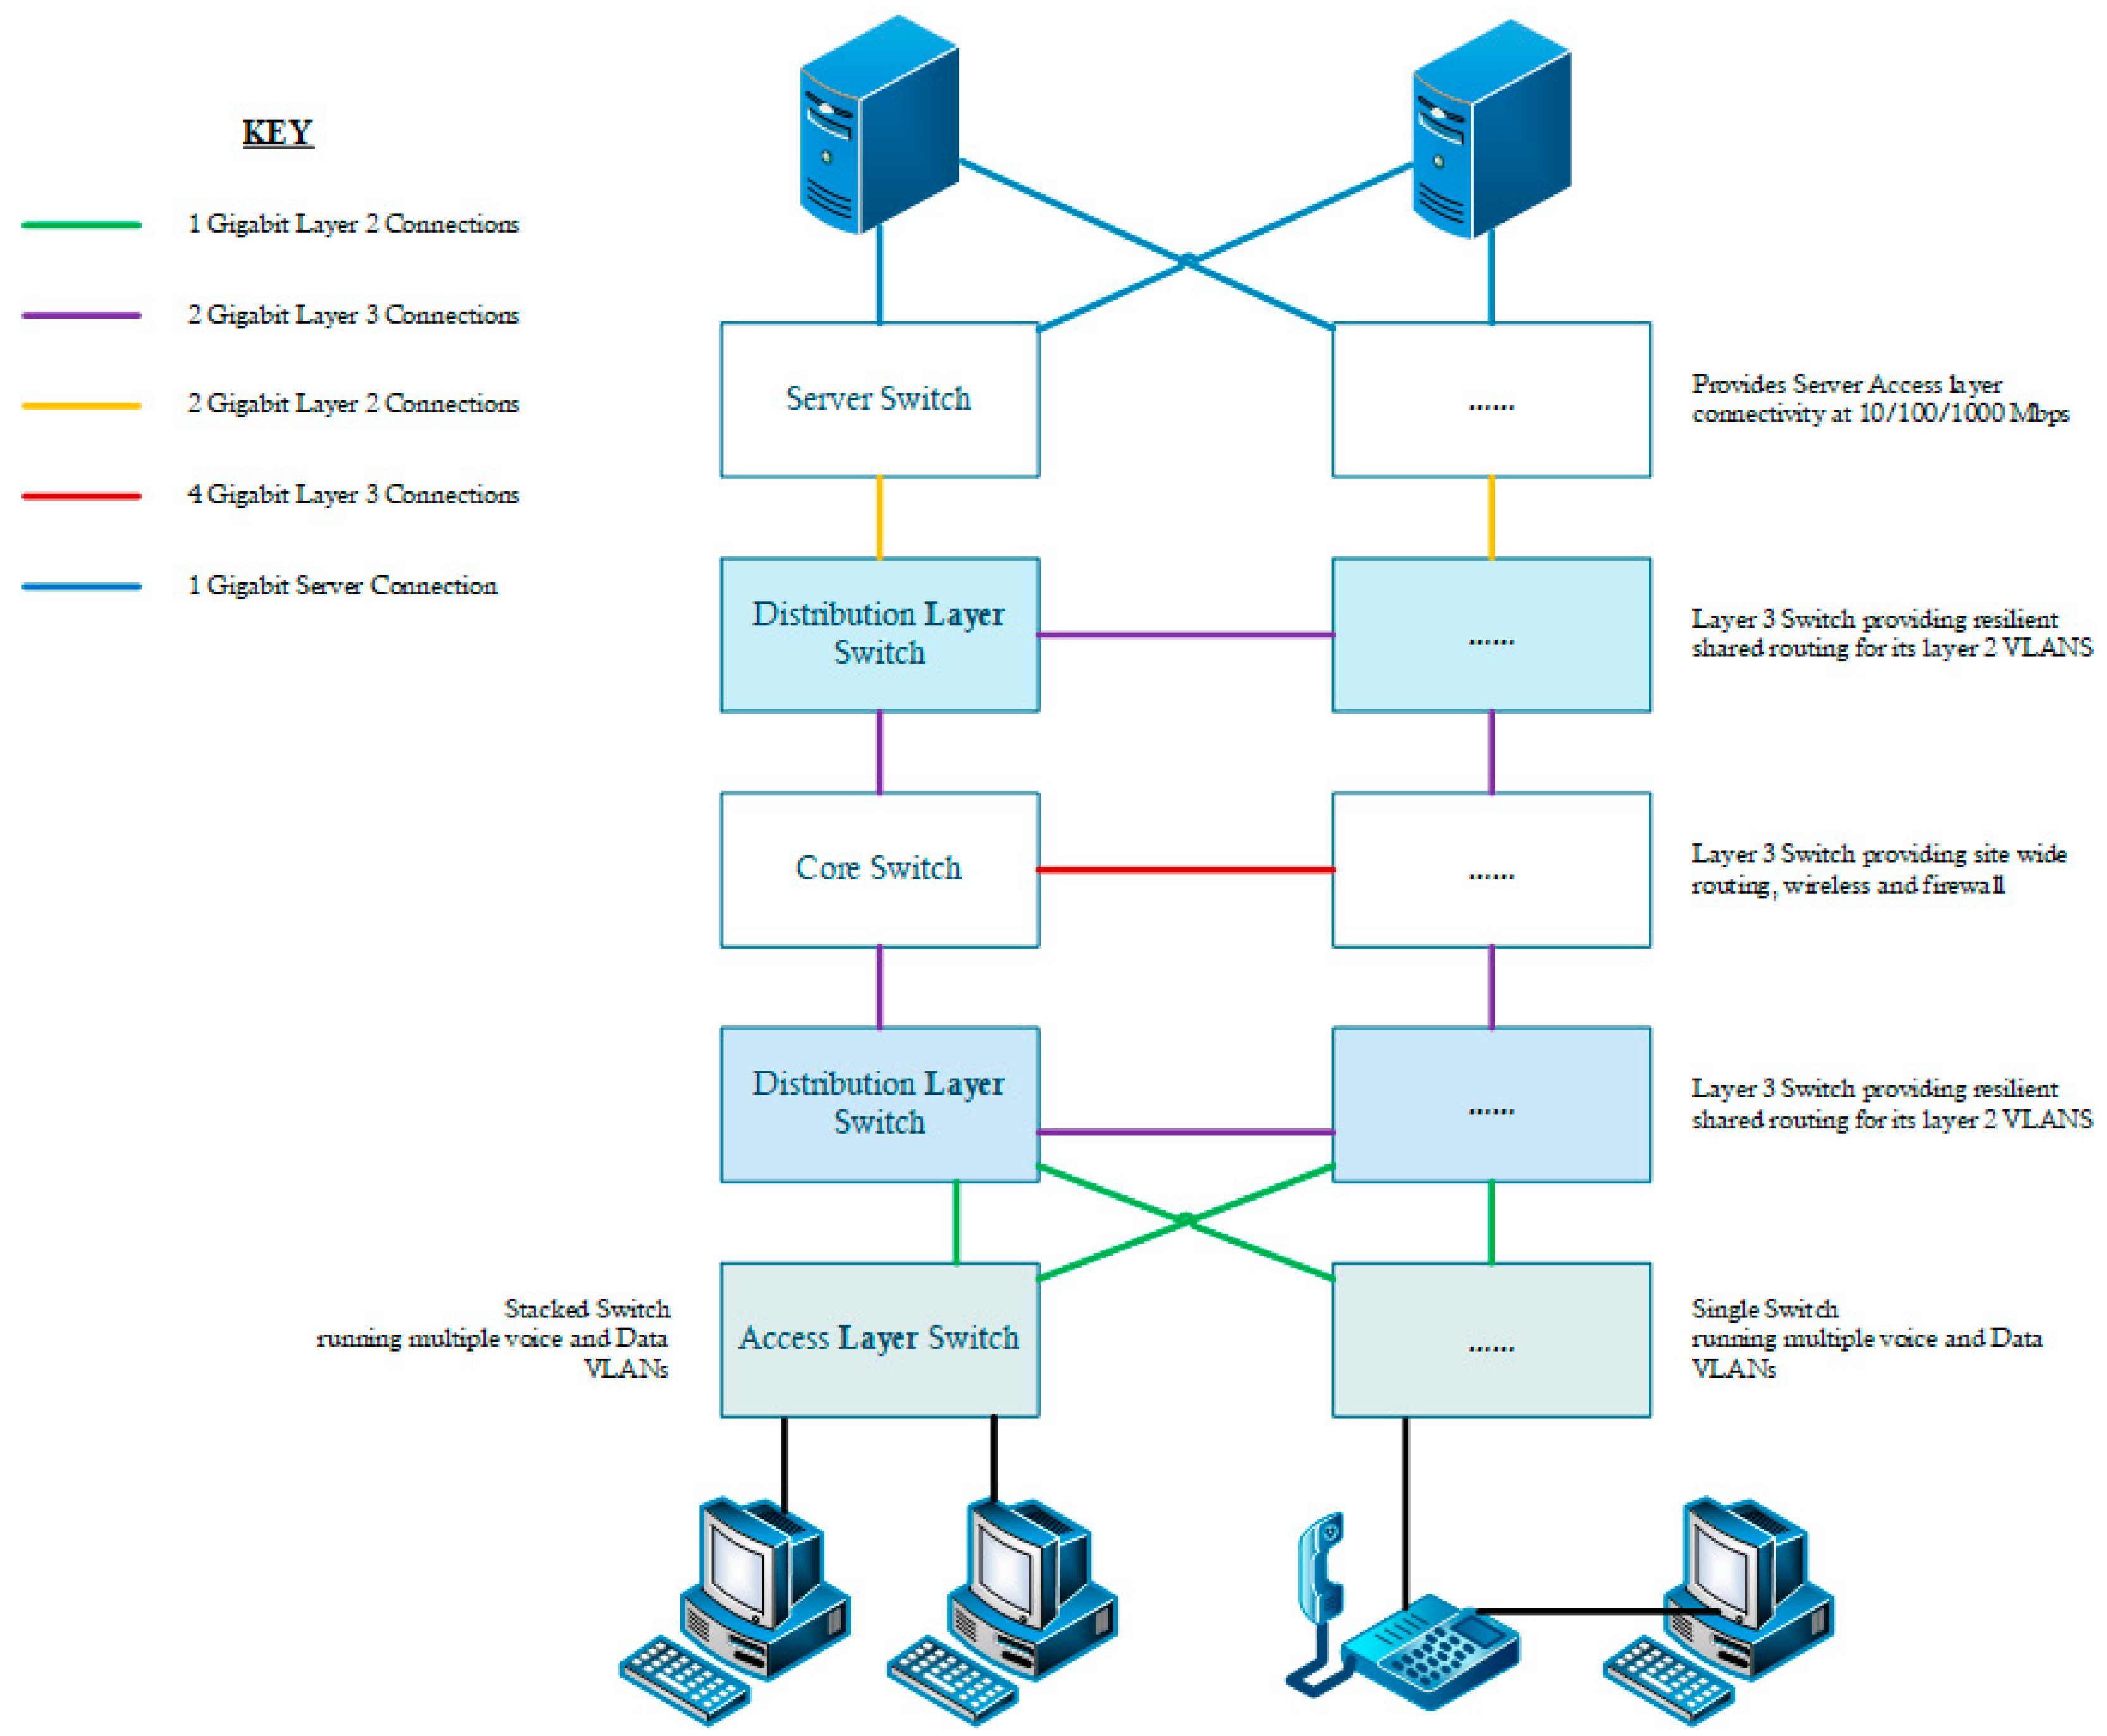
Figure 2.
Network infrastructure for remote access.
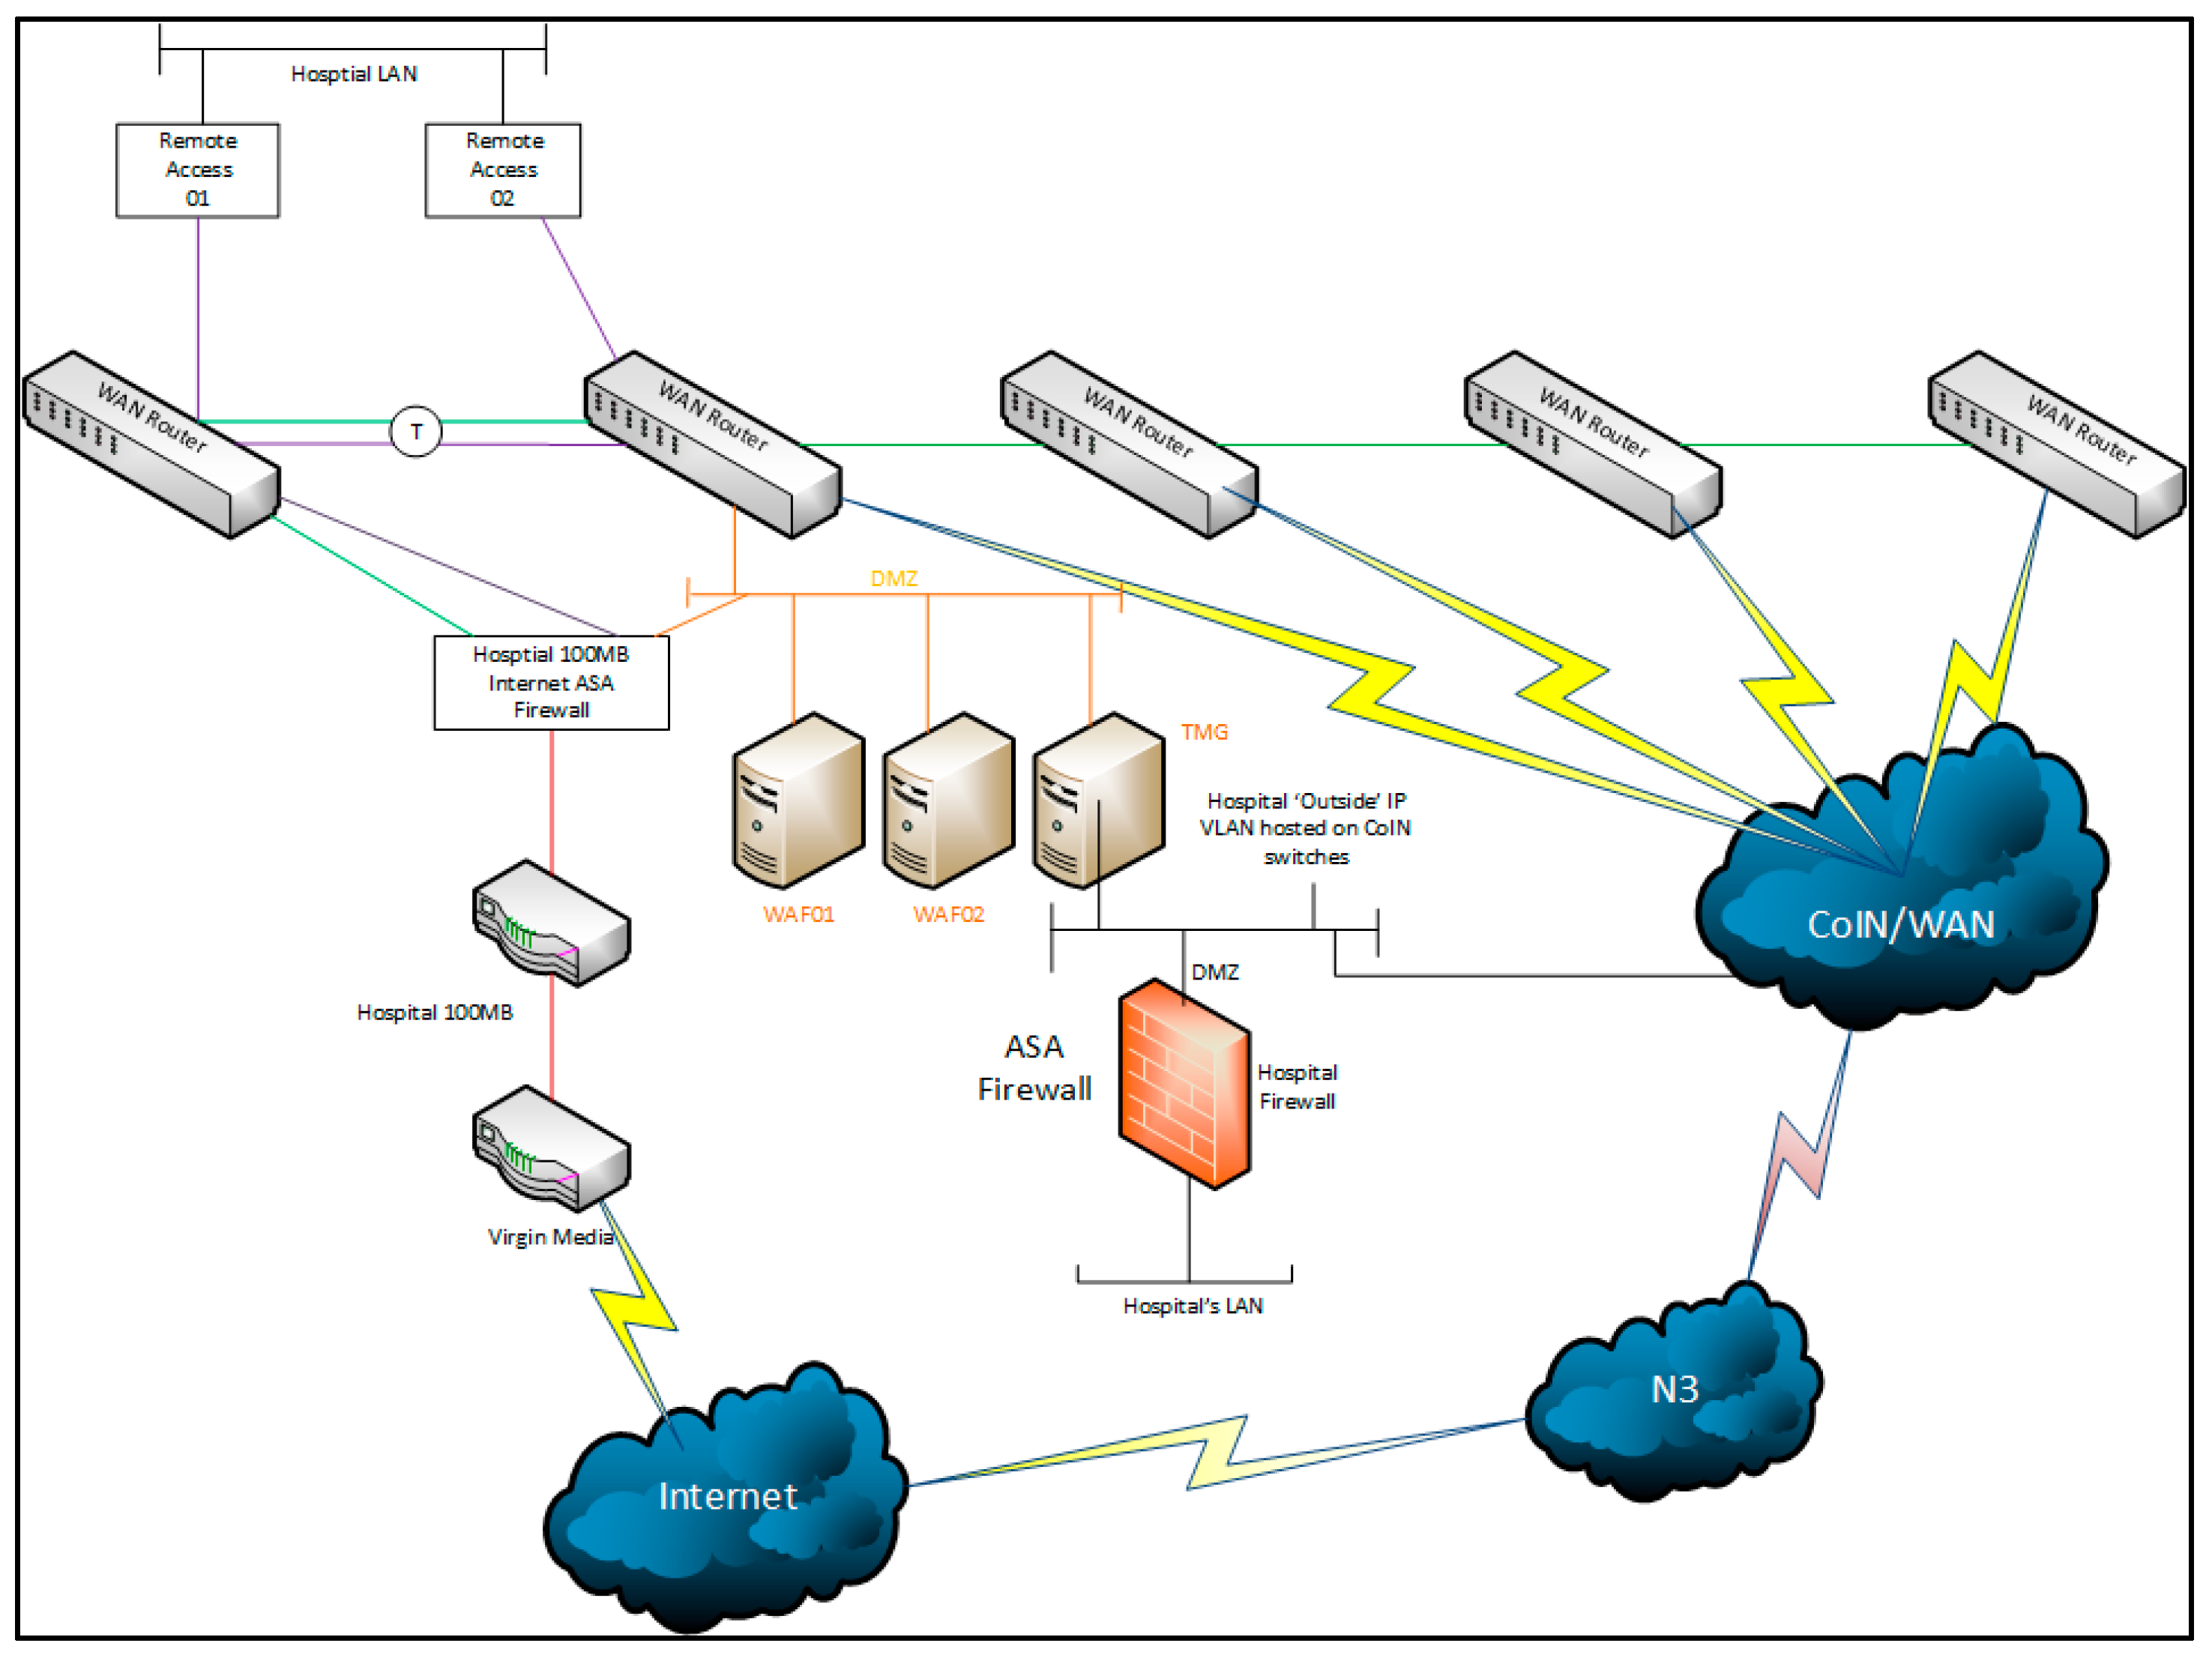
Figure 3.
Domain controller data with ForceAtlas2 algorithm (a) and Yifan Hu Multilevel layout algorithm (b);electronic prescribing data with Frutcherman–Reingold layout algorithm (c) and with Yifan Hu Multilevel layout algorithm (d); patient administration system data with OpenOrd layout algorithm (e) and with Yifan Fu Multilevel layout algorithm (f).

Figure 4.
Full dataset with Frutcherman–Reingold algorithm (a), OpenOrd layout algorithm (b) and Yifan Hu Multilevel layout algorithm (c).
Figure 4.
Full dataset with Frutcherman–Reingold algorithm (a), OpenOrd layout algorithm (b) and Yifan Hu Multilevel layout algorithm (c).
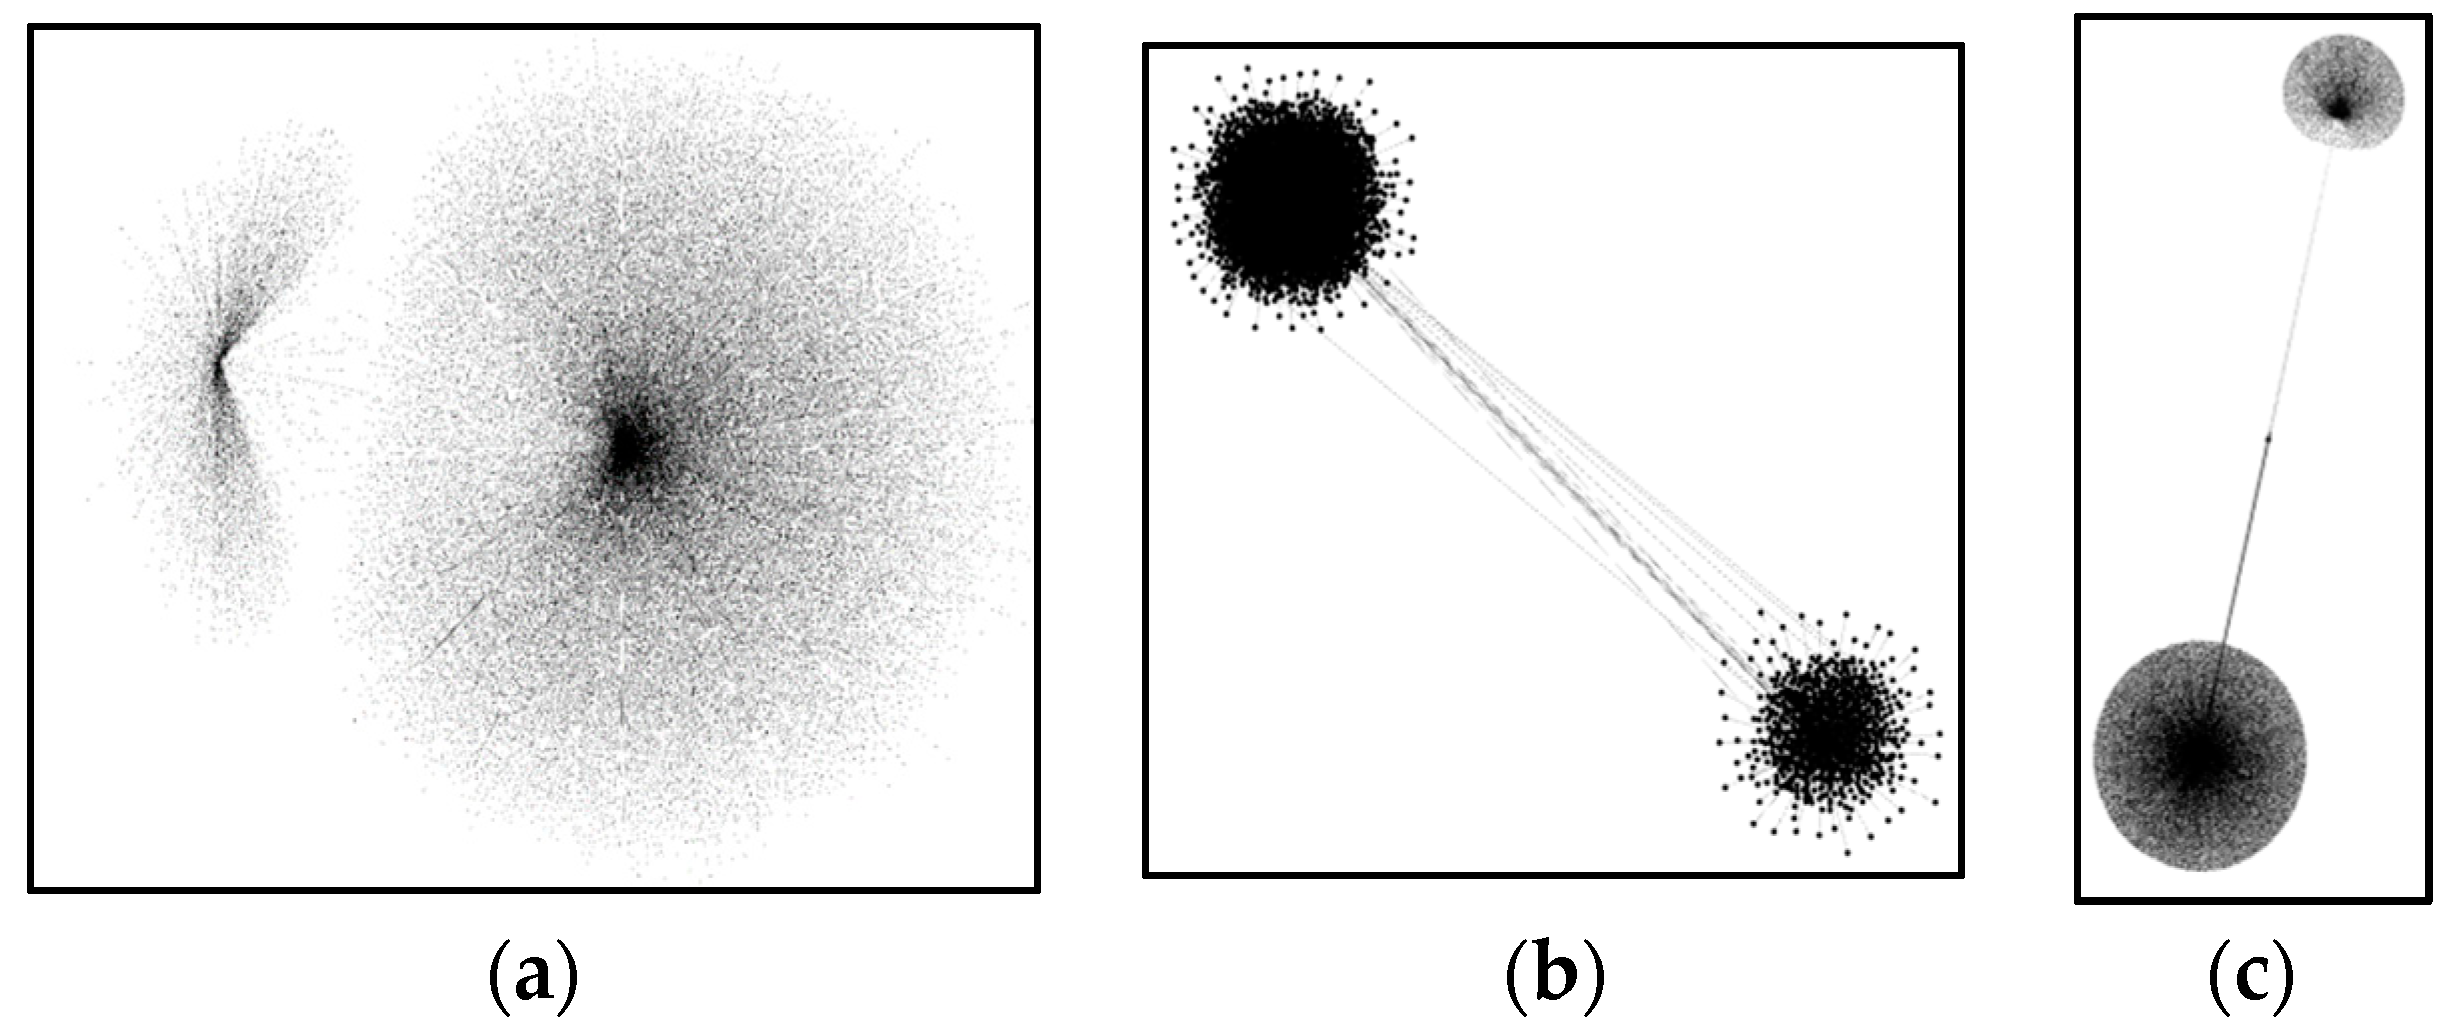
Figure 5.
Logarithmic heatmap comparing frequency of local address and foreign address counts in the domain controller (a), electronic prescribing (b) and patient administration system (c) servers. logarithmic heatmap comparing IP addresses (converted to integer values) of domain controller (d), electronic prescribing (e) and patient administration system (f) servers.

Figure 6.
Domain controller—frequency of local address (a) and foreign address (b), electronic prescribing—frequency of local address (c) and foreign address (d), patient administration system—frequency of local address (e) and foreign address (f).
Figure 6.
Domain controller—frequency of local address (a) and foreign address (b), electronic prescribing—frequency of local address (c) and foreign address (d), patient administration system—frequency of local address (e) and foreign address (f).
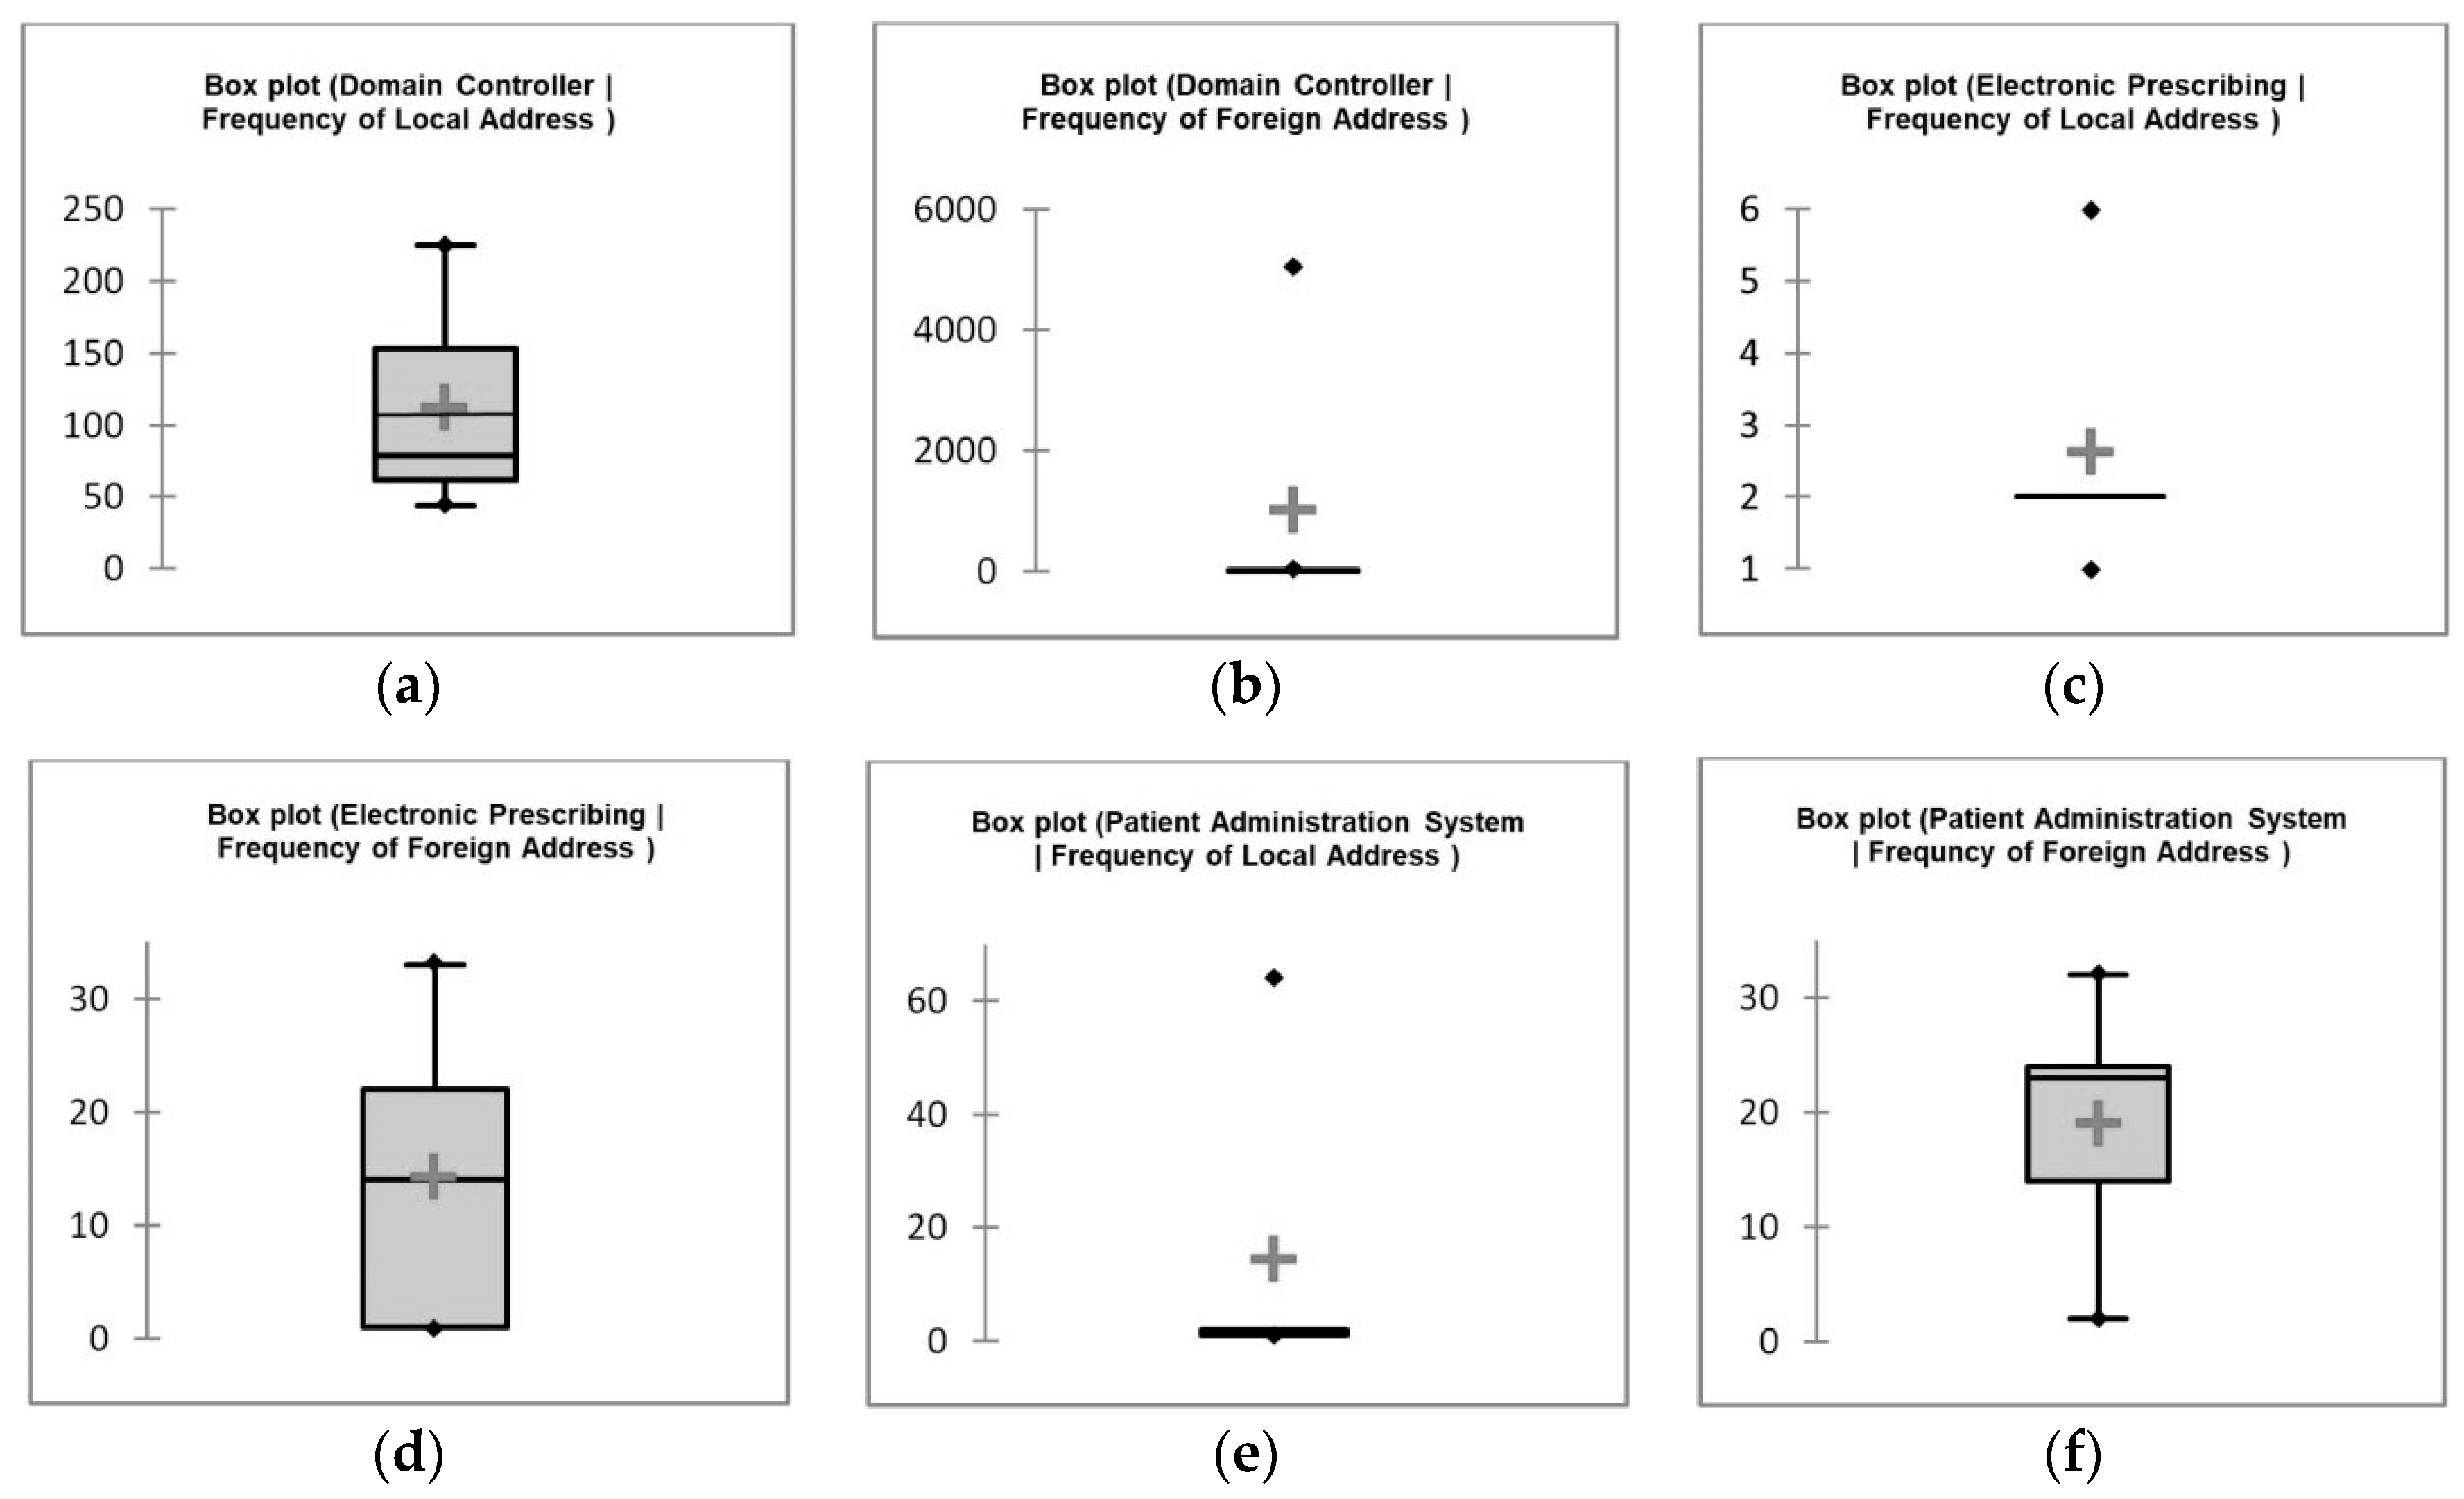
Figure 7.
Domain controller—frequency of local address (a) and foreign address (b), electronic prescribing—frequency of local address (c) and foreign address (d), patient administration system—frequency of local address (e) and foreign address (f).
Figure 7.
Domain controller—frequency of local address (a) and foreign address (b), electronic prescribing—frequency of local address (c) and foreign address (d), patient administration system—frequency of local address (e) and foreign address (f).
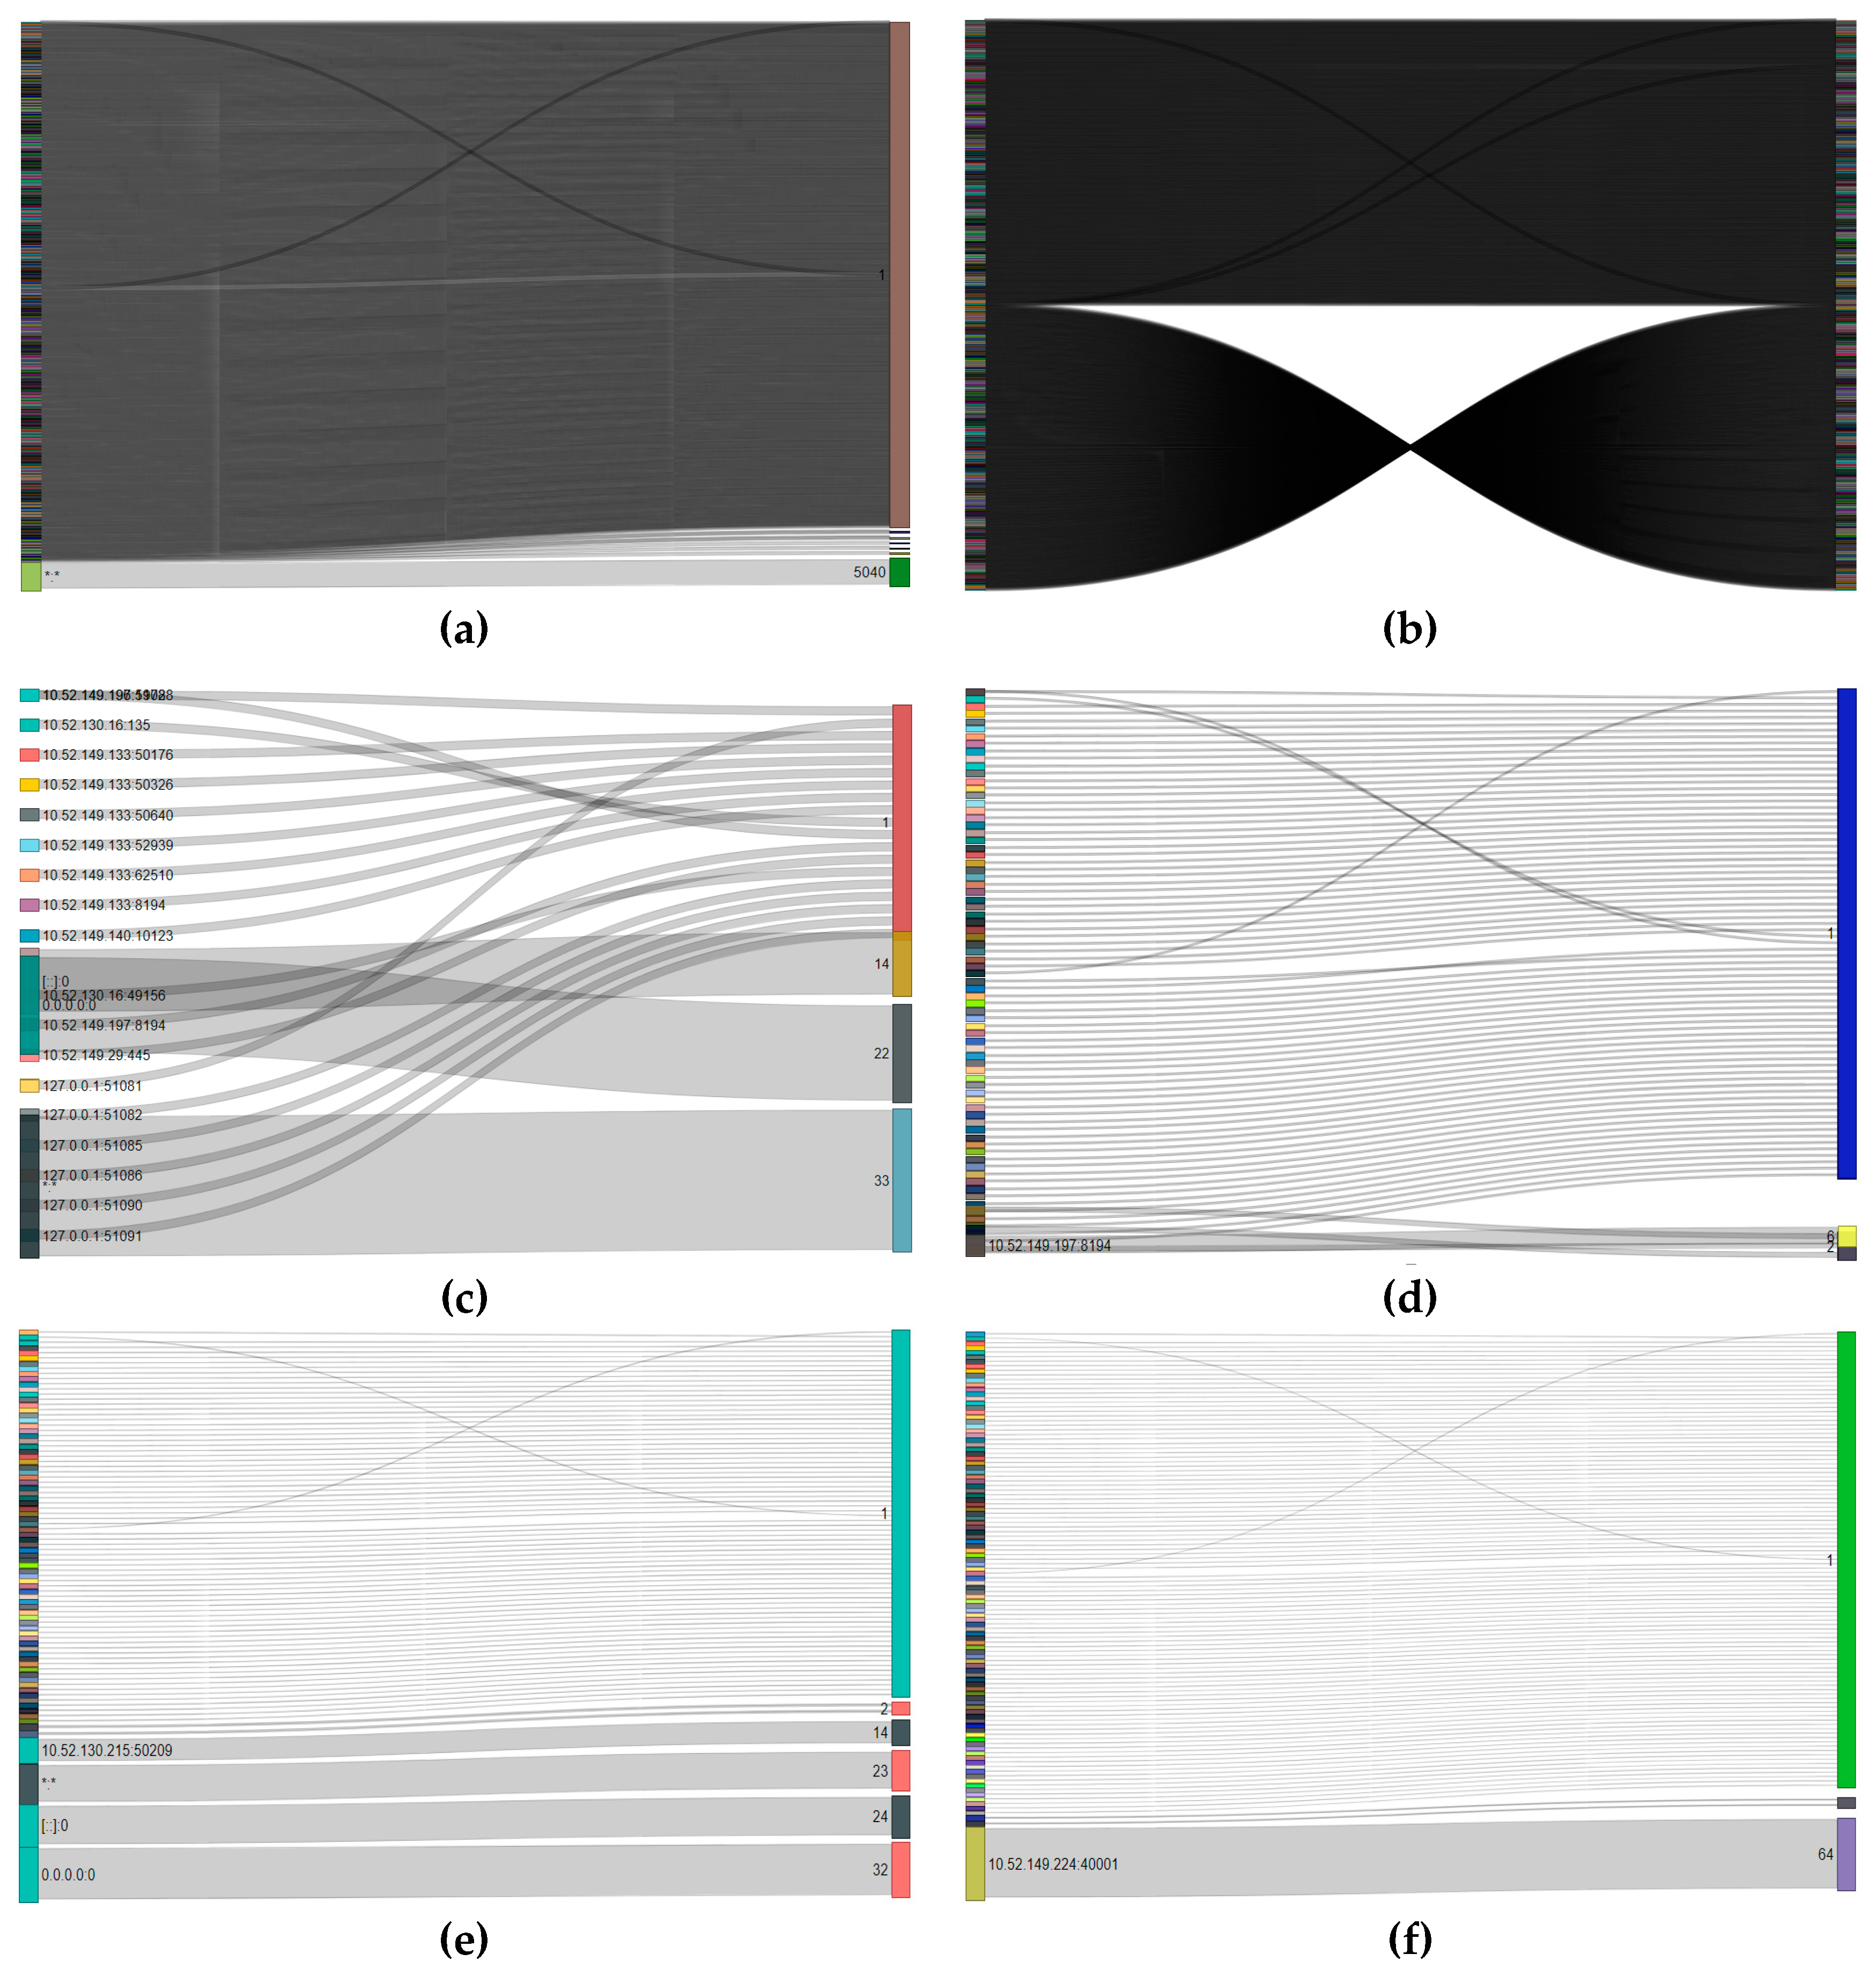
Figure 8.
Domain controller—frequency of local address.
Figure 9.
System Design Framework.

Figure 10.
Visualisation of domain controller dataset after noise reduction (a) and before (b) using ForceAtlas2 algorithm.
Figure 10.
Visualisation of domain controller dataset after noise reduction (a) and before (b) using ForceAtlas2 algorithm.
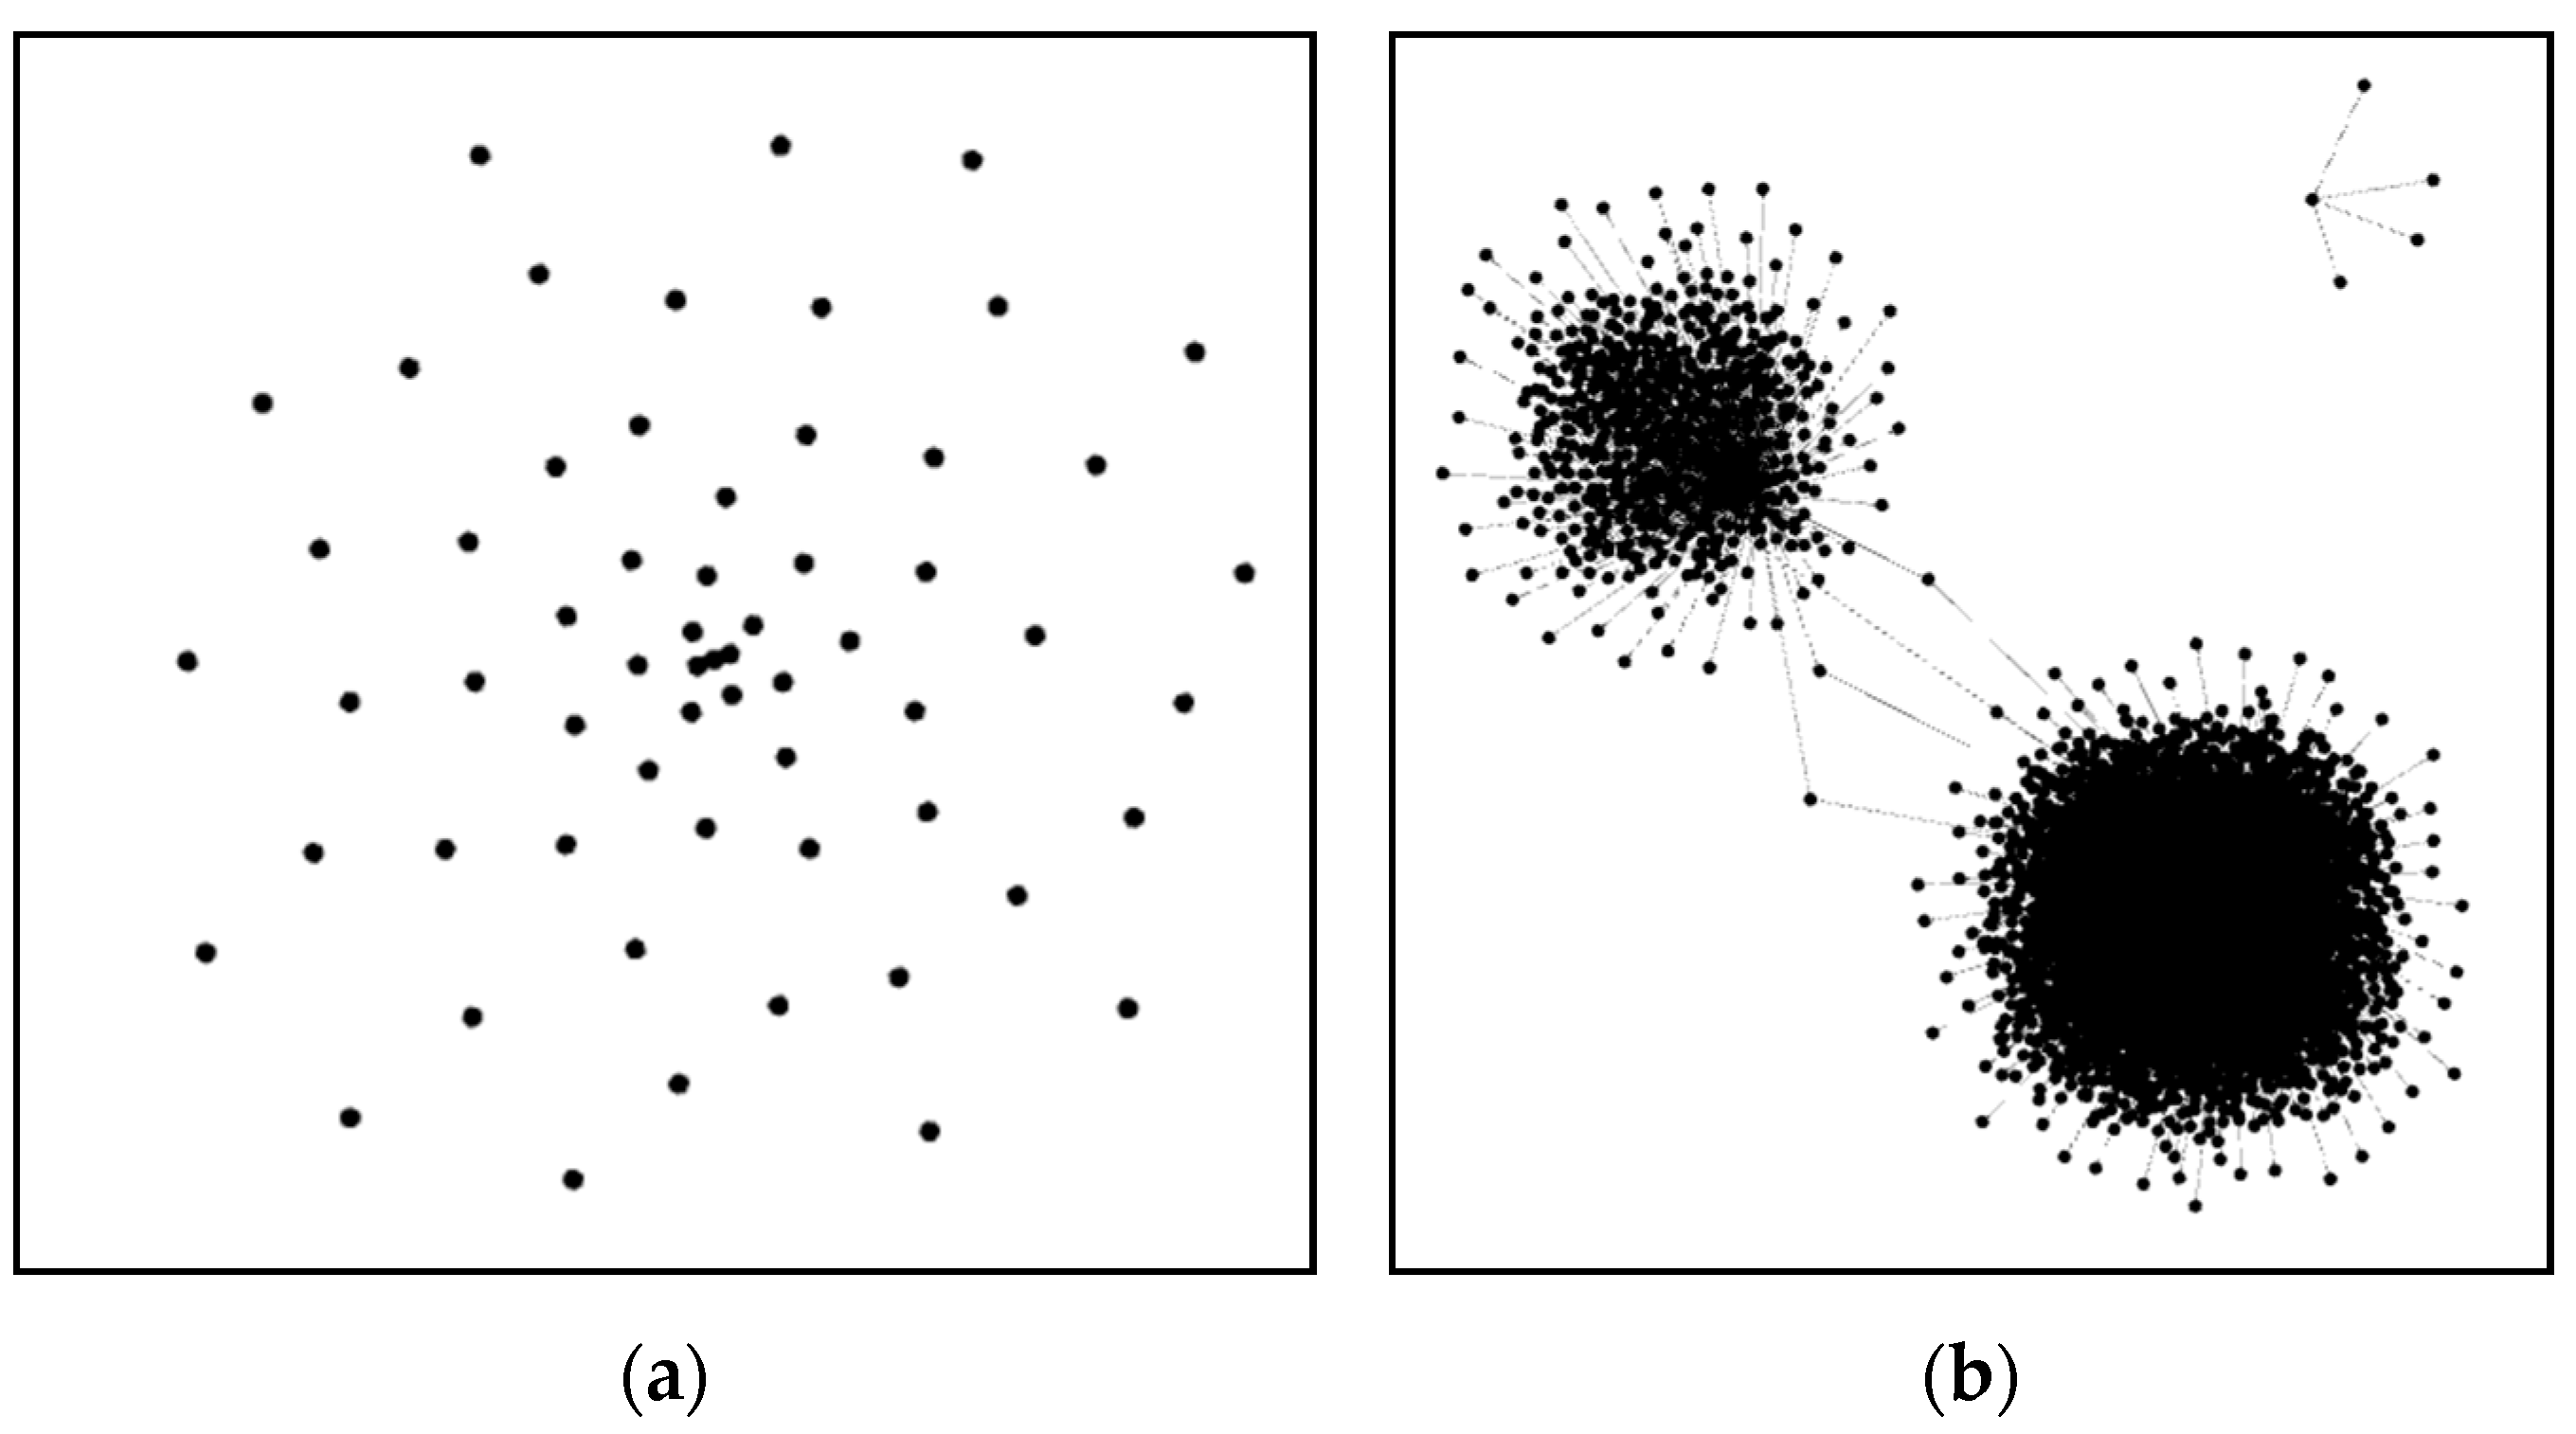
Figure 11.
(a) DC local (5040, 31, 24, 4, 3 and 2) (b) DC foreign Sankey plot without count equal to one (225, 153, 79, 62, 44, 3 and 2).
Figure 11.
(a) DC local (5040, 31, 24, 4, 3 and 2) (b) DC foreign Sankey plot without count equal to one (225, 153, 79, 62, 44, 3 and 2).
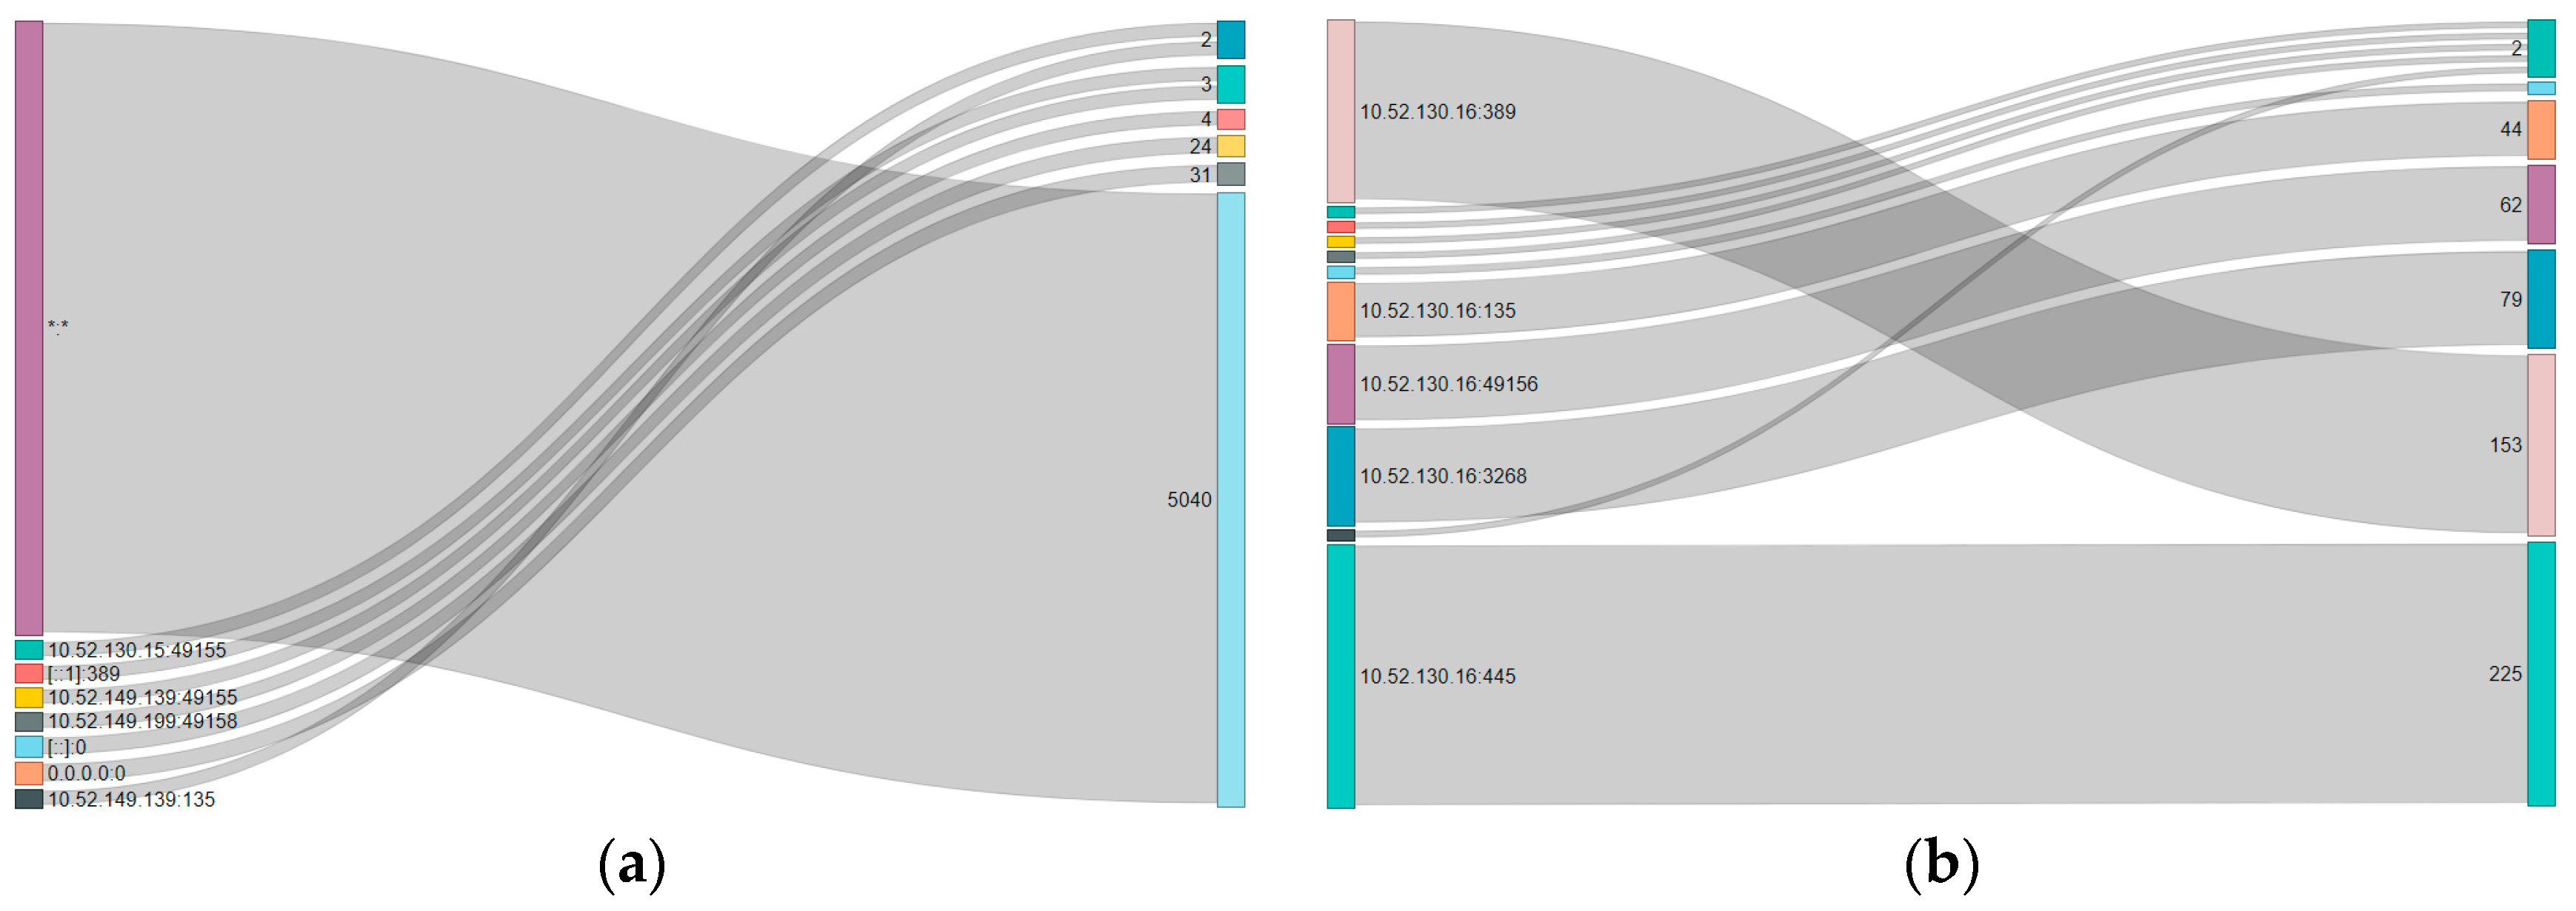
Figure 12.
(a) EPMA local Sankey plot without count equal to one (33, 22 and 14) (b) EPMA Foreign Sankey plot without count equal to one (6 and 2).
Figure 12.
(a) EPMA local Sankey plot without count equal to one (33, 22 and 14) (b) EPMA Foreign Sankey plot without count equal to one (6 and 2).
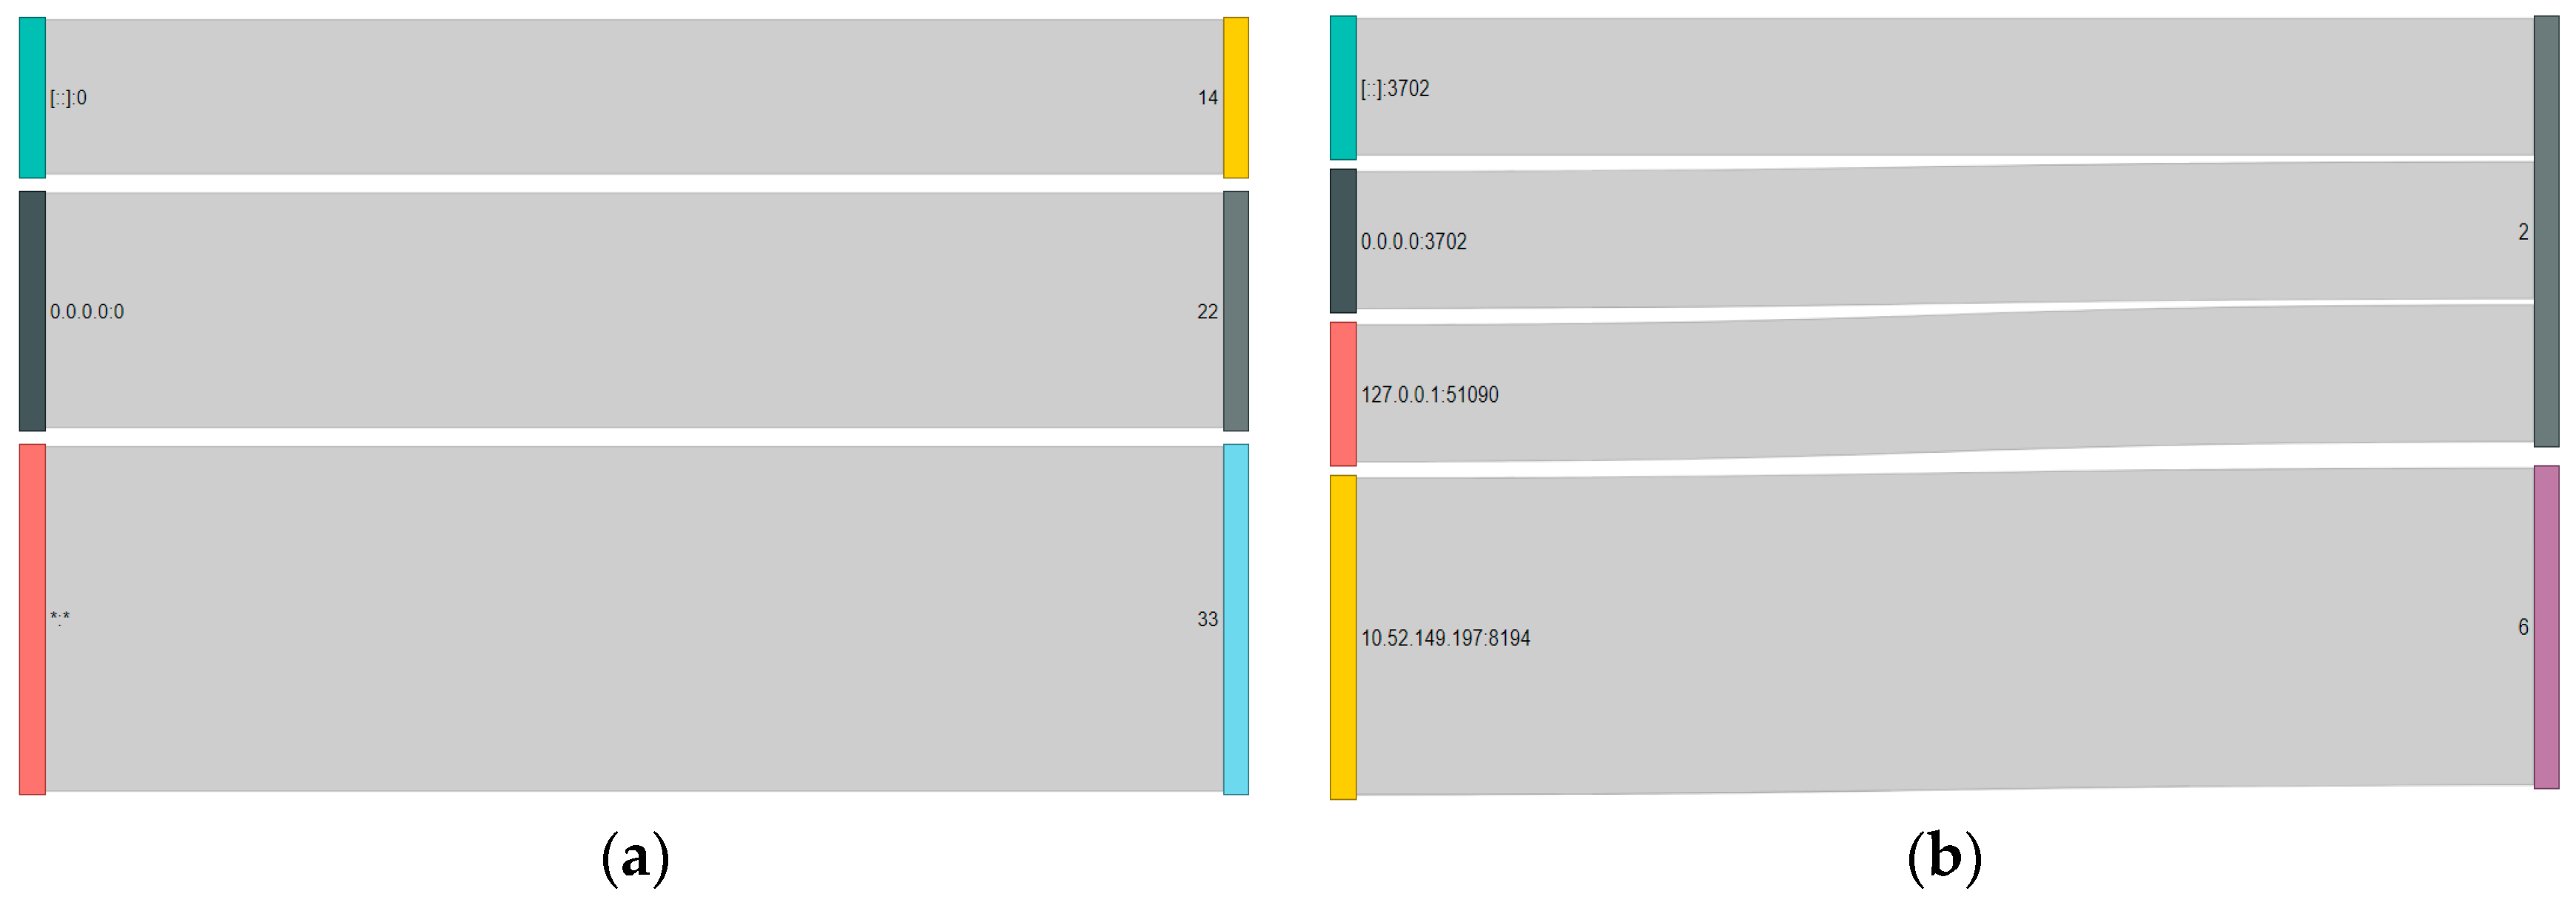
Figure 13.
(a) PAS local Sankey plot without count equal to one (32, 24, 23, 14 and 2): (b) PAS Foreign Sankey plot without count equal to one (64 and 1).
Figure 13.
(a) PAS local Sankey plot without count equal to one (32, 24, 23, 14 and 2): (b) PAS Foreign Sankey plot without count equal to one (64 and 1).

Table 1.
Transmission control protocol (TCP) socket connections sample data (anonymised).
| Active Directory Domain Controller | Electronic Prescribing System | ||||||
|---|---|---|---|---|---|---|---|
| Proto | Local address | Foreign address | State | Proto | Local address | Foreign address | State |
| TCP | 0.0.0.0:***** | 0.0.0.0:0 | LISTENING | TCP | 0.0.0.0:***** | 0.0.0.0:0 | LISTENING |
| TCP | **.**.***.16:53 | 0.0.0.0:0 | LISTENING | TCP | **.**.***.197:139 | 0.0.0.0:0 | LISTENING |
| TCP | **.**.***.16:135 | **.**.**.148:53173 | ESTABLISHED | TCP | **.**.***.197:8194 | **.**.***.133:50176 | ESTABLISHED |
| TCP | **.**.***.16:135 | **.**.***.51:63068 | ESTABLISHED | TCP | **.**.***.197:8194 | **.**.***.133:50326 | ESTABLISHED |
| TCP | **.**.***.16:135 | **.**.***.92:29550 | ESTABLISHED | TCP | **.**.***.197:8194 | **.**.***.133:50640 | ESTABLISHED |
Table 2.
Sankey diagram counts.
| IP Address | Sankey Diagram Counts | |||||||
|---|---|---|---|---|---|---|---|---|
| Domain Controller local | 5040 | 31 | 24 | 4 | 3 | 2 | 1 | |
| Domain Controller foreign | 225 | 153 | 79 | 62 | 44 | 3 | 2 | 1 |
| Electronic Patients and Medicines Administration local | 33 | 22 | 13 | 1 | ||||
| Electronic Patients and Medicines Administration foreign | 6 | 2 | 1 | |||||
| Patient Administration System local | 32 | 24 | 23 | 14 | 2 | 1 | ||
| Patient Administration System foreign | 64 | 2 | 1 | |||||
© 2019 by the authors. Licensee MDPI, Basel, Switzerland. This article is an open access article distributed under the terms and conditions of the Creative Commons Attribution (CC BY) license (http://creativecommons.org/licenses/by/4.0/).
Share and Cite
MDPI and ACS Style
Boddy, A.; Hurst, W.; Mackay, M.; El Rhalibi, A.; Baker, T.; Montañez, C.A.C. An Investigation into Healthcare-Data Patterns. Future Internet 2019, 11, 30. https://doi.org/10.3390/fi11020030
AMA Style
Boddy A, Hurst W, Mackay M, El Rhalibi A, Baker T, Montañez CAC. An Investigation into Healthcare-Data Patterns. Future Internet. 2019; 11(2):30. https://doi.org/10.3390/fi11020030
Chicago/Turabian StyleBoddy, Aaron, William Hurst, Michael Mackay, Abdennour El Rhalibi, Thar Baker, and Casimiro A. Curbelo Montañez. 2019. "An Investigation into Healthcare-Data Patterns" Future Internet 11, no. 2: 30. https://doi.org/10.3390/fi11020030
Note that from the first issue of 2016, this journal uses article numbers instead of page numbers. See further details here.