A simulation approach has been employed, in order to justify both the detection capability of the proposed system and the robustness of the protocol against malicious or accidental submission of invalid information.
6.1. Detection Capability
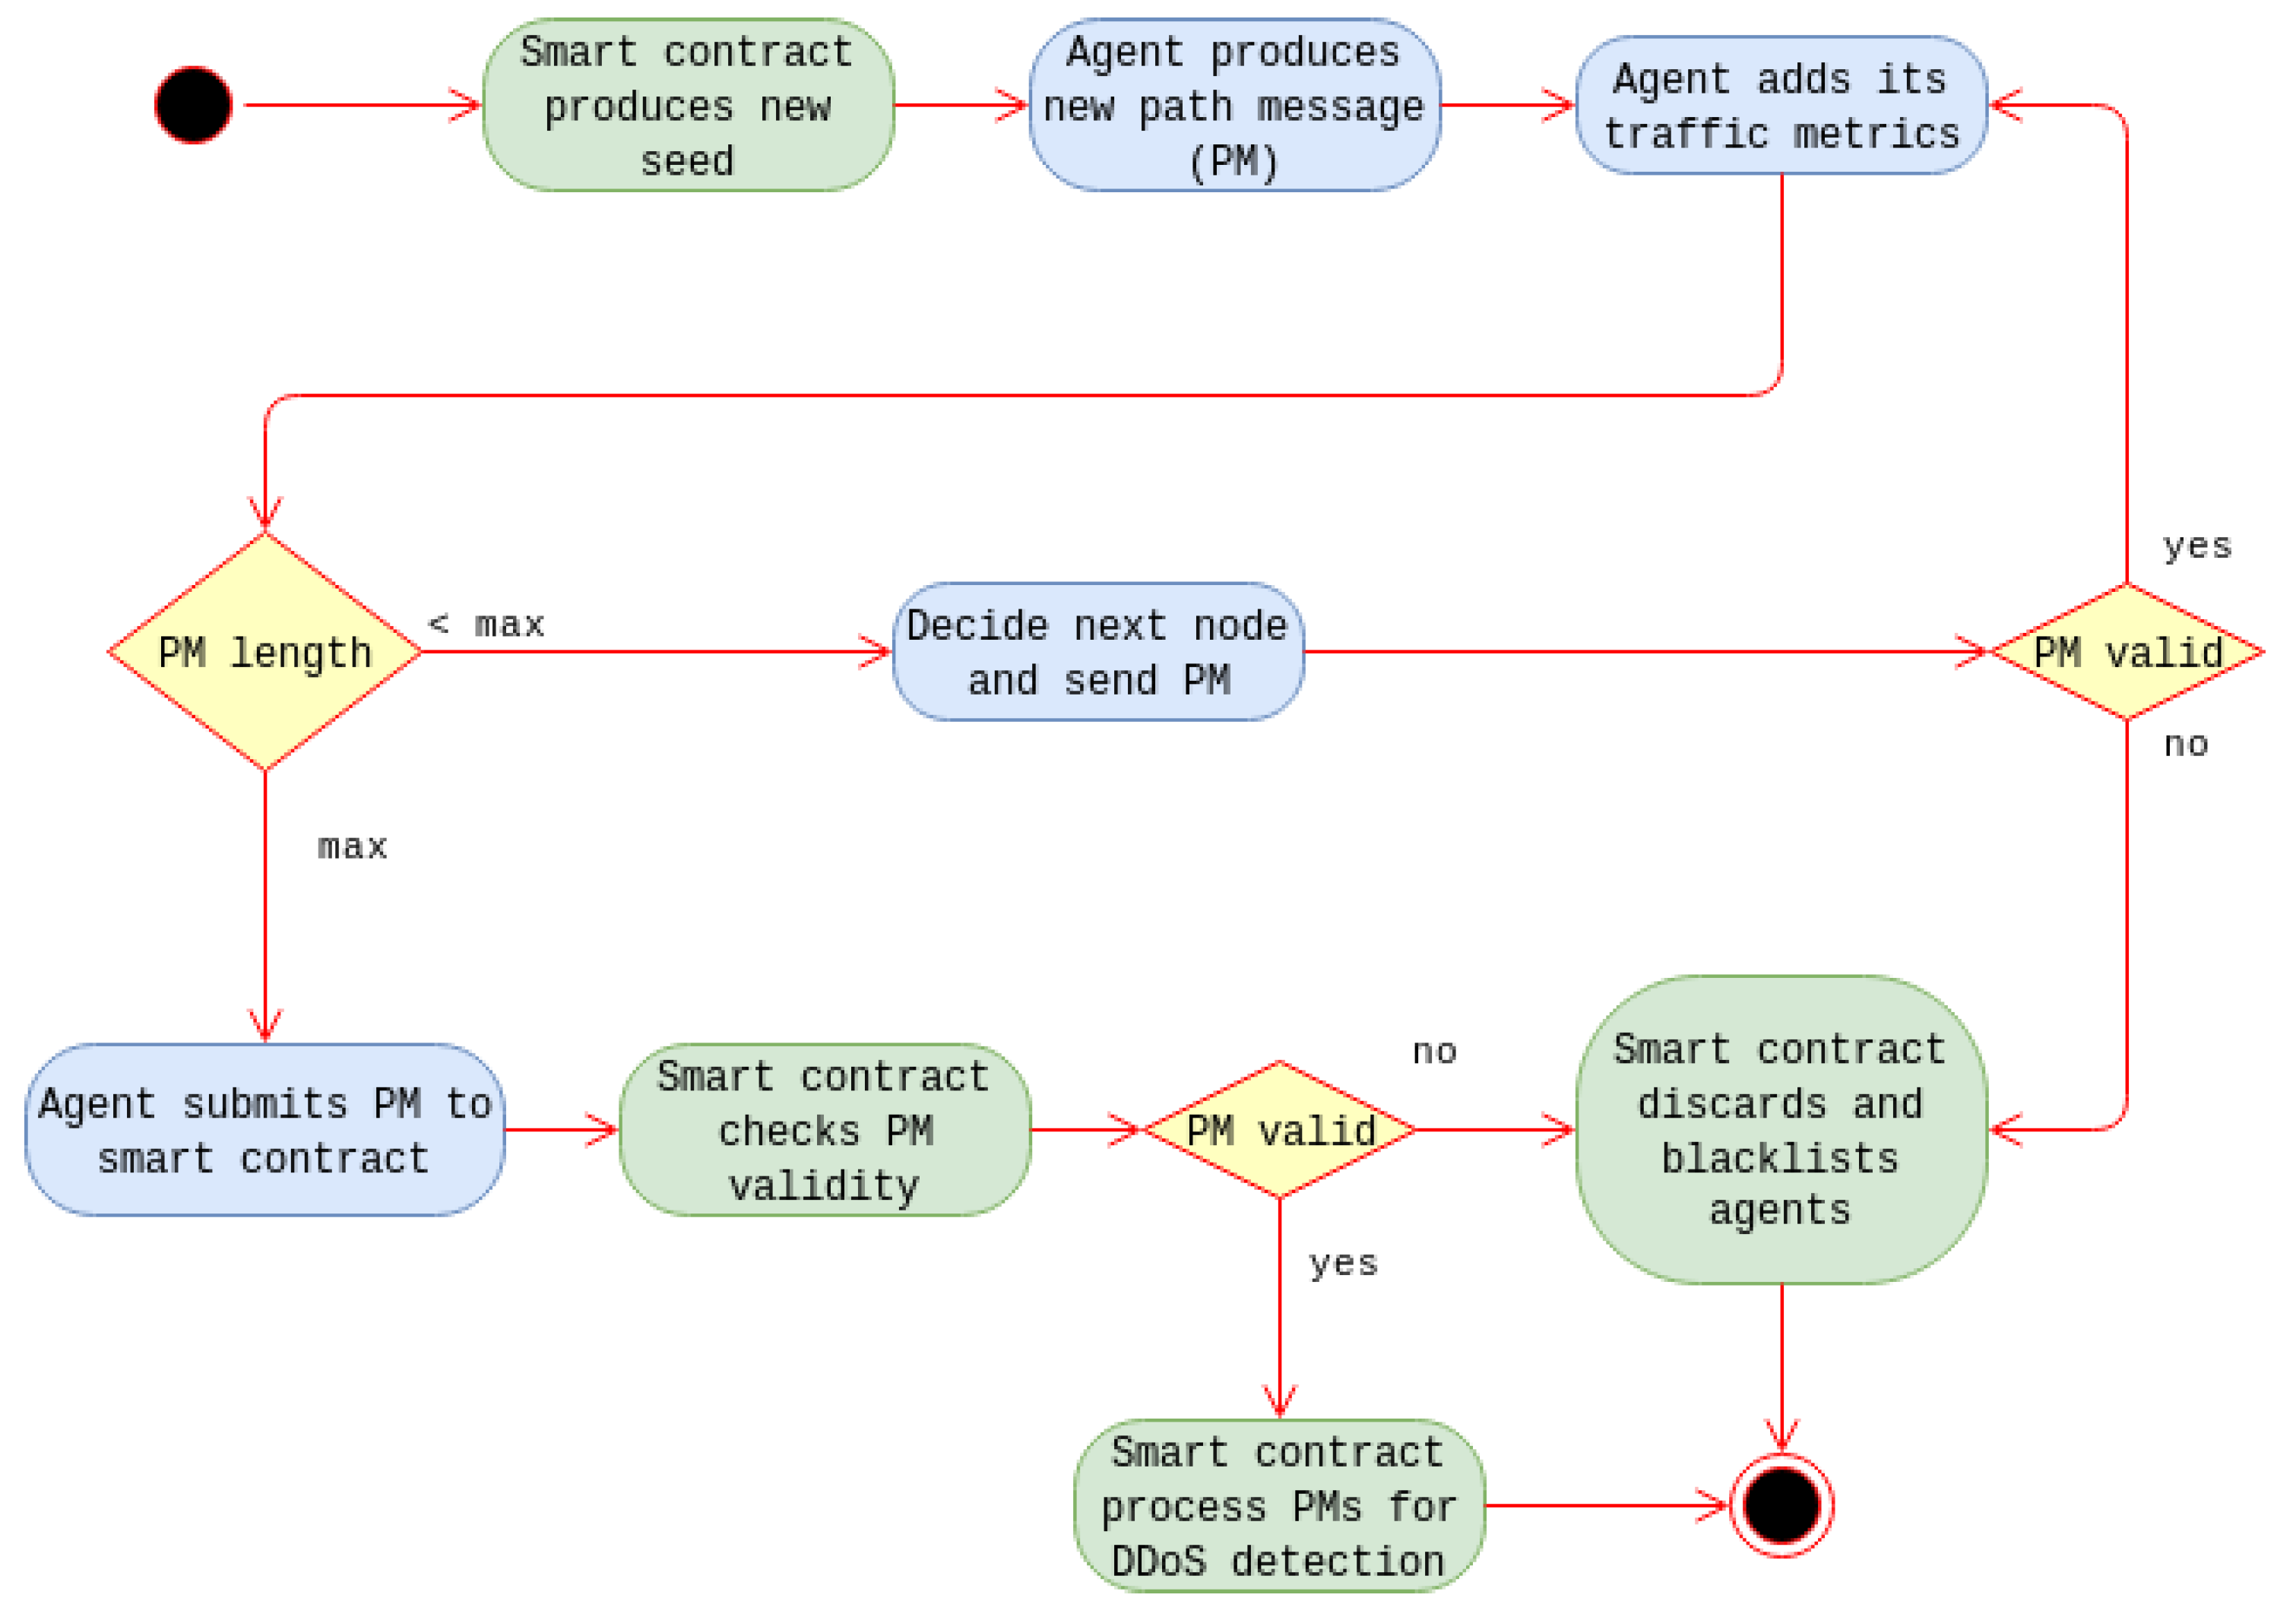
In order to justify that the detection of DDoS attacks is feasible through the use of the proposed methodology, a simulation was conducted. The simulation duration was split into 1000 continuous time slots through which agents calculate metrics and relay messages as discussed in
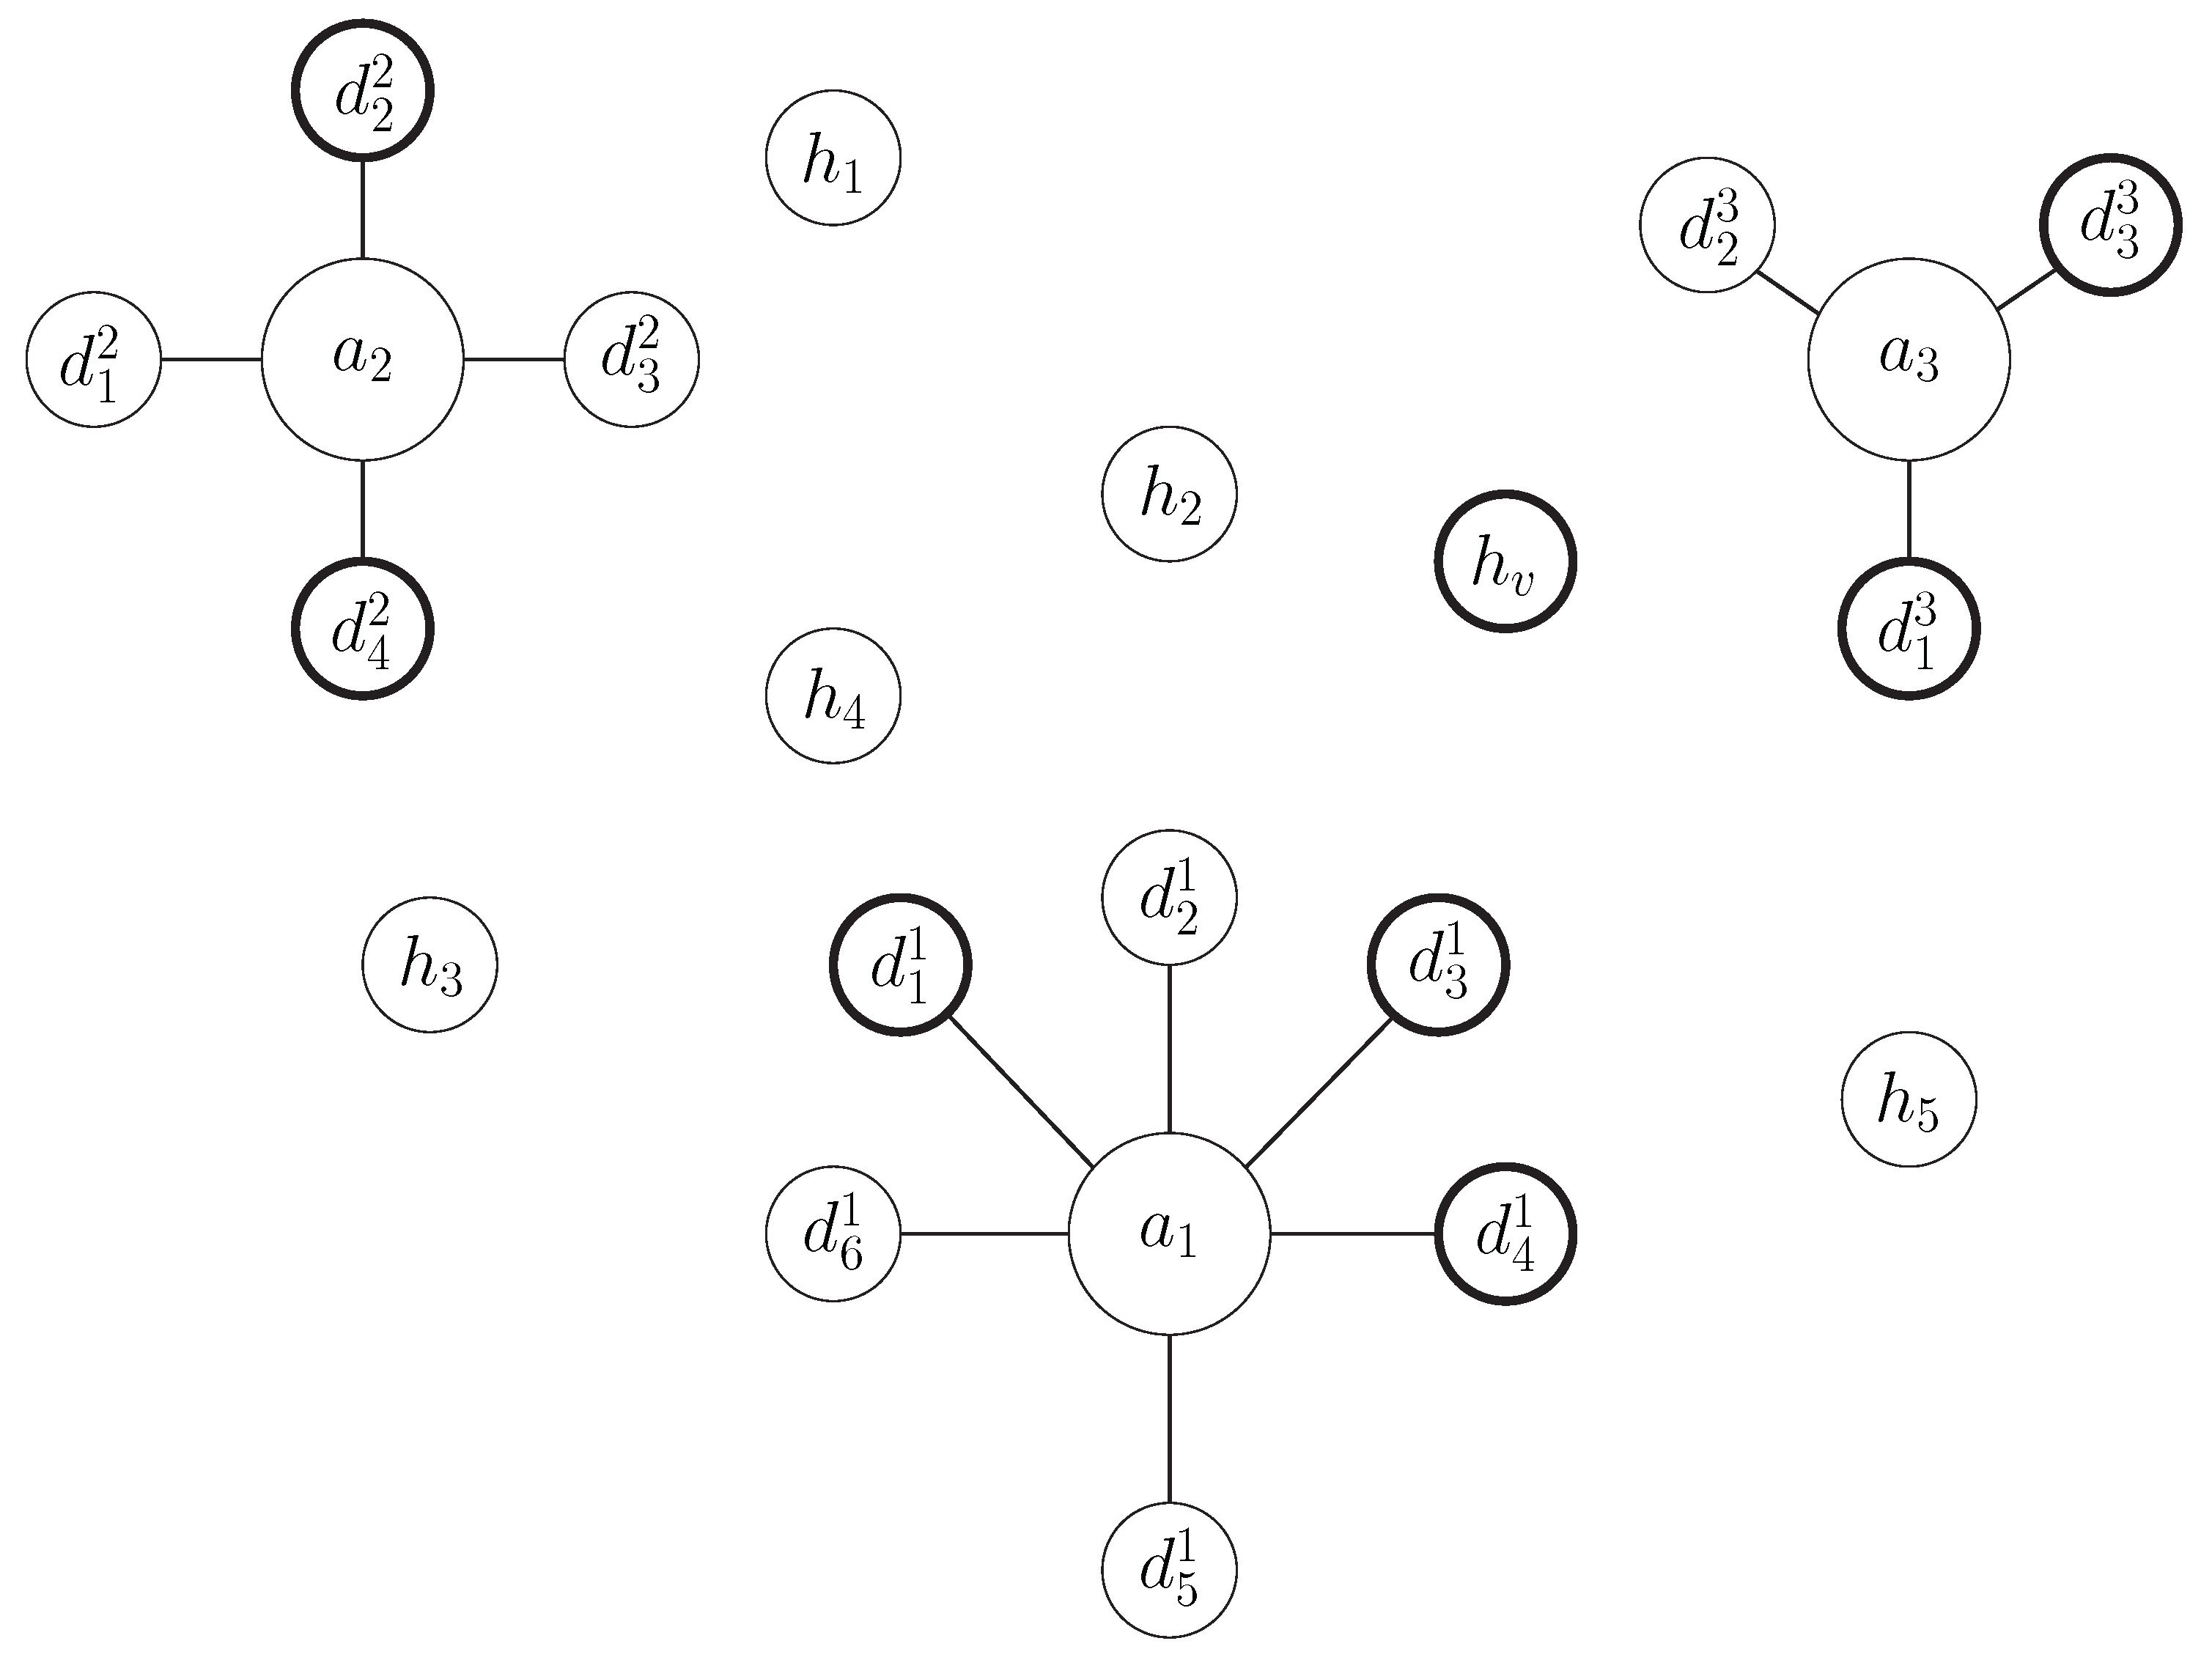
Section 4. A network consisting of both multiple IoT devices and ordinary hosts was created. IoT devices are grouped into different installations and are monitored by different agents accordingly. Some of the IoT devices are supposed to be infected and used as part of a botnet. This botnet executes a DDoS attack against a specific victim host at a specific time interval of the simulation (starts at time slot 500 and ends at time slot 750). The normal traffic of the network along with the traffic triggered by the DDoS attack are simulated at each agent of the system, according to the model analyzed in
Section 3. Then the methodology presented in
Section 4 is employed, in order to detect the DDoS attack.
The various simulation setups used have been designed by setting different values for the size of the network and the infection ratio (percentage of infected IoT devices). Specifically, nine different scenarios were studied according to the combinations of three different network sizes (5000, 7500 and 10,000 IoT devices) and three different infection ratios (1%, 3% and 5%). The hosts are equal in number to the IoT devices at each scenario, while the number of IoT devices at each installation (number of devices per agent) is approximately 10. Additionally, the generation probability of path-messages is set equal to .
Finally, different values for factor c (maximum path-message length) were tested, in order to check which is the most efficient approach. The different values used for factor c were , and .
Table 1,
Table 2,
Table 3 and
Table 4 depict the results obtained through the different simulation scenarios. In
Table 1 the average number of path-messages that exist in the network throughout the simulation is shown. The path-messages population significantly varies, for the different choices for the
c parameter value. This metric is important as it is crucial to succeed in detecting the attack by using the minimum possible volume of path-messages and avoiding the induction of unnecessary overhead into the system. As the value of
c factor grows, the average population of active path-messages increases.
Additionally, in order to present the detection capabilities of the methodology an assessment metric is presented in
Table 2,
Table 3 and
Table 4 for infection ratios 1%, 3%, and 5% respectively. Assessment metric used is the ratio of the highest observed
for the victim host over the highest observed
of all other hosts, throughout all path-messages processed. This assessment metric gives a good insight of the detection ability of the proposed methodology. The higher the assessment metric is, the easier it will be to detect the ongoing DDoS attack. This is only a general assessment metric and it is expected that the detection ratio values produced by Equation (
9) for
will be even higher, as they are locally calculated for each path-message.
By observing the results, it is obvious that it is feasible to detect the DDoS attack. Additionally, a common efficient value for c parameter for all cases is 0.3, as it generally gives quite satisfactory results. A shorter value choice would create shorter path-messages that would not collect information from the required number of agents, in order to detect the attack. On the other hand, larger values create longer path-messages, which seem to average out the information collected for the DDoS victim host.
Figure 4 depicts the values collected by all path-messages constructed in the case of 5000 IoT devices network with a 3% infection ratio. These values have been gathered for a coefficient value
. Records related to the actual DDoS victim host
are colored in red and can easily be identified from the rest of the records, which are colored in blue. From
Figure 4 it is obvious that during the attack the detection ratios calculated for victim host
tend to be significantly higher levels than the corresponding values for all other hosts.
The attack takes place in time window between time slot 500 and time slot 750. The results that correspond to this attack span in a larger time window up until time slot 900. This is normal as path-messages that have gathered information during the time of attack are evaluated after the end of the attack and produce corresponding results approximately up until time slot 900.
Consequently, the path-messages detection ratio values that have been filtered in from all agents are concatenated in chronological order. The produced set of records mainly contains reports concerning the host
.
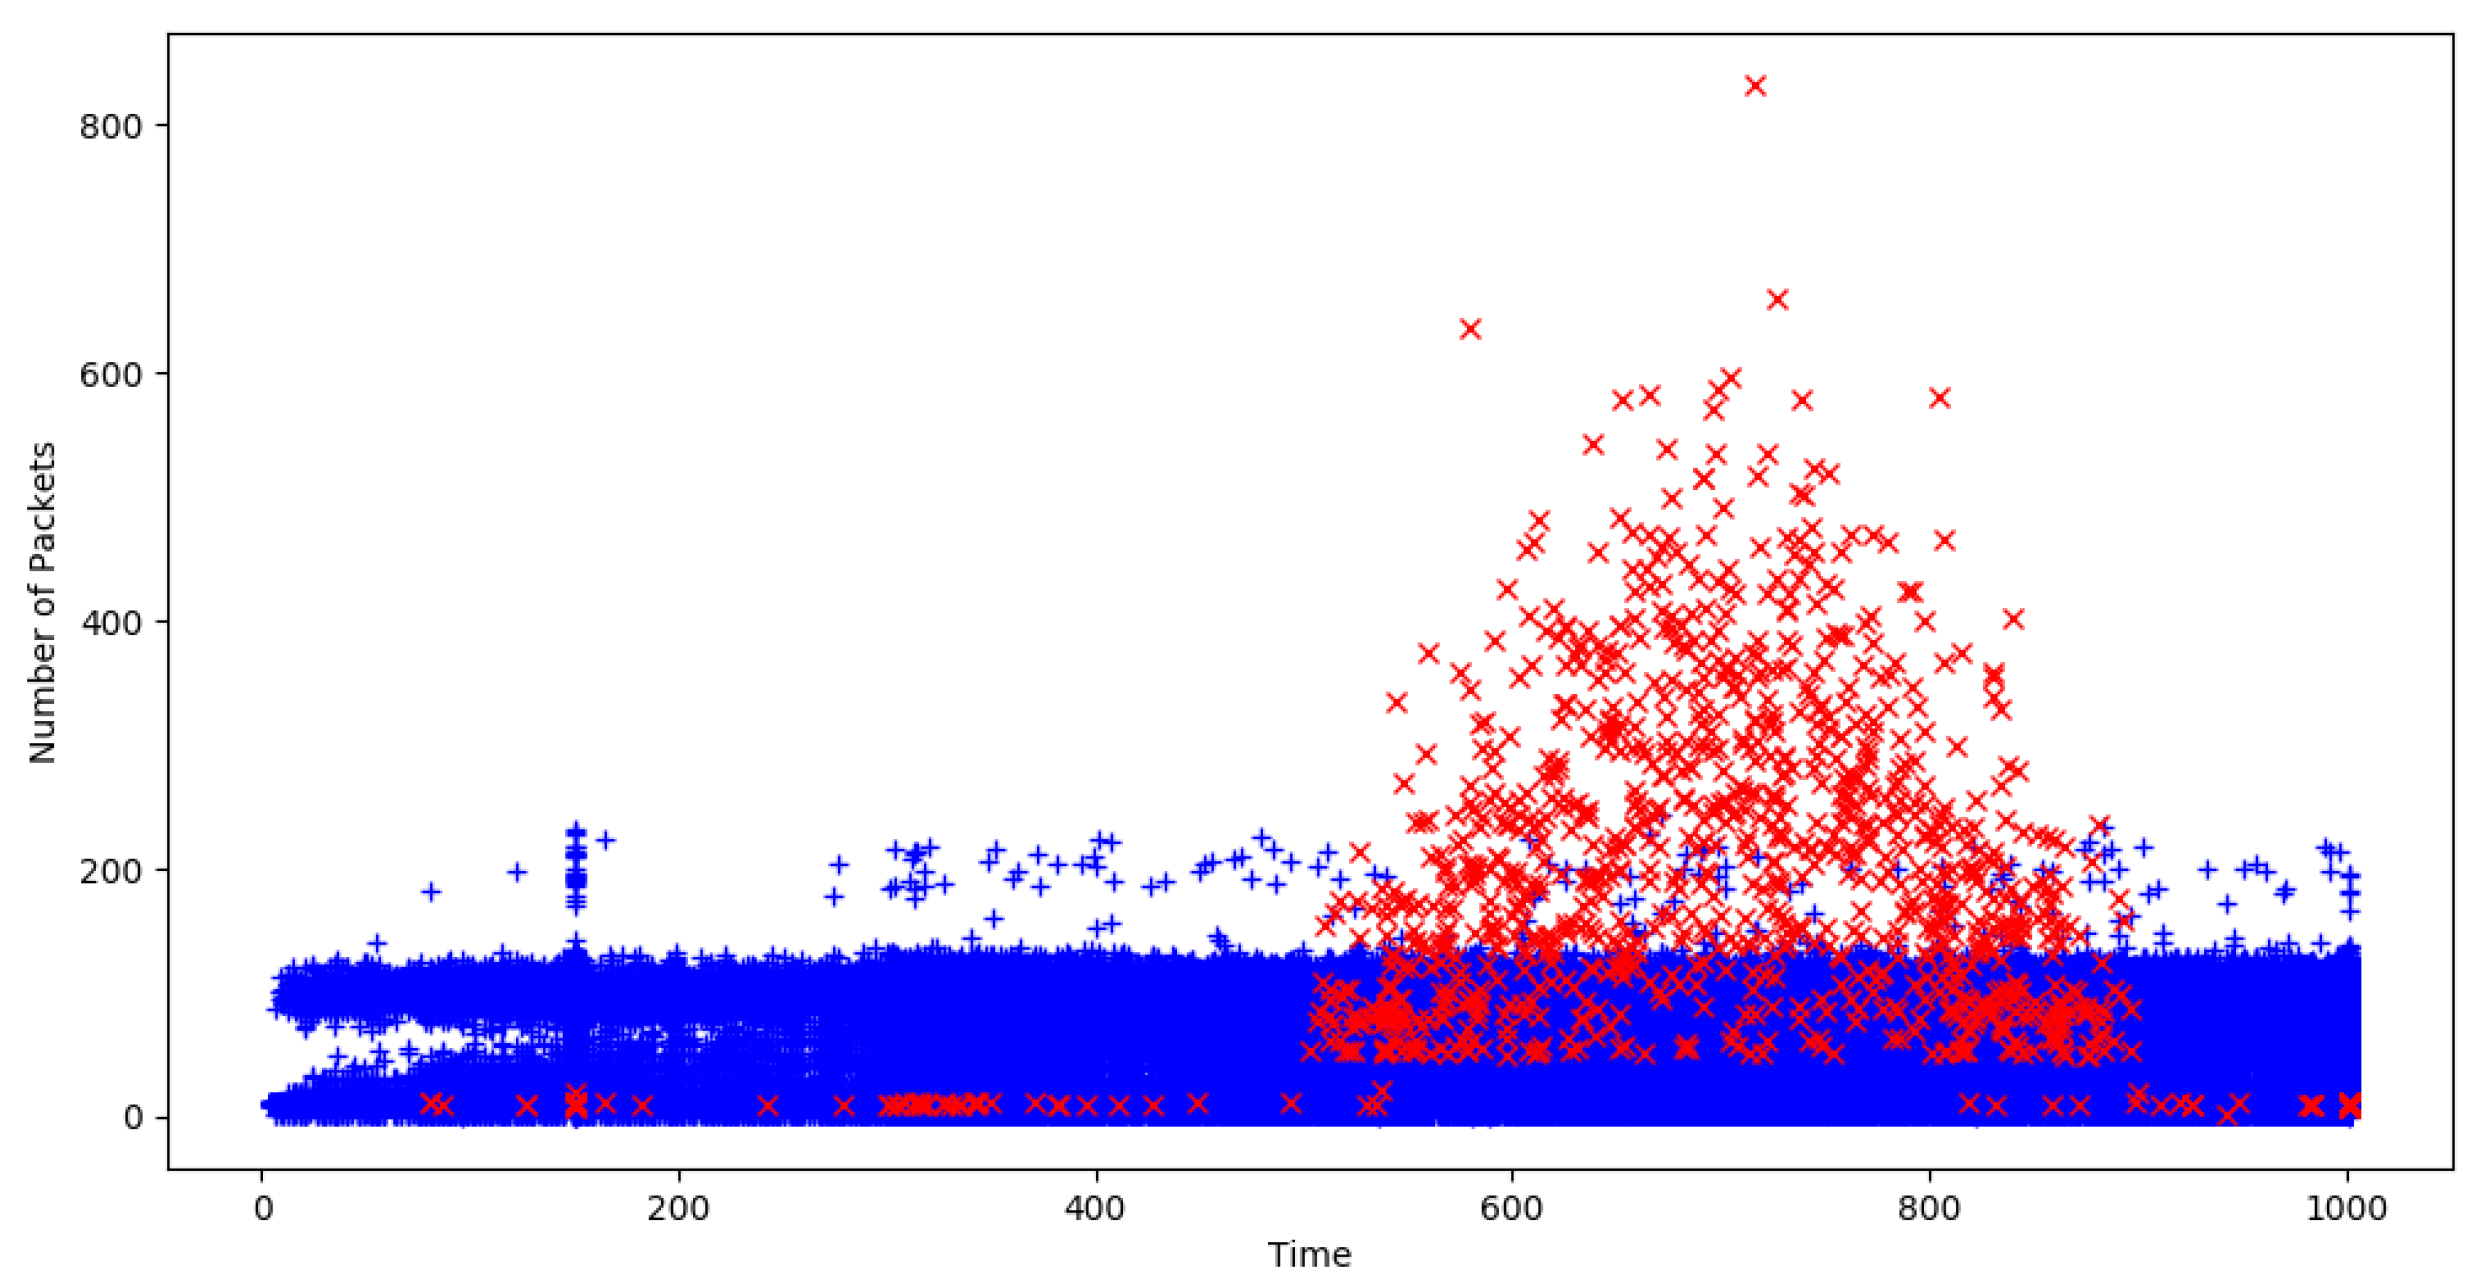
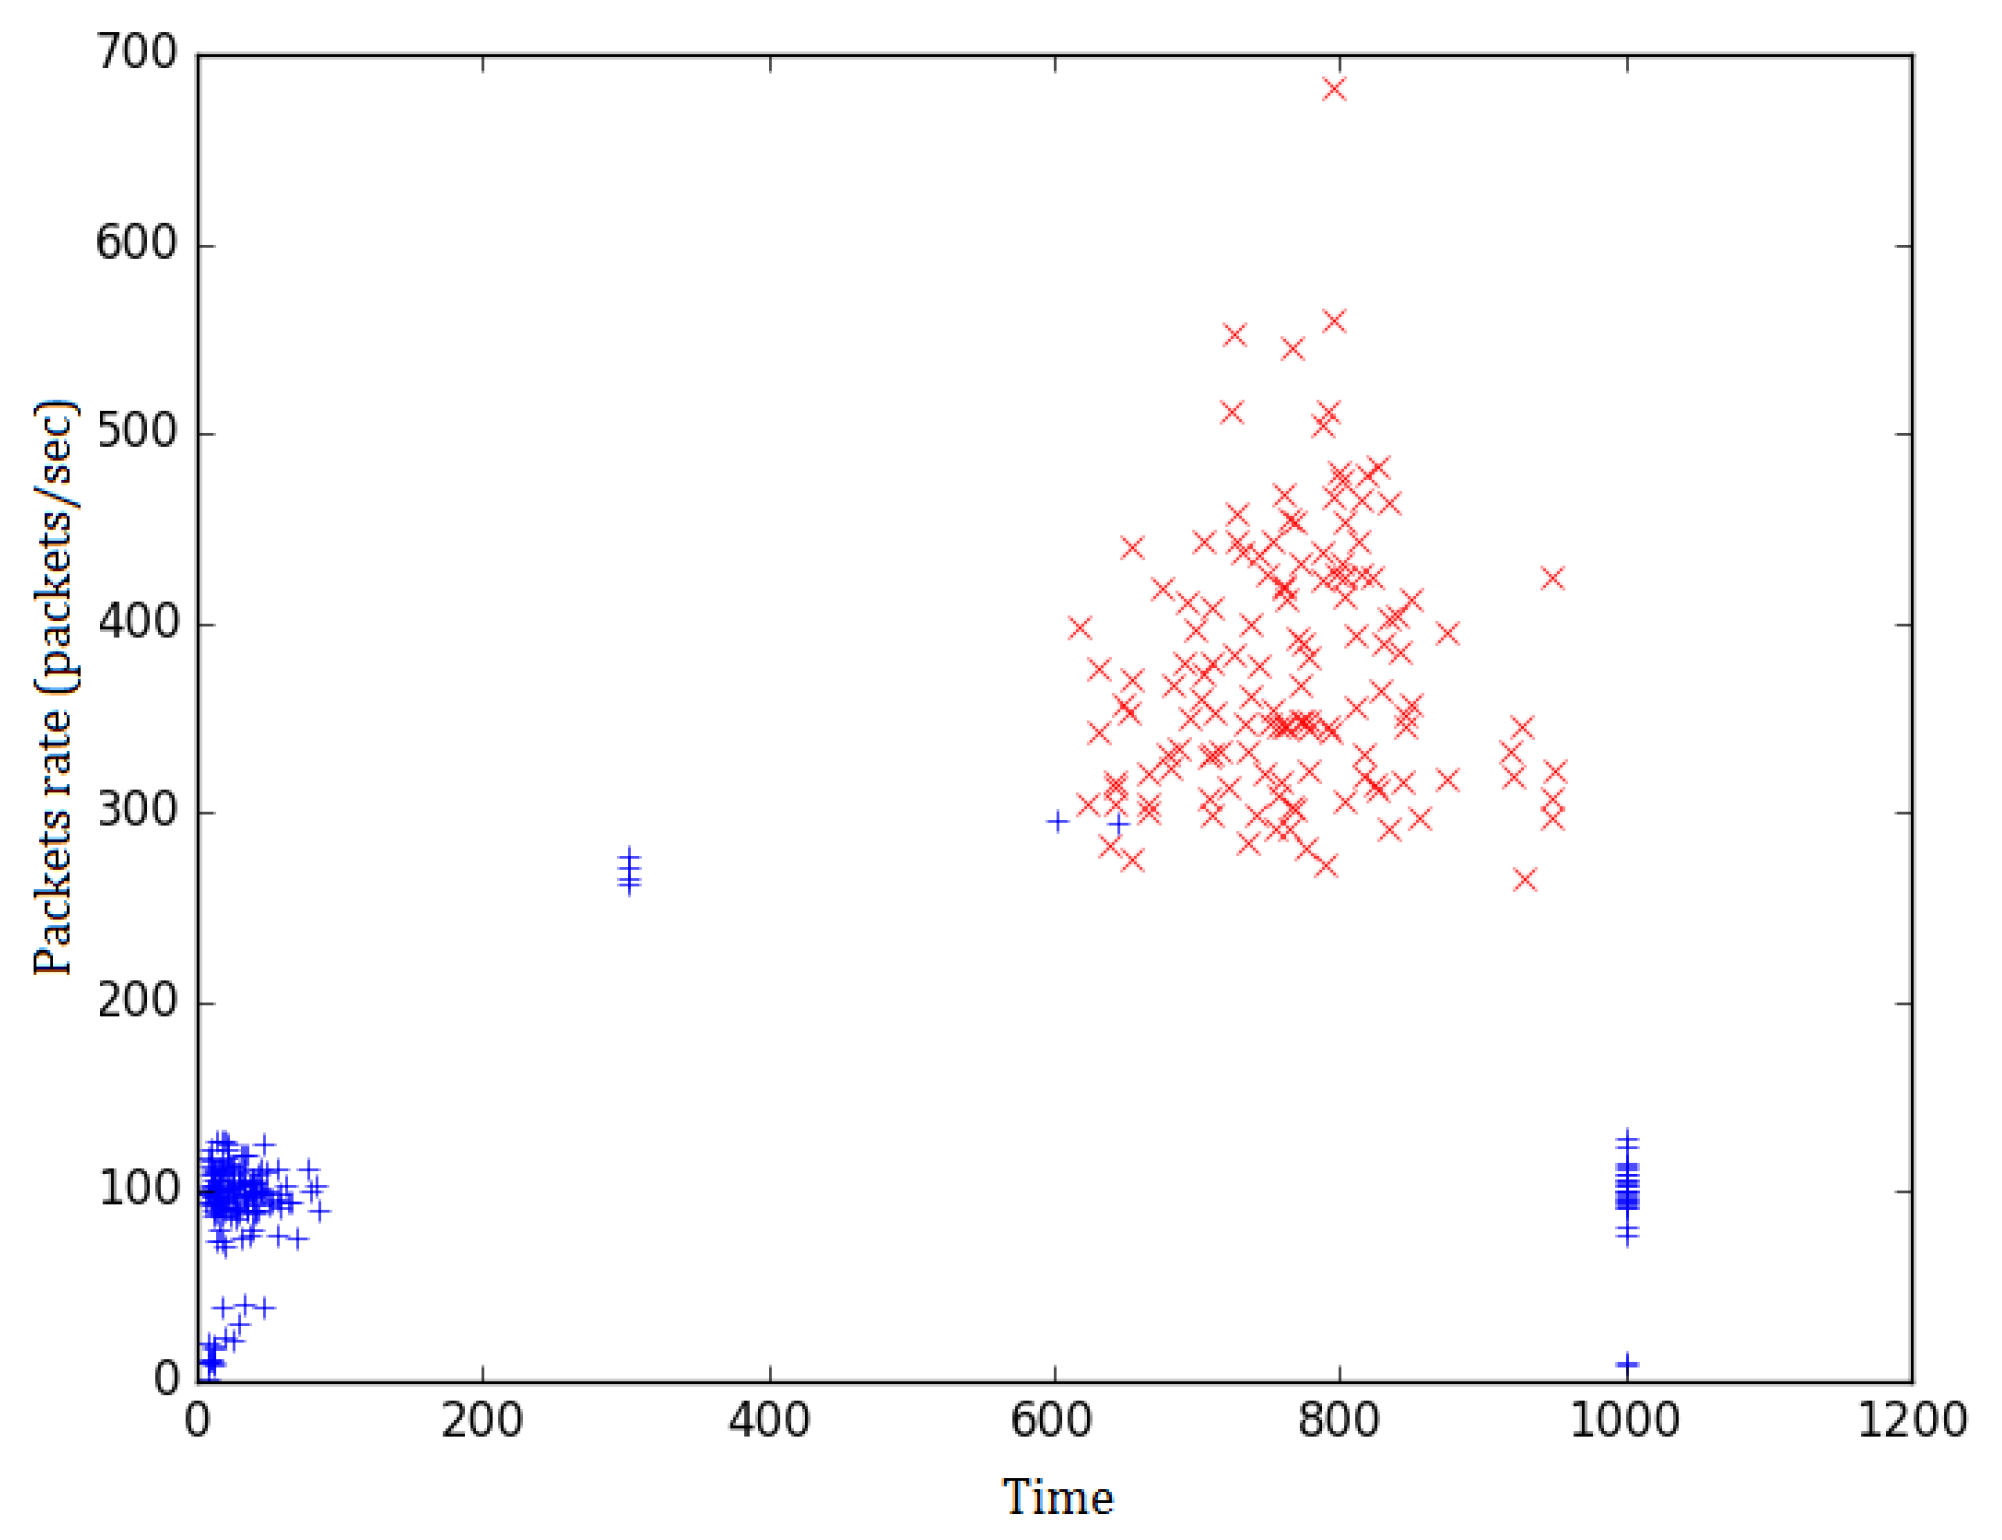
Figure 5 shows records for all filtered in path-messages for the 10,000 IoT devices network with a 1% infection ratio (
). It depicts all path-messages for which packet rate of the busiest host is at least double that of the next busiest host. The red marks correspond to path-messages of the actual victim host
, while the blue ones correspond to path-messages for any other host. It is spotted that during the attack most of the records filtered in relate to
. However, before and after the attack there are also multiple records for other hosts.
In order to efficiently detect a DDoS attack going on, a requirement for multiple consequent appearances (in consequent time slots) of the same host as candidate victim was discussed in
Section 4. This step practically discards all records, irrelevant to DDoS attacks, that have been filtered in due to extreme traffic conditions or any other cause. The consequent records requirement is valid only for records relevant to actual DDoS attacks. The records that satisfy this requirement are finally outputted as DDoS attacks alerts.
The relative tests have produced zero false positives in all scenarios. Regarding the infection ratio scenarios (the hardest case), the system has produced 89, 70, and 130 alerts for the 5000, 7500, and IoT devices’ networks. These results have been produced by setting a value of for the c coefficient.
It is evident that there may be rare cases where benign traffic may be identified as part of DDoS attacks. For example, in the case of IP cameras, if multiple deployed devices utilize a single common point of storage, then the traffic created by video streams uploading procedure resembles that of a DDoS attack against the storage point. In general, it is expected that such cases are rare and do not exhibit the dispersion of source nodes that actual DDoS attacks do. Limited source hosts dispersion means limited probability of triggering an alert. Of course, such cases cannot be neglected, but on the other hand, hosts that are expected to receive such traffic are known beforehand and a list of such hosts may be maintained. In practice, alerts can be filtered as they are produced, according to the candidate victim host or agents may use a white-list of hosts expected to receive multiple connections and exclude corresponding traffic metrics from path-messages.
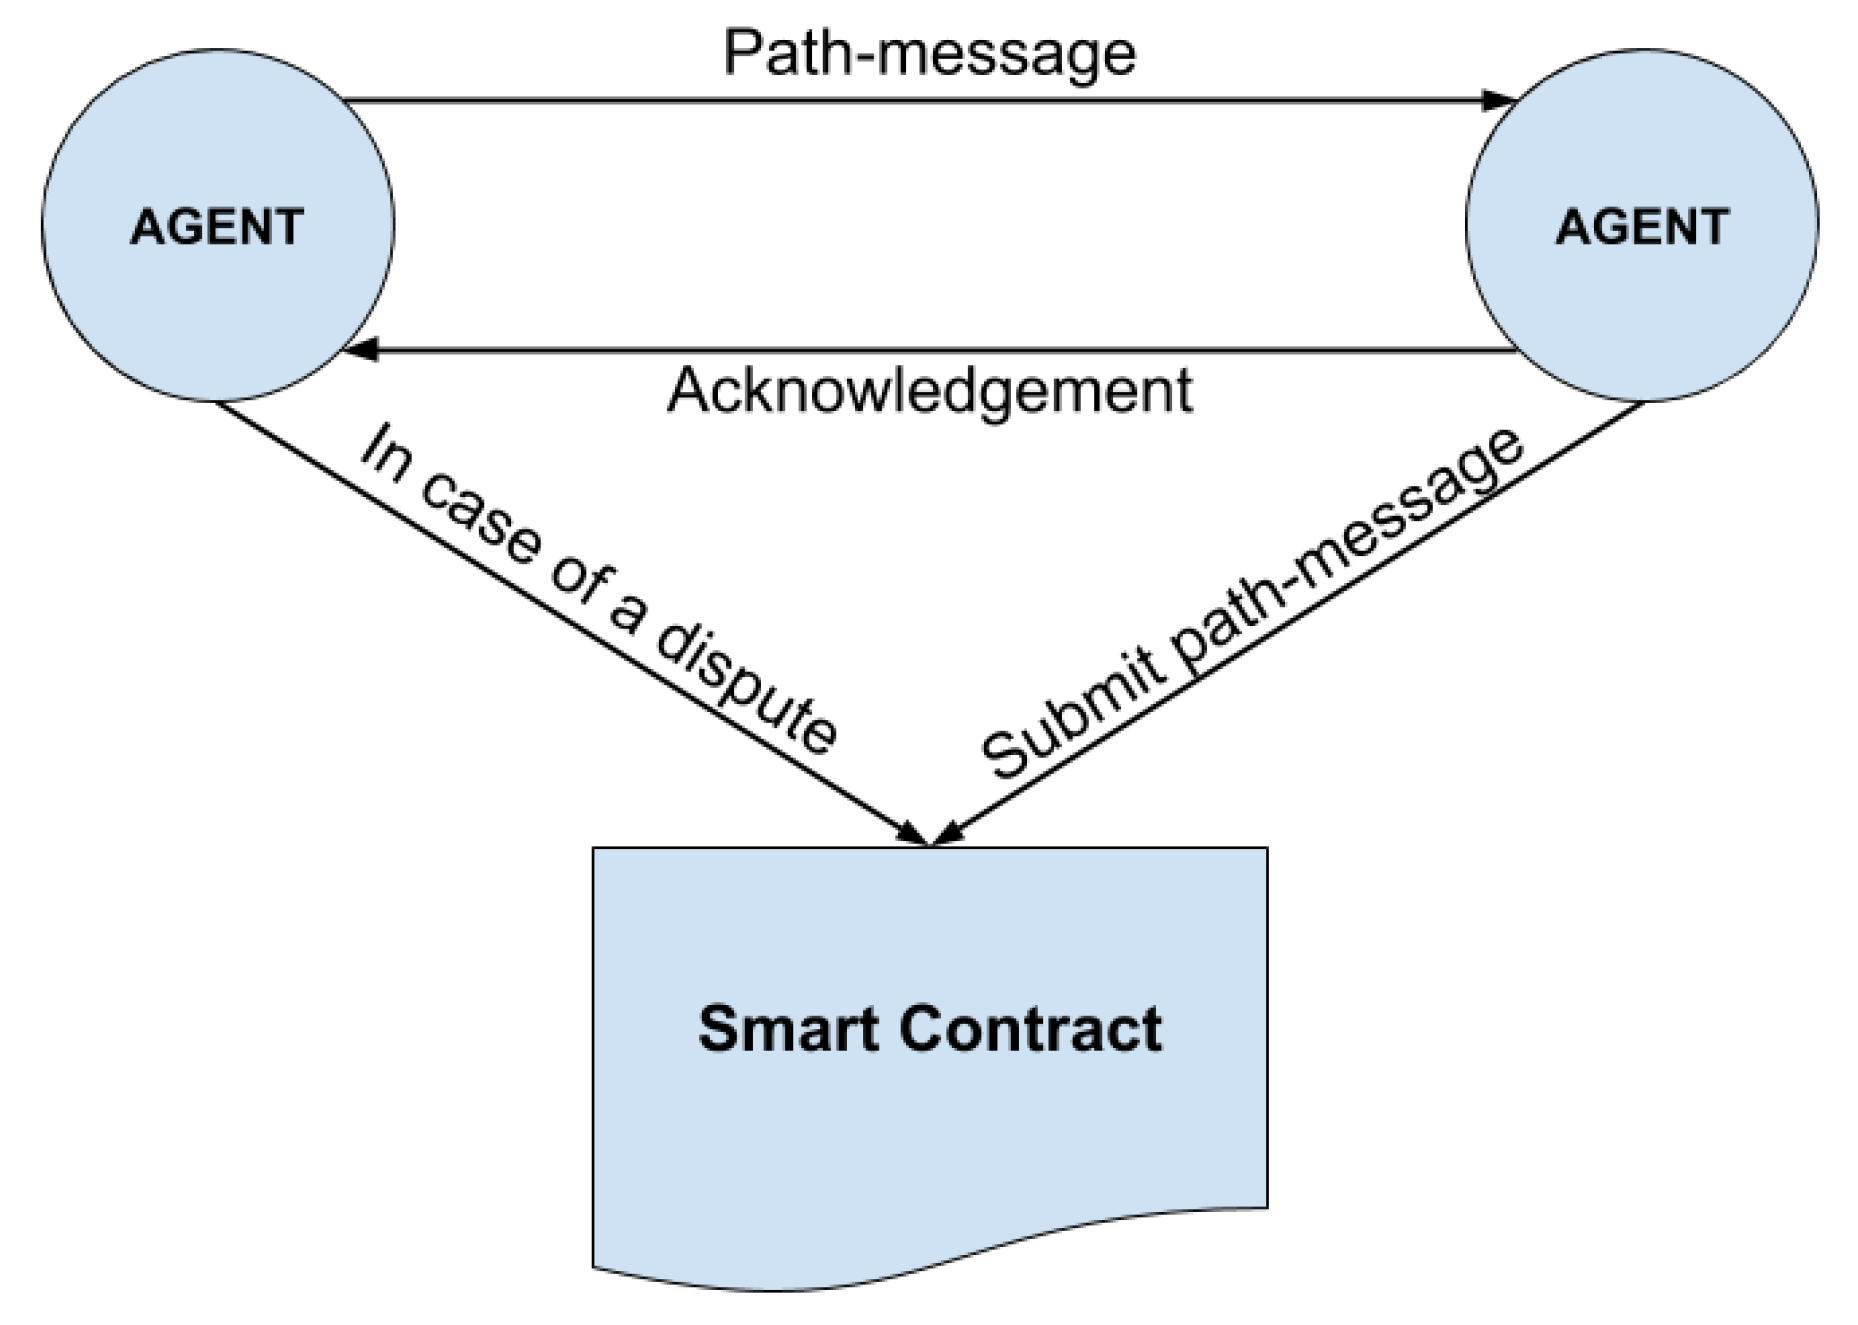
6.2. Robustness Against Malicious Nodes
In order to validate the blockchain based collaboration protocol against agents that intentionally or accidentally submit false information, recurring simulation experiments have been conducted. A blockchain platform agnostic consensus protocol (i.e., it can be implemented on any blockchain platform that provides smart contracts support e.g., Ethereum, Hyperledger, Corda) is proposed. As the protocol failure probability is independent of any specific implementation of the blockchain, we have conducted a simulation experiment to evaluate this probability. The goal was to estimate the probability that information of a path-message has been falsified, without this being noticed, under specific parameters such as:
nodes population
malicious nodes population
maximum path-message length
number of state checks committed at each agent
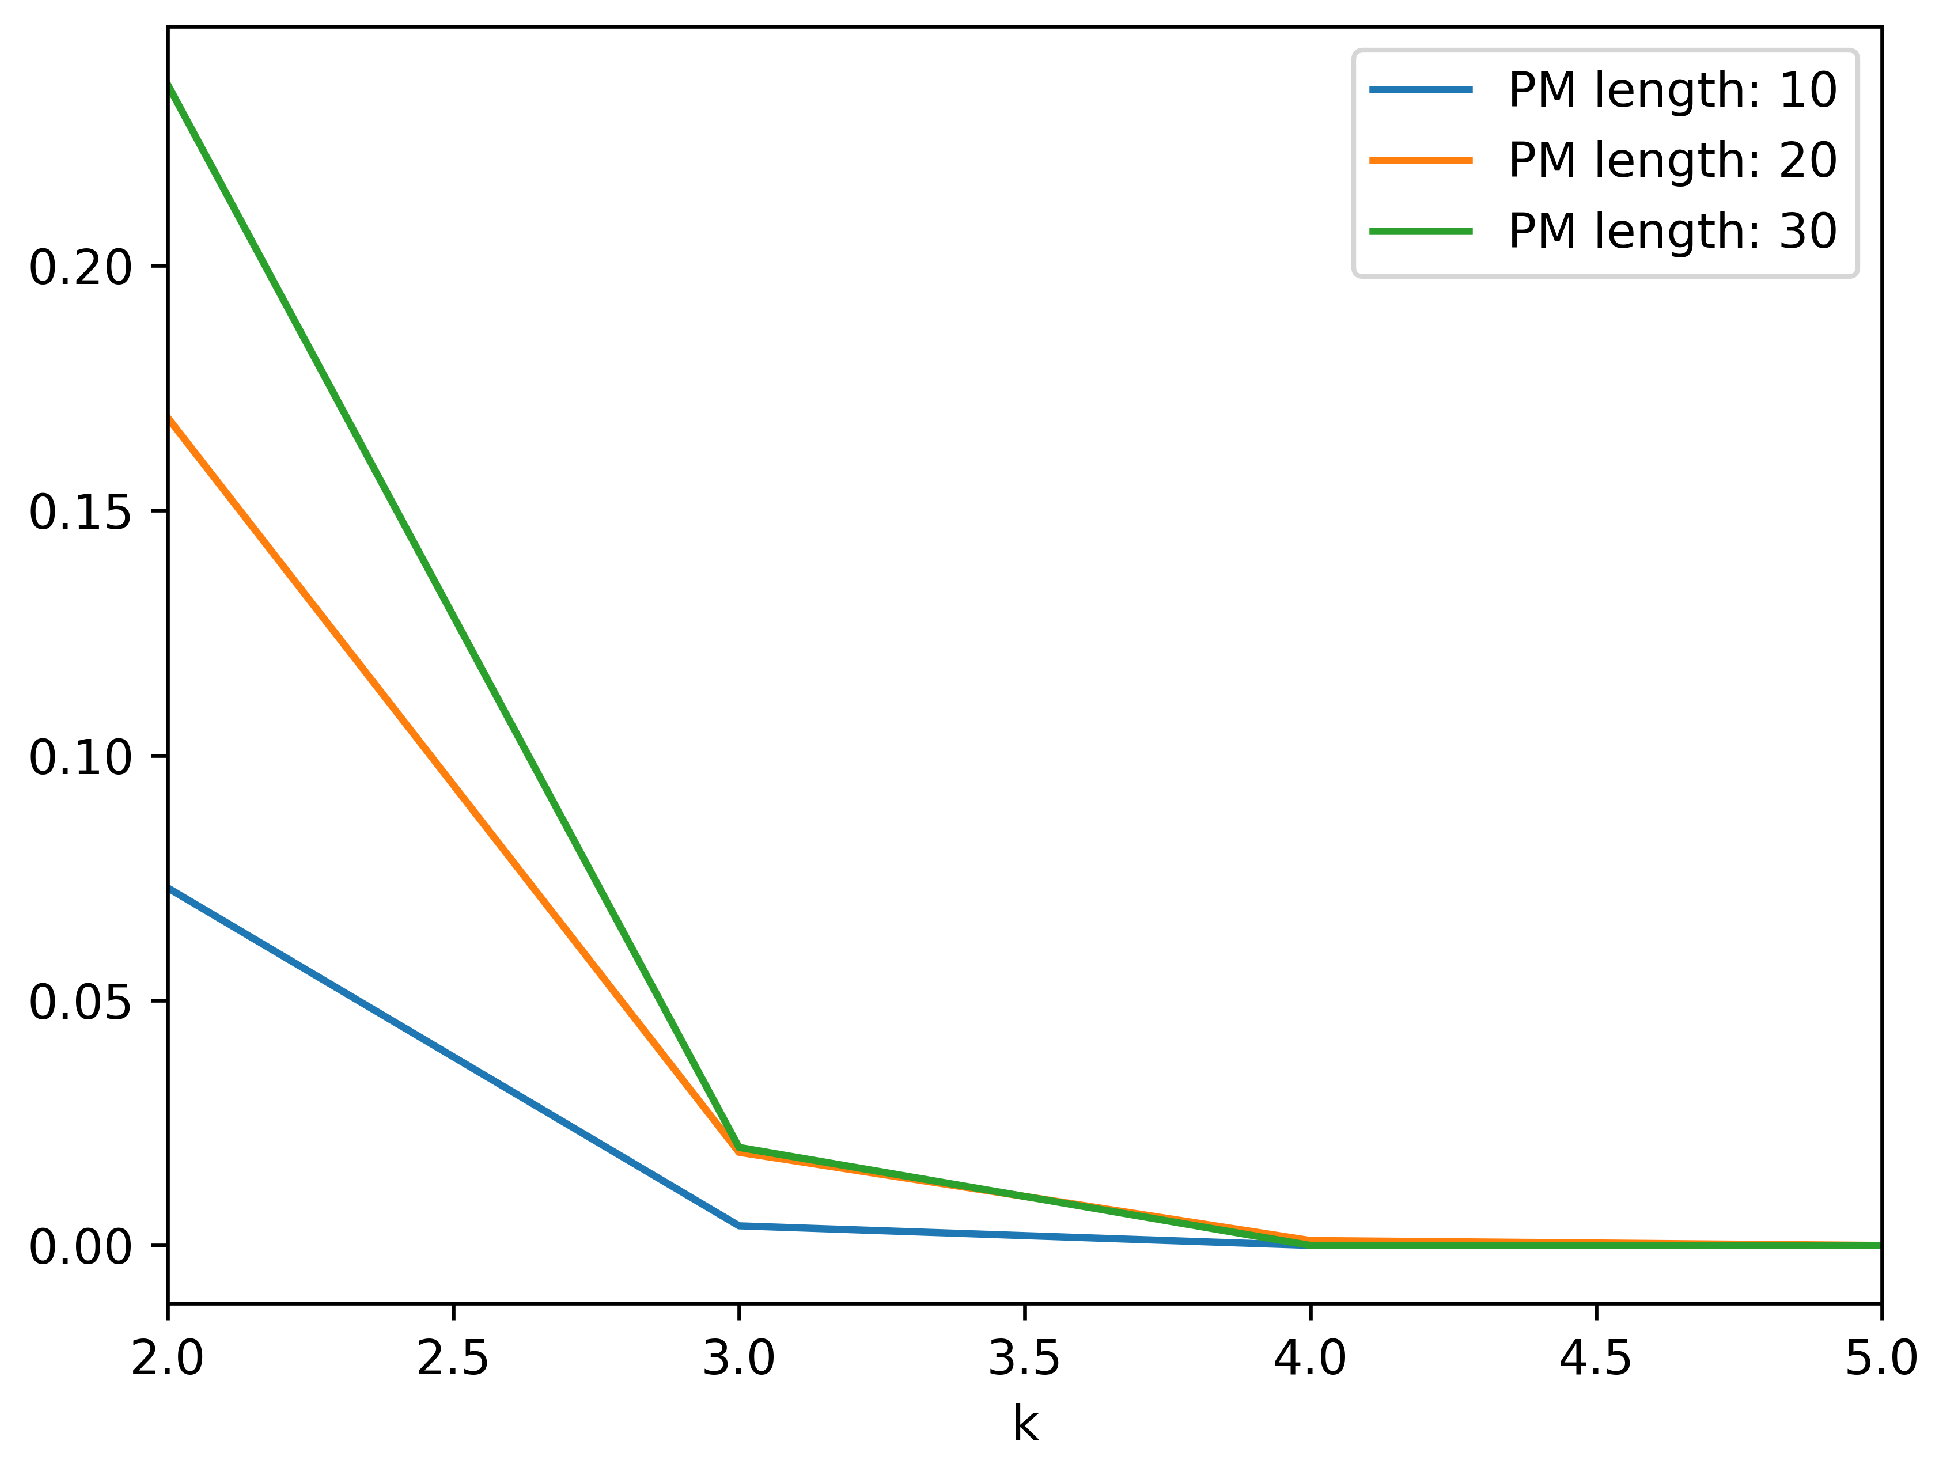
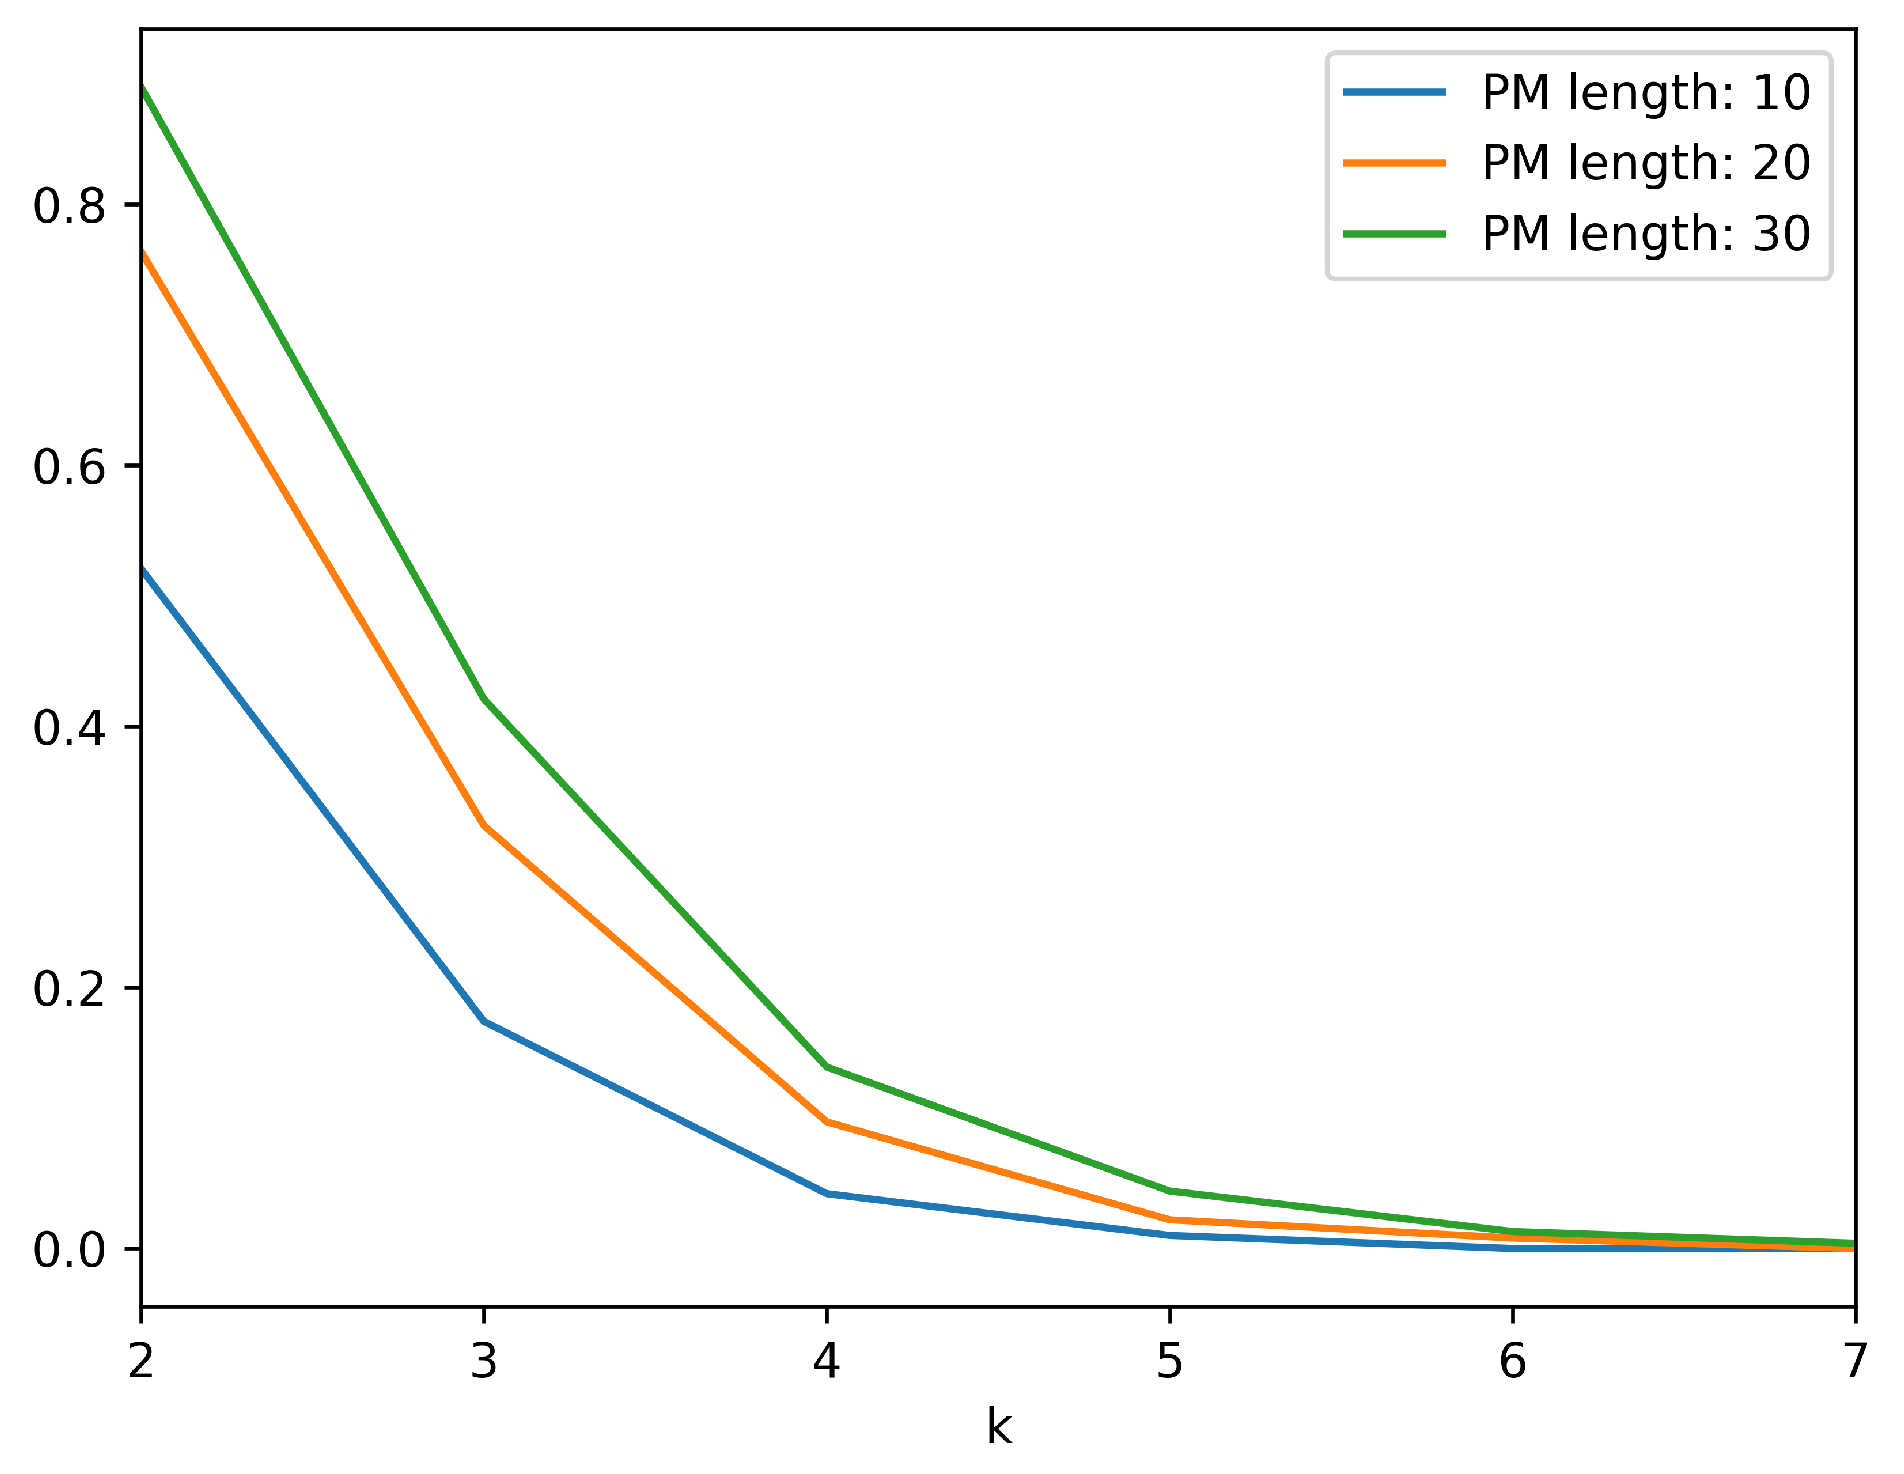
For all scenarios, the population of nodes was set to 1000. The population of malicious nodes has been varied between 100, 200, and 300. The maximum path-message length has been set to values 10, 20, and 30. The number of checks committed at each agent have been gradually increased from 2 to 7. The resulting probabilities that malicious nodes can falsify information while going undetected are depicted in
Table 5,
Table 6 and
Table 7 for all different parameters’ values. Specifically, each table shows the results obtained for each one of the three different cases with respect to the population of malicious nodes.
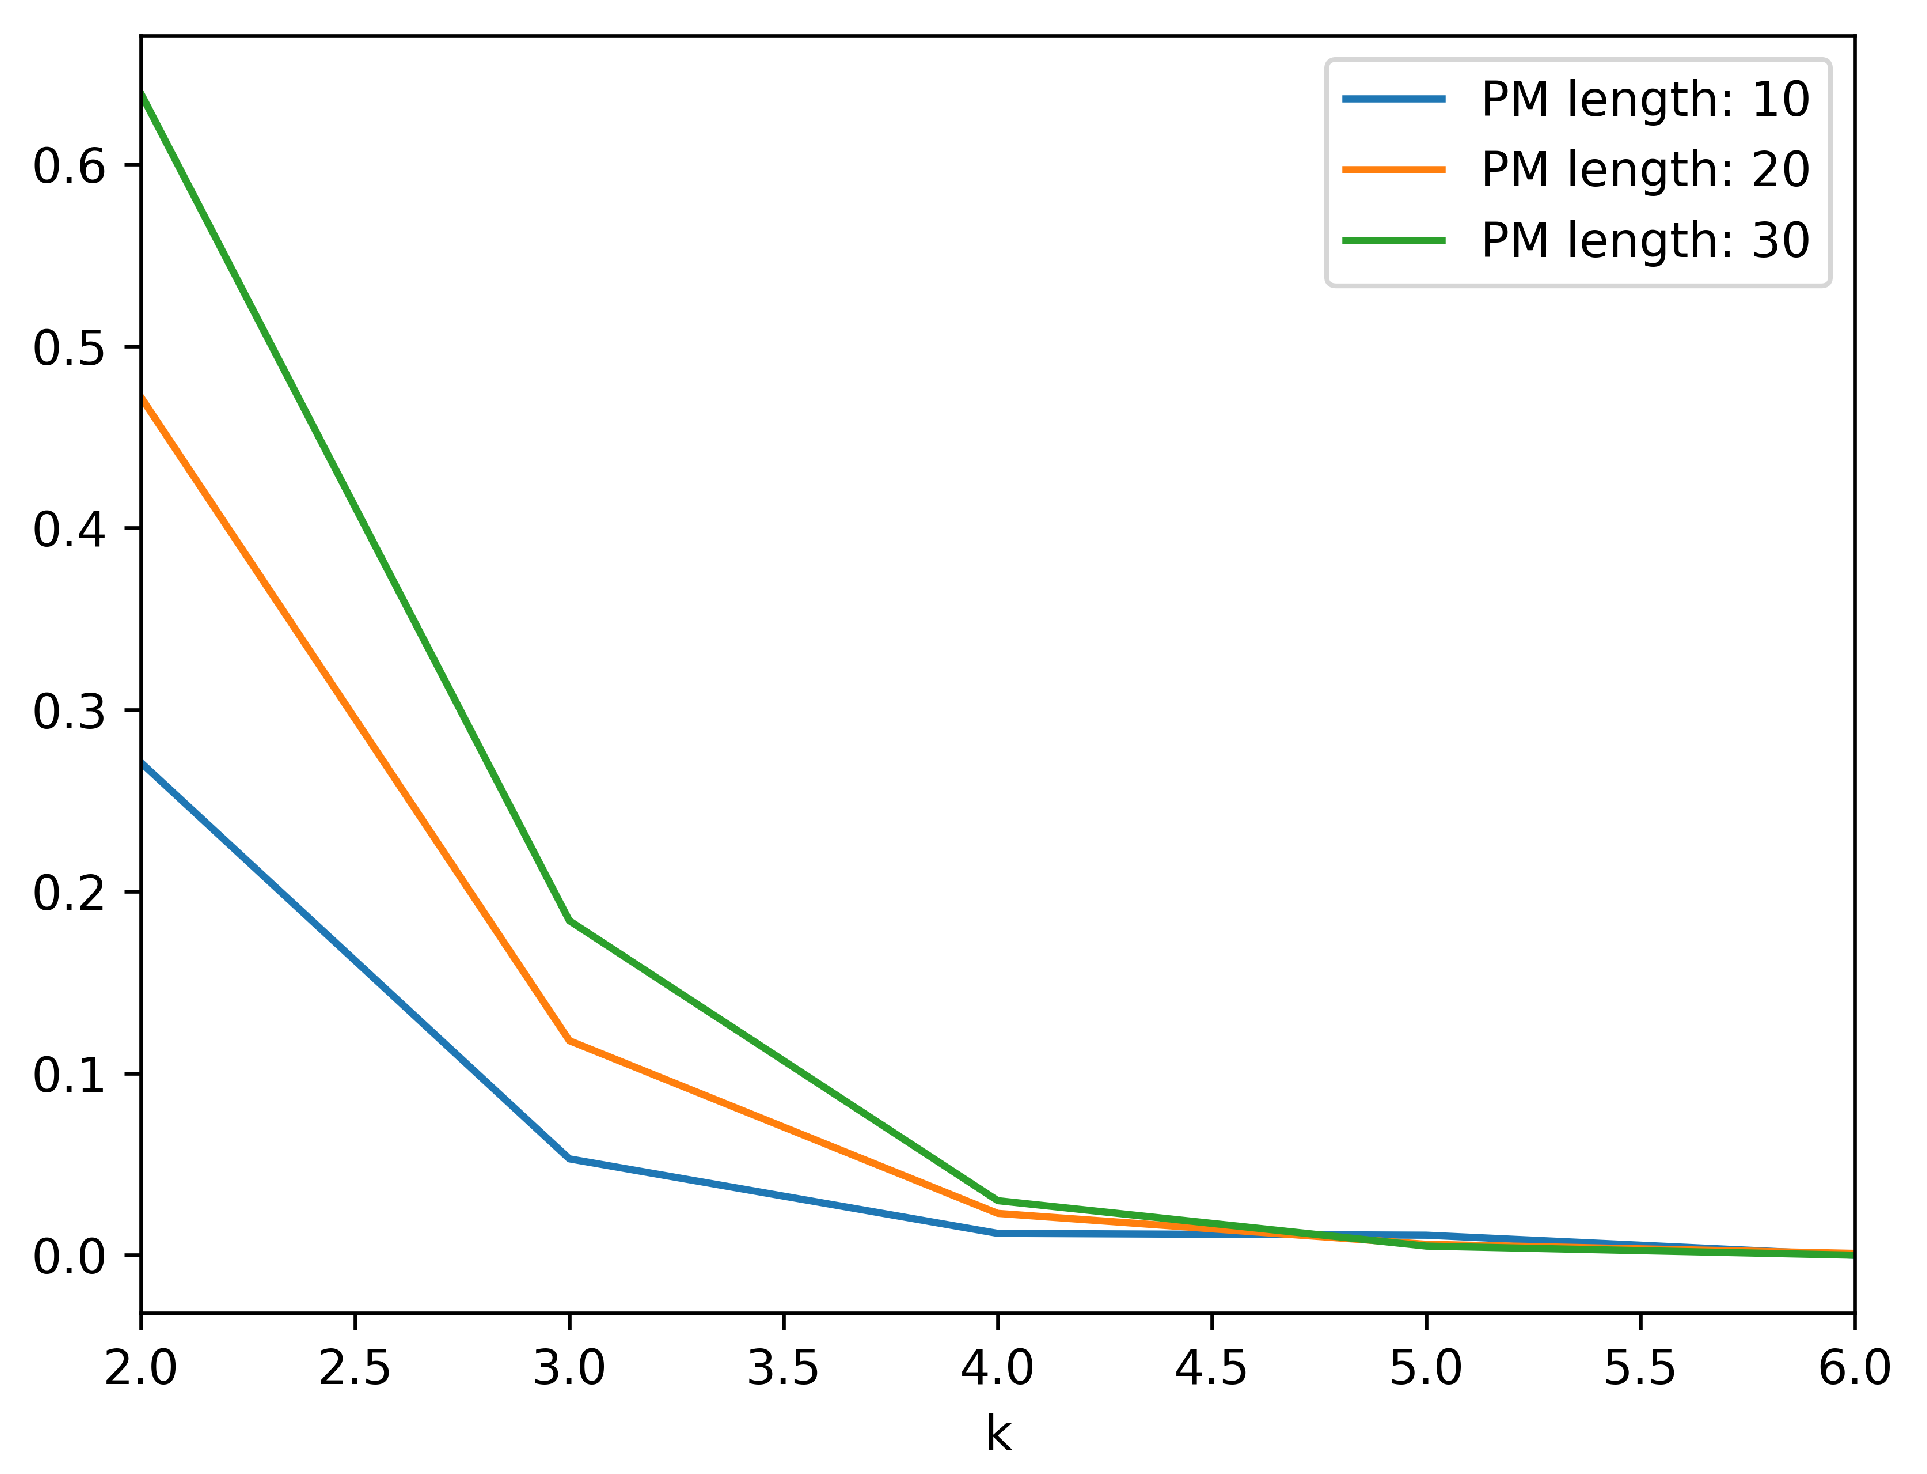
Figure 6,
Figure 7 and
Figure 8, depict the effect of the increase in number of checks to the probability of collaborating nodes submitting invalid information while going undetected. It is evident that an additional state check vastly decreases the aforementioned probability. Specifically, when 100 out of 1000 nodes are malicious, an additional state check approximately divides the probability by a factor of 15. When 200 out of 1000 nodes are malicious, an additional state check approximately divides the probability by a factor of 5 and in the case of 300 malicious nodes the corresponding factor is 3. Of course, as the length of the path message is increased the effect of the additional check is slightly reduced, but in any case, the required number of state checks to minimize the probability is feasible and will not produce significant overhead.
Our approach exhibits some qualitative advantages, with respect to other collaborative DDoS detection techniques, presented in literature. While conducting a quantitative comparison was not applicable, we opted for identifying the main characteristics that each one of the published methods demonstrates. The comparison has been made upon the following main points:
Integrity: Integrity is related to whether the proposed approach defends the integrity of the exchanged information and thus the validity of the detection results.
Availability: Availability relates to the robustness of the proposed systems with respect to possible failures for a limited number of nodes. It describes the ability of proposed systems to remain available in such cases.
Responsiveness: Responsiveness describes the ability of systems to timely detect possible attacks and produce corresponding alerts.
Scalability: Scalability corresponds to whether the proposed systems can be scaled to protect larger gateways federations, without becoming inefficient.
An analysis of eight previous research efforts (traditional ones and blockchain based ones) along with the approach presented herein has been conducted. According to this analysis, a comparison depicted in
Table 8 has been attempted. While our approach is blockchain based, it adheres to layer 2 scaling paradigm [
33] that enables building an efficient decentralized application, which does not suffer from low transaction rates and other related issues. Our methodology utilizes the state channels approach [
34] and enables agents to collaborate in a safe and efficient way. Our system is the only one that can offer integrity, availability, and responsiveness guaranties and at the same time maintain these offerings even for relatively larger networks of nodes.

