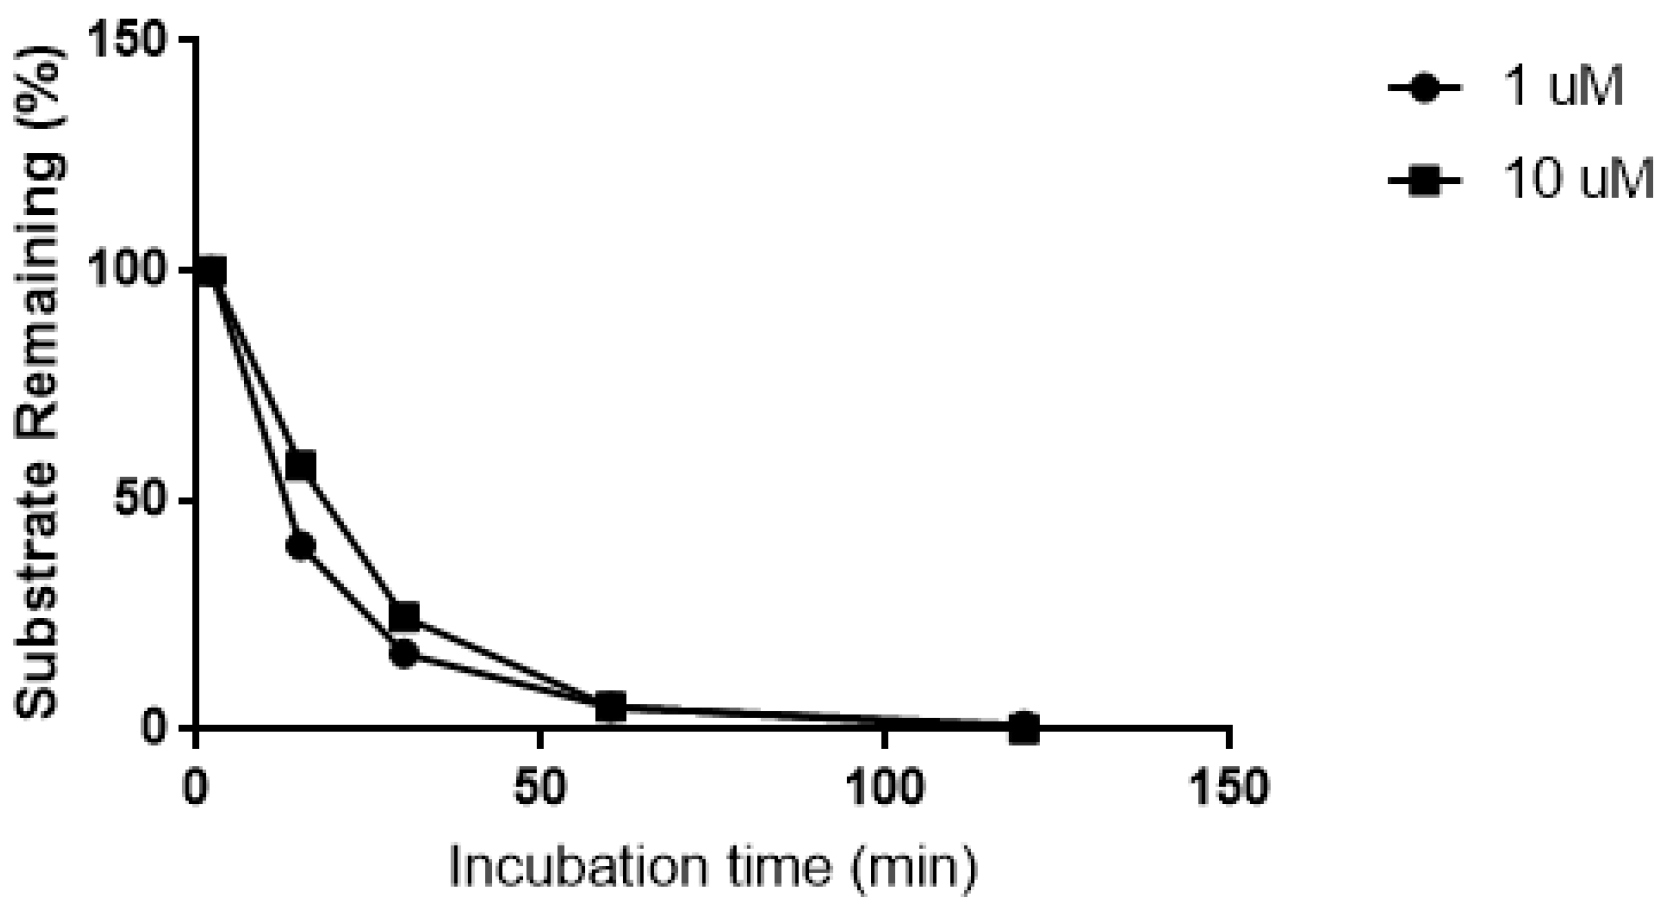
Figure 1.
Biotransformation of CRV431 (1 and 10 μM) in human liver microsomes.
Figure 1.
Biotransformation of CRV431 (1 and 10 μM) in human liver microsomes.
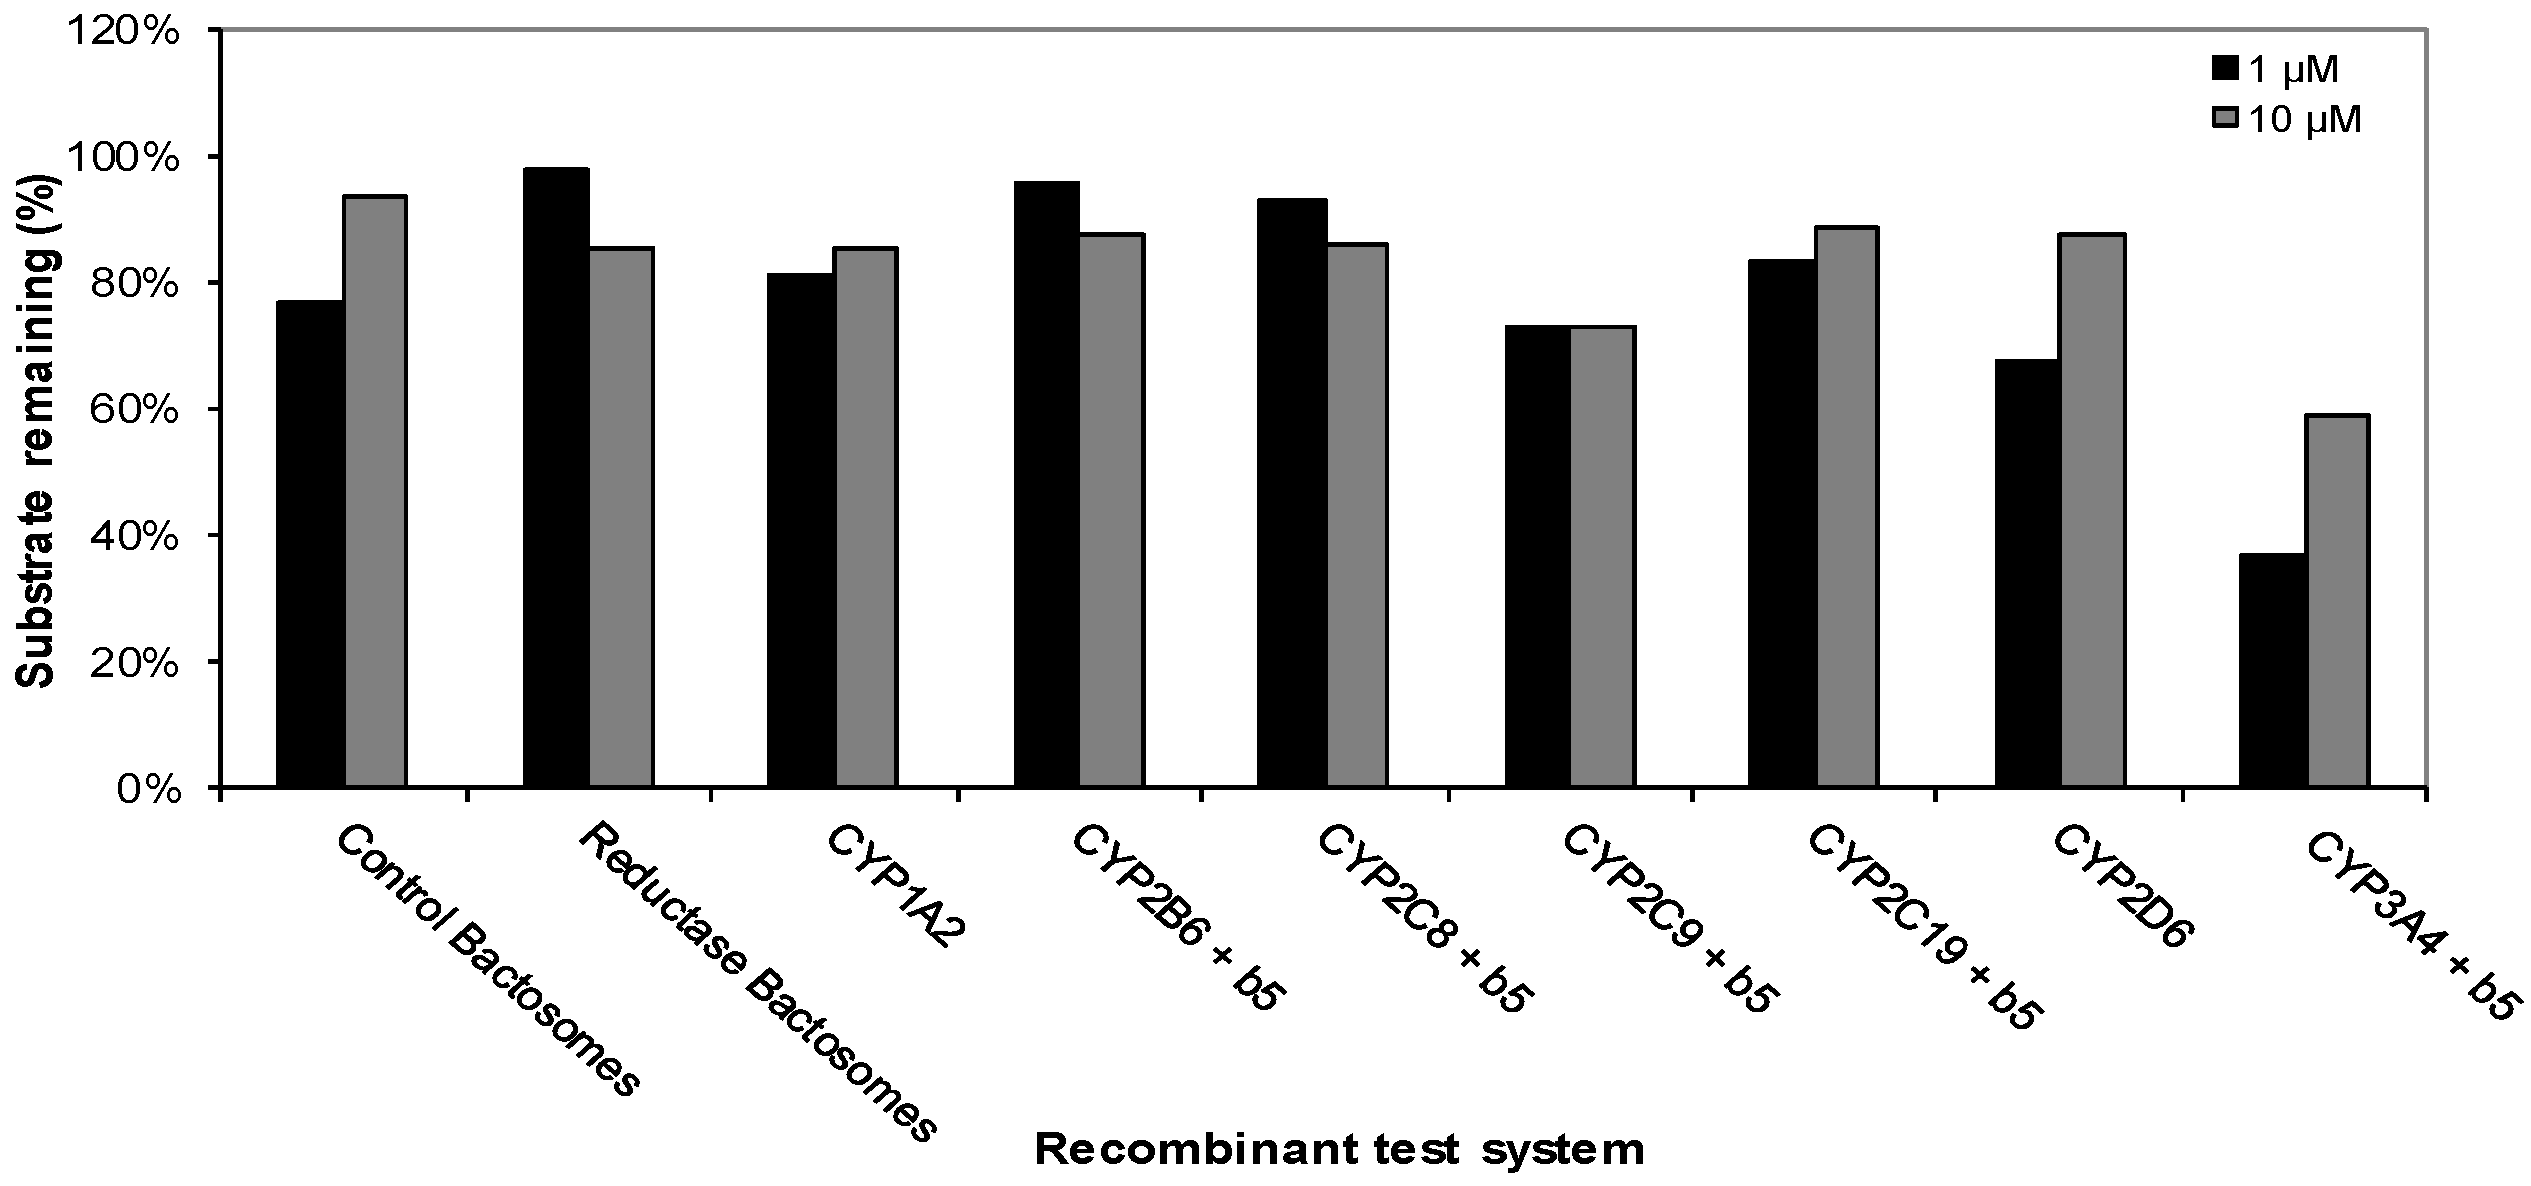
Figure 2.
Metabolism of CRV431 (1 and 10 μM) by a panel of recombinant human CYP enzymes (50 pmol/mL).
Figure 2.
Metabolism of CRV431 (1 and 10 μM) by a panel of recombinant human CYP enzymes (50 pmol/mL).
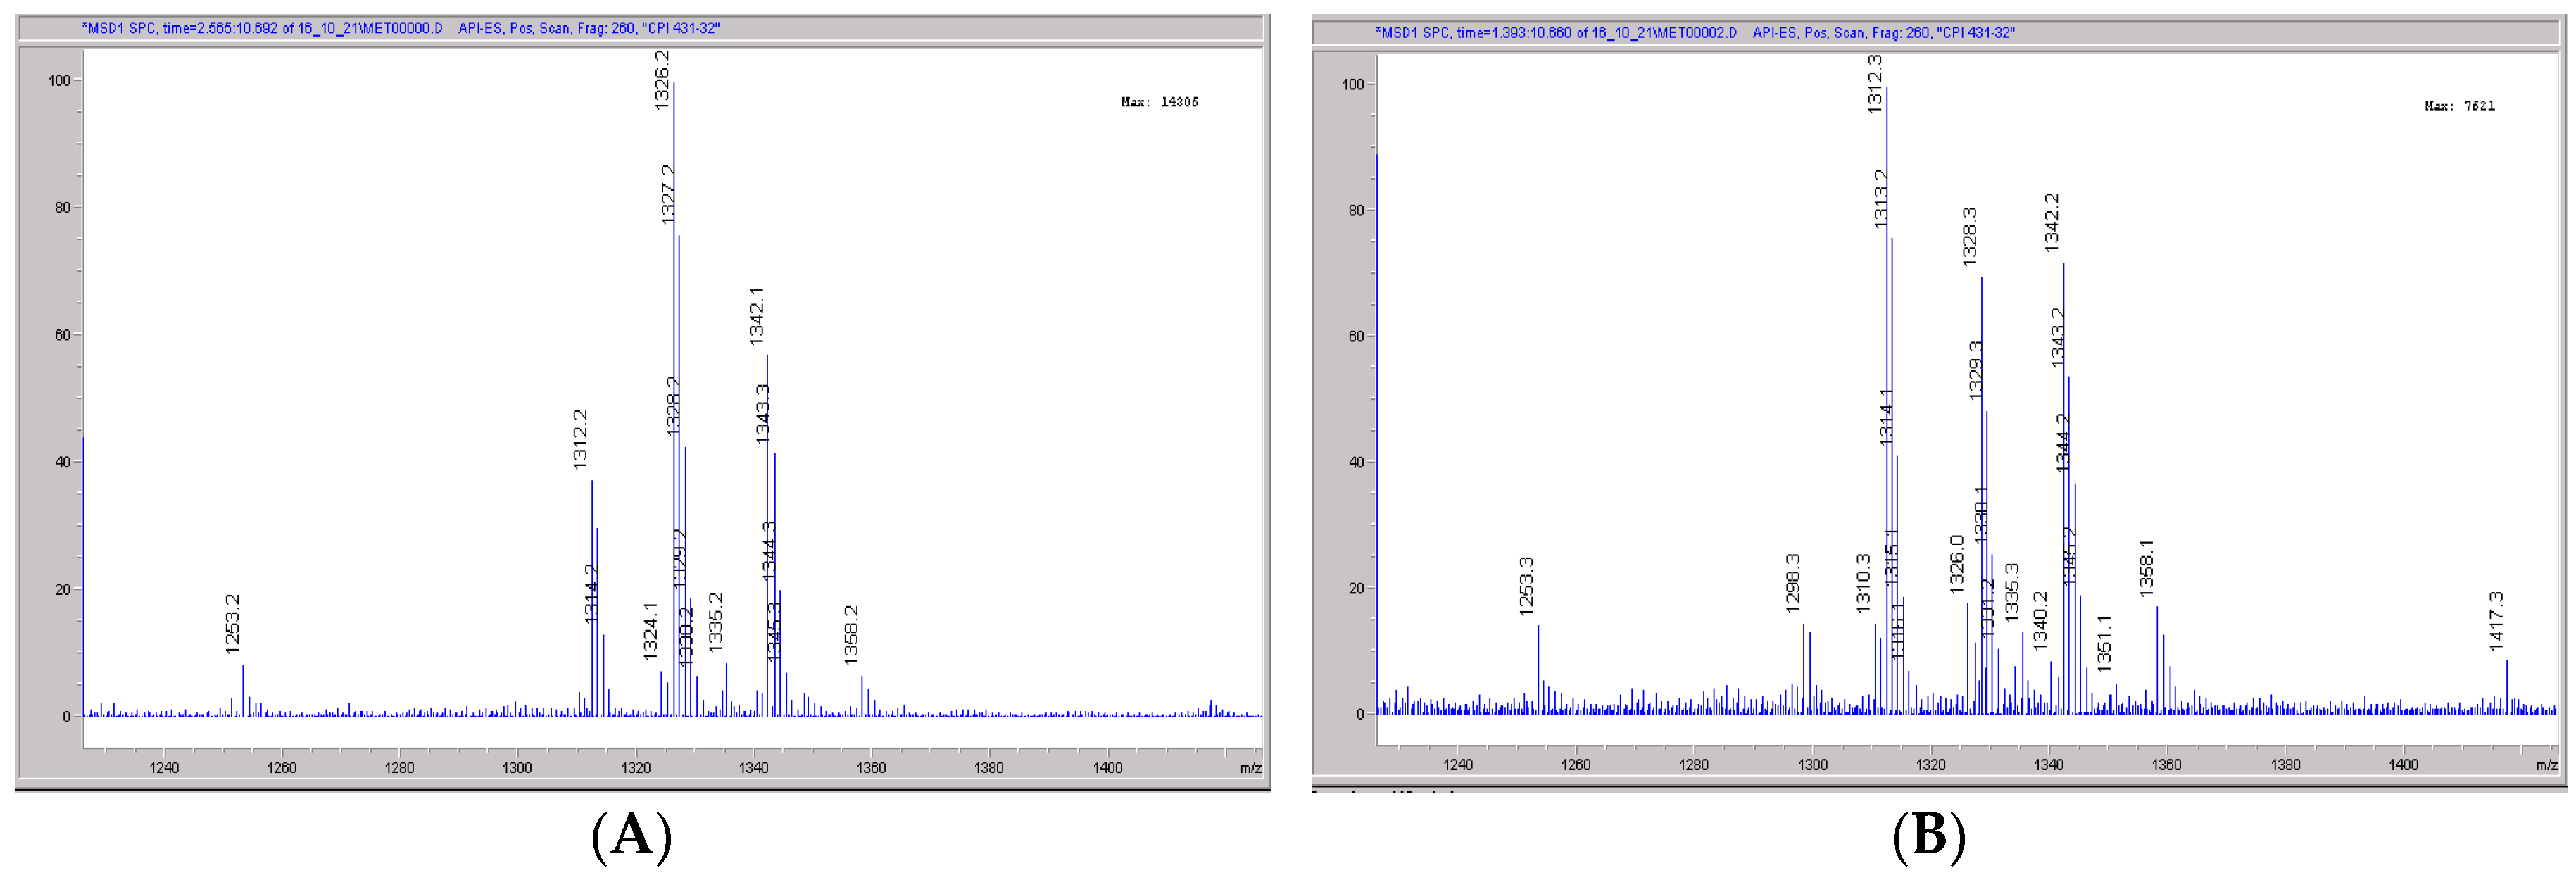
Figure 3.
Effect of direct-acting chemical inhibitors on the loss of CRV431 (1 μM) by human liver microsomes.
Figure 3.
Effect of direct-acting chemical inhibitors on the loss of CRV431 (1 μM) by human liver microsomes.
Figure 4.
Effect of metabolism-dependent chemical inhibitors on the loss of CRV431 (1 μM) by human liver microsomes after 30-min preincubation.
Figure 4.
Effect of metabolism-dependent chemical inhibitors on the loss of CRV431 (1 μM) by human liver microsomes after 30-min preincubation.
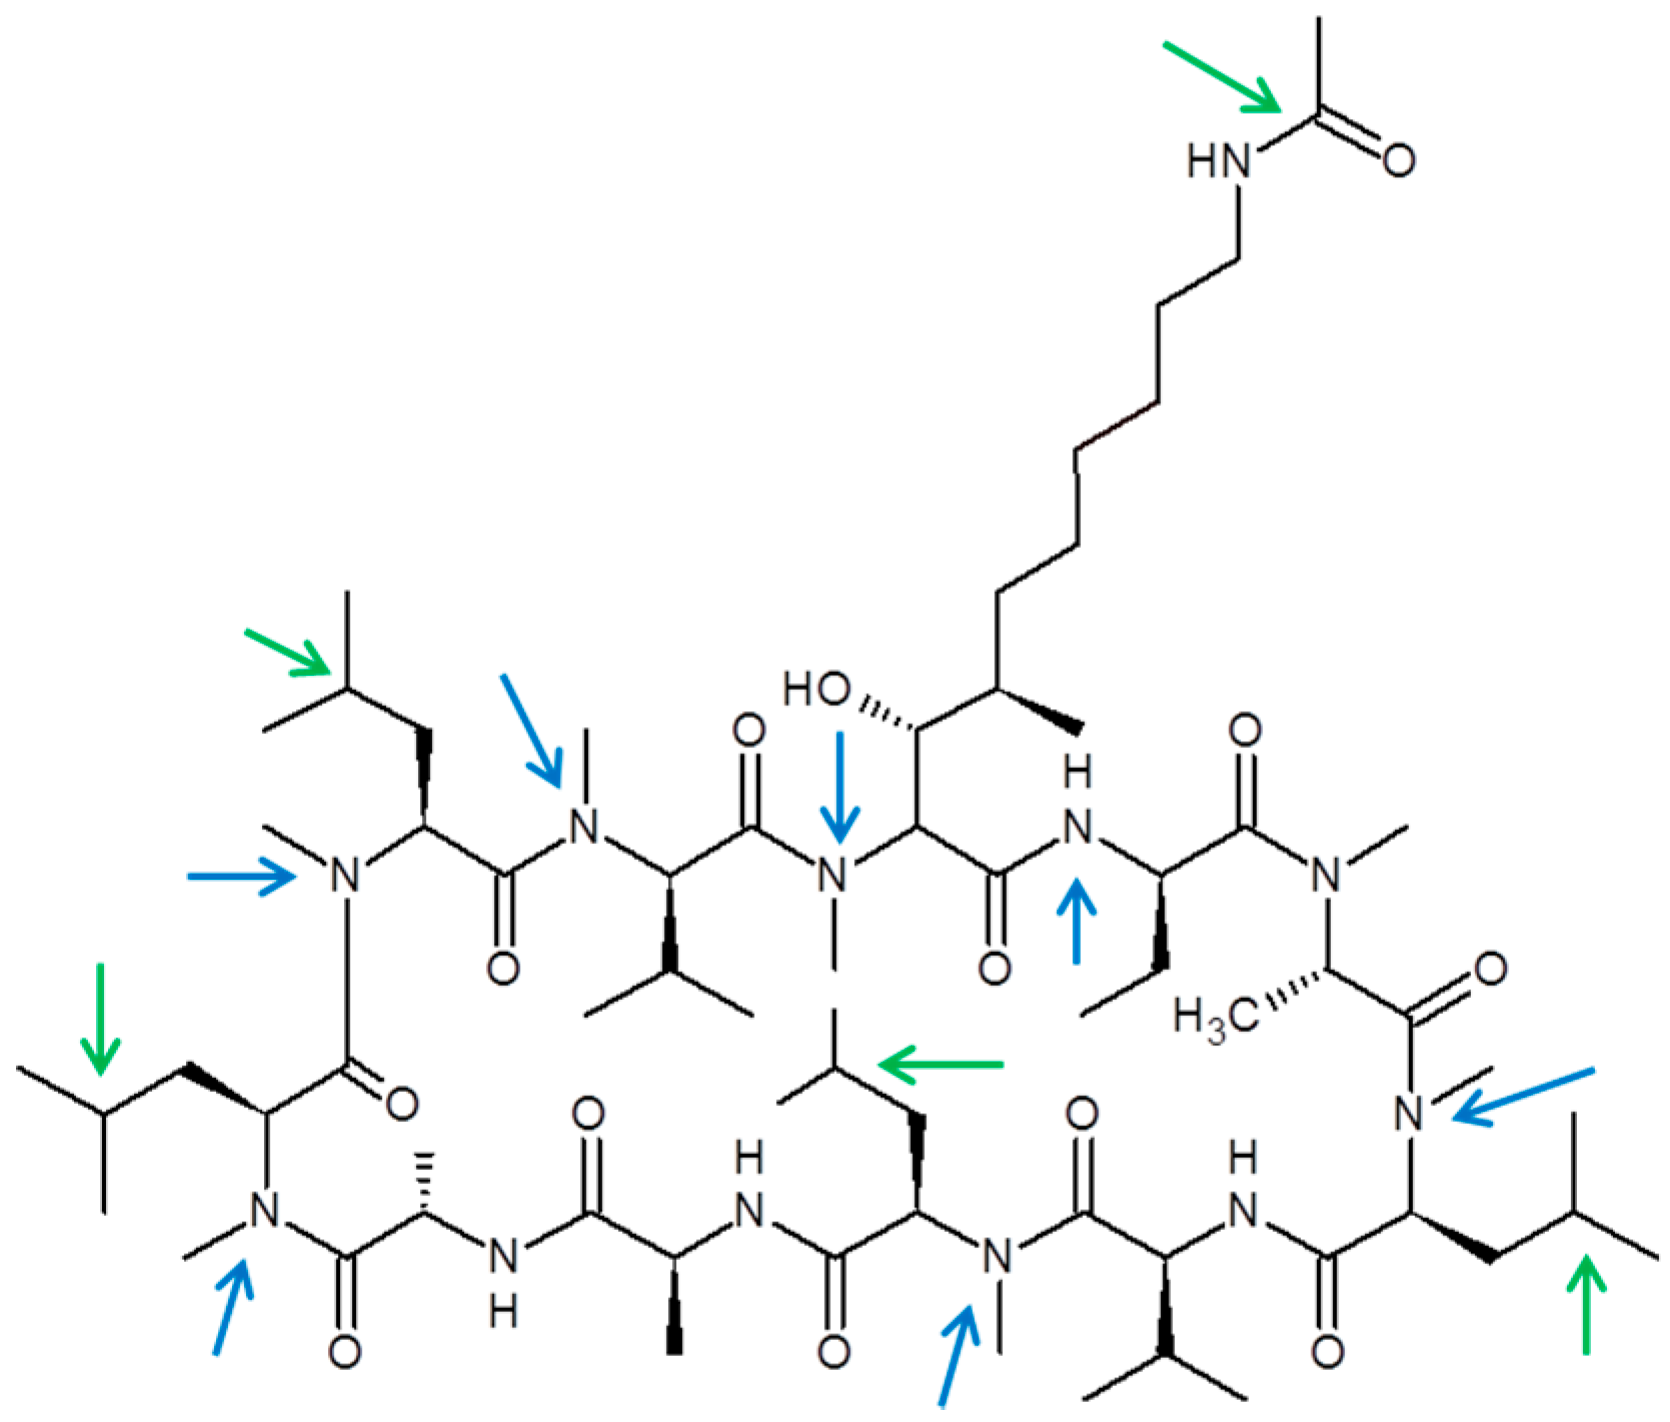
Figure 5.
Chemical structure of CRV431 and proposed biotransformation sites. Potential oxidation (green arrows) and demethylation (blue arrows) sites are shown.
Figure 5.
Chemical structure of CRV431 and proposed biotransformation sites. Potential oxidation (green arrows) and demethylation (blue arrows) sites are shown.
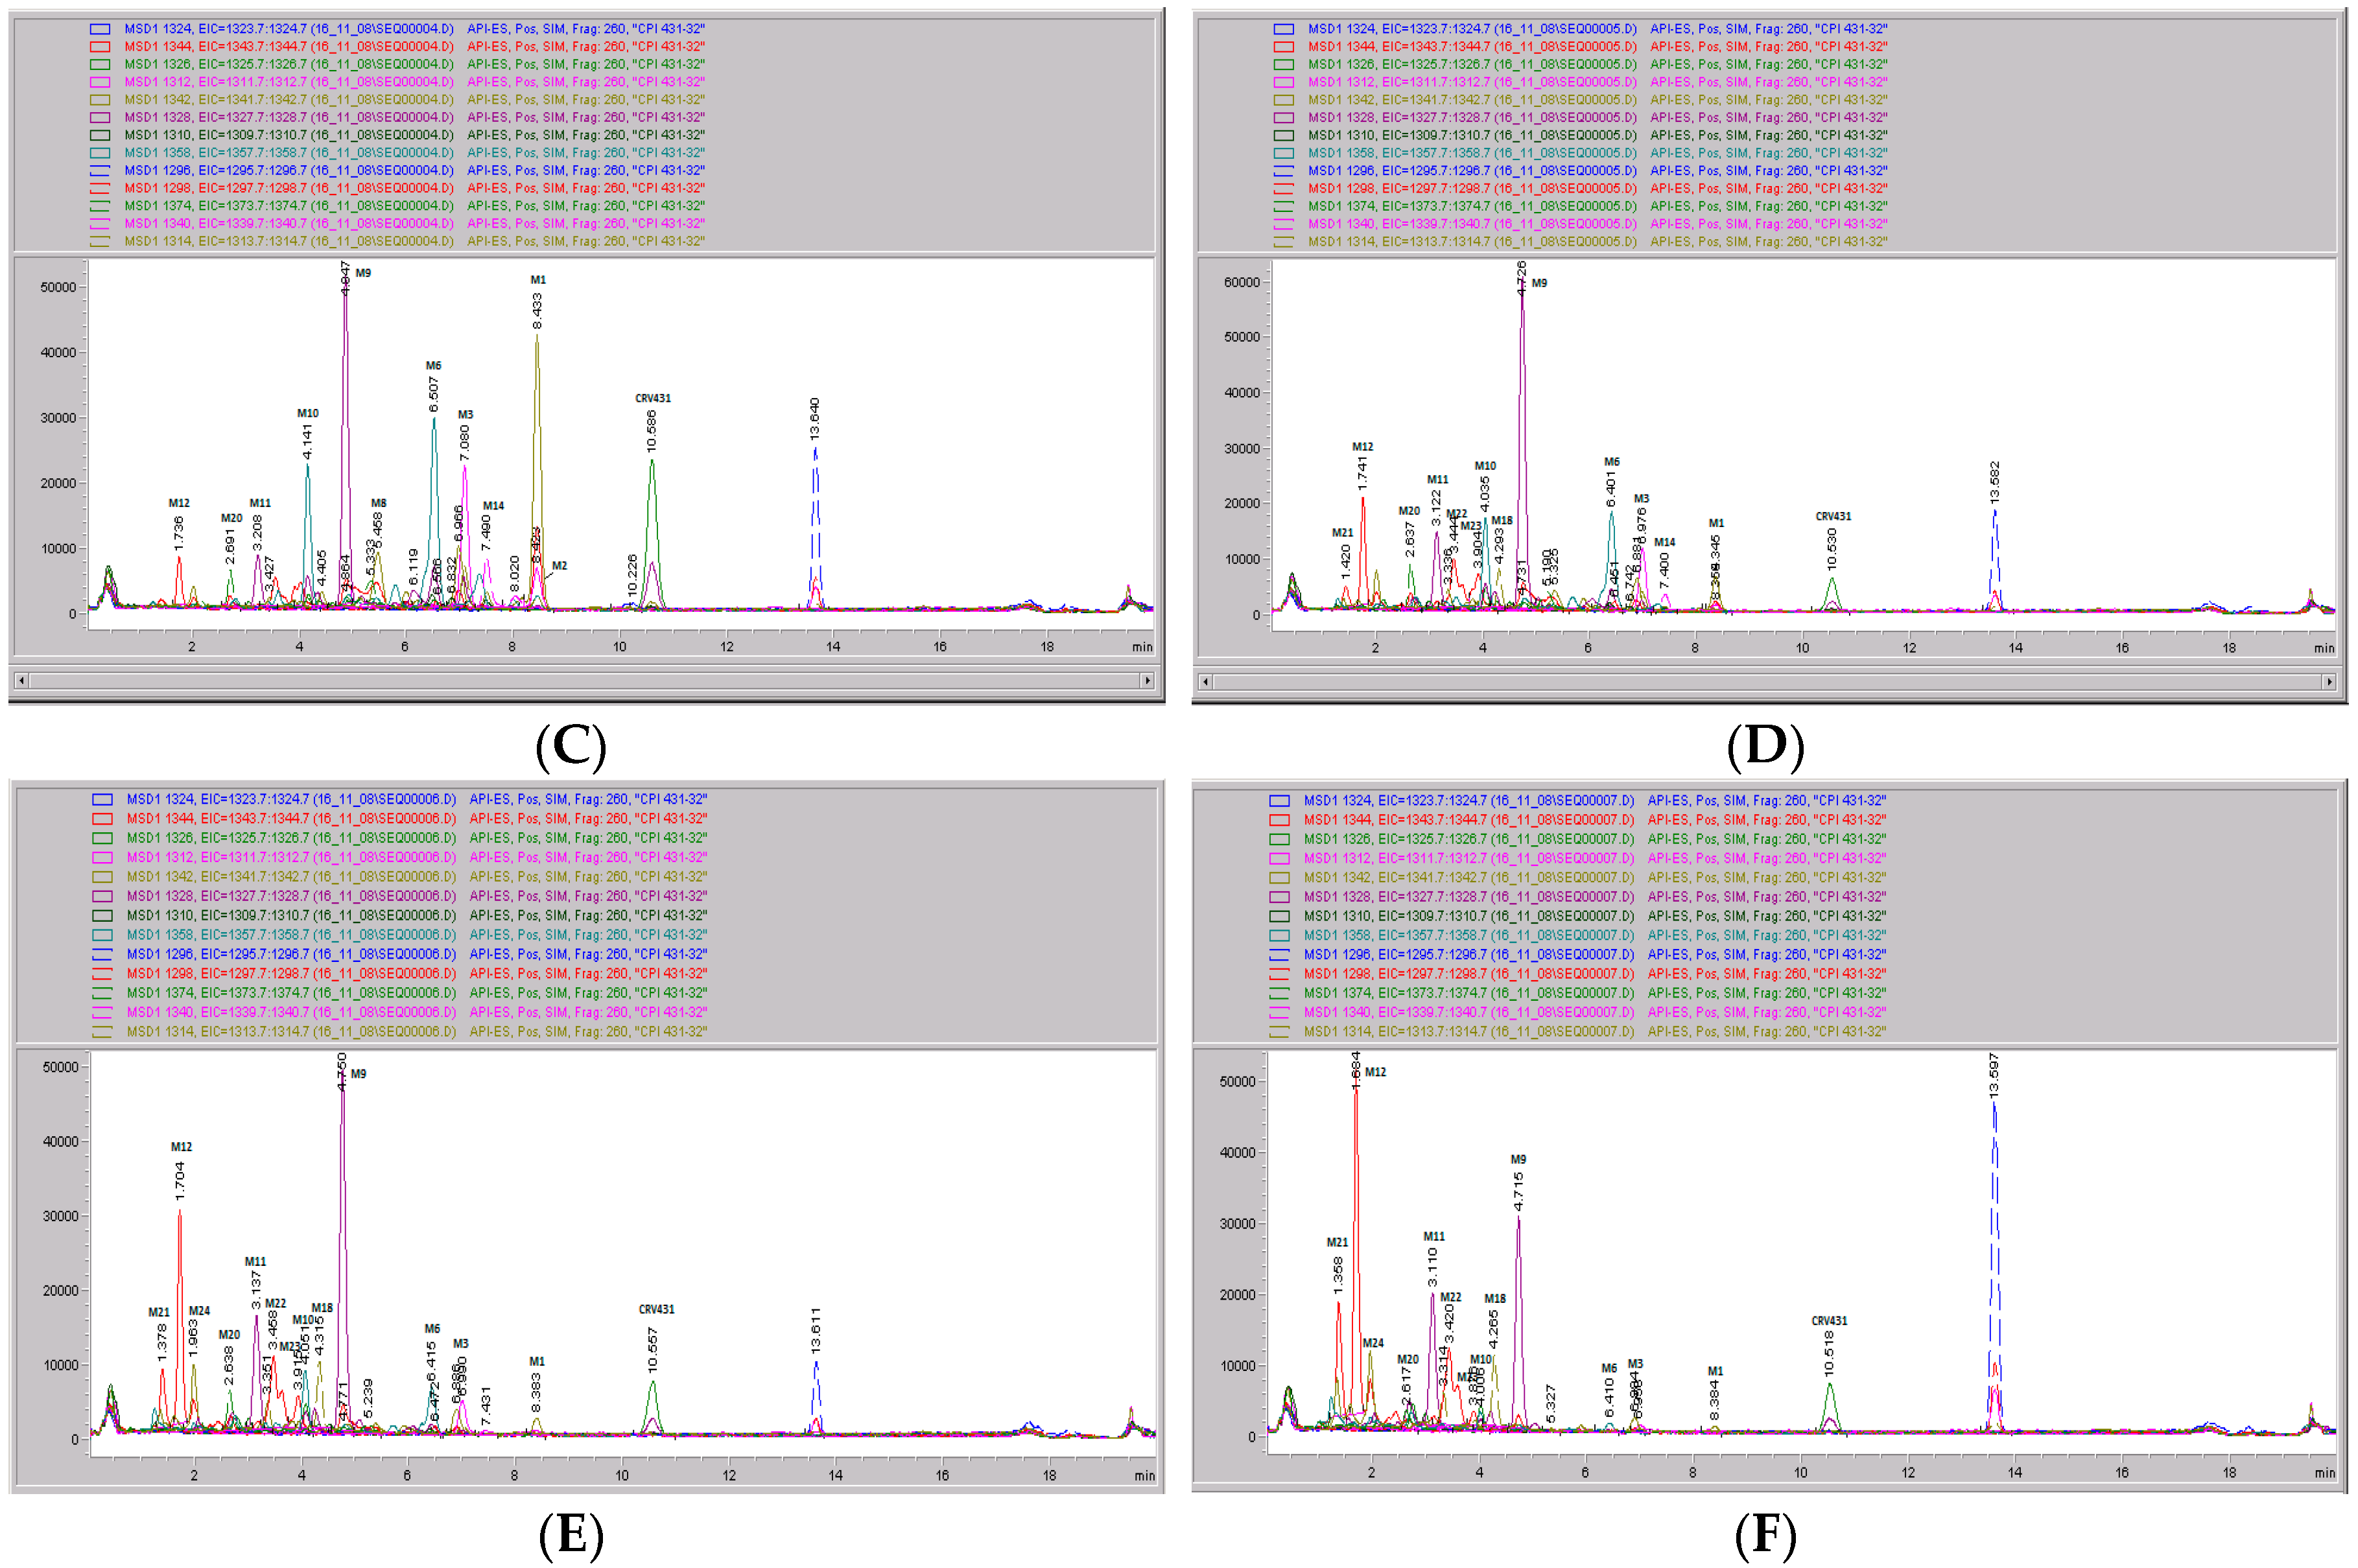
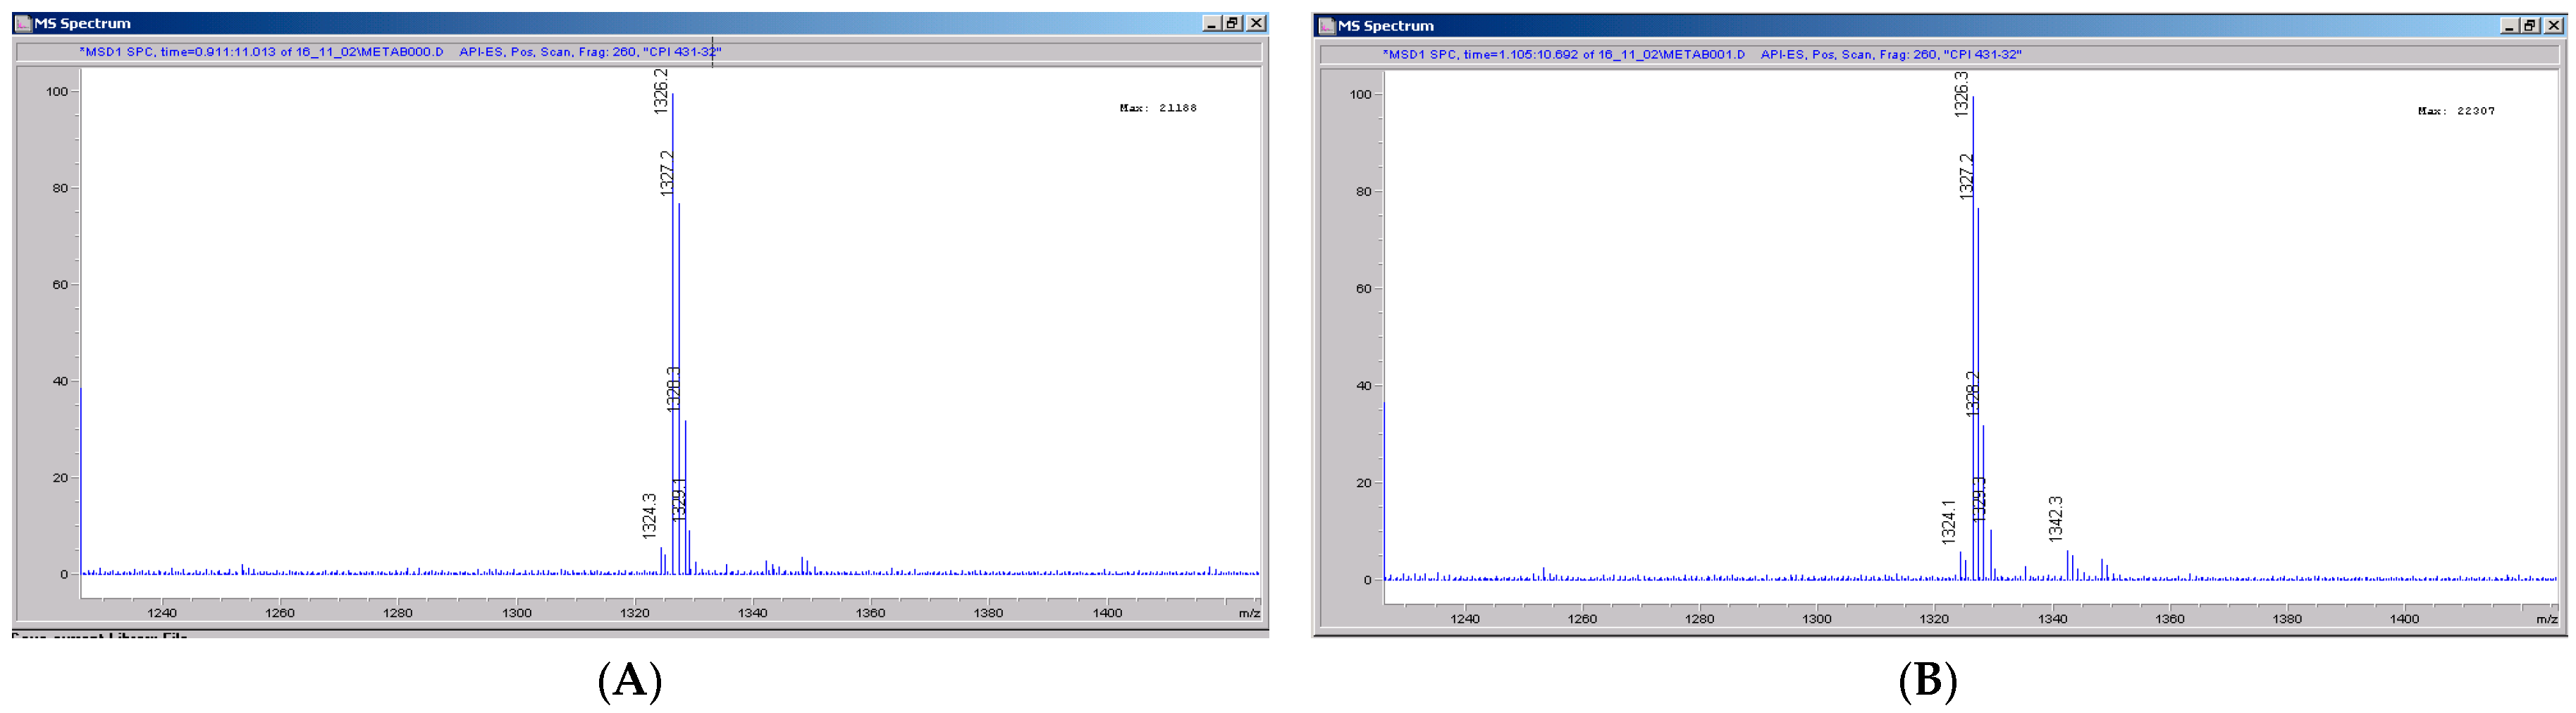
Figure 6.
Mass spectral scans of human liver extracts incubated with CRV431. Human liver microsomes (1 mg/mL) were incubated with 1 μg/mL CRV431, and extracts were removed for analysis by electrospray ionization liquid chromatography mass spectrometry (ESI-LCMS) at 20 min (panel (A)), mass spectral scan from 1260–1460 m/z and 80 min (panel (B)), and mass spectral scan from 1260–1460 m/z (not shown).
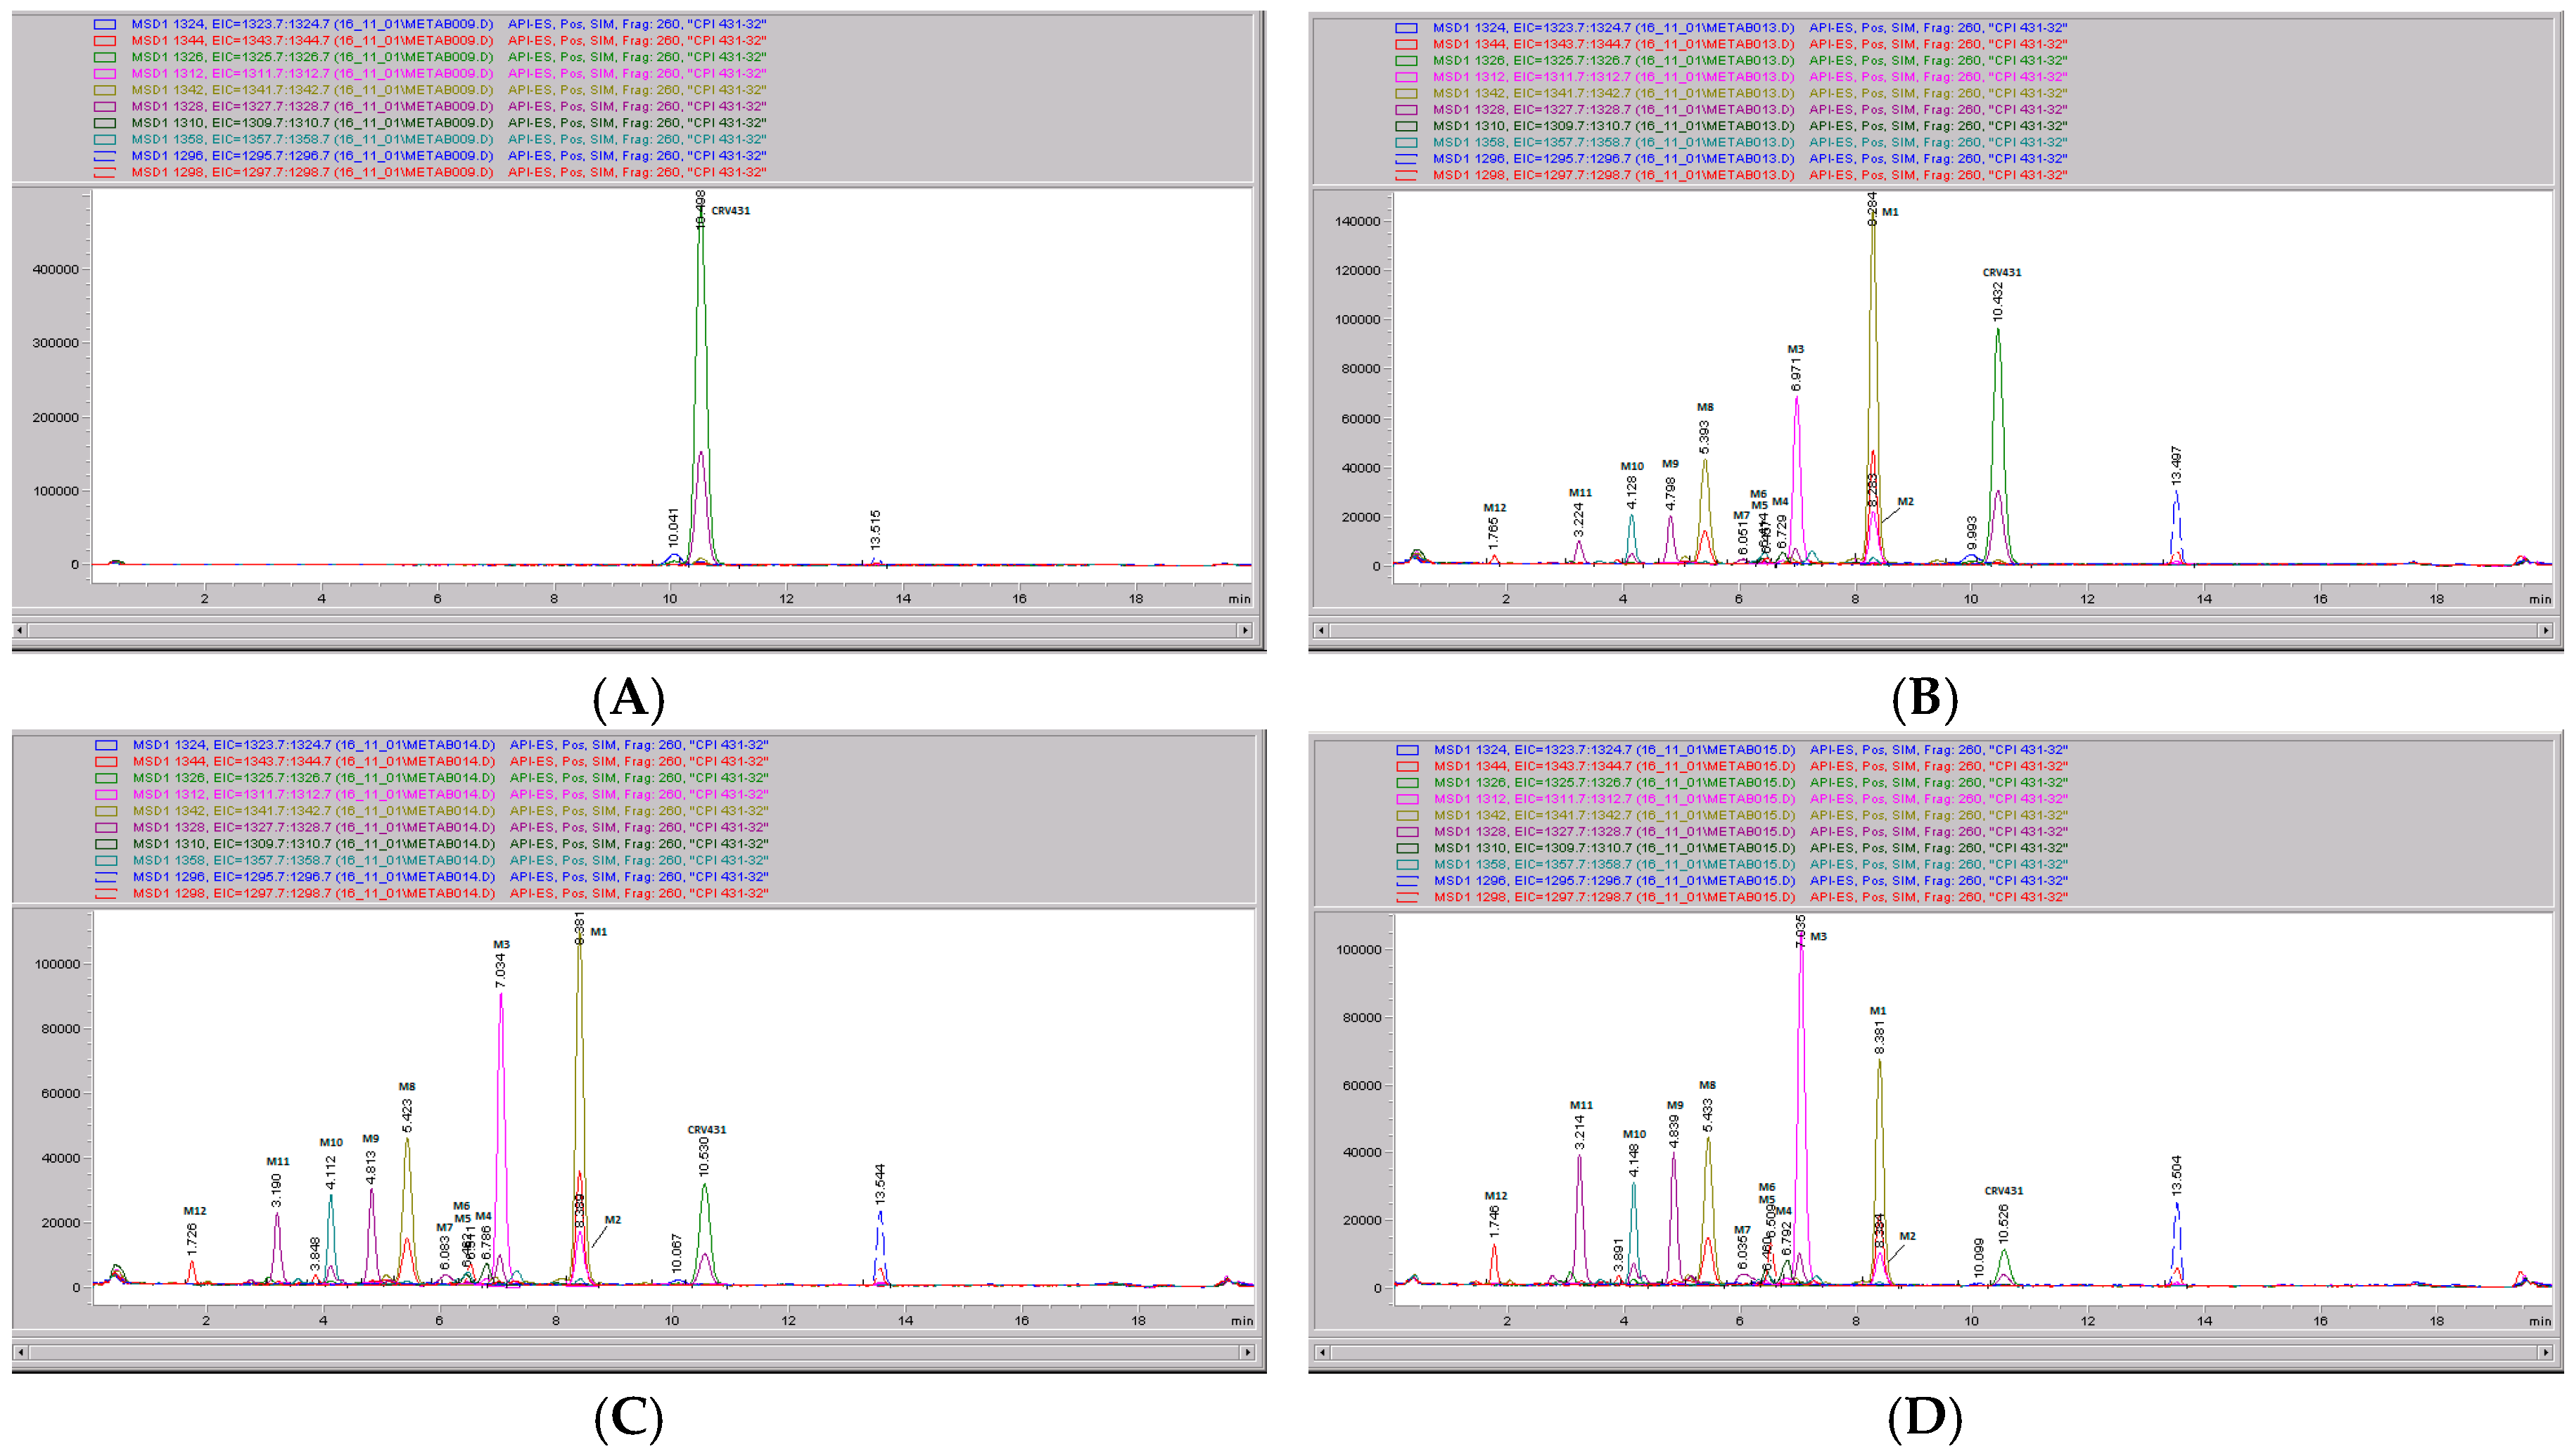
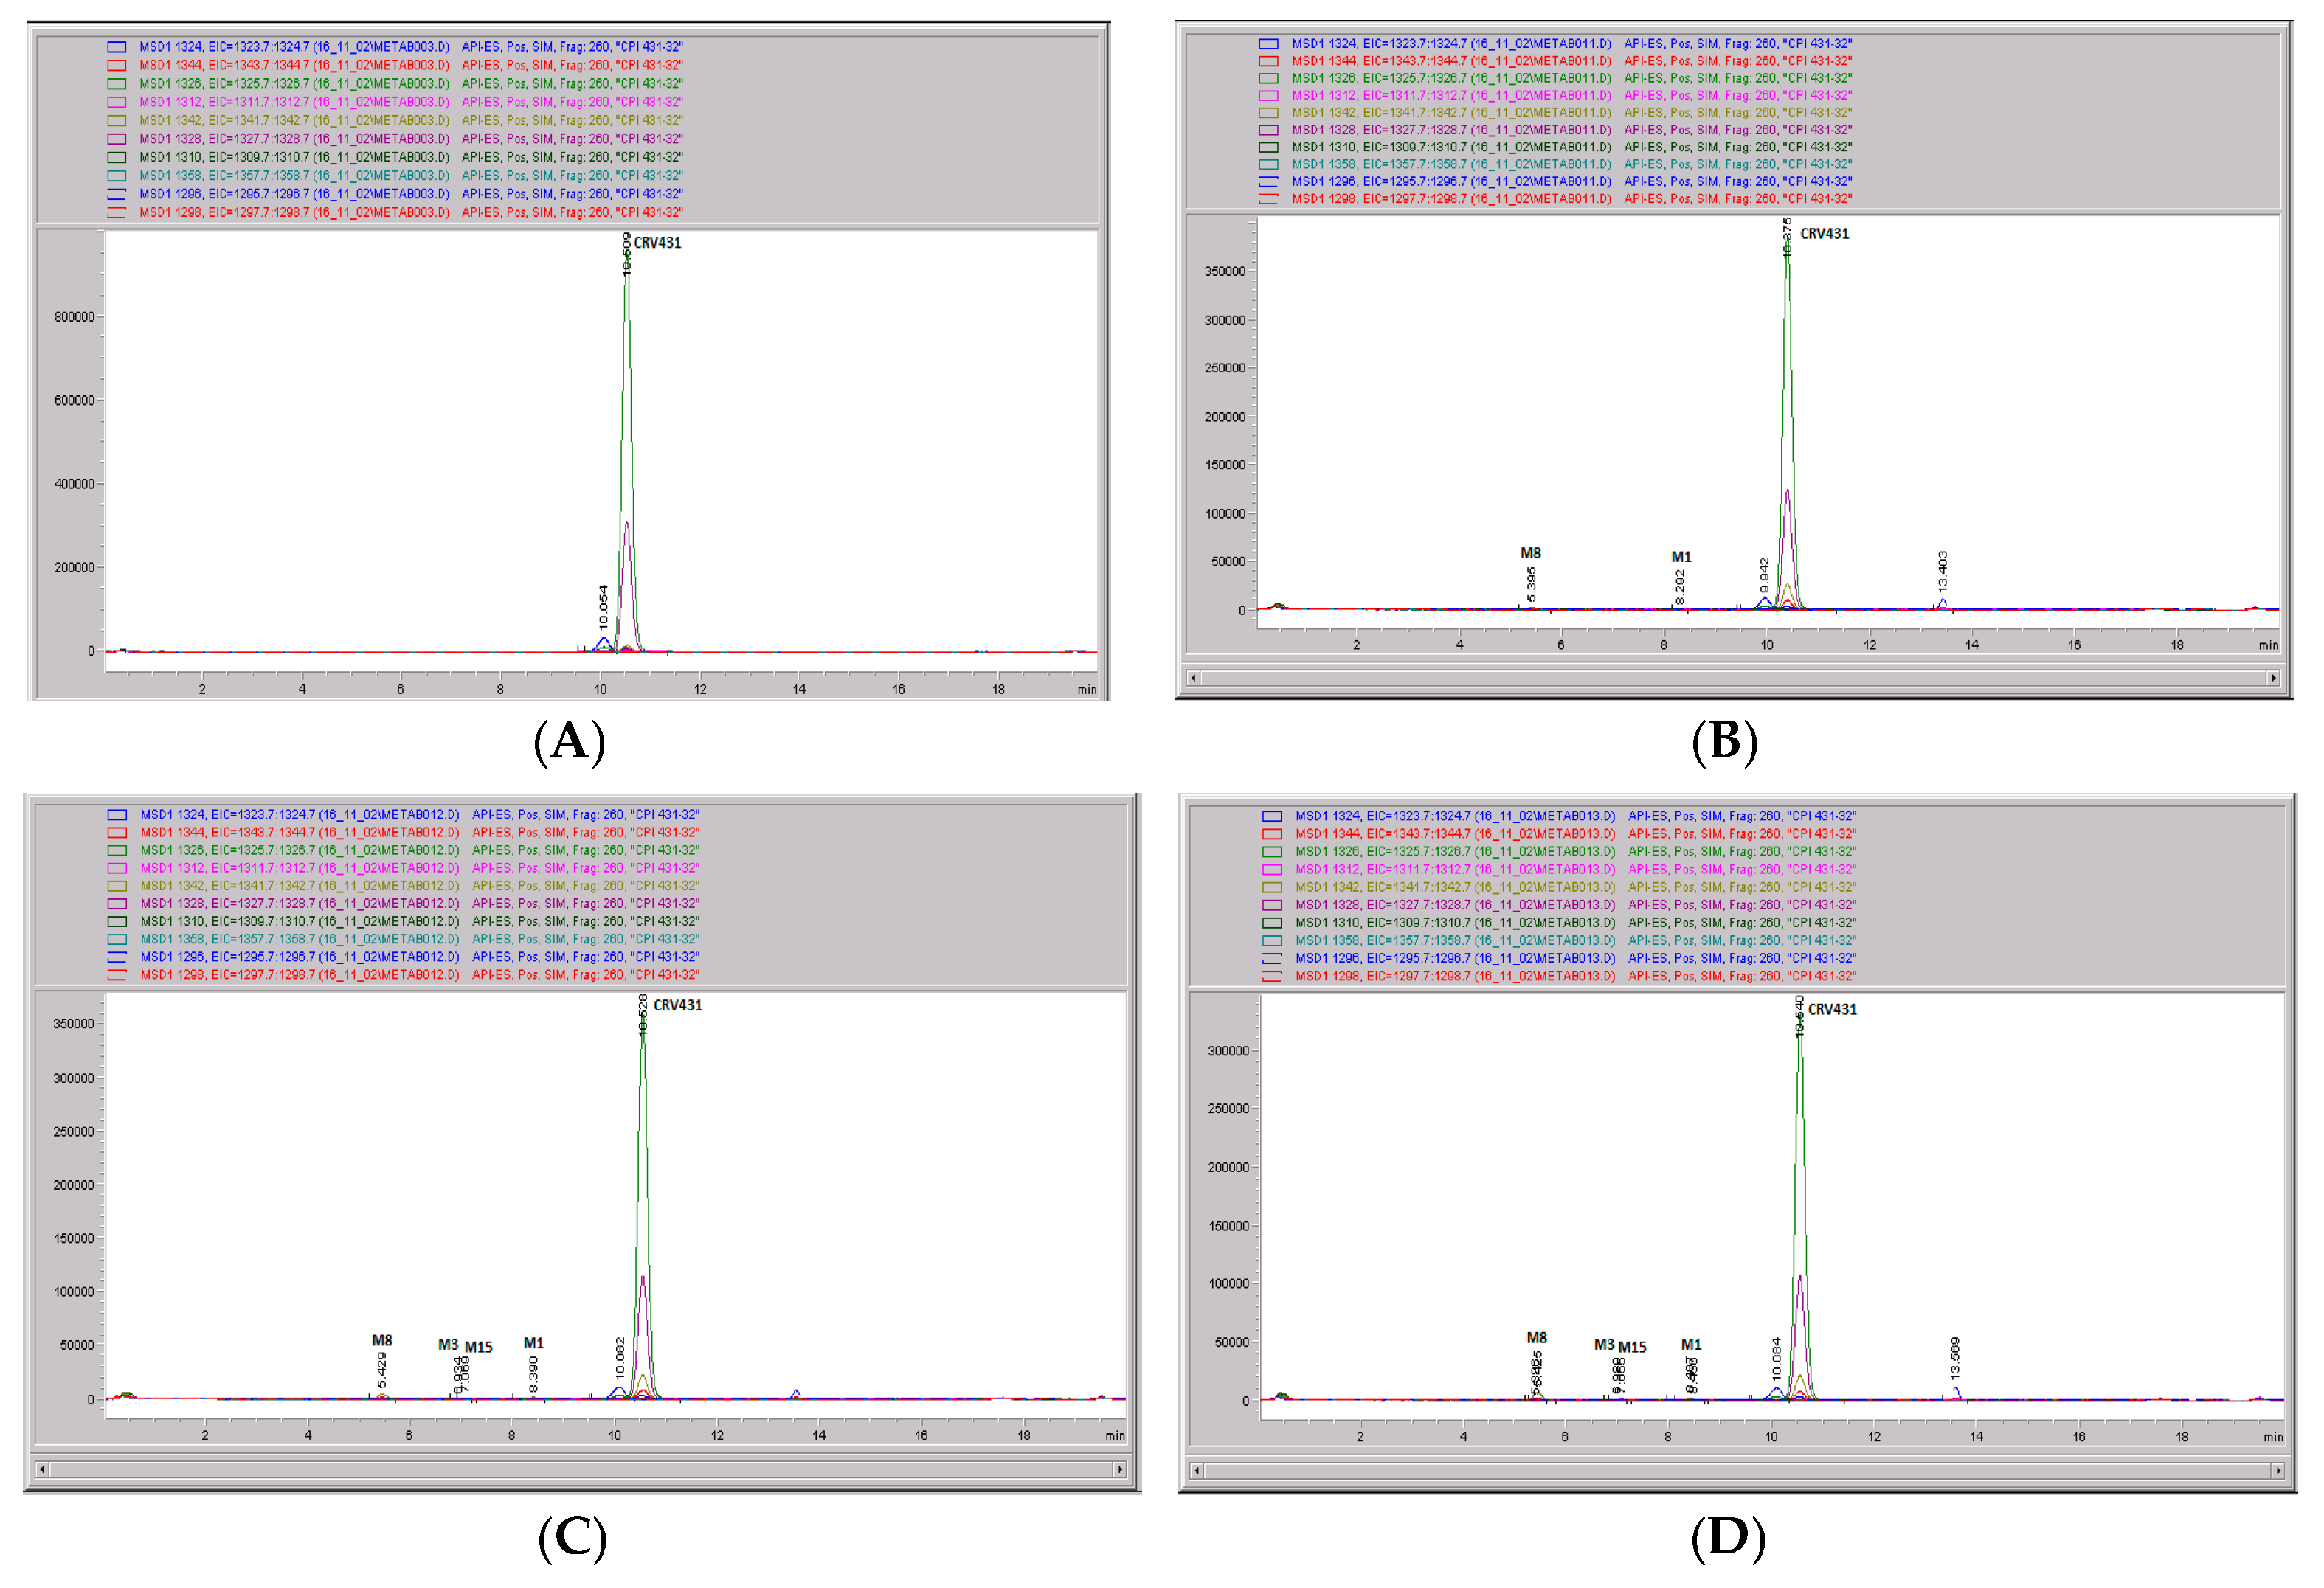
Figure 7.
CRV431 metabolism in human liver microsomes. Human liver microsomes (1 mg/mL) were incubated with 1 ug/mL CRV431, and extracts were removed at 0 (panel A), 20 min (panel B), 40 min (panel C), and 80 min (panel D) for analysis by ESI-LCMS. Each liquid chromatography—mass spectrometry (LC–MS) profile displays the metabolite abundances as a function of chromatographic retention time.
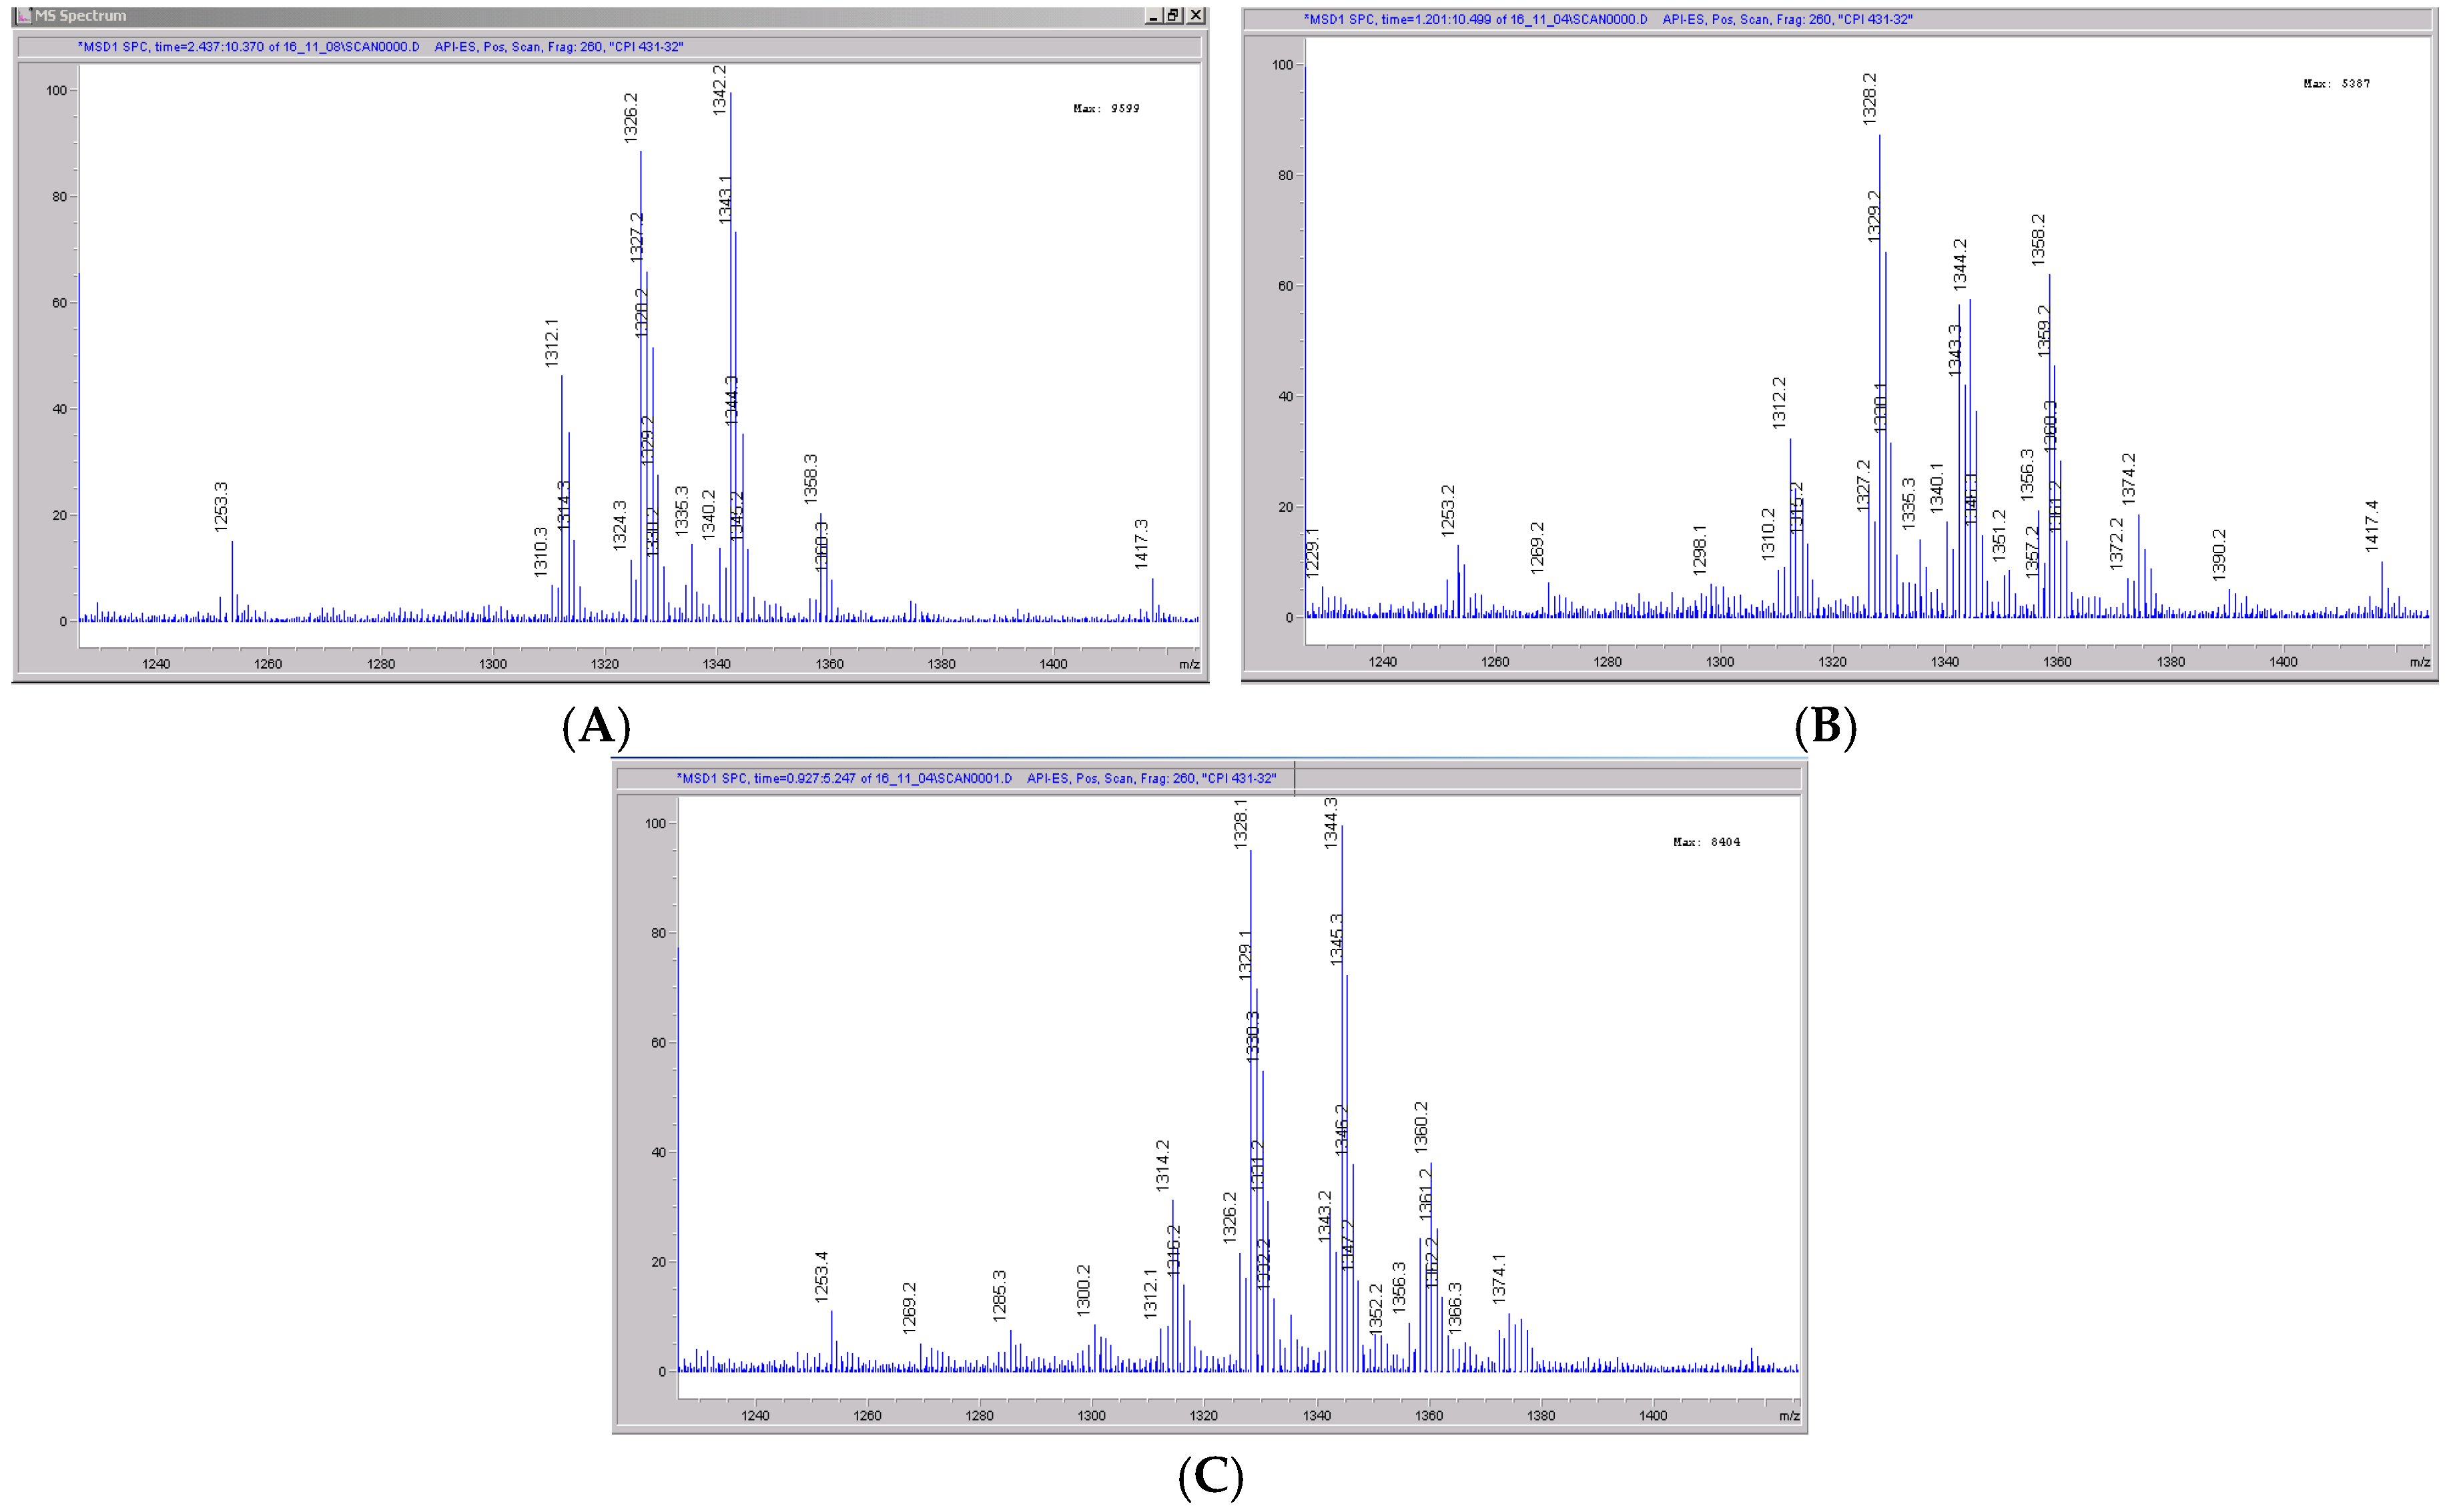
Figure 8.
Mass spectral scans of monkey liver extracts incubated with CRV431. Monkey liver microsomes (1 mg/mL) were incubated with 1 μg/mL CRV431, and extracts were removed for analysis by ESI-LCMS at 5 min (panel (A), mass spectral scan from 1260–1460 m/z), 20 min (panel (B), mass spectral scan from 1260–1460 m/z) and 80 min (panel (C), mass spectral scan from 1260–1460 m/z).
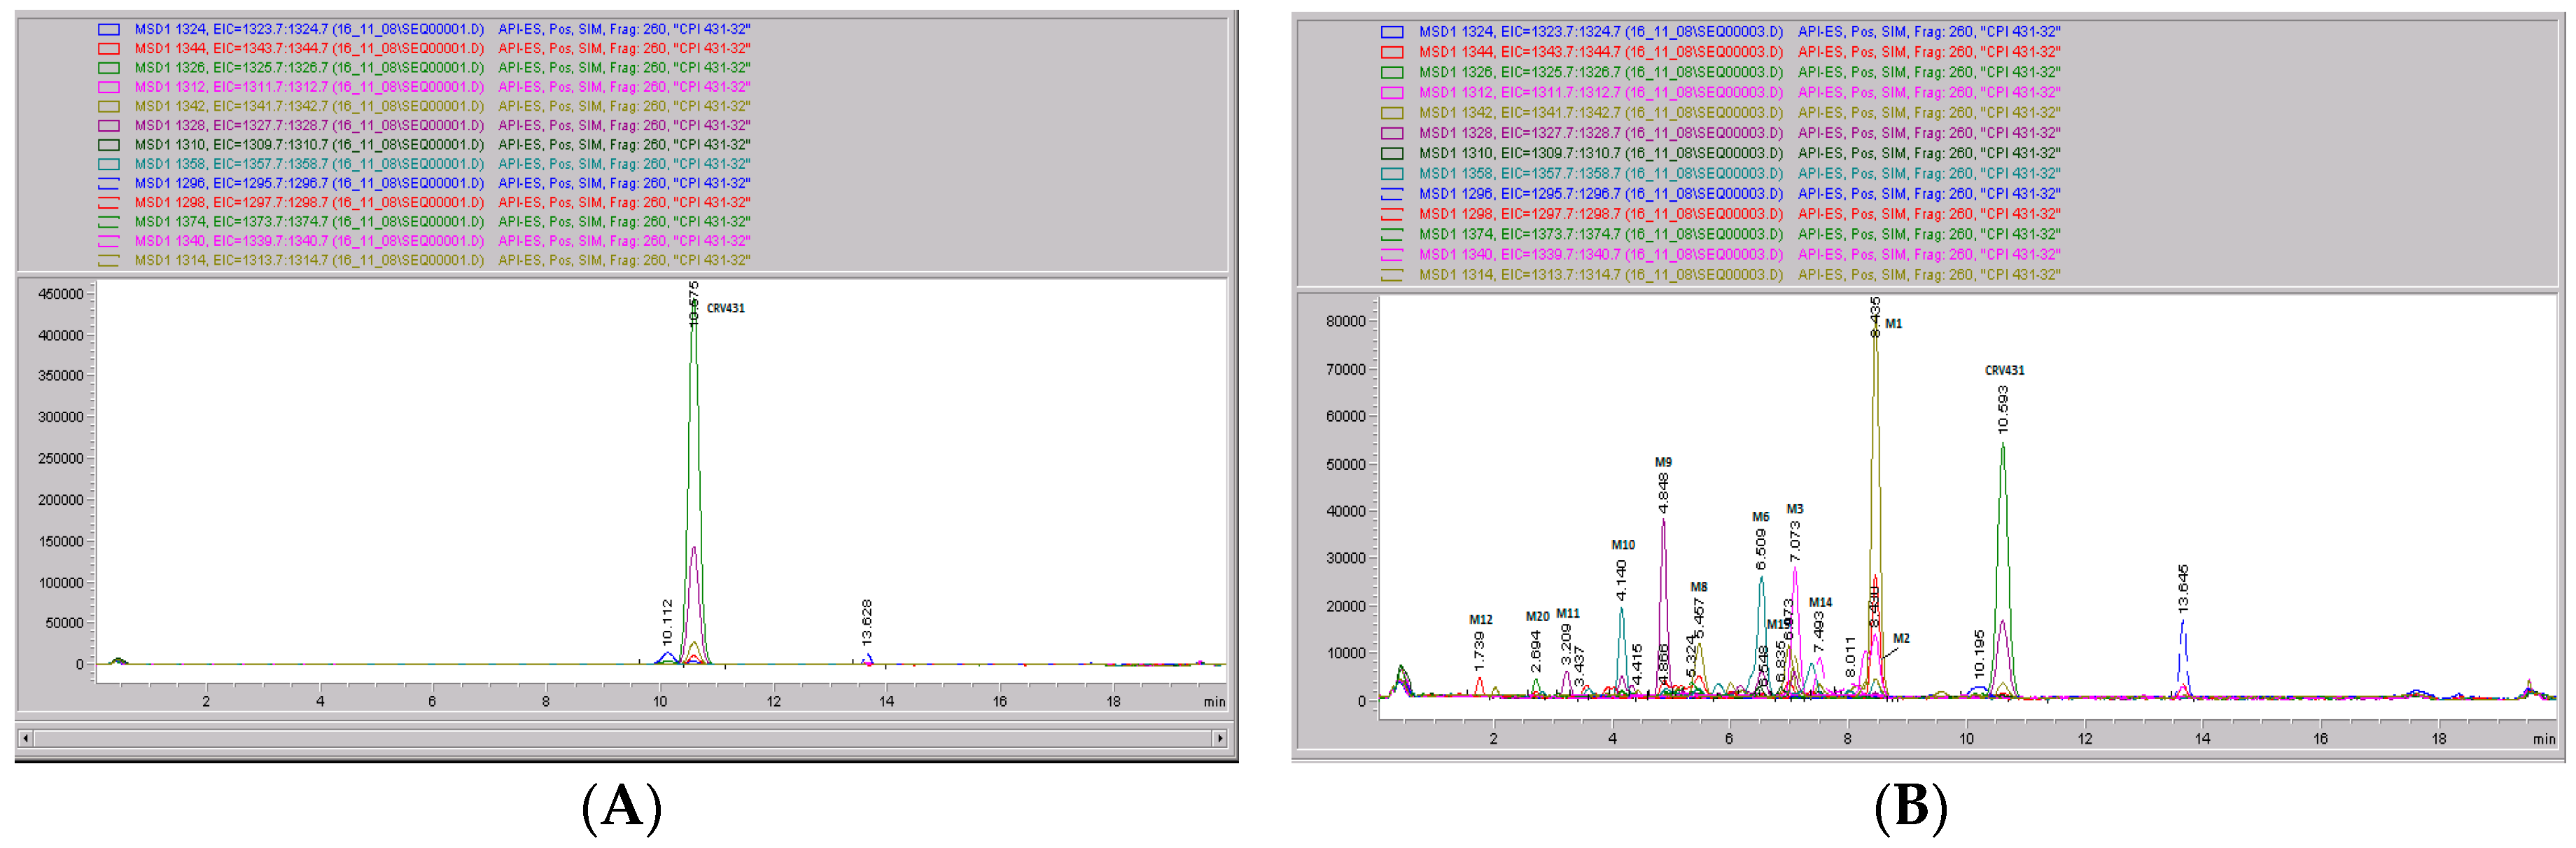
Figure 9.
CRV431 metabolism in monkey liver microsomes. Monkey liver microsomes (1 mg/mL) were incubated with 1 ug/mL CRV431, and extracts were removed at 0 (panel (A), 5 min (panel (B)), 10 min (panel (C), 20 min (panel (D), 40 min (panel (E), and 80 min (panel (F) for analysis by ESI-LCMS. Each LC-MS profile displays the metabolite abundances as a function of chromatographic retention time.
Figure 10.
Mass spectral scans of rat liver extracts incubated with CRV431. Rat (Sprague-Dawley) liver microsomes (1 mg/mL) were incubated with 1 μg/mL CRV431, and extracts were removed for analysis by ESI-LCMS at 20 min (panel (A), mass spectral scan from 1260–1460 m/z) and 80 min (panel (B), mass spectral scan from 1260–1460 m/z).
Figure 11.
CRV431 metabolism in rat liver microsomes. Rat (Sprague Dawley) liver microsomes (1 mg/mL) were incubated with 1 ug/mL CRV431, and extracts were removed at 0 (panel (A)), 20 min (panel (B)), 40 min (panel (C)), and 80 min (panel (D)) for analysis by ESI-LCMS. Each LC-MS profile displays the metabolite abundances as a function of chromatographic retention time.
Table 1.
LC-MS/MS Gradient Conditions for CRV431 Quantitation.
Table 1.
LC-MS/MS Gradient Conditions for CRV431 Quantitation.
| Time (min) | 95:5 v/v Water: Methanol * (%) | Methanol * | Flow Rate (mL/min) |
|---|
| 0.00 | 55 | 45 | 0.5 |
| 0.2 | 55 | 45 | 0.5 |
| 3.0 | 5 | 95 | 0.5 |
| 3.5 | 5 | 95 | 0.5 |
| 3.51 | 55 | 45 | 0.5 |
| 4.2 | Stop | Stop | 0.5 |
Table 2.
LC-MS/MS Gradient Conditions for Elution of CRV431 and Metabolites.
Table 2.
LC-MS/MS Gradient Conditions for Elution of CRV431 and Metabolites.
| Time (min) | dH20 * (%) | ACN * | Flow Rate (mL/min) |
|---|
| 0.00 | 55 | 45 | 1.0 |
| 16.0 | 25 | 75 | 1.0 |
| 16.1 | 0 | 100 | 1.0 |
| 18.1 | 0 | 100 | 1.0 |
| 18.2 | 55 | 45 | 1.0 |
Table 3.
LC-MS Gradient Conditions for Elution of Verapamil.
Table 3.
LC-MS Gradient Conditions for Elution of Verapamil.
| Time (min) | dH20 * (%) | ACN * | Flow Rate (mL/min) |
|---|
| 0.00 | 70 | 30 | 1.0 |
| 8.0 | 45 | 55 | 1.0 |
| 8.1 | 0 | 100 | 1.0 |
| 10.1 | 0 | 100 | 1.0 |
| 10.2 | 70 | 30 | 1.0 |
Table 4.
Identification of CRV431 metabolites in human liver microsomes. Human liver microsomes (1 mg/mL) were incubated with 1 ug/mL CRV431, and extracts were removed for analysis by ESI-LCMS.
Table 4.
Identification of CRV431 metabolites in human liver microsomes. Human liver microsomes (1 mg/mL) were incubated with 1 ug/mL CRV431, and extracts were removed for analysis by ESI-LCMS.
| Component | Proposed Biotransformation | Relative LC-MS Retention | m/z | Δ m/z | % of Total Drug-Related Mass Versus Time (minutes) |
|---|
| | | | | | 0 min | 10 min | 20 min | 40 min | 80 min |
|---|
| CRV431 | NA | 1.0 | 1326 | 0 | 96.4 | 57.0 | 27.5 | 10.4 | 4.0 |
| CRV431 unsaturated impurity | NA | 0.96 | 1324 | NA | 3.6 | 2.9 | 1.8 | 0.7 | 0.2 |
| M1 | Hydroxylation | 0.8 | 1342 | +16 | 0 | 21.2 | 28.3 | 27.4 | 18.3 |
| M2 | Demethylation | 0.8 | 1312 | −14 | 0 | 3.6 | 4.9 | 4.6 | 3.1 |
| M3 | Demethylation | 0.67 | 1312 | −14 | 0 | 5.3 | 13.8 | 21.9 | 27.4 |
| M4 | Demethylation of unsaturated CRV431 | 0.65 | 1310 | −16 | 0 | 0.3 | 1.1 | 1.7 | 2.0 |
| M5 | Didemethylation | 0.62 | 1298 | −28 | 0 | 0 | 0.4 | 1.3 | 2.5 |
| M6 | Dihydroxylation | 0.62 | 1358 | +32 | 0 | 0 | 1.3 | 1.4 | 1.1 |
| M7 | Demethylation + Hydroxylation | 0.58 | 1328 | +2 | 0 | 0.1 | 0.6 | 1.2 | 1.7 |
| M8 | Hydroxylation | 0.52 | 1342 | +16 | 0 | 5.9 | 10.3 | 13.0 | 13.5 |
| M9 | Demethylation + Hydroxylation | 0.47 | 1328 | +2 | 0 | 1.1 | 3.2 | 5.6 | 8.6 |
| M10 | Dihydroxylation | 0.39 | 1358 | +32 | 0 | 1.2 | 3.3 | 5.3 | 6.6 |
| M11 | Demethylation + Hydroxylation | 0.30 | 1328 | +32 | 0 | 0.4 | 1.6 | 4.4 | 8.9 |
| M12 | Dihydroxylation + demethylation | 0.17 | 1344 | +18 | 0 | 0.1 | 0.5 | 1.0 | 1.9 |
Table 5.
Identification of CRV431 metabolites in monkey liver microsomes. Monkey liver microsomes (1 mg/mL) were incubated with 1 ug/mL CRV431, and extracts were removed for analysis by ESI-LCMS.
Table 5.
Identification of CRV431 metabolites in monkey liver microsomes. Monkey liver microsomes (1 mg/mL) were incubated with 1 ug/mL CRV431, and extracts were removed for analysis by ESI-LCMS.
| Component | Proposed Biotransformation | Relative LC-MS Retention | m/z | Δ m/z | % of Total Drug-Related Mass Versus Time (minutes) |
|---|
| | | | | | 0 min | 2.5 min | 5 min | 10 min | 20 min | 40 min | 80 min |
|---|
| CRV431 | NA | 1.0 | 1326 | 0 | 96.3 | 59.4 | 21.5 | 12.3 | 4.3 | 6.6 | 6.7 |
| CRV431 unsaturated impurity | NA | 0.96 | 1324 | −2 | 3.7 | 3.8 | 1.7 | 0.8 | 0 | 0 | 0 |
| M1 | Hydroxylation | 0.8 | 1342 | +16 | 0 | 18.1 | 24.2 | 16.1 | 3.2 | 1.7 | 0.9 |
| M2 | Demethylation | 0.8 | 1312 | −14 | 0 | 3.1 | 6.7 | 2.7 | 0.7 | 0 | 0 |
| M3 | Demethylation | 0.67 | 1312 | −14 | 0 | 3.8 | 7.6 | 8.3 | 5.4 | 3.3 | 0.7 |
| M4 | Demethylation of unsaturated CRV431 | 0.65 | 1310 | −16 | 0 | 0.3 | 0.5 | 0.6 | 0.6 | 0 | 0 |
| M5 | Didemethylation | 0.62 | 1298 | −28 | 0 | 0 | 0.2 | 0.4 | 0.7 | 0.6 | 0 |
| M6 | Dihydroxylation | 0.62 | 1358 | +32 | 0 | 2.4 | 8.2 | 12.6 | 10.9 | 4.8 | 1.3 |
| M7 | Demethylation + Hydroxylation | 0.58 | 1328 | +2 | 0 | 0 | 0 | 1.1 | 0 | 0 | 0 |
| M8 | Hydroxylation | 0.52 | 1342 | +16 | 0 | 1.9 | 3.7 | 3.7 | 2.0 | 0 | 0.4 |
| M9 | Demethylation + Hydroxylation | 0.47 | 1328 | +2 | 0 | 1.9 | 8.6 | 15.6 | 24.8 | 25.2 | 17.6 |
| M10 | Dihydroxylation | 0.39 | 1358 | +32 | 0 | 0.8 | 4.4 | 6.9 | 6.7 | 4.2 | 1.4 |
| M11 | Demethylation + Hydroxylation | 0.30 | 1328 | +32 | 0 | 0.2 | 1.3 | 2.8 | 6.5 | 8.7 | 11.7 |
| M12 | Dihydroxylation + demethylation | 0.17 | 1344 | + 18 | 0 | 0.1 | 0.7 | 1.8 | 6.2 | 11.7 | 21.6 |
| Additional Metabolites Not Detected in Human Liver Microsome Experiments |
| M13 | | 0.75 | 1340 | +14 | 0 | 1.1 | 1.6 | 1.1 | 0 | 0 | 0 |
| M14 | | 0.70 | 1340 | +14 | 0 | 0.9 | 2.4 | 3.2 | 1.7 | 0.6 | 0 |
| M15 | Hydroxylation | 0.65 | 1342 | +16 | 0 | 1.6 | 3.3 | 3.9 | 3.3 | 2.4 | 1.7 |
| M16 | Trihydroxylation | 0.50 | 1374 | +48 | 0 | 0.4 | 1.8 | 2.6 | 2.2 | 1.4 | 0 |
| M17 | Trihydroxylation | 0.46 | 1374 | +48 | 0 | 0.4 | 0.8 | 0.9 | 1.1 | 0 |
| M18 | Didemethylation + hydroxylation | 0.41 | 1314 | −12 | 0 | 0 | 0.2 | 0.6 | 2.3 | 4.1 | 5.4 |
| M19 | Didemethylation + hydroxylation | 0.31 | 1314 | −12 | 0 | 0 | 0.2 | 0.4 | 1.3 | 1.8 | 2.8 |
| M20 | Trihydroxylation | 0.25 | 1374 | +48 | 0 | 0.1 | 0.8 | 1.6 | 3.3 | 2.9 | 1.8 |
| M21 | Dihydroxylation + demethylation | 0.13 | 1344 | +18 | 0 | 0 | 0 | 0 | 1.2 | 3.7 | 8.0 |
| M22 | Dihydroxylation + demethylation | 0.32 | 1344 | +18 | 0 | 0 | 0 | 0 | 5.6 | 8.4 | 11.1 |
| M23 | Dihydroxylation + demethylation | 0.35 | 1344 | +18 | 0 | 0 | 0 | 0 | 3.6 | 2.6 | 1.4 |
| M24 | Hydroxylation | 0.18 | 1342 | +16 | 0 | 0 | 0 | 0 | 2.3 | 4.0 | 5.7 |
Table 6.
Identification of CRV431 metabolites in rat liver microsomes. Rat liver microsomes (1 mg/mL) were incubated with 1 ug/mL CRV431, and extracts were removed for analysis by ESI-LCMS.
Table 6.
Identification of CRV431 metabolites in rat liver microsomes. Rat liver microsomes (1 mg/mL) were incubated with 1 ug/mL CRV431, and extracts were removed for analysis by ESI-LCMS.
| Component | Proposed Biotransformation | Relative LC-MS Retention | m/z | Δ m/z | % of Total Drug-Related Mass Versus Time (minutes) |
|---|
| | | | | | 0 min | 10 min | 20 min | 40 min | 80 min |
|---|
| CRV431 | NA | 1.0 | 1326 | 0 | 96.2 | 95.4 | 94.6 | 93.6 | 92.3 |
| CRV431 unsaturated impurity | NA | 0.96 | 1324 | NA | 3.8 | 3.9 | 3.8 | 3.9 | 4.6 |
| M1 | Hydroxylation | 0.8 | 1342 | +16 | 0 | 0.1 | 0.3 | 0.5 | 0.5 |
| M3 | Demethylation | 0.67 | 1312 | −14 | 0 | 0 | 0.07 | 0.19 | 0.4 |
| M8 | Hydroxylation | 0.52 | 1342 | +16 | 0 | 0.4 | 0.8 | 1.3 | 1.7 |
| M15 | Hydroxylation | 0.65 | 1342 | +16 | 0 | 0.08 | 0.1 | 0.2 | 0.2 |


