Whitebark Pine in the Northern Cascades: Tracking the Effects of Blister Rust on Population Health in North Cascades National Park Service Complex and Mount Rainier National Park

Abstract
:1. Introduction
2. Materials and Methods
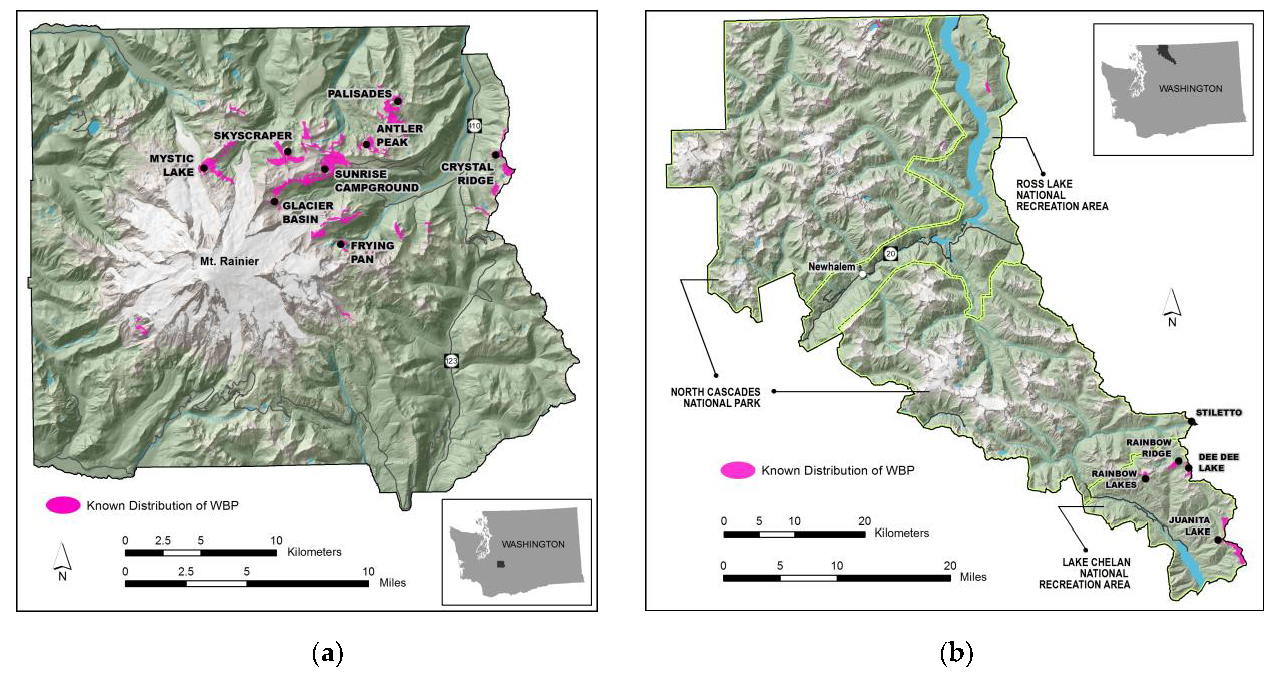
2.1. Study Area
2.2. Field Methods
2.3. Data Analysis
2.3.1. Site Composition and Structure
2.3.2. Population Health of Whitebark Pine Trees, Saplings, and Seedlings
2.3.3. Population Health and Density of Saplings and Seedlings
2.3.4. Landscape Patterns of Whitebark Pine Mortality, Blister Rust Infection, and Prevalence
3. Results
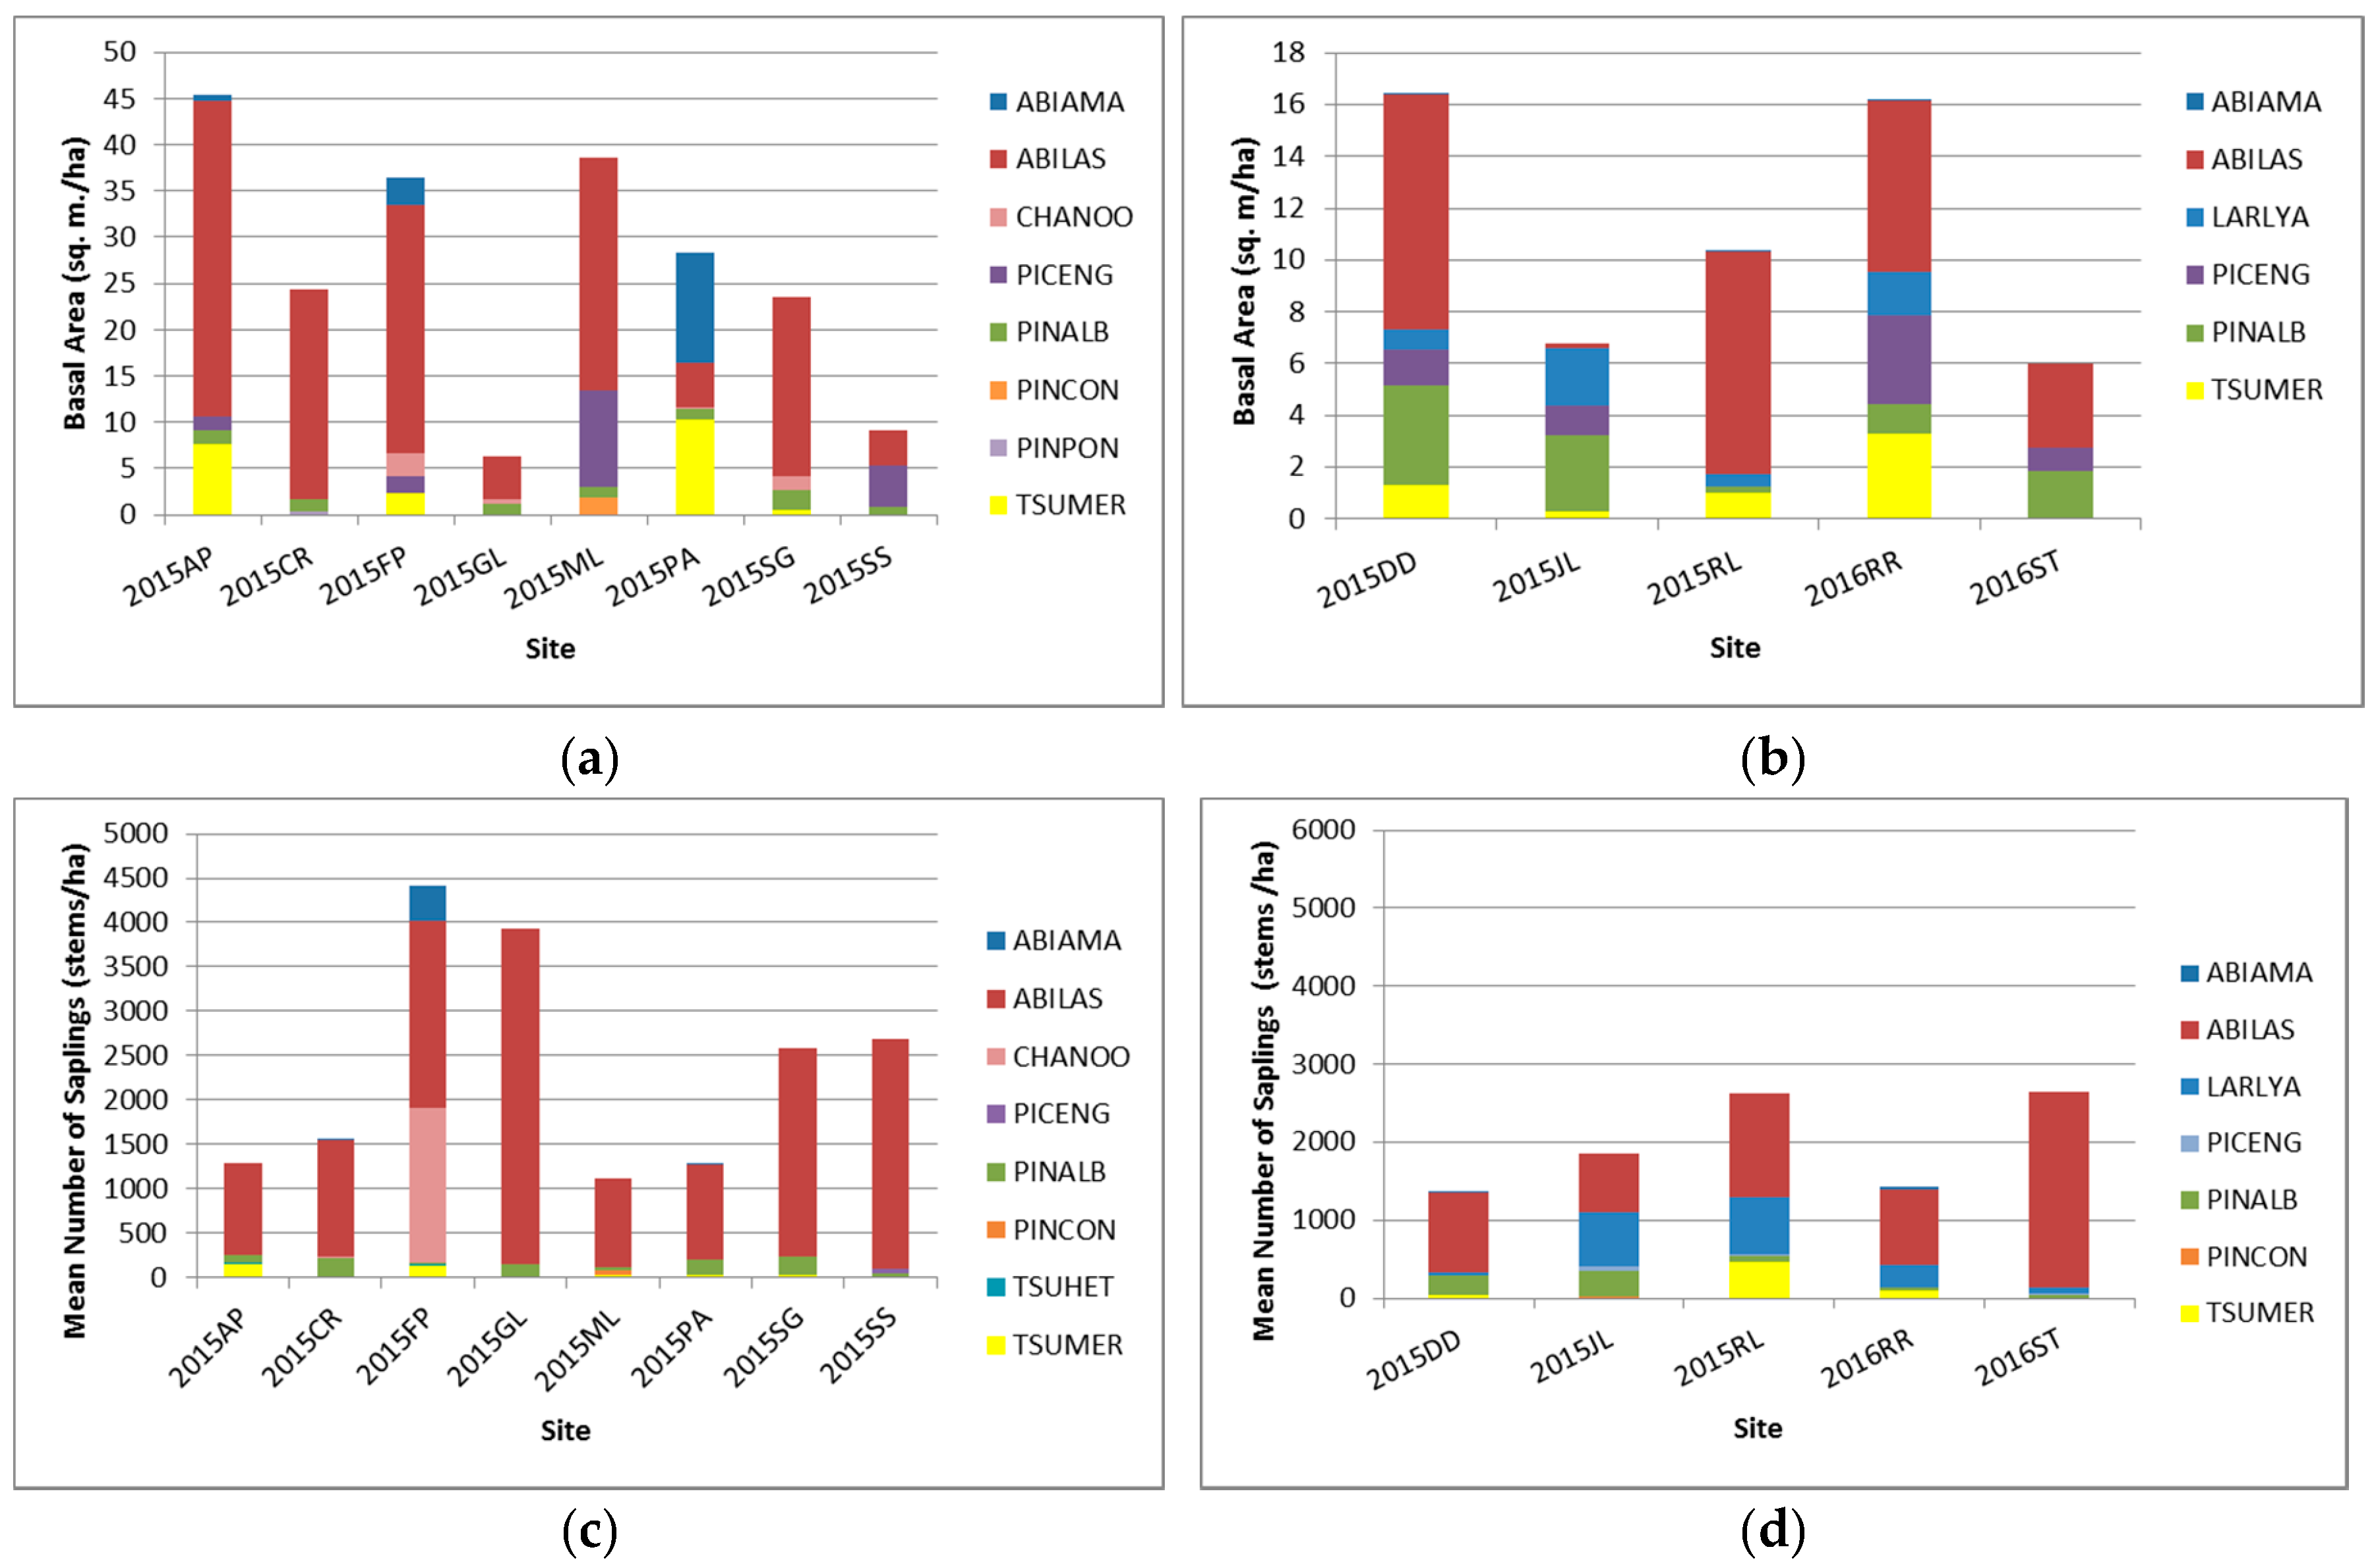
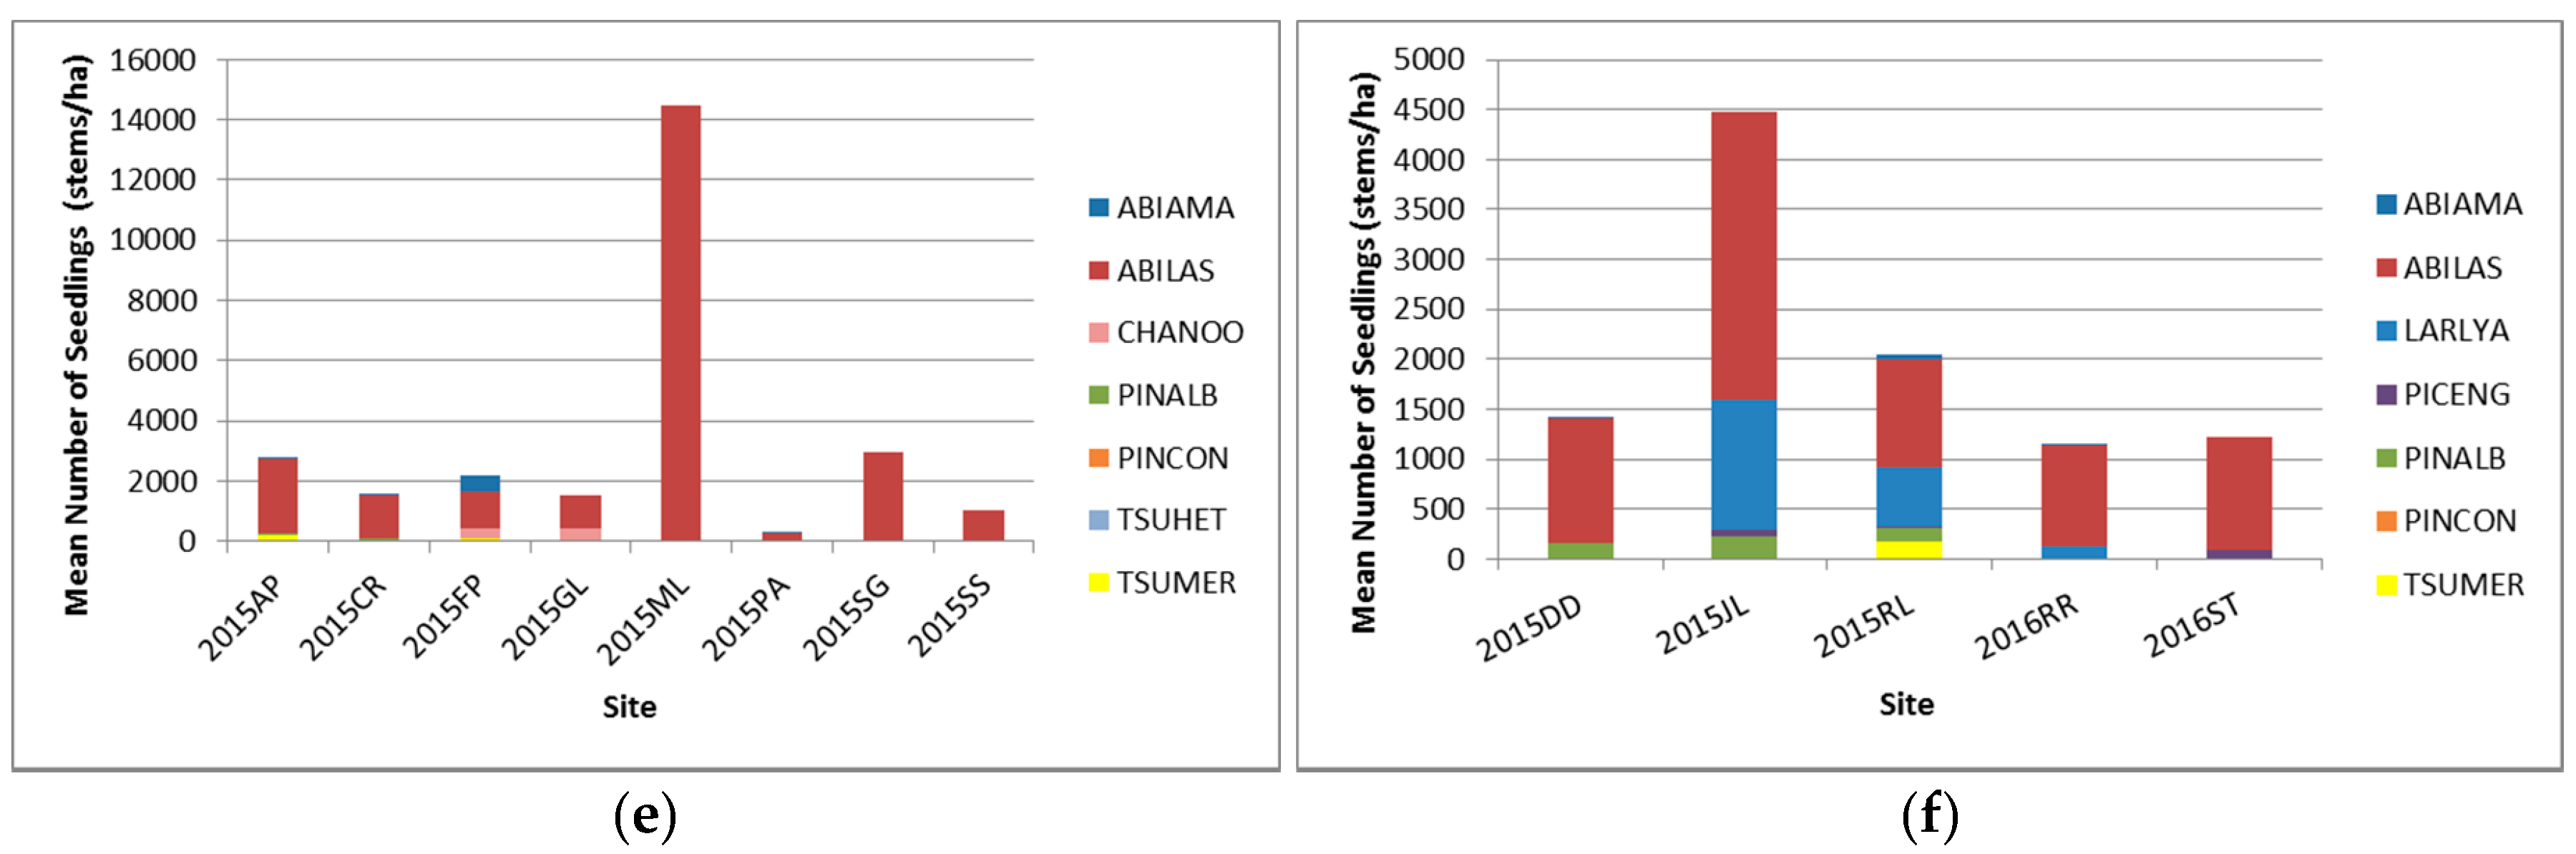
3.1. Current Composition Status of Whitebark Pine Sites
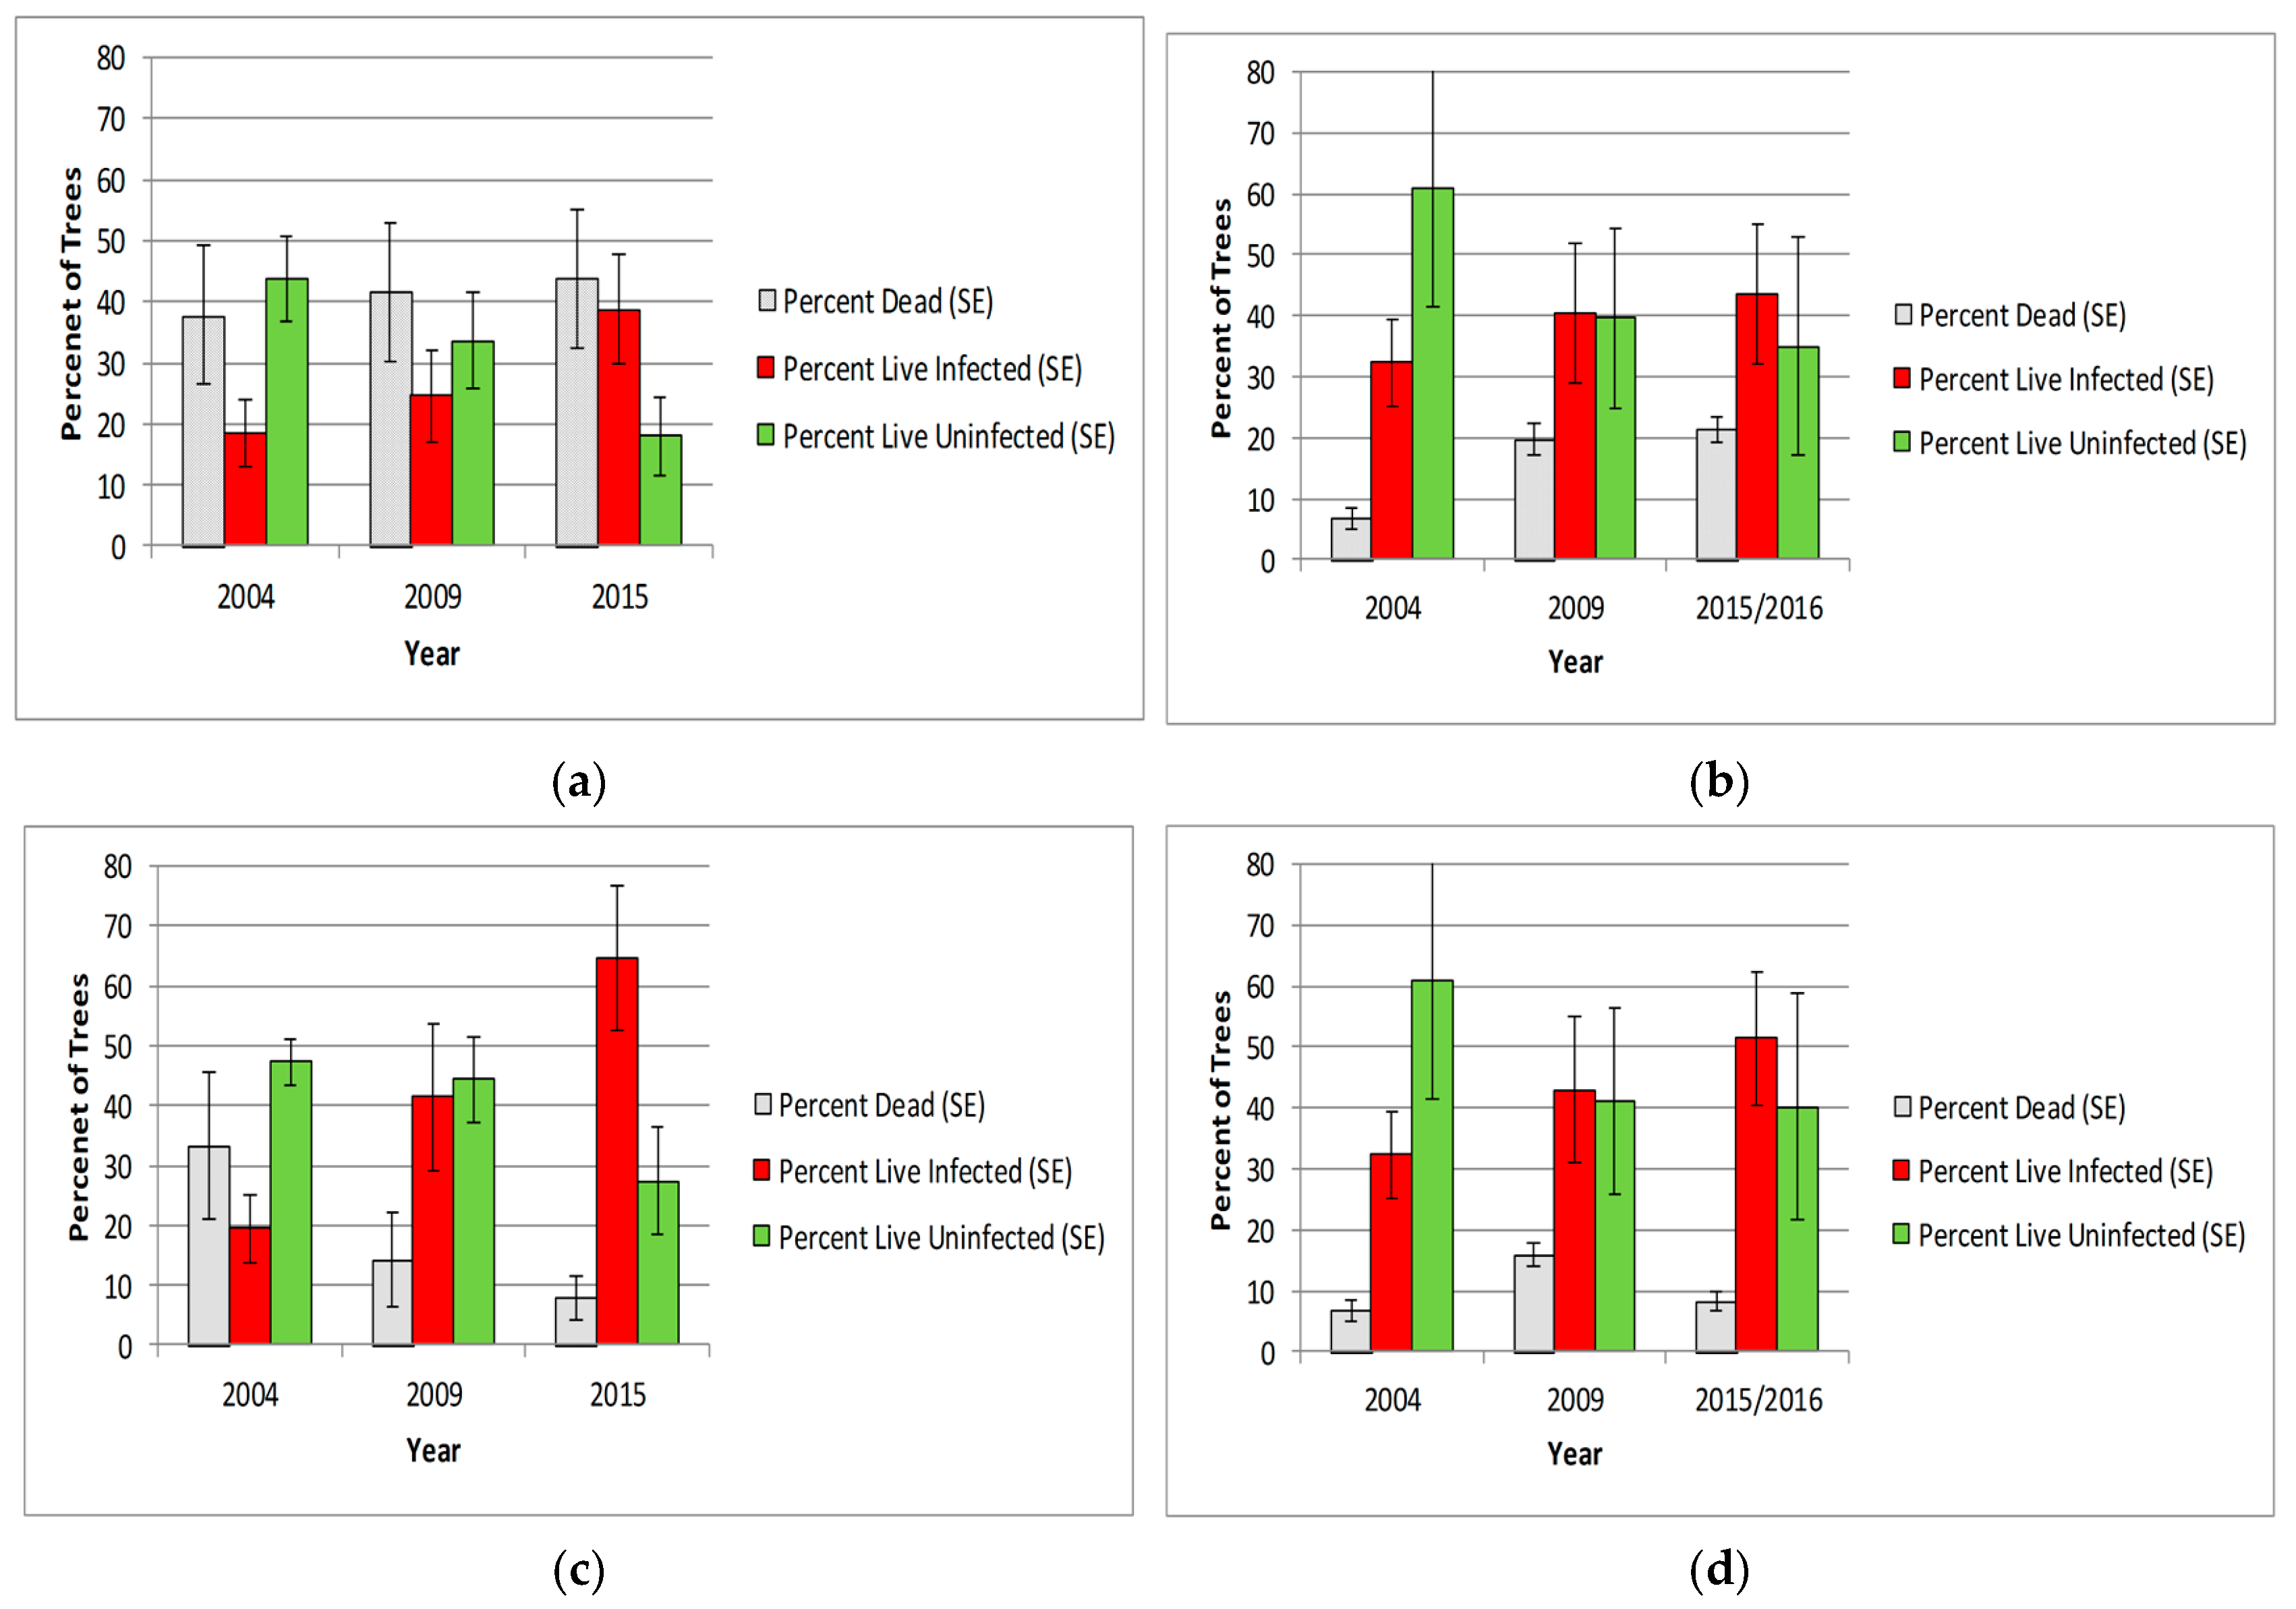
3.2. Population Health
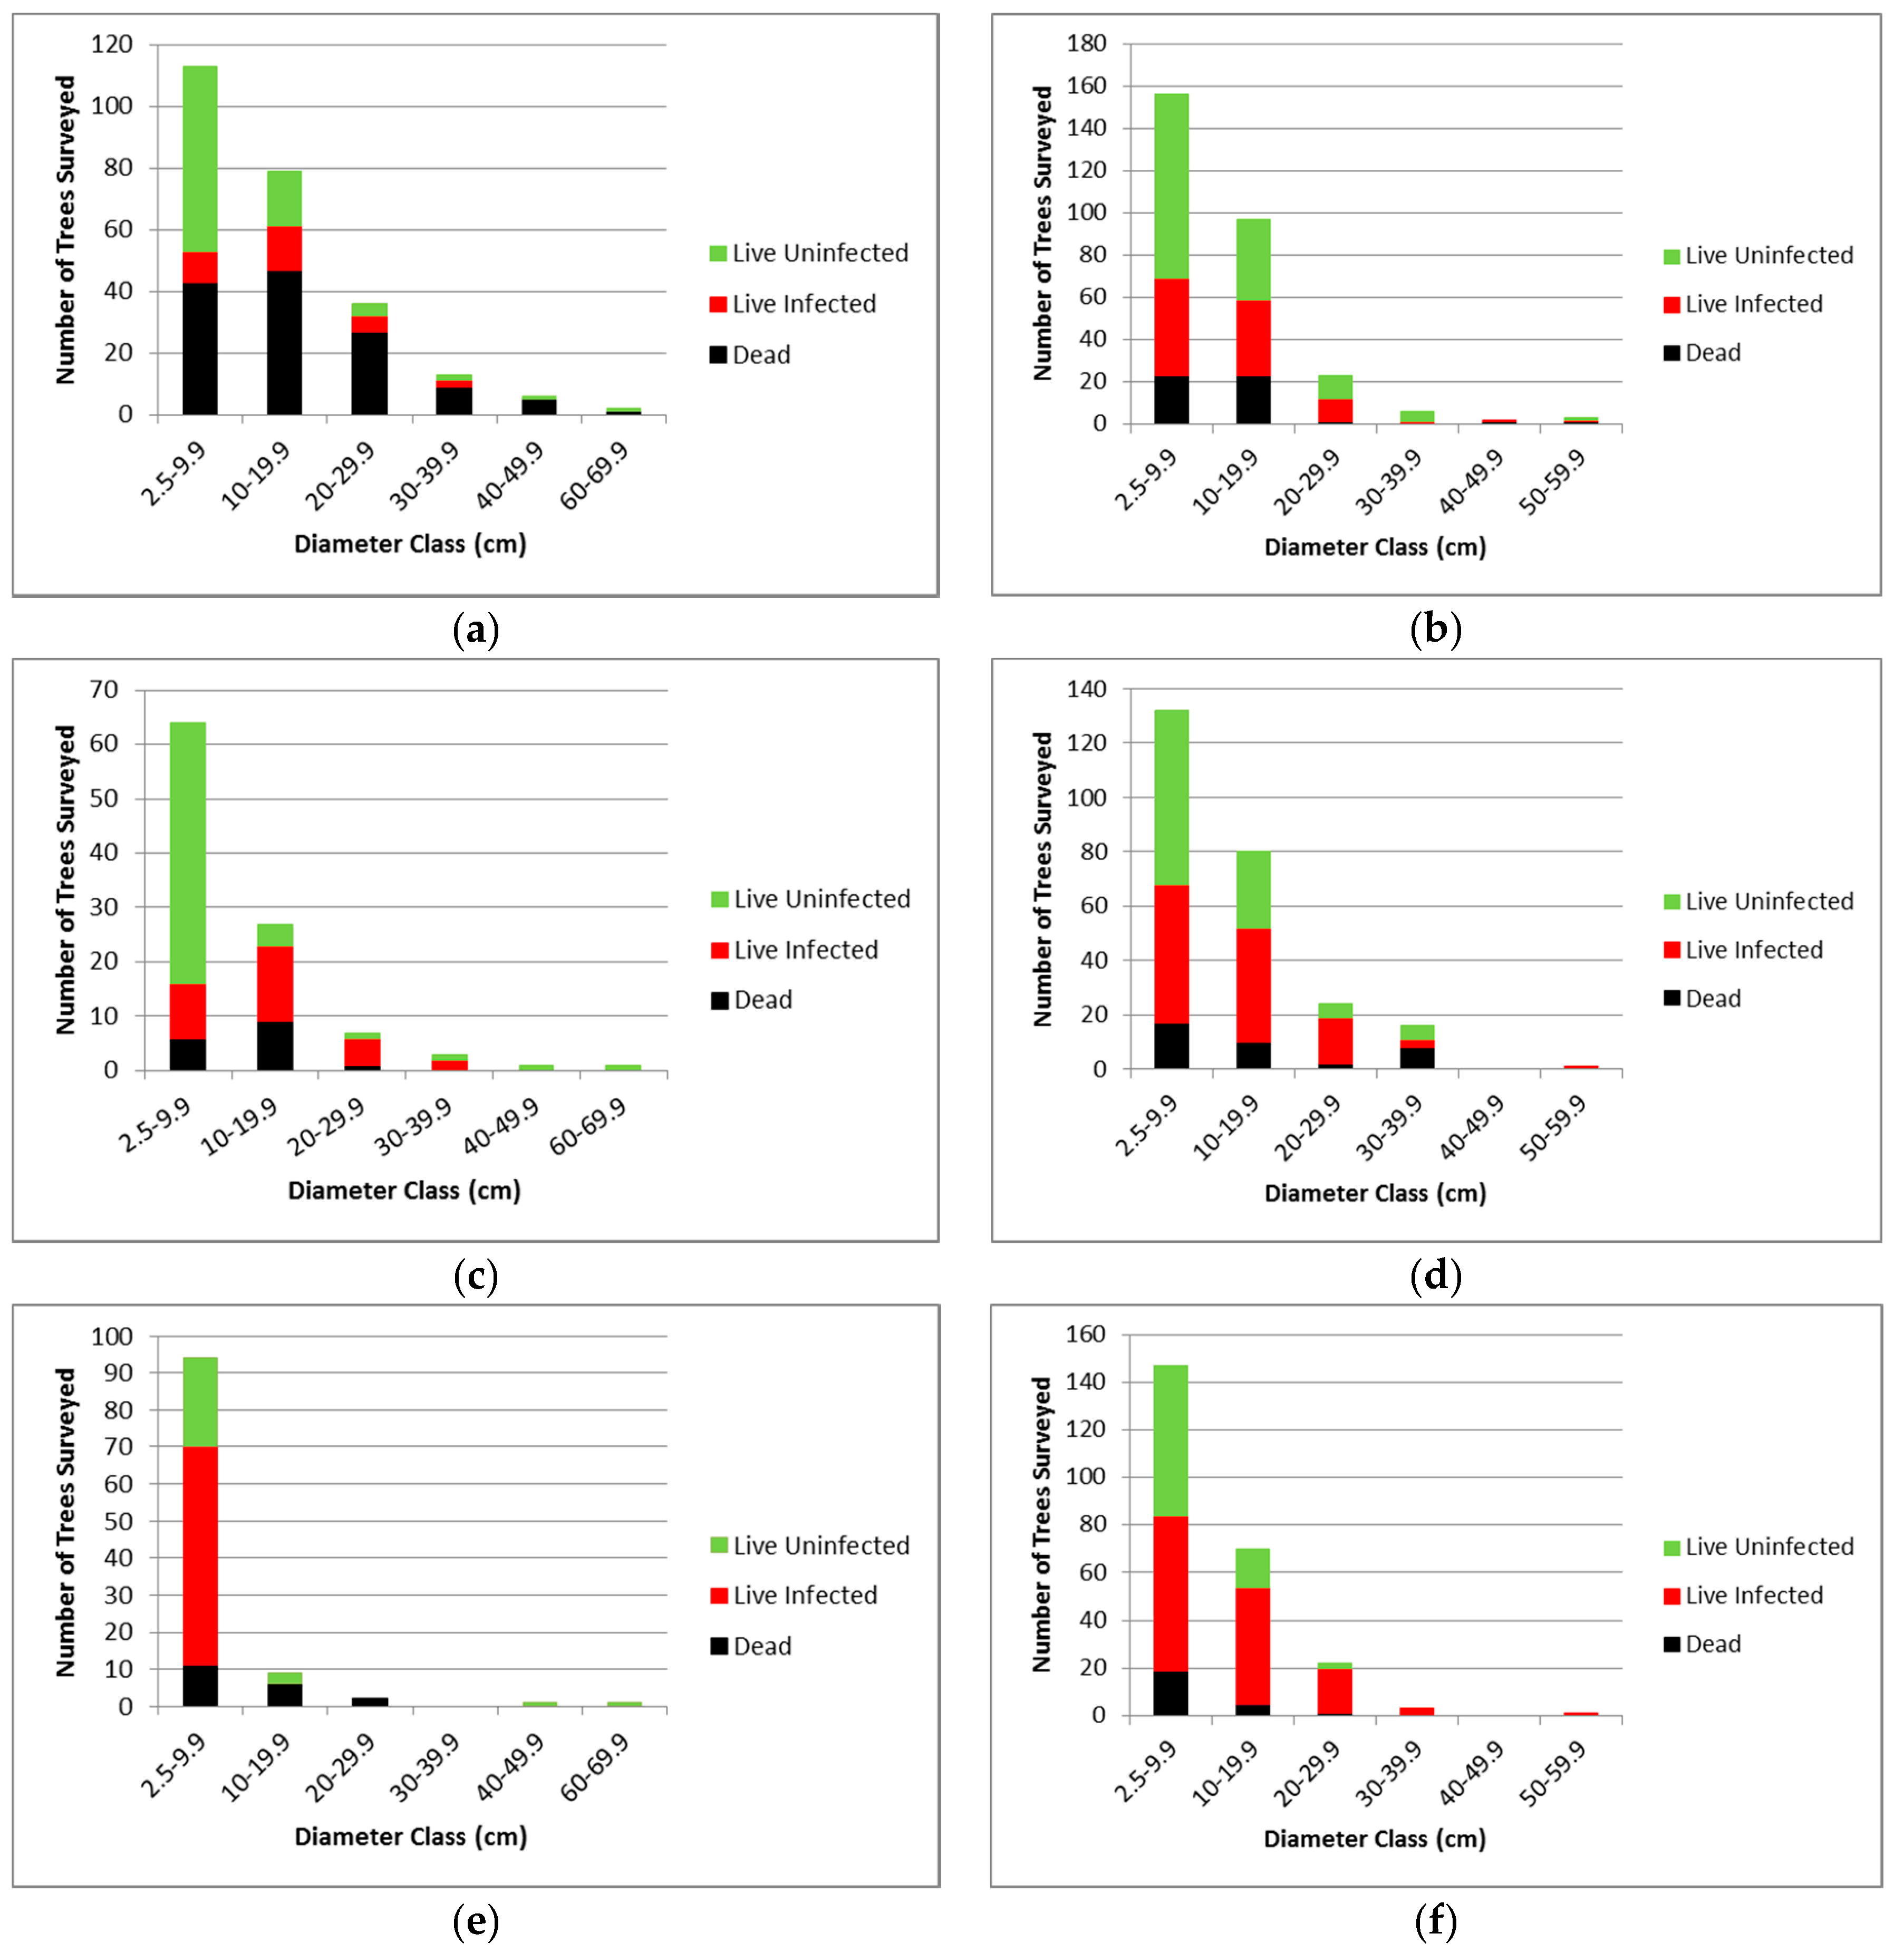
3.2.1. Whitebark Pine Trees
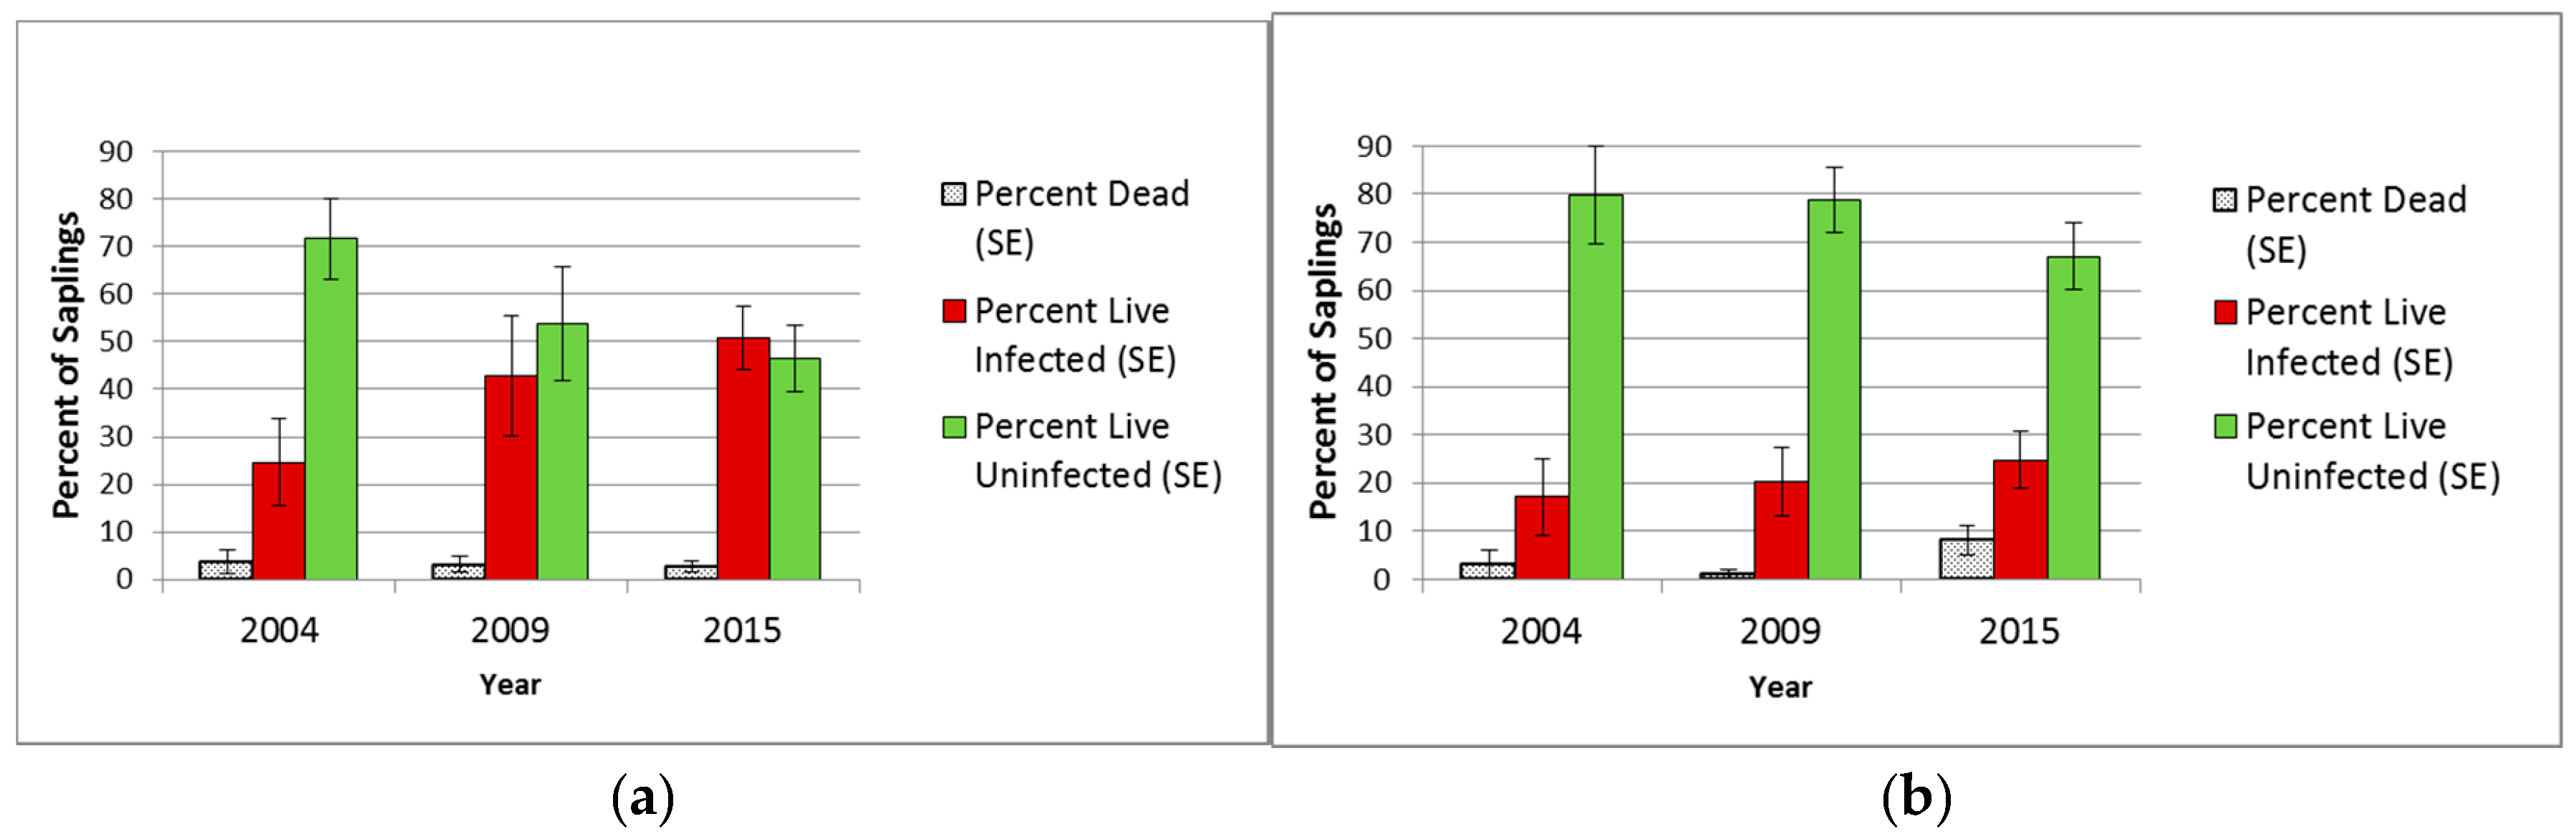
3.2.2. Saplings
3.2.3. Seedlings
3.3. Landscape Patterns of Mortality, WPBR Infection and Prevalence
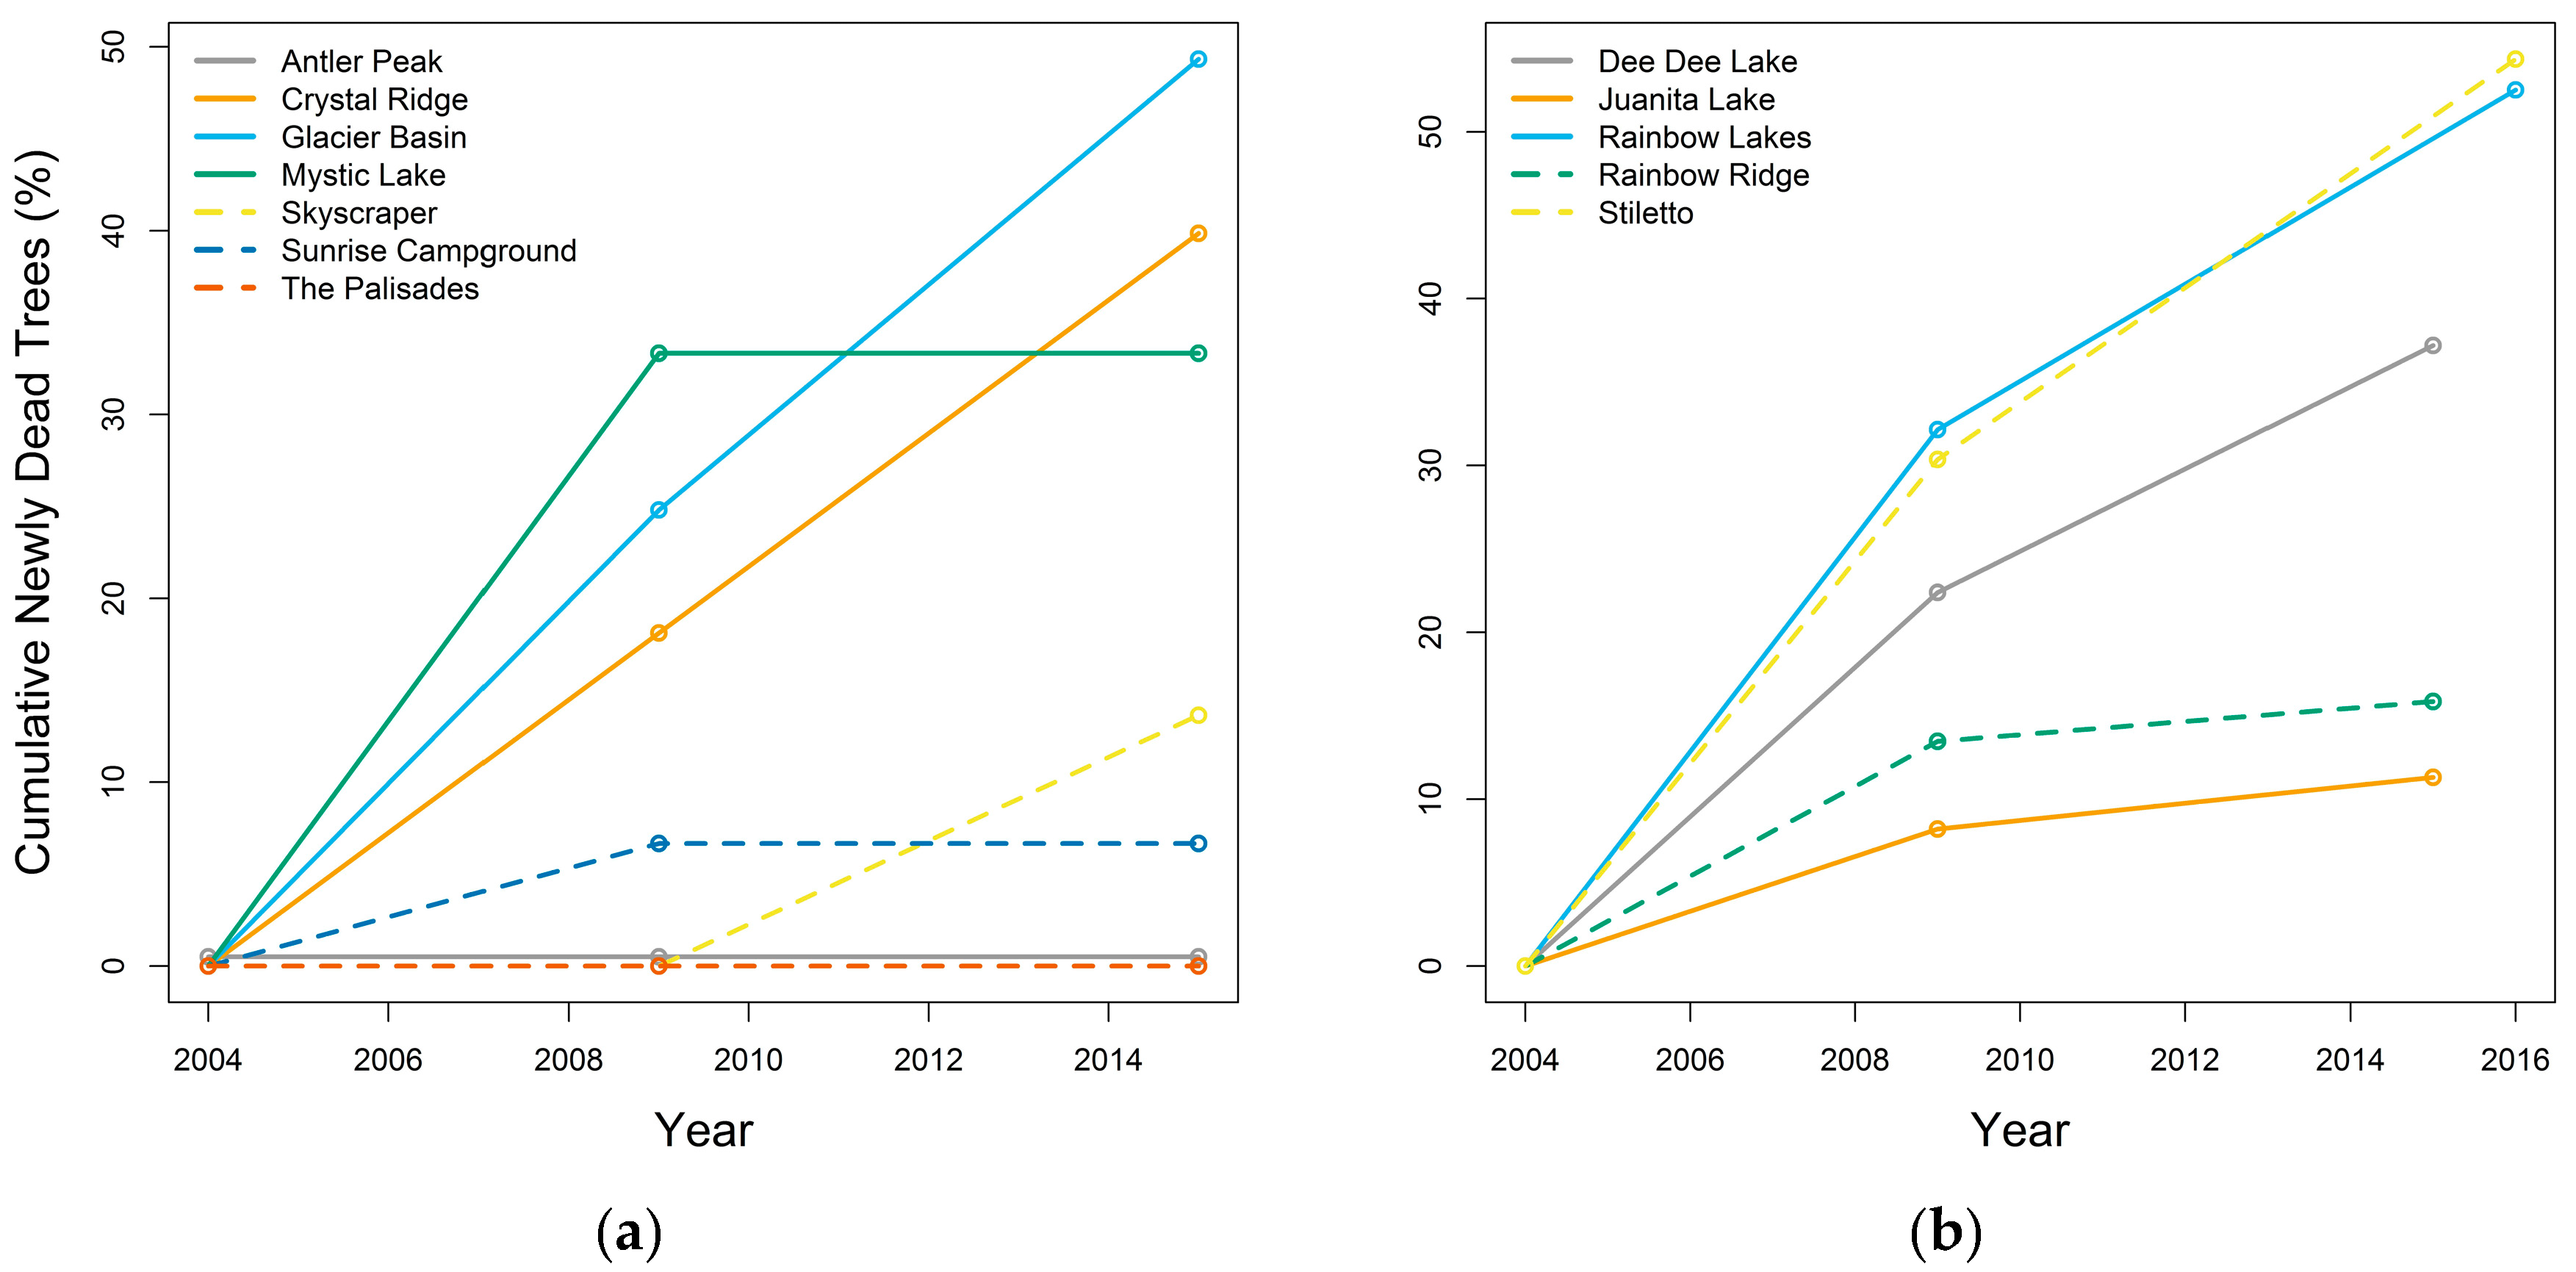
3.3.1. Whitebark Pine Tree Mortality
3.3.2. WPBR Infection
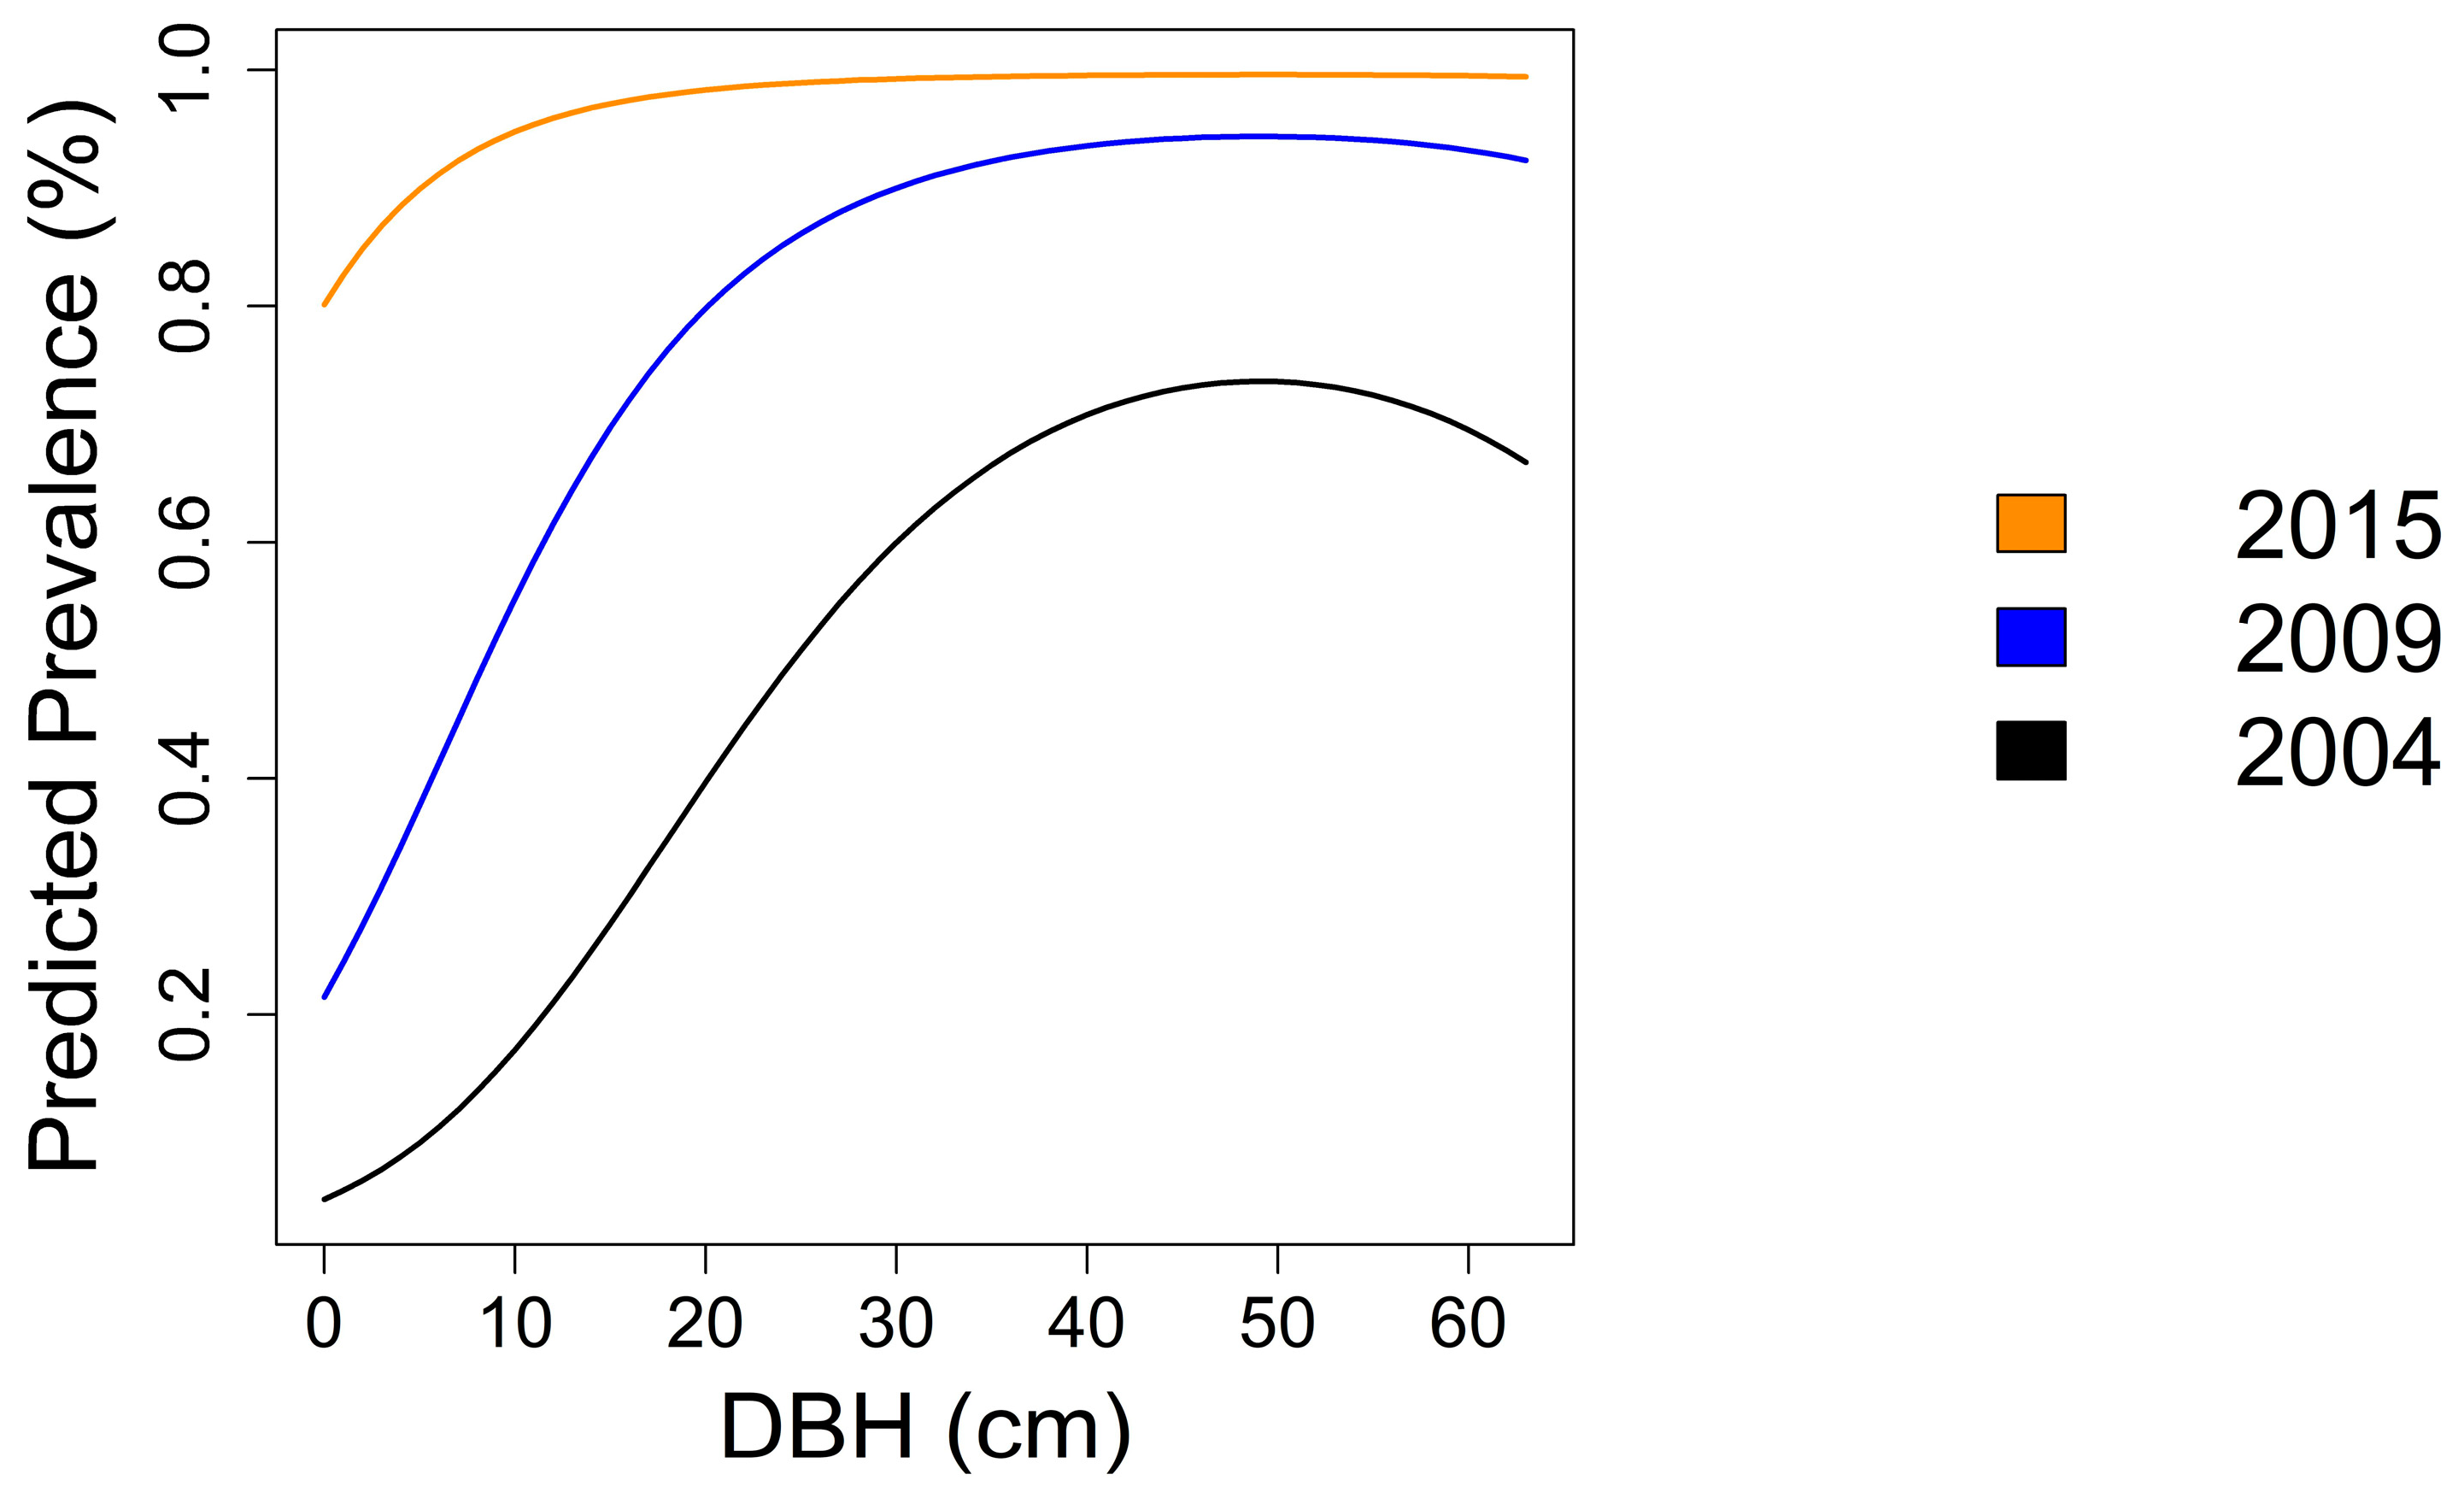
3.3.3. Prevalence
4. Discussion and Conclusions
Supplementary Materials
Author Contributions
Funding
Acknowledgments
Conflicts of Interest
References
- Tomback, D.F.; Arno, S.F.; Keane, R.E. The compelling case for management intervention. In Whitebark Pine Communities: Ecology and Restoration; Tomback, D.F., Arno, S.F., Keane, R.E., Eds.; Island Press: Washington, DC, USA, 2001; pp. 3–28. [Google Scholar]
- Resler, L.M.; Tomback, D.F. Blister rust prevalence in krummholz whitebark pine: implications for treeline dynamics, northern Rocky Mountains, Montana, U.S.A. Arct. Antarct. Alp. Res. 2008, 40, 161–170. [Google Scholar] [CrossRef]
- Benedict, W.V. History of White Pine Blister Rust Control—A Personal Account; US Department of Agriculture Forest Service: Washington, DC, USA, 1981.
- Hadfield, J. History of White Pine Blister Rust on Whitebark Pine in the Pacific Northwest; US Department of Agriculture, Forest Service, Pacific Northwest Region, Forestry Sciences Lab, Wenatchee Service Center: Wenatchee, WA, USA, 2000.
- McDonald, G.I.; Hoff, R.J. Blister rust: An introduced plague. In Whitebark Pine Communities: Ecology and Restoration; Tomback, D.F., Arno, S.F., Keane, R.E., Eds.; Island Press: Washington, DC, USA, 2001; pp. 193–220. [Google Scholar]
- Keane, R.E.; Arno, S.F. Rapid decline of whitebark pine in western Montana: Evidence from 20-year remeasurements. West. J. Appl. For. 1993, 8, 44–47. [Google Scholar]
- Kendall, K.C.; Kean, R.E. Whitebark pine decline: Infection, mortality, and population trends. In Whitebark Pine Communities: Ecology and Restoration; Tomback, D.F., Arno, S.F., Keane, R.E., Eds.; Island Press: Washington, DC, USA, 2001; pp. 221–242. [Google Scholar]
- Murray, M.P.; Rasmussen, M.C. Non-native blister rust diseases on whitebark pine at Crater Lake National Park. Northwest Sci. 2003, 77, 87–90. [Google Scholar]
- Schwandt, J.W.; Lockman, I.B.; Klilejunas, J.T.; Muir, J.A. Current health issues and management strategies for white pines in the western United States and Canada. For. Path. 2010, 40, 226–250. [Google Scholar] [CrossRef]
- Smith, C.M.; Shepard, B.; Stuart-Smith, J. Changes in blister rust infection and mortality over time. Can. J. For. Res. 2013, 43, 90–96. [Google Scholar] [CrossRef]
- U.S. Fish and Wildlife. Endangered and threatened wildlife and plants; 12-month finding on petition to list Pinus albicaulis as endangered or threatened with critical habitat. Fed. Regist. 2011, 76, 42631–42654. [Google Scholar]
- Species at Risk Public Registry. Available online: http://registrelep-sararegistry.gc.ca/default.asp?lang=en&n=6B319869-1#2 (accessed on 23 March 2018).
- Gynn, J.C.; Chapman, C.M. Blister Rust Control, Mount Rainier National Park; Unpublished Report; Mount Rainier National Park: Washington, DC, USA, 1951.
- Gynn, J.C.; Chapman, C.M. Blister Rust Control, Mount Rainier National Park; Unpublished Report; Mount Rainier National Park: Washington, DC, USA, 1952.
- Rochefort, R.M. The influence of white pine blister rust (Cronartium rubicola) on whitebark pine (Pinus albicaulis) in Mount Rainier National Park and North Cascades National Park Service Complex, Washington. Nat. Areas J. 2008, 28, 290–298. [Google Scholar] [CrossRef]
- Goheen, E.M.; Goheen, D.J.; Marshall, K.; Danchok, R.S.; Petrick, J.A.; White, D.E. The Status of Whitebark Pine along the Pacific Crest National Scenic Trail on the Umpqua National Forest; General Technical Report PNW-GTR-530; U.S. Department of Agriculture, Forest Service, Pacific Northwest Research Station: Portland, OR, USA, 2002.
- Shoal, R.; Aubry, C. Assessment of Whitebark Pine Health on Eight National Forests in Oregon and Washington; US Department of Agriculture, Forest Service, Pacific Northwest Region: Olympia, WA, USA, 2006.
- Smith, C.M.; Wilson, B.; Rasheed, S.; Walker, R.C.; Carolin, T.; Shepard, B. Whitebark pine and white pine blister rust in the Rocky Mountains of Canada and northern Montana. Can. J. For. Res. 2008, 38, 982–995. [Google Scholar] [CrossRef]
- Rochefort, R.M.; Bivin, M.M.; Boetsch, J.R.; Grace, L.; Howlin, S.; Acker, S.A.; Thompson, C.C.; Whiteaker, L. Alpine and Subalpine Vegetation Monitoring Protocol for the North Coast and Cascades Network; Natural Resource Report NPS/NCCN/NRR—2012/570; National Park Service: Fort Collins, CO, USA, 2012.
- National Park Service, Branch of Forestry CCC. Vegetation Cover Survey for Mount Rainier National Park; Published Report-132562; National Park Service, Branch of Forestry CCC: Washington, DC, USA, 1936.
- Agee, J.K.; Kertis, J. Vegetation Cover Types of the North Cascades; Report CPSU/US 86-2; National Park Service, Cooperative Park Studies Unit, College of Forest Resources, University of Washington: Seattle, WA, USA, 1986. [Google Scholar]
- Hoff, R.J. How to Recognize Blister Rust Infection on Whitebark Pine; US Department of Agriculture, Forest Service, Intermountain Research Station: Ogden, UT, USA, 1992.
- Cochran, W.G. Sampling Techniques, 3rd ed.; John Wiley and Sons, Inc.: Hoboken, NJ, USA, 1977. [Google Scholar]
- R Core Team. R: A Language and Environment for Statistical Computing; R Foundation for Statistical Computing: Vienna, Austria, 2015. [Google Scholar]
- Burnham, K.P.; Anderson, D.R. Model Selection and Multimodel Inference: A Practical Information-Theoretic Approach, 2nd ed.; Springer: New York, New York, USA, 2002. [Google Scholar]
- Campbell, E.M.; Antos, J.A. Distribution and severity of white pine blister rust and mountain pine beetle on whitebark pine in British Columbia. Can. J. For. Res. 2000, 30, 1051–1059. [Google Scholar] [CrossRef]
- Ettl, G.J.; Cottone, N. Whitebark pine (Pinus albicaulis) in Mt. Rainier National Park, Washington, USA; response to blister rust infection. In Species Conservation and Management: Case Studies Using RAMAS GIS; Akcakaya, H.R., Burgman, M.A., Kindvall, O., Wood, C.C., Sjogren-Gulve, P., Hatfield, J., McCarthy, M.A., Eds.; Oxford University Press: New York, NY, USA, 2004; pp. 36–47. [Google Scholar]
- Keane, R.E.; Holsinger, L.M.; Mahalovich, M.F.; Tomback, D.F. Restoring Whitebark Pine Ecosystems in the Face of Climate Change; Gen. Tech. Rep. RMRS-GTR-361; Department of Agriculture, Forest Service, Rocky Mountain Research Station: Fort Collins, CO, USA, 2017; p. 123.
- Liu, J.; Sniezko, R.; Murray, M.; Wang, N.; Chen, H.; Zamany, A.; Sturrock, R.N.; Savin, D.; Kegley, A. Genetic diversity and population structure of whitebark pine (Pinus albicaulis Engelm.) in western North America. PLoS ONE 2016, 11, e0167986. [Google Scholar] [CrossRef] [PubMed]
- Sniezko, R.A.; Kegley, A.; Danchok, R.; Long, S. Blister rust resistance in whitebark pine—Early results following artifical inoculation of seedlings from Oregon, Washington, Idaho, Montana, California, and British Columbia seed sources. In Proceedings of the IUFRO Joint conference: Genetics of Five-Needle Pines, Rusts of Forest Trees, and Strobusphere, Fort Collins, CO, USA, 15–24 June 2014; Schoettle, A.W., Sniezko, R.A., Kliejunas, J.T., Eds.; RMRS-P-76. U.S. Department of Agriculture, Forest Service, Rocky Mountain Research Station: Fort Collins, CO, USA, 2018. [Google Scholar]
- McCaughey, W.; Scott, G.L.; Izlar, K.L. Whitebark pine planting guidelines. West. J. Appl. For. 2009, 24, 163–166. [Google Scholar]
- McKinney, S.T.; Tomback, D.F. The influence of white pine blister rust on seed dispersal in whitebark pine. Can. J. For. Res. 2007, 37, 1044–1057. [Google Scholar] [CrossRef]
- Keane, R.; Parsons, R.S. Restoring whitebark pine forests of the Northern Rocky Mountains, USA. Ecol. Restor. 2010, 28, 56–70. [Google Scholar] [CrossRef]
- Barringer, L.E.; Tomback, D.F.; Wunder, M.B.; McKinney, S.T. Whitebark pine stand condition, tree abundance, and cone production as predictors of visitation by Clark’s Nutcracker. PLoS ONE 2012, 7, e37663. [Google Scholar] [CrossRef] [PubMed]
- Larson, E.R. Influences of the biophysical environment on blister rust and mountain pine beetle, and their interactions, in whitebark pine forests. J. Biogeogr. 2011, 453–470. [Google Scholar] [CrossRef]
- Larson, E.R.; Kipfmueller, K.F. Patterns in whitebark pine regeneration and their relationships to biophysical site characteristics in southwest Montanan, central Idaho, and Oregon, USA. Can. J. For. Res. 2010, 40, 476–487. [Google Scholar] [CrossRef]
- Ray, C.; Saracco, J.F.; Holmgren, M.L.; Wilkerson, R.L.; Siegel, R.B.; Jenkins, K.L.; Ransom, J.I.; Happe, P.J.; Boetsch, J.R.; Huff, M.H. Recent stability of resident and migratory landbird populations in National Parks of the Pacific Northwest. Ecosphere 2017, 8, e01902. [Google Scholar] [CrossRef]
- Littell, J.S.; Raymond, C.L.; Rochefort, R.M.; Klein, S.L. Climate change and vegetation in the North Cascade range. In Climate Change Vulnerability and Adaptation in the North Cascades Region, Washington; Raymond, C.L., Peterson, D.L., Rochefort, R.M., Eds.; General Technical Report, PNW_GTR-892; U.S. Department of Agriculture, Forest Service, Pacific Northwest Research Station: Portland, OR, USA, September 2014; p. 279. [Google Scholar]
- Siderius, J.; Murray, M.P. Fire Knowledge for Managing Cascadian Whitebark Pine Ecosystems; National Park Service and Crater Lake National Park: Seattle, WA, USA, 2005; pp. 1–44.
- Smith, J.P.; Hoffman, J.T. Status of white pine blister rust in the Intermountain West. West. N. Am Nat. 2000, 60, 165–179. [Google Scholar]
- The National Park Service Organic Act. Available online: https://www.nps.gov/grba/learn/management/organic-act-of-1916.htm (accessed on 30 March 2018).
- United State National Park System Advisory Board. Revisiting Leopold: Resource Stewardship in the National Parks. In The George Wright Forum; The George Wright Society: Hancock, MI, USA, 2012; pp. 1–23. [Google Scholar]
- Whitebark Pine Foundation, National Whitebark Pine Restoration Plan. Available online: http://whitebarkfound.org/national-whitebark-pine-restoration-plan/ (accessed on 30 March 2018).
- Wilderness Act, 16 USC 1131–1136; PL 88–577. Available online: https://www.wilderness.net/nwps/legisact (accessed on 30 March 2018).

| Site | Mean Elevation (meters) | Number of Plots Sampled | ||
|---|---|---|---|---|
| 2004 | 2009 | 2015/16 1 | ||
| Mount Rainier National Park | ||||
| Antler Peak | 1858 | 4 | 4 | 4 |
| Crystal Ridge | 1927 | 5 | 5 | 5 |
| Frying Pan | 1817 | 3 | 3 | 3 |
| Glacier Basin | 2033 | 5 | 5 | 5 |
| Mystic Lake | 1872 | 3 | 3 | 3 |
| Skyscraper | 1962 | 2 | 2 | 2 |
| Sunrise Campground | 1940 | 5 | 5 | 5 |
| Palisades | 1883 | 2 | 2 | 2 |
| North Cascades National Park Service Complex | ||||
| Dee Dee Lake | 1976 | 7 | 7 | 7 |
| Juanita Lake | 2084 | 7 | 7 | 7 |
| Rainbow Lakes | 1870 | 7 | 7 | 7 |
| Rainbow Ridge | 1987 | 7 | 7 | 7 |
| Stiletto | 1938 | 7 | 7 | 7 |
| Park | Year | Sites (n) | Plots | Whitebark Pine Trees | Whitebark Pine Trees per Plot |
|---|---|---|---|---|---|
| Mount Rainier National Park | 2004 | 8 | 29 | 249 | 1–43 |
| 2009 | 8 | 29 | 260 | 1–40 | |
| 2015 | 8 | 29 | 258 | 1–39 | |
| North Cascades National Park Service Complex | 2004 | 5 | 35 | 287 | 1–79 |
| 2009 | 5 | 35 | 295 | 1–82 | |
| 2015/2016 | 5 | 35 | 312 | 1–86 |
| Model Form | AICc | DeltaAICc |
|---|---|---|
| Percent Dead ~ Northness + Eastness + Park | 309.4 | 0.0 |
| Percent Dead ~ Slope + Northness + Eastness + Park | 310.1 | 0.7 |
| Percent Dead ~ Elevation + Northness + Eastness + Park | 310.7 | 1.3 |
| Percent Dead ~ Northness + Eastness + Park + dbh | 311.1 | 1.7 |
| Percent Dead ~ Elevation + Slope + Northness + Eastness + Park | 311.6 | 2.2 |
| Model Form | AICc | DeltaAICc |
|---|---|---|
| Percent Infection ~ Northness + Eastness + Park | 321.9 | 0.0 |
| Percent Infection ~ Slope + Northness + Eastness + Park | 322.6 | 0.7 |
| Percent Infection ~ Northness + Eastness + Park + dbh | 323.8 | 1.9 |
| Percent Infection ~ Slope + Northness + Eastness + Park + dbh | 324.6 | 2.7 |
| Percent Infection ~ Northness + Eastness | 326.5 | 4.6 |
| Model Form | AICc | DeltaAICc |
|---|---|---|
| prevalence ~ dbh + dbh2 + year | 1312.7 | 0.0 |
| prevalence ~ dbh + dbh2 + Park + year | 1313.3 | 0.6 |
| prevalence ~ dbh + dbh2 + year + dbh:year | 1314.0 | 1.4 |
| prevalence ~ dbh + dbh2 + Park + year + dbh:year | 1314.7 | 2.0 |
| prevalence ~ dbh + year | 1323.2 | 10.5 |
© 2018 by the authors. Licensee MDPI, Basel, Switzerland. This article is an open access article distributed under the terms and conditions of the Creative Commons Attribution (CC BY) license (http://creativecommons.org/licenses/by/4.0/).
Share and Cite
Rochefort, R.M.; Howlin, S.; Jeroue, L.; Boetsch, J.R.; Grace, L.P. Whitebark Pine in the Northern Cascades: Tracking the Effects of Blister Rust on Population Health in North Cascades National Park Service Complex and Mount Rainier National Park. Forests 2018, 9, 244. https://doi.org/10.3390/f9050244
Rochefort RM, Howlin S, Jeroue L, Boetsch JR, Grace LP. Whitebark Pine in the Northern Cascades: Tracking the Effects of Blister Rust on Population Health in North Cascades National Park Service Complex and Mount Rainier National Park. Forests. 2018; 9(5):244. https://doi.org/10.3390/f9050244
Chicago/Turabian StyleRochefort, Regina M., Shay Howlin, Lacey Jeroue, John R. Boetsch, and Lise P. Grace. 2018. "Whitebark Pine in the Northern Cascades: Tracking the Effects of Blister Rust on Population Health in North Cascades National Park Service Complex and Mount Rainier National Park" Forests 9, no. 5: 244. https://doi.org/10.3390/f9050244