Article

Composition and Structure of Forest Fire Refugia: What Are the Ecosystem Legacies across Burned Landscapes?

Department of Forest Ecosystems and Society, College of Forestry, Oregon State University, 321 Richardson Hall, Corvallis, OR 97331, USA
*
Author to whom correspondence should be addressed.
Forests 2018, 9(5), 243; https://doi.org/10.3390/f9050243
Submission received: 13 April 2018 / Revised: 27 April 2018 / Accepted: 27 April 2018 / Published: 2 May 2018
(This article belongs to the Special Issue Wildland Fire, Forest Dynamics, and Their Interactions)

Abstract

:
Locations within forest fires that remain unburned or burn at low severity—known as fire refugia—are important components of contemporary burn mosaics, but their composition and structure at regional scales are poorly understood. Focusing on recent, large wildfires across the US Pacific Northwest (Oregon and Washington), our research objectives are to (1) classify fire refugia and burn severity based on relativized spectral change in Landsat time series; (2) quantify the pre-fire composition and structure of mapped fire refugia; (3) in forested areas, assess the relative abundance of fire refugia and other burn severity classes across forest composition and structure types. We analyzed a random sample of 99 recent fires in forest-dominated landscapes from 2004 to 2015 that collectively encompassed 612,629 ha. Across the region, fire refugia extent was substantial but variable from year to year, with an annual mean of 38% of fire extent and range of 15–60%. Overall, 85% of total fire extent was forested, with the other 15% being non-forest. In comparison, 31% of fire refugia extent was non-forest prior to the most recent fire, highlighting that mapped refugia do not necessarily contain tree-based ecosystem legacies. The most prevalent non-forest cover types in refugia were vegetated: shrub (40%), herbaceous (33%), and crops (18%). In forested areas, the relative abundance of fire refugia varied widely among pre-fire forest types (20–70%) and structural conditions (23–55%). Consistent with fire regime theory, fire refugia and high burn severity areas were inversely proportional. Our findings underscore that researchers, managers, and other stakeholders should interpret burn severity maps through the lens of pre-fire land cover, especially given the increasing importance of fire and fire refugia under global change.

1. Introduction

Wildland fire is a pervasive ecological disturbance process that interacts with and shapes landscape patterns throughout the world. In forest ecosystems, large wildfire perimeters encompass a variety of land cover types, including forest, non-forest, and unvegetated areas, and the interaction of fuels, weather, and topography results in patchy burn severity mosaics that range from high severity (i.e., large ecological change such as complete tree mortality) to low severity (i.e., little or no ecological change) [1,2,3]. Land managers, scientists and policy makers increasingly rely on remotely sensed burn severity maps to characterize and interpret these fire effects at landscape scales [4,5,6]. Fire refugia, defined here following Krawchuk et al. [7] as places that burn less frequently or severely than the surrounding landscape, have become a topic of increasing interest, particularly in the context of global change and conservation of broader refugia [8,9,10]. Fire refugia represent ecosystem legacies that can perform important ecological functions, such as protecting fire-sensitive flora and fauna and providing propagules for the regeneration of more severely burned locations (e.g., [11,12,13,14]). In this way, the resistance of fire refugia may confer resilience to landscapes that will be increasingly important given projections of increasing fire activity due to climate warming and land use [15,16,17]. Although previous studies in western North American forests have used satellite imagery to quantify the distribution and abundance of fire refugia [5,18,19] or their predictability [7], very little is known about the composition and structure of these areas. Because forest-dominated landscapes can include diverse forest and non-forest conditions, quantifying the variability of fire refugia across heterogeneous regions is essential to evaluate assumptions regarding their ecological functions and to support ecosystem management. Our study develops new approaches to quantify and characterize the composition and structure of fire refugia at landscape and regional scales with detailed ecological resolution.
Studies to date typically characterize forest fire refugia with two basic approaches, either with intensive field observations at a limited number of locations or across extensive landscapes and regions without specific information on local conditions. Researchers have conducted field-based assessments in different geographical settings, including Australia (e.g., [12,20,21]) and western North America (e.g., [7,8,9,22]), typically with the goal of understanding conditions that give rise to fire refugia over long time scales and for specific types of organisms or species. For example, Camp et al. [8] used inventory plots to assess the composition and structure of forest sites that had not burned as frequently or severely as adjacent forests in Washington, USA, associating refugia with late-successional characteristics, including fire-intolerant species, old trees, multi-layered canopies, and downed coarse wood. These refugia contained abundant fuel for a subsequent fire event, leading to marginally higher overstory tree mortality in refugial than in non-refugial sites and demonstrating that late-successional refugia are dynamic [9]. These and other local-scale studies (e.g., [23,24]) raise questions about the persistence and sustainability of fire refugia under global change, but they are not designed to quantify fire refugia composition and structure at broader scales.
In contrast to field-based studies, landscape and regional assessments have leveraged spatially and temporally extensive satellite imagery to map and identify refugia locations within fire perimeters as areas that remain unburned or burn with low severity. These locations, typically defined by low spectral change between pre- and post-fire images, appear to be more abundant than previously thought (e.g., 20% of fire perimeters [18]). However, these remotely mapped refugia likely include a variety of forest and non-forest areas, with associated variation in ecosystem functions and management significance [19]. Although forest composition and structure vary widely across landscapes and regions (e.g., [25,26]), satellite-based studies typically have not characterized the types and structures of forested and non-forested conditions within mapped fire refugia. Here, we focus on recent fire events, using Landsat-based change detection and existing maps to identify fire refugia as areas experiencing minimal spectral change within generally forested landscapes. We recognize that these recent forest fire refugia represent only one characterization of refugia, but such areas are important to forest and fire managers, many of whom utilize Landsat-based burn severity maps as a primary tool to assess fire effects and implement post-fire management activities.
Forest ecosystems contain a variety of compositional and structural conditions that influence fire behavior, fire effects (i.e., burn severity), and post-fire ecosystem responses at multiple spatiotemporal scales. Forest composition is associated with fire regime attributes (i.e., fire frequency, burn severity) that vary from frequent, low-severity fire to infrequent, high-severity fire [1,3]. Due to inherent differences in fire tolerance, fire refugia are more likely to contain particular species, such as thick-barked Douglas-fir (Pseudotsuga menziesii [Mirb.] Franco) and mature ponderosa pine (Pinus ponderosa Lawson & C. Lawson) that can tolerate surface fires. Similarly, forest structure influences fire behavior, burn severity, and the capacity to form refugia, for instance in open forests with limited surface and ladder fuels and associated crown fire potential [1]. Structure also is important for wildlife habitat and ecosystem resilience, and structural complexity is a vital attribute of natural forests that both influences and emerges from disturbance dynamics [26,27]. Robust data on pre-fire forest composition and structure are critical for understanding the ecosystem legacies [13] and ecological memory [28] associated with wildfires, but previous studies have not quantified these attributes within fire refugia across heterogeneous forested regions.
In addition to trees, forest landscapes typically include non-forest vegetation and unvegetated conditions within and among forested areas. Although they may represent a relatively small portion of forest landscapes at any given time, non-forest areas—including grasslands, shrublands, alpine zones, and unvegetated environments—directly and indirectly influence the patterns and processes of tree-dominated areas [29,30]. As such, non-forest areas influence both the conceptualization and management of forest fire refugia. Whereas unvegetated areas could provide fuel breaks adjacent to forested refugia, non-forest vegetation could serve as a vector of surface fire within and among forested areas (e.g., dry herbaceous vegetation). Non-forest vegetation also responds differently to fire than forests, including lower absolute or relative biomass loss and more rapid regeneration [31].
From the perspective of satellite remote sensing, pre-fire biomass and post-fire vegetation growth also are important factors influencing spectral change and associated burn severity maps. In forested areas, open forests have less biomass and canopy cover to lose than closed-canopy forests, which translates to lower capacity for absolute spectral change and highlights the value of relativized indices that account for pre-fire spectral reflectance (e.g., RdNBR [32]). Low biomass and rapid post-fire vegetation response in non-forested areas also may contribute to lower remotely sensed estimates of burn severity in non-forested than in forested areas because locations with lower woody biomass tend to exhibit lower absolute spectral differences that can attenuate rapidly [32,33,34]. In addition, despite the key role that non-forested areas play in fire behavior and effects, standard burn severity mapping approaches have been developed in forested areas [35,36]. For instance, in the western United States, the Monitoring Trends in Burn Severity program (MTBS; https://mtbs.gov) maintains a widely used fire perimeter and burn severity database. Importantly, although MTBS provides absolute, relative, and classified burn severity maps, as well as pre- and post-fire Landsat imagery, the MTBS approach does not directly account for different pre-fire land cover types, particularly non-forest areas. Moreover, the MTBS classified burn severity maps are based on an absolute change metric, dNBR, rather than relativized change. These limitations could lead to the misinterpretation of burn severity, especially regarding the quantity and quality of forest fire refugia.
The goal of this study is to quantify and describe the composition and structure of contemporary fire refugia across the US Pacific Northwest (Oregon and Washington, hereafter “PNW”). Increases in wildfire activity and novel region-wide vegetation and disturbance maps provide an unprecedented opportunity to investigate fire refugia across numerous fire events spanning a variety of pre-fire conditions. The advent of Landsat time-series approaches for disturbance mapping across landscape and regional scales (e.g., [37]) and the availability of annualized vegetation maps (e.g., [38]) make it possible to address fundamental questions about the composition and structure of fire refugia while also evaluating mapping tools for scientists, forest managers, and policy makers. By developing and exploring classified burn severity maps similar to widely used databases (e.g., MTBS), we seek to reveal conditions within mapped refugia that map users might otherwise overlook, even when accounting for pre-fire variability with relativized spectral indices. The specific objectives of this study are to:
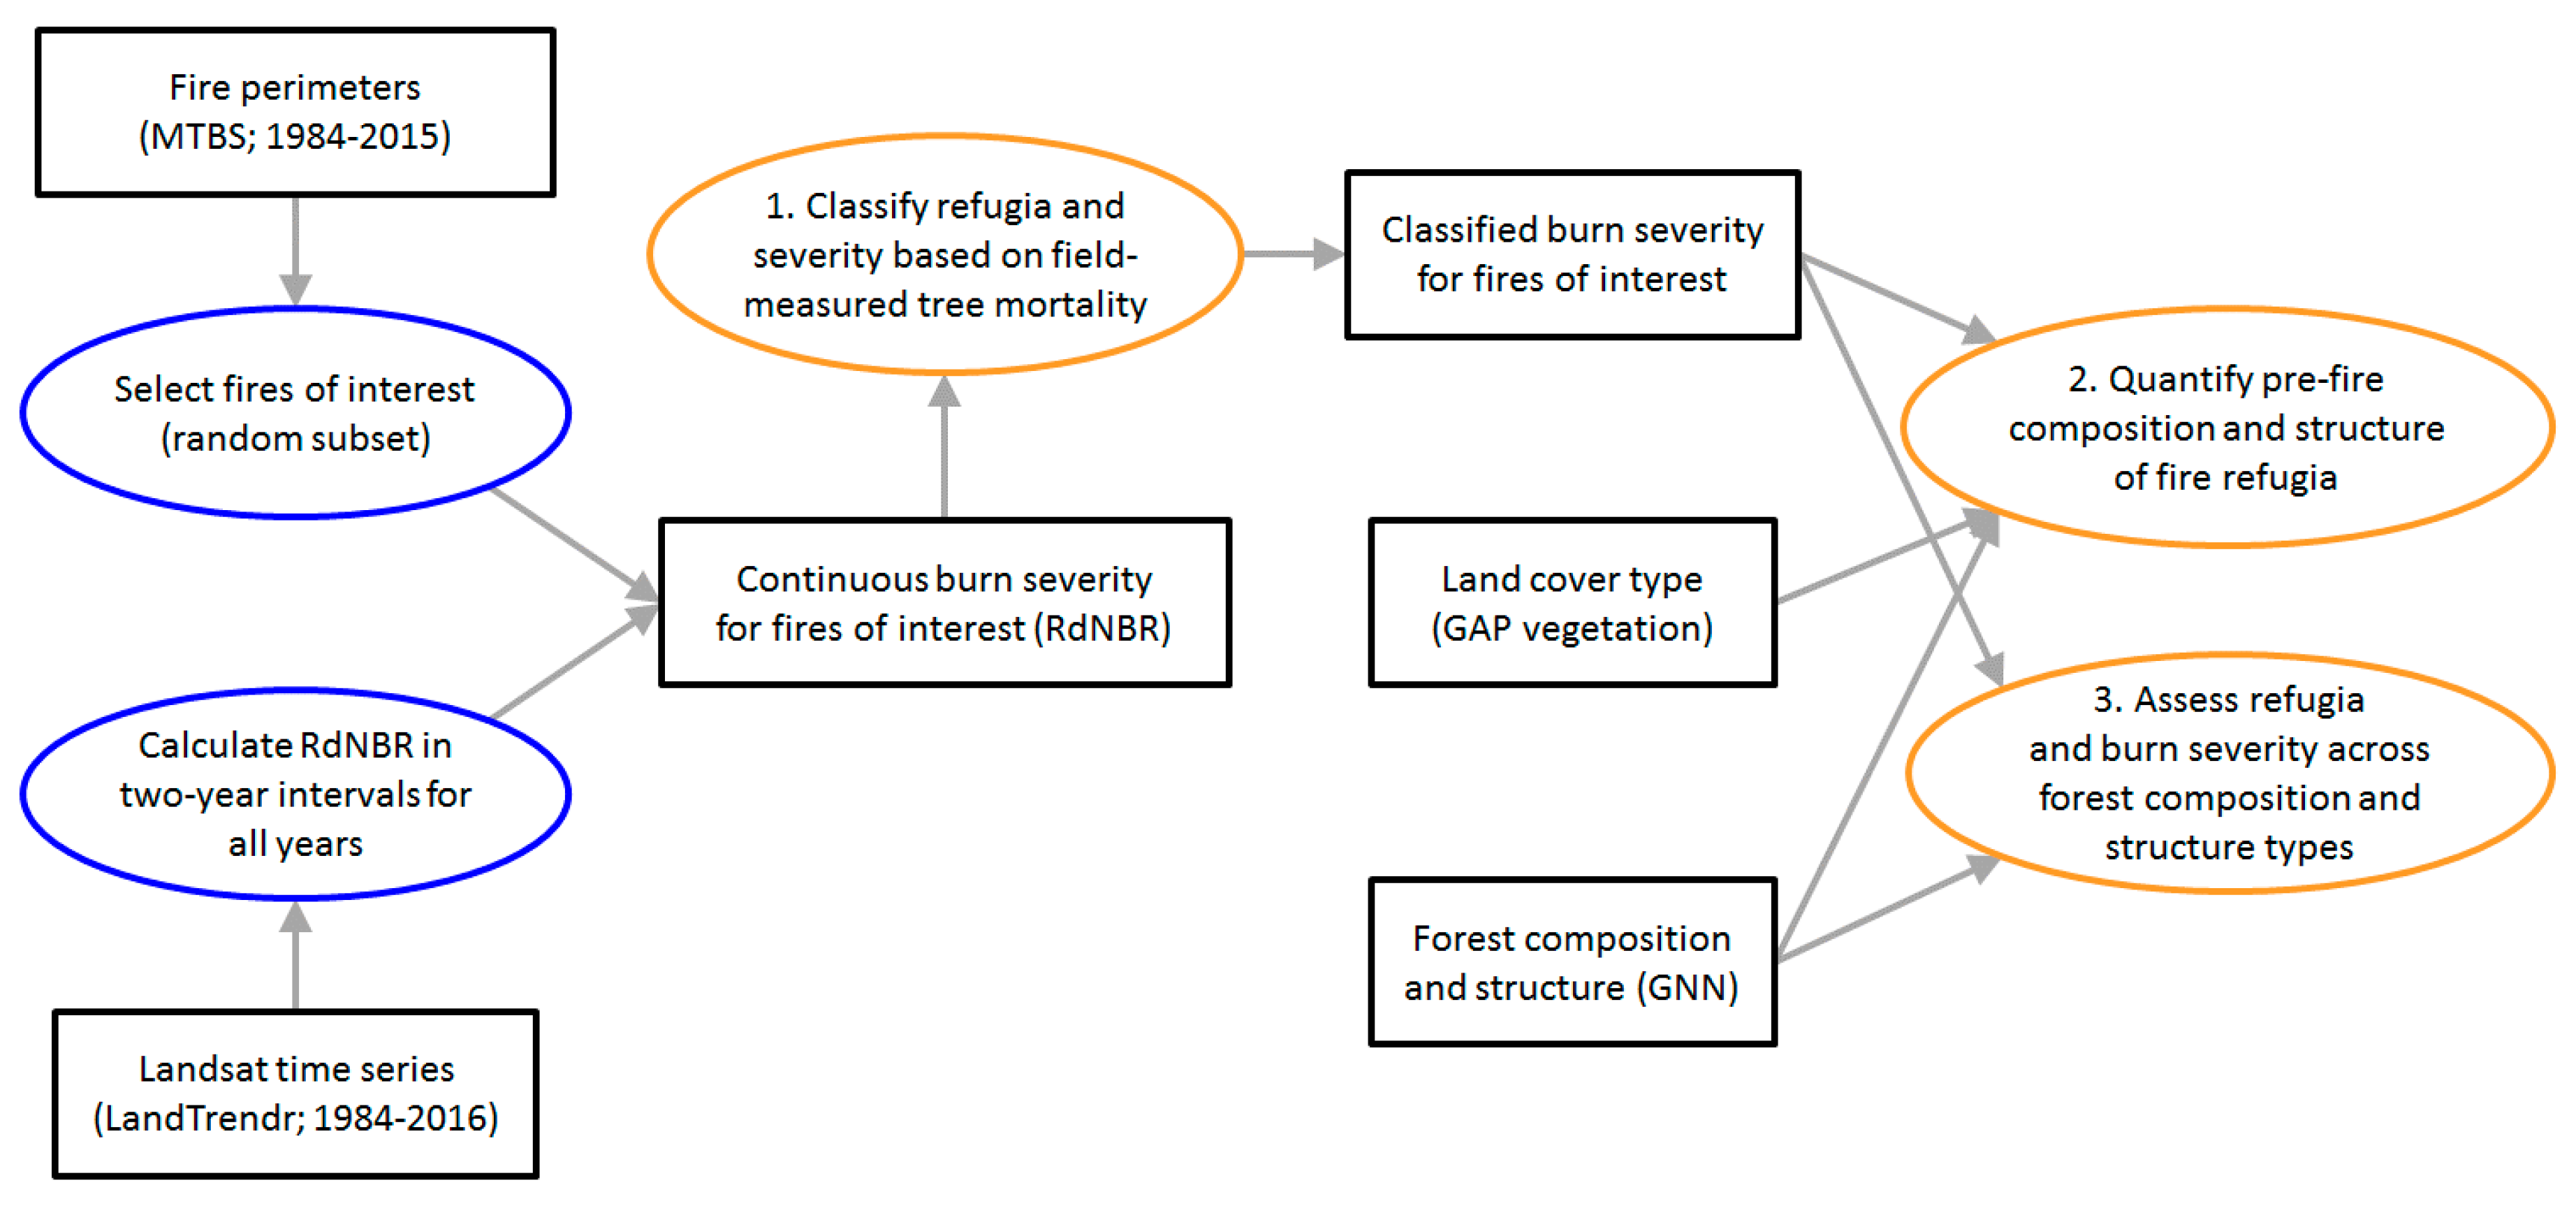
  • Classify fire refugia and burn severity based on relativized spectral change in Landsat time series and previously published tree mortality thresholds [6].
  • Quantify the pre-fire composition and structure of mapped fire refugia, including forested, non-forested, and unvegetated conditions.
  • In forested areas, assess the relative abundance of fire refugia and other burn severity classes across forest composition and structure types.

2. Materials and Methods

2.1. Overview of Approach

We selected a random, representative sample of recent large fire events in forest-dominated landscapes of the PNW. We then developed burn severity and fire refugia maps using Landsat time series and relationships between relative spectral change and field-based estimates of tree mortality published by Reilly et al. [6]. Next, we overlaid the burn severity maps with existing land cover and vegetation maps representing pre-fire conditions, which also were developed in part with Landsat imagery, thereby enabling a relatively fine-resolution analysis (30-m grain). Our primary focus was to describe fire refugia at the low end of the burn severity gradient, but our third objective evaluates refugia and other severity classes across variable forest compositional and structural conditions (Figure 1). Although we do not assess individual fires in our quantitative analyses, we illustrate the fine spatial patterning of our landscape maps—including refugia, burn severity, land cover, and forest conditions—for a representative large fire, the Table Mountain Complex (Figure 2, Figure 3 and Figure 4). This 2012 event was part of the broader Wenatchee Complex studied by Kolden et al. [9].

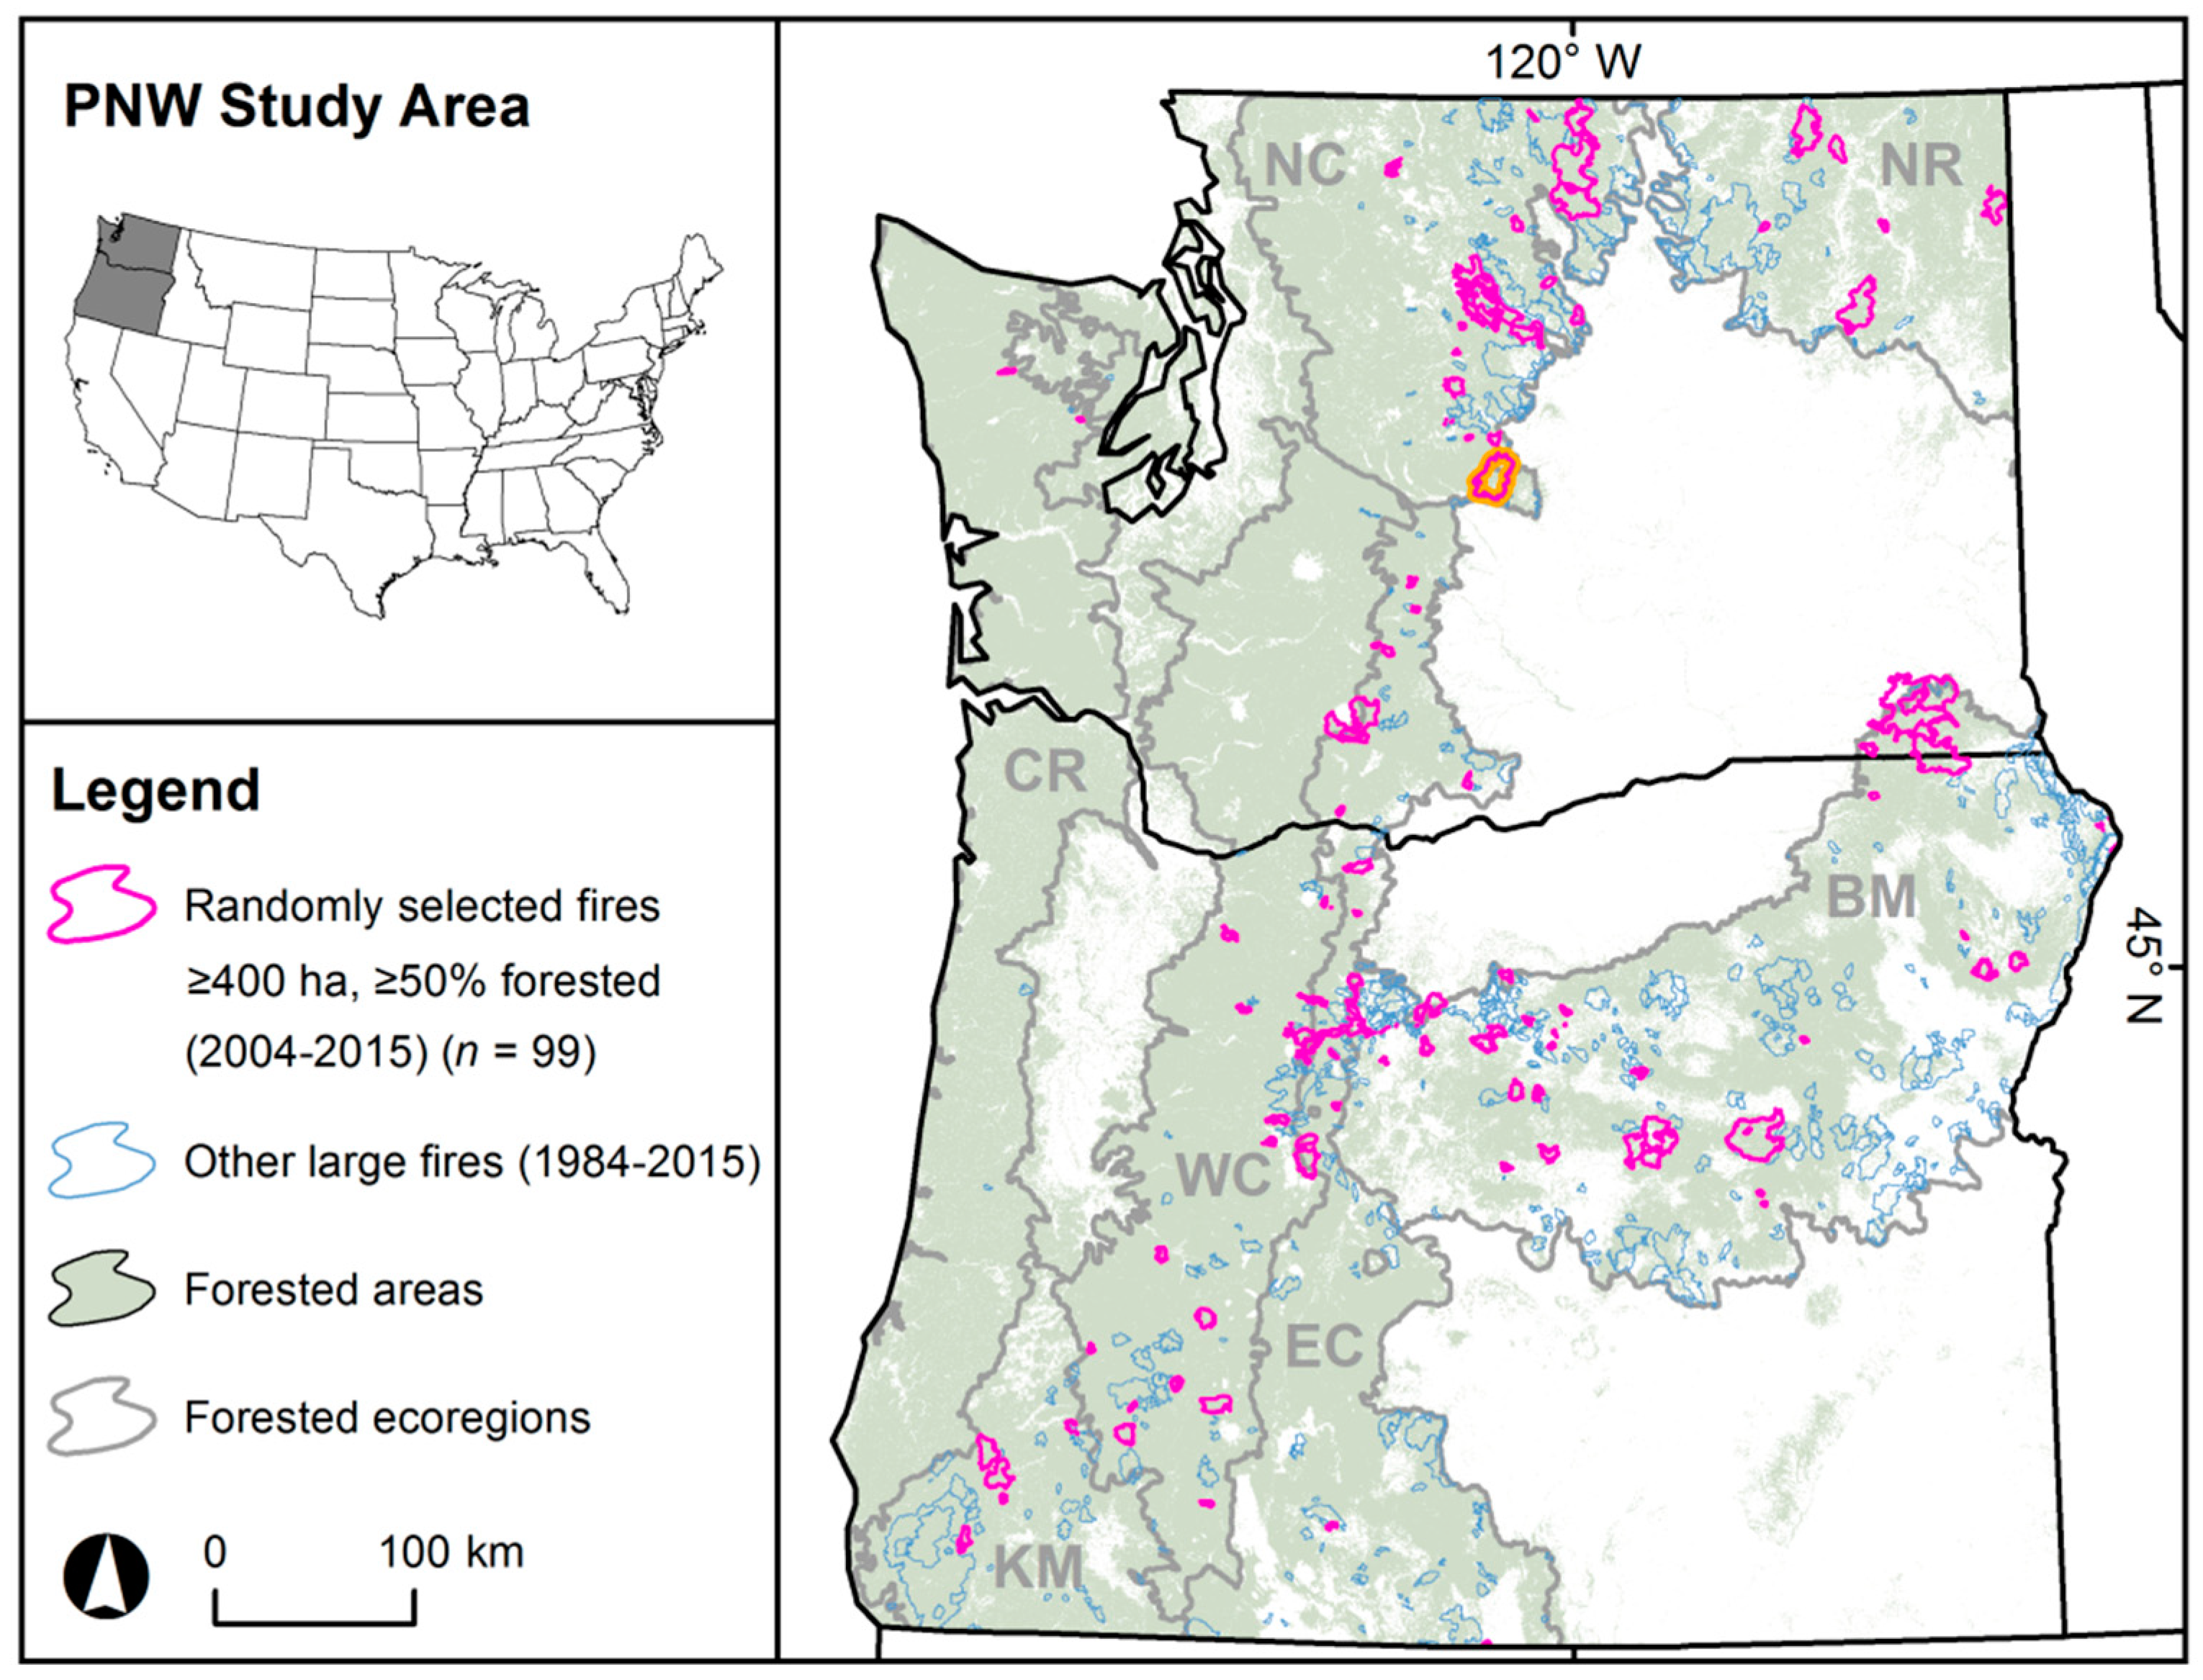
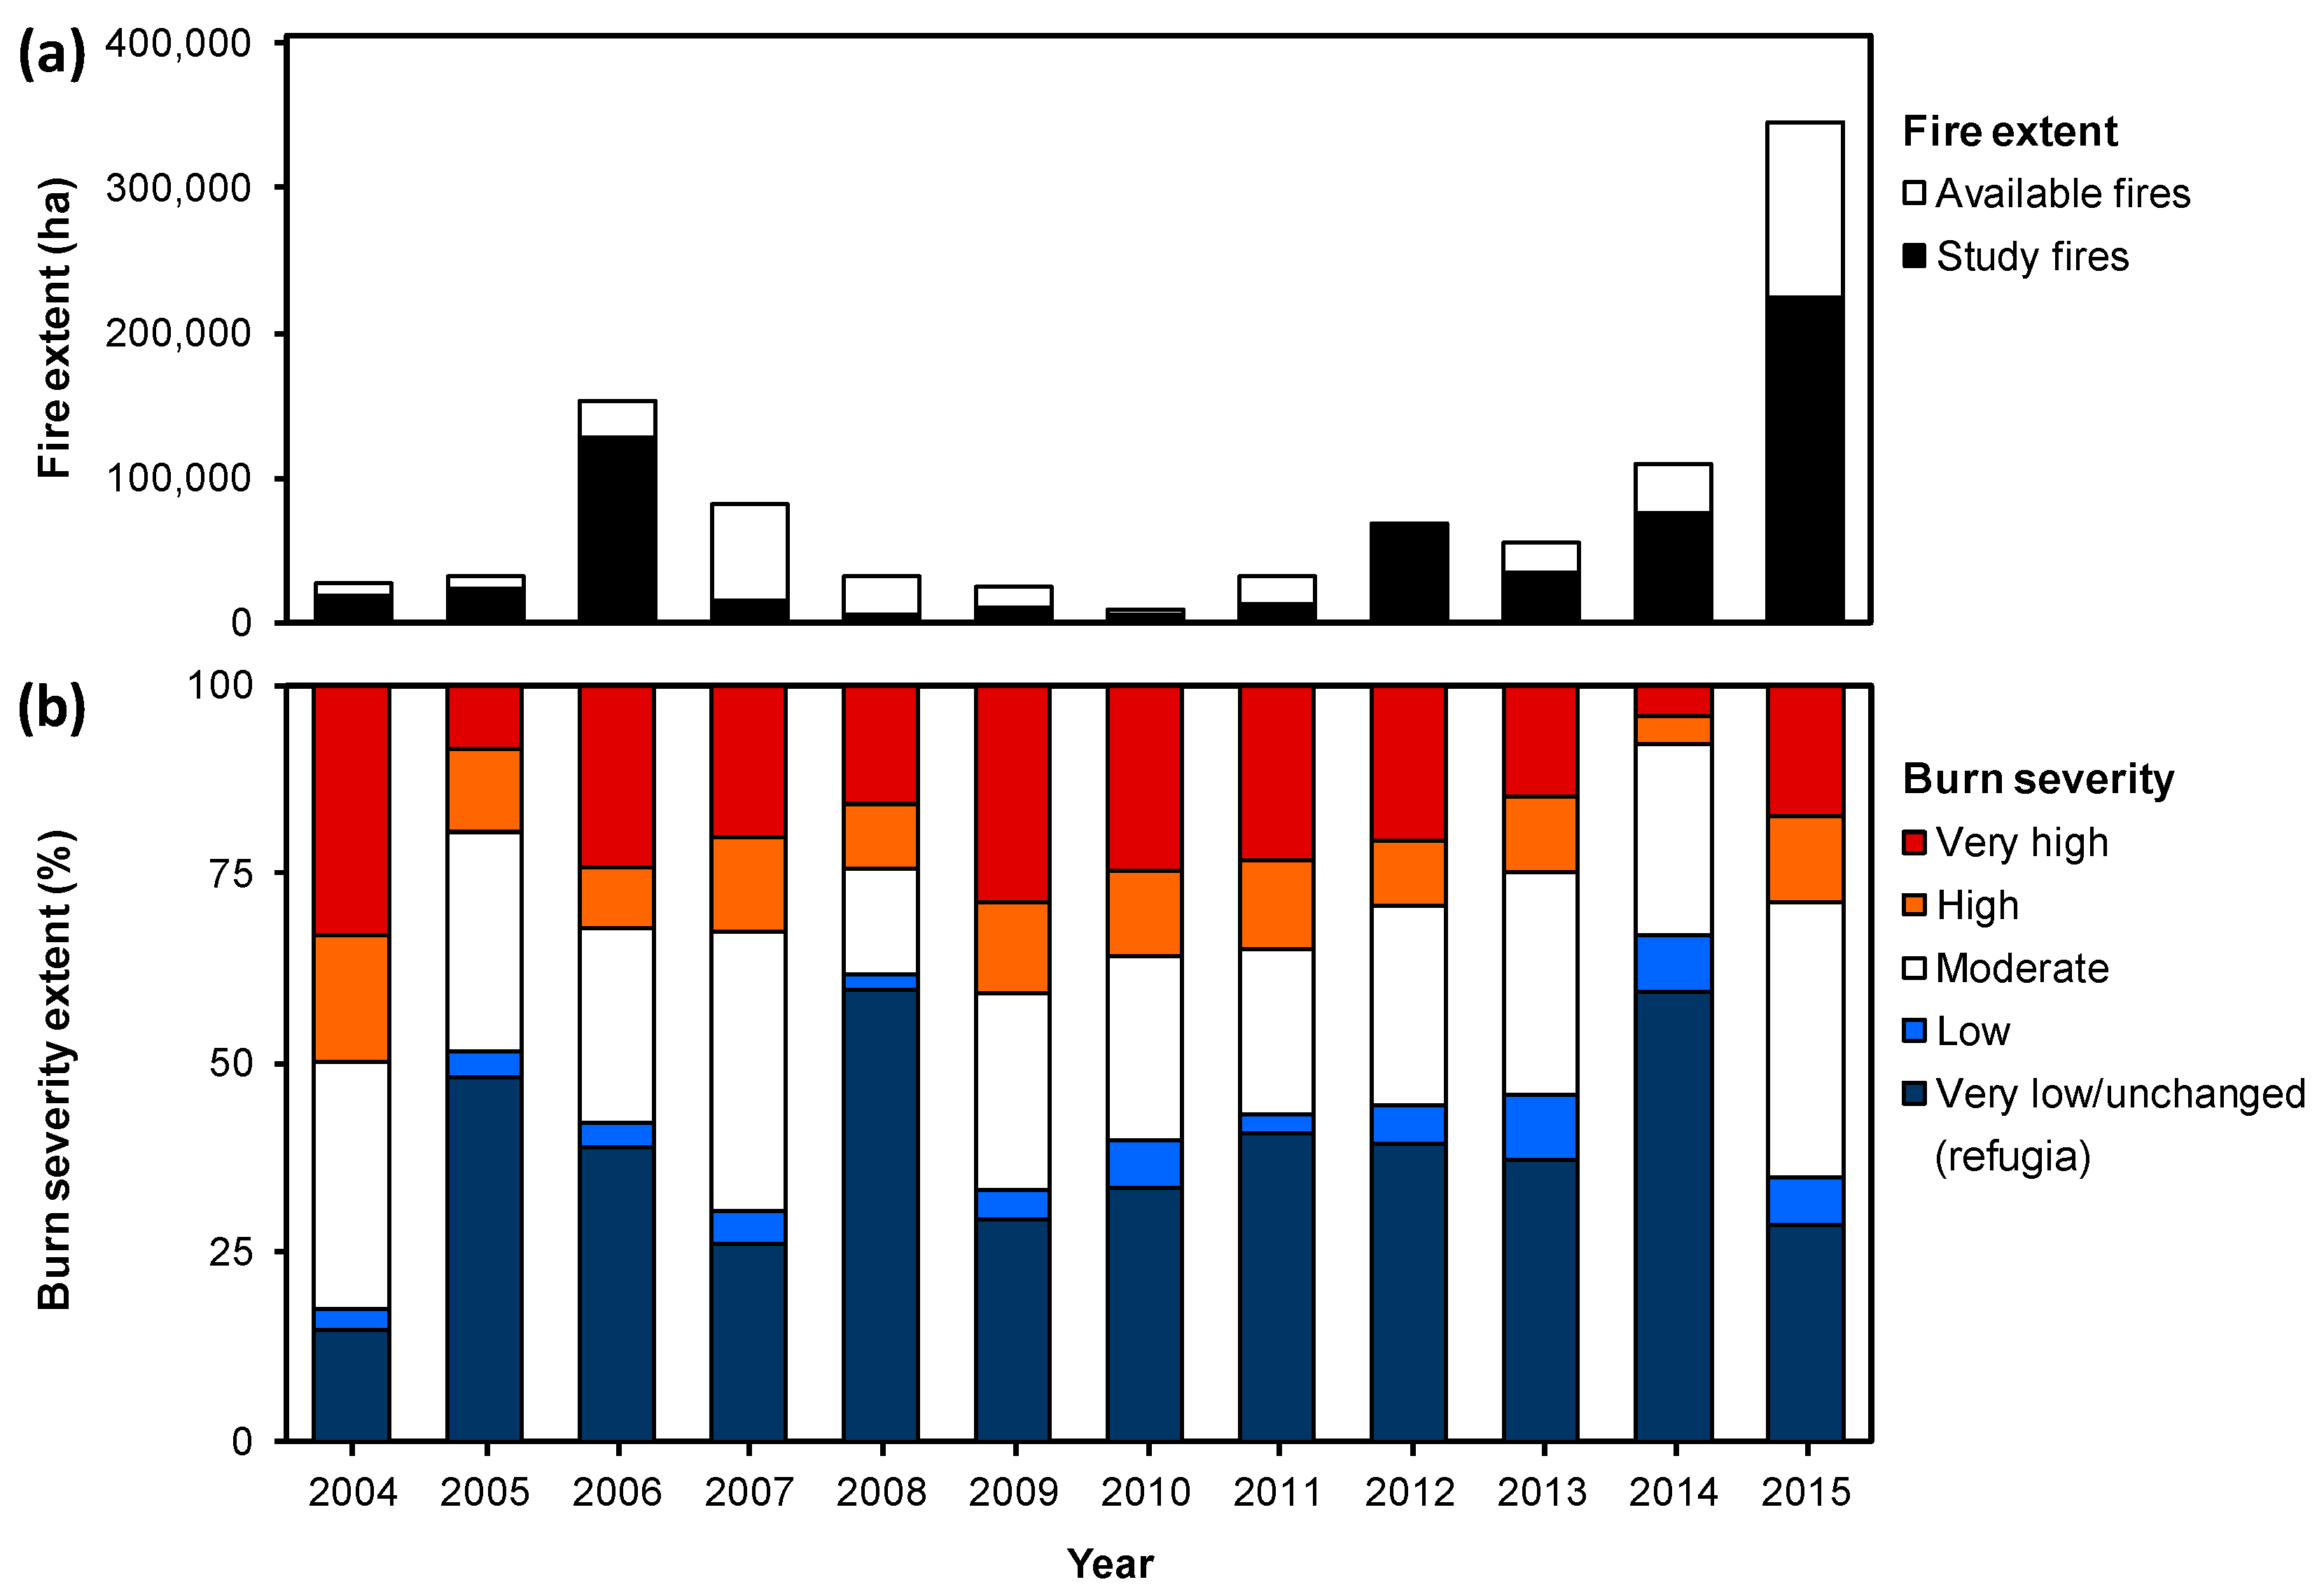
2.2. Study Area and Fires of Interest

Conifer forests are widespread across the PNW region, and their composition, structure, and productivity vary across gradients of climate, topography, soil parent material, disturbance regime, and management history [39,40,41] (Figures S1 and S2). Precipitation and temperature regimes differ across forested ecoregions of the PNW, but a common climatic feature is low summer precipitation [39] conducive to fire and other disturbances (e.g., [41,42]). From west to east, important conifer forest types and tree species are encompassed by broad ecoregions (Figure 2, Supplemental Figure S1) [39,43,44]. Relatively moist forests occur primarily in the Coast Range and West Cascades and are dominated by Douglas-fir and western hemlock (Tsuga heterophylla [Raf.] Sarg.). Subalpine forests occupy multiple ecoregions, especially higher elevations in the Cascade Range and inland mountain ranges, featuring subalpine fir (Abies lasiocarpa [Hook.] Nutt.), lodgepole pine (Pinus contorta Douglas ex Loudon), and mountain hemlock (Tsuga mertensiana [Bong.] Carrière). Mixed-conifer forests occur in portions of all ecoregions except for the Coast Range and feature grand fir (Abies grandis [Douglas ex D. Don] Lindl.), western larch (Larix occidentalis Nutt.), ponderosa pine, and Douglas-fir. Ponderosa pine forests and woodlands and western juniper (Juniperus occidentalis Hook.) woodlands occur primarily in the East Cascades and Blue Mountains. Broadleaf trees intermix with conifer forests in riparian areas and in the mixed forests of the southwest portion of the region (e.g., Klamath Mountains; Figure 2, Supplemental Figure S1).
Across the region, forested areas intermix with non-forest and unvegetated land cover types. Non-forest vegetation types above treeline include alpine meadows, and non-forest vegetation types below treeline include sagebrush-steppe shrublands and herbaceous vegetation (e.g., grasslands, meadows). Important unvegetated conditions include barren areas, high alpine environments, open water, and developed land [39,43].
In general, PNW forests occupy relatively remote, mountainous areas managed primarily by US federal agencies for multiple resource objectives. These landscapes have experienced dramatic land-use changes, including widespread logging, grazing, fire exclusion, and associated fuel accumulations [40]. In turn, land use and climate change have contributed to recent increases in the activity of fire and other disturbances [40,42,45]. Given the widespread extent of similar geographic conditions and anthropogenic pressures, PNW forests and their recent fire dynamics are broadly representative of contemporary forest disturbance regimes in western North America.
We examined the distribution of fire refugia and their pre-fire composition and structure across recent large fire events. We acquired a database of large fire perimeters (≥400 ha) from the MTBS archive (available online: https://mtbs.gov) and identified fires across Oregon and Washington with the following criteria. We first selected fires with ≥50% forest cover by applying a regional forest mask (30 m grain [38]). We then selected fires after 2003 due to the timing of available land cover maps to assess pre-fire conditions (described below). Finally, to avoid the confounding effects of reburn we retained only those portions of fire polygons that burned once since 1985, excluding locations burned more than once. We also excluded burned fragments <400 ha that resulted from these geospatial processing steps. Within this subset, we removed fire events that were on the edge of the PNW study area (n = 6), were not classified as wildfires (n = 4), and had duplicate entries in the MTBS database (n = 2). These criteria yielded 172 distinct fire events that occurred between 2004 and 2015, from which we randomly selected 99 for this analysis (Figure 2, Supplemental Table S1). We manually reviewed this random selection to identify scanline errors from the Landsat 7 sensor, which could introduce errors into refugia maps, but none were apparent in our dataset.

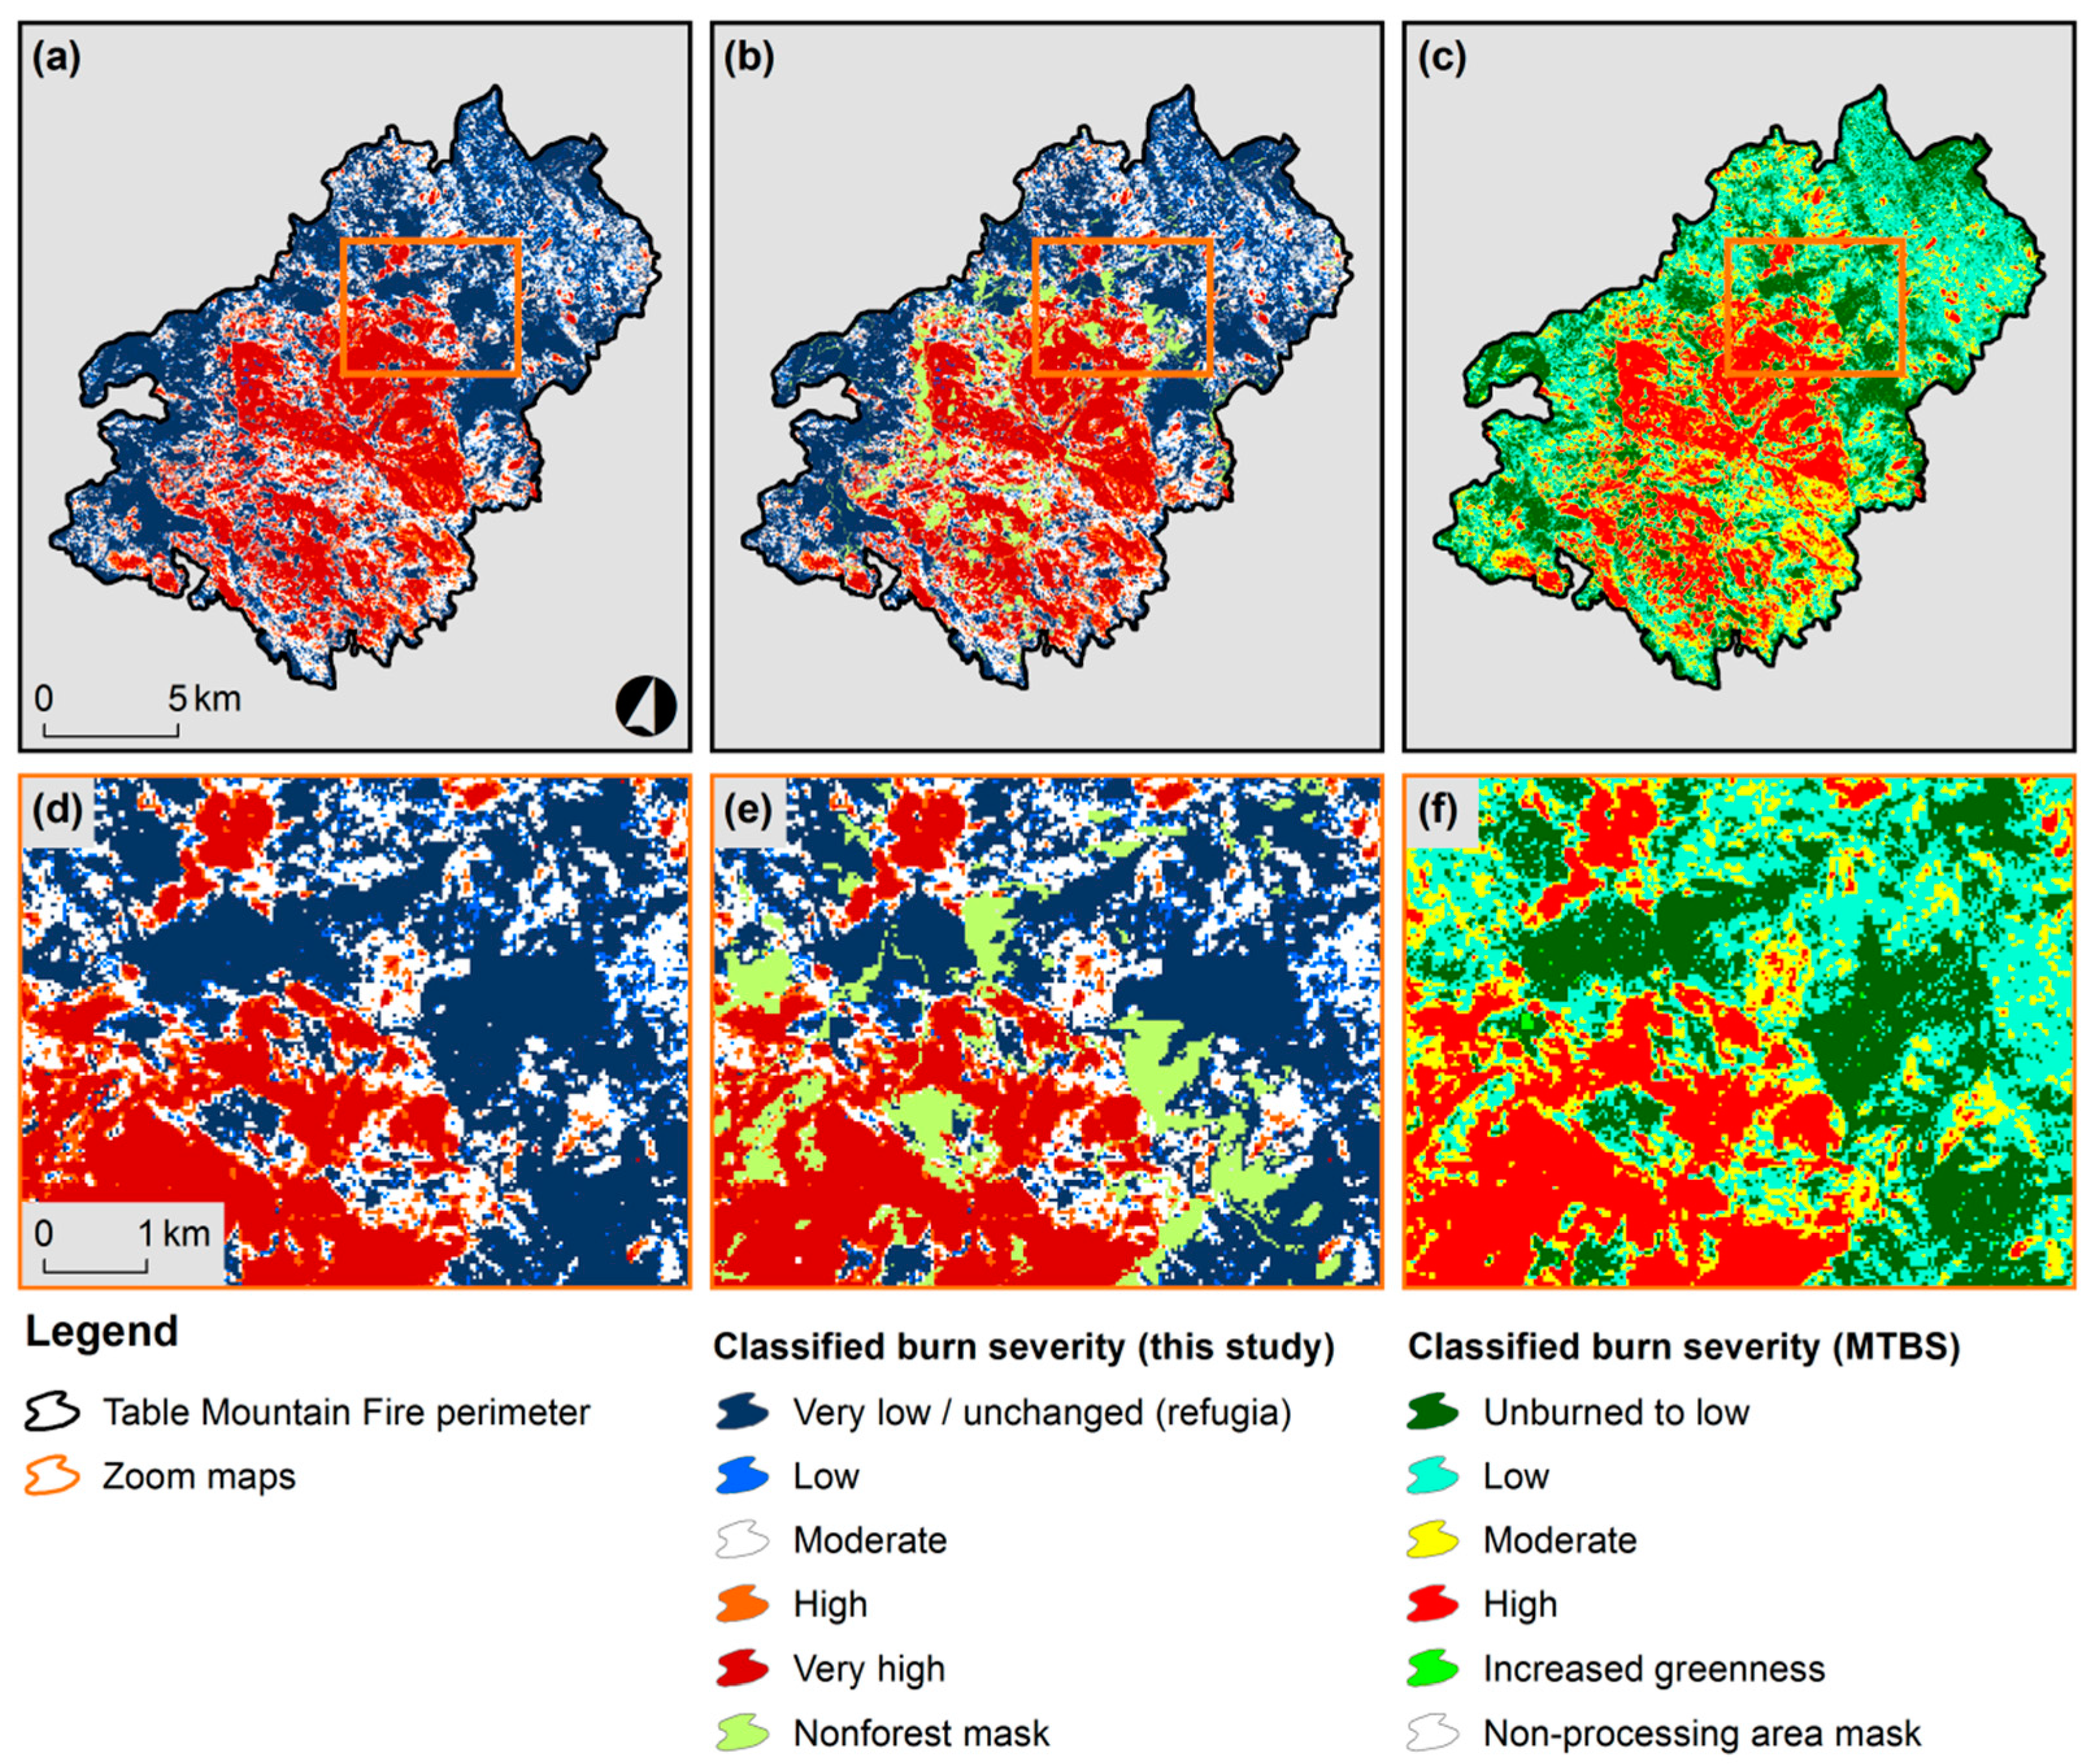
2.3. Burn Severity and Fire Refugia Mapping

We mapped burn severity and fire refugia across the selected fires using regional mosaics of Landsat spectral change, following methods developed by Meigs et al. [46] and Reilly et al. [6] to analyze fire effects across numerous fires in heterogeneous conditions. Landsat imagery was pre-processed (atmospheric correction, cloud masking) and processed using temporal segmentation according to LandTrendr change detection algorithms, which are described in detail by Kennedy et al. [37]. Briefly, LandTrendr segmentation identifies vegetation disturbance and recovery by distilling an often-noisy annual time series into a simplified set of segments and vertices to capture the salient features of spectral trajectories while omitting most false changes [37,45]. Rather than applying disturbance estimates directly from LandTrendr outputs, we compiled annual Landsat time series of the normalized burn ratio (NBR) spectral vegetation index, which combines near-infrared and mid-infrared wavelengths of the Landsat TM/ETM+ sensor and is sensitive to forest vegetation change [32,37]. These NBR time series were centered around the median date of the Landsat stacks (generally 1 August) at the pixel scale, which reduces seasonal variability associated with phenology and sun angles. This process resulted in annual mosaics of NBR covering the full study area, which we then combined with MTBS fire perimeters to produce consistent burn severity maps across all study fires.
Specifically, for each fire perimeter, we computed the relative differenced normalized burn ratio (RdNBR [32]) in two-year intervals to ensure pre- and post-fire coverage for all pixels within a given fire event [46]. By capturing the relative change in dominant vegetation, RdNBR is appropriate for assessing fire effects across numerous events spanning heterogeneous pre-fire conditions [32,47]. Although Landsat spectral indices such as RdNBR have inherent limitations and do not capture very fine-scale fire effects and responses (e.g., tree charring, forest floor combustion, or post-fire regeneration [48,49]), they provide a spatially and temporally consistent metric of burn severity for landscape and regional analysis of fires since 1985. Moreover, the NBR index is at the core of many current fire monitoring protocols (e.g., MTBS [35,36]), and our aim was to characterize areas that fire researchers and managers might identify as fire refugia using these protocols and data.
After clipping the regional RdNBR mosaics within the fires of interest, our next step was to classify the continuous RdNBR maps to specific burn severity categories based on previous field-based estimates of tree mortality (Figure 1). Specifically, we used an equation developed by Reilly et al. [6] that relates RdNBR to relative tree mortality observed at US federal forest inventory plots in the Current Vegetation Survey across the PNW [50]:
y = 134.87 + 259.38x + 567.68x2
where y is continuous RdNBR and x is the percent basal area mortality estimated from changes in live tree basal area before and after fire at 304 inventory locations. We designated five burn severity classes corresponding to distinct ranges of basal area (BA) mortality. In addition to the low- (<25% BA mortality), moderate- (>25–75%), and high-severity (>75–100%) classes applied by Reilly et al. [6], we added very low/unchanged (0–10% BA mortality) and very high-severity (>90–100%) classes to further resolve the two ends of the severity gradient. See Reilly et al. [6] for further details on the burn severity classification and field validation.
We defined fire refugia as all pixels within the very low/unchanged class. Recognizing the challenges inherent in remote sensing of fire effects at the low end of the burn severity spectrum [18], our goal was not to distinguish truly unburned areas. Rather, we assumed that pixels with ≥90% estimated tree survival within the first year post-fire include both unburned and lightly burned conditions that are difficult to distinguish remotely. Although these forests are not necessarily unburned, they experienced less severe fire effects than the rest of the burned landscape [7]. Additionally, we recognize that this classification approach based on basal area does not translate directly to locations without trees. Our mapped refugia represent locations with minimal spectral change regardless of tree cover, however, and we distinguish non-forest areas with ancillary spatial datasets (described below). Overall, these areas are conceptually and quantitatively similar to the lowest-severity category in the classified burn severity maps from MTBS (“Unburned to low”; Figure 3), which are based on absolute spectral change (dNBR) and do not integrate a forest mask.

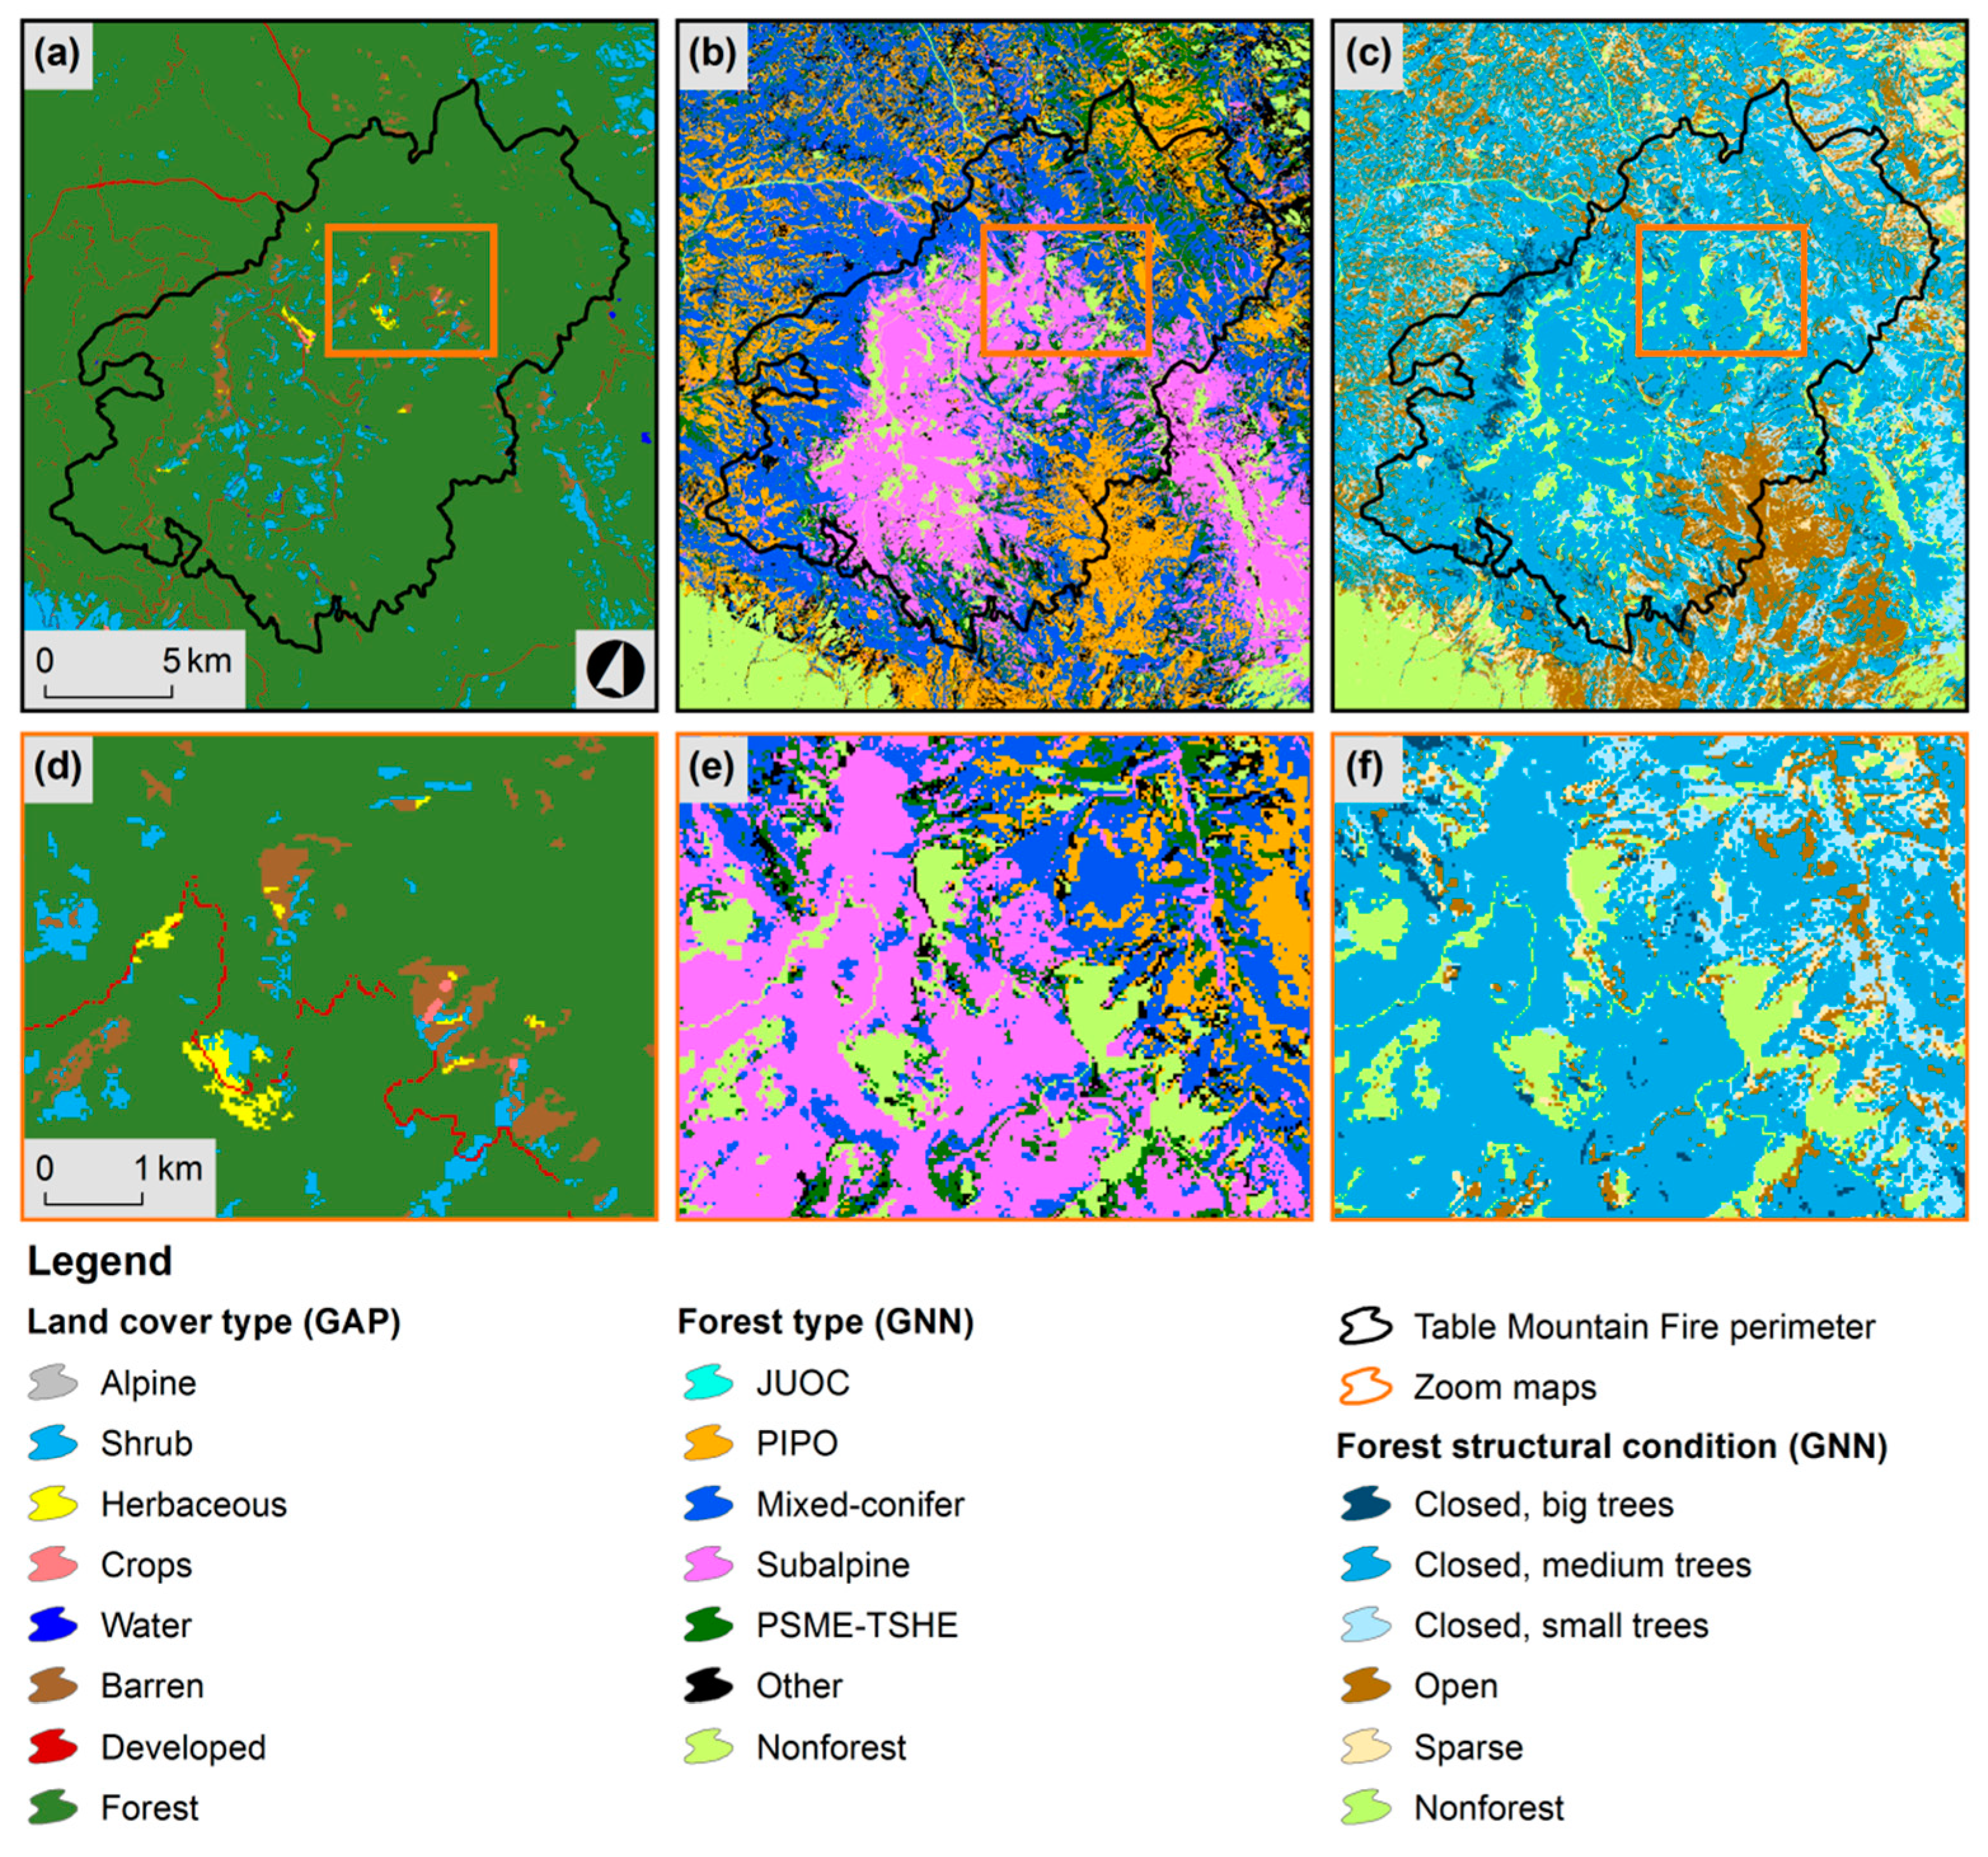
2.4. Geospatial Overlay Analysis

Our final analytical step was to overlay the classified burn severity maps with land cover and vegetation data available for the study area (Figure 1). We assessed land cover types, including forest vegetation, non-forest vegetation, and unvegetated conditions with spatial data from the Gap Analysis Program (GAP; available online: https://gapanalysis.usgs.gov/). We used a map of terrestrial ecological systems, which represent groups of biological communities that occur within landscapes with similar ecological processes, substrates, and/or environmental gradients [51]. We combined the level three ecological system types into a simplified set of land cover types based on the ecological system descriptions and metadata (Table 1, Figure 4, Supplemental Table S2). This map reflects conditions existing in the year 2001, when the first generation of the US National Land Cover Database was developed, thereby providing information on land cover prior to our fires of interest.
For forested areas identified with the GAP data, we assessed pre-fire (2003) forest composition and structure using annualized maps derived from gradient nearest-neighbor imputation (GNN [38,52]). GNN maps integrate data from federal forest inventory plots (n ≈ 17,000), key spatial predictors, and Landsat time series to impute plot-level attributes for all forested pixels across the PNW [38]. The GNN imputation is based on Euclidean distance in a multivariate space defined by the predictor variables and derived from canonical correspondence analysis [53,54]. GNN maps include numerous plot variables (available online: https://lemma.forestry.oregonstate.edu/data), and we selected a subset of forest composition and structure variables for our analysis (Table 2). Similar to the GAP land cover types, we combined GNN forest types into a more constrained set applicable to forest vegetation across the PNW based on dominant tree species basal area (Table 3, Figure 4, Supplemental Table S3, Supplemental Figure S1). We combined GNN forest structural conditions into five classes based on live tree canopy cover and tree size (Figure 4, Supplemental Figure S2) [25,43]. Specifically, the sparse and open forest structure classes had canopy cover <10% and 10–40%, respectively, and closed forest structure classes had canopy cover >40% in three size classes based on dominant tree quadratic mean diameter (small: <25 cm QMD, medium: 25–50 cm QMD, large: >50 cm QMD). QMD is a standard metric of average tree size in forestry that gives greater weight to larger trees influencing basal area [55].
We deliberately chose GNN attributes spanning a variety of compositional and structural dimensions, recognizing that the GAP and GNN spatial datasets and variables have distinct strengths, weaknesses, and sources of uncertainty. Because our goal was to describe pre-fire conditions within mapped fire refugia, we focus primarily on relative rather than absolute differences among land cover and forest conditions. We present results from analyses across all fires and years combined to provide a regional perspective on conditions in fire refugia. For the Table Mountain Complex that we use as an example to illustrate our concepts at a landscape event scale, we also show the standard MTBS severity classes to compare with our burn severity maps, both with and without the 30 m grain forest mask (Figure 3).

3. Results

3.1. Classification of Fire Refugia and Burn Severity in Recent Forest Fires

The randomly selected fires occurred primarily east of the crest of the Cascade Range, consistent with the spatial distribution of fires during the entire Landsat era (1984–2015) (Figure 2). Our random subset of fires exhibited the same temporal pattern as the general population of large fires during the study period (2004–2015) (Figure 5a). Total annual fire extent typically was below 50,000 ha but was punctuated by two episodic fire years (2006, 2015; Figure 5a). The cumulative extent of the study fires, which included only those locations that burned once, was 612,629 ha over the 12-year study period, equivalent to a mean of 51,052 ha per year.
The burn severity classes we derived based on relative tree basal area mortality corresponded to five ranges of RdNBR (Table 4). Overall, three burn severity classes accounted for the vast majority of fire extent; very low/unchanged was 37%, moderate was 30%, and very high was 18% of total extent (Table 4). Refugia areas (very low/unchanged severity class) were extensive but varied widely from fire to fire and year to year (interannual mean: 38%; range: 15–60%) (Figure 5b). The spatial distribution of refugia varied within fires, as illustrated by the Table Mountain Complex (Figure 3). The Table Mountain example also shows how burn severity distributions were similar between our Landsat-based maps and the standard classified severity maps from MTBS (Figure 3).

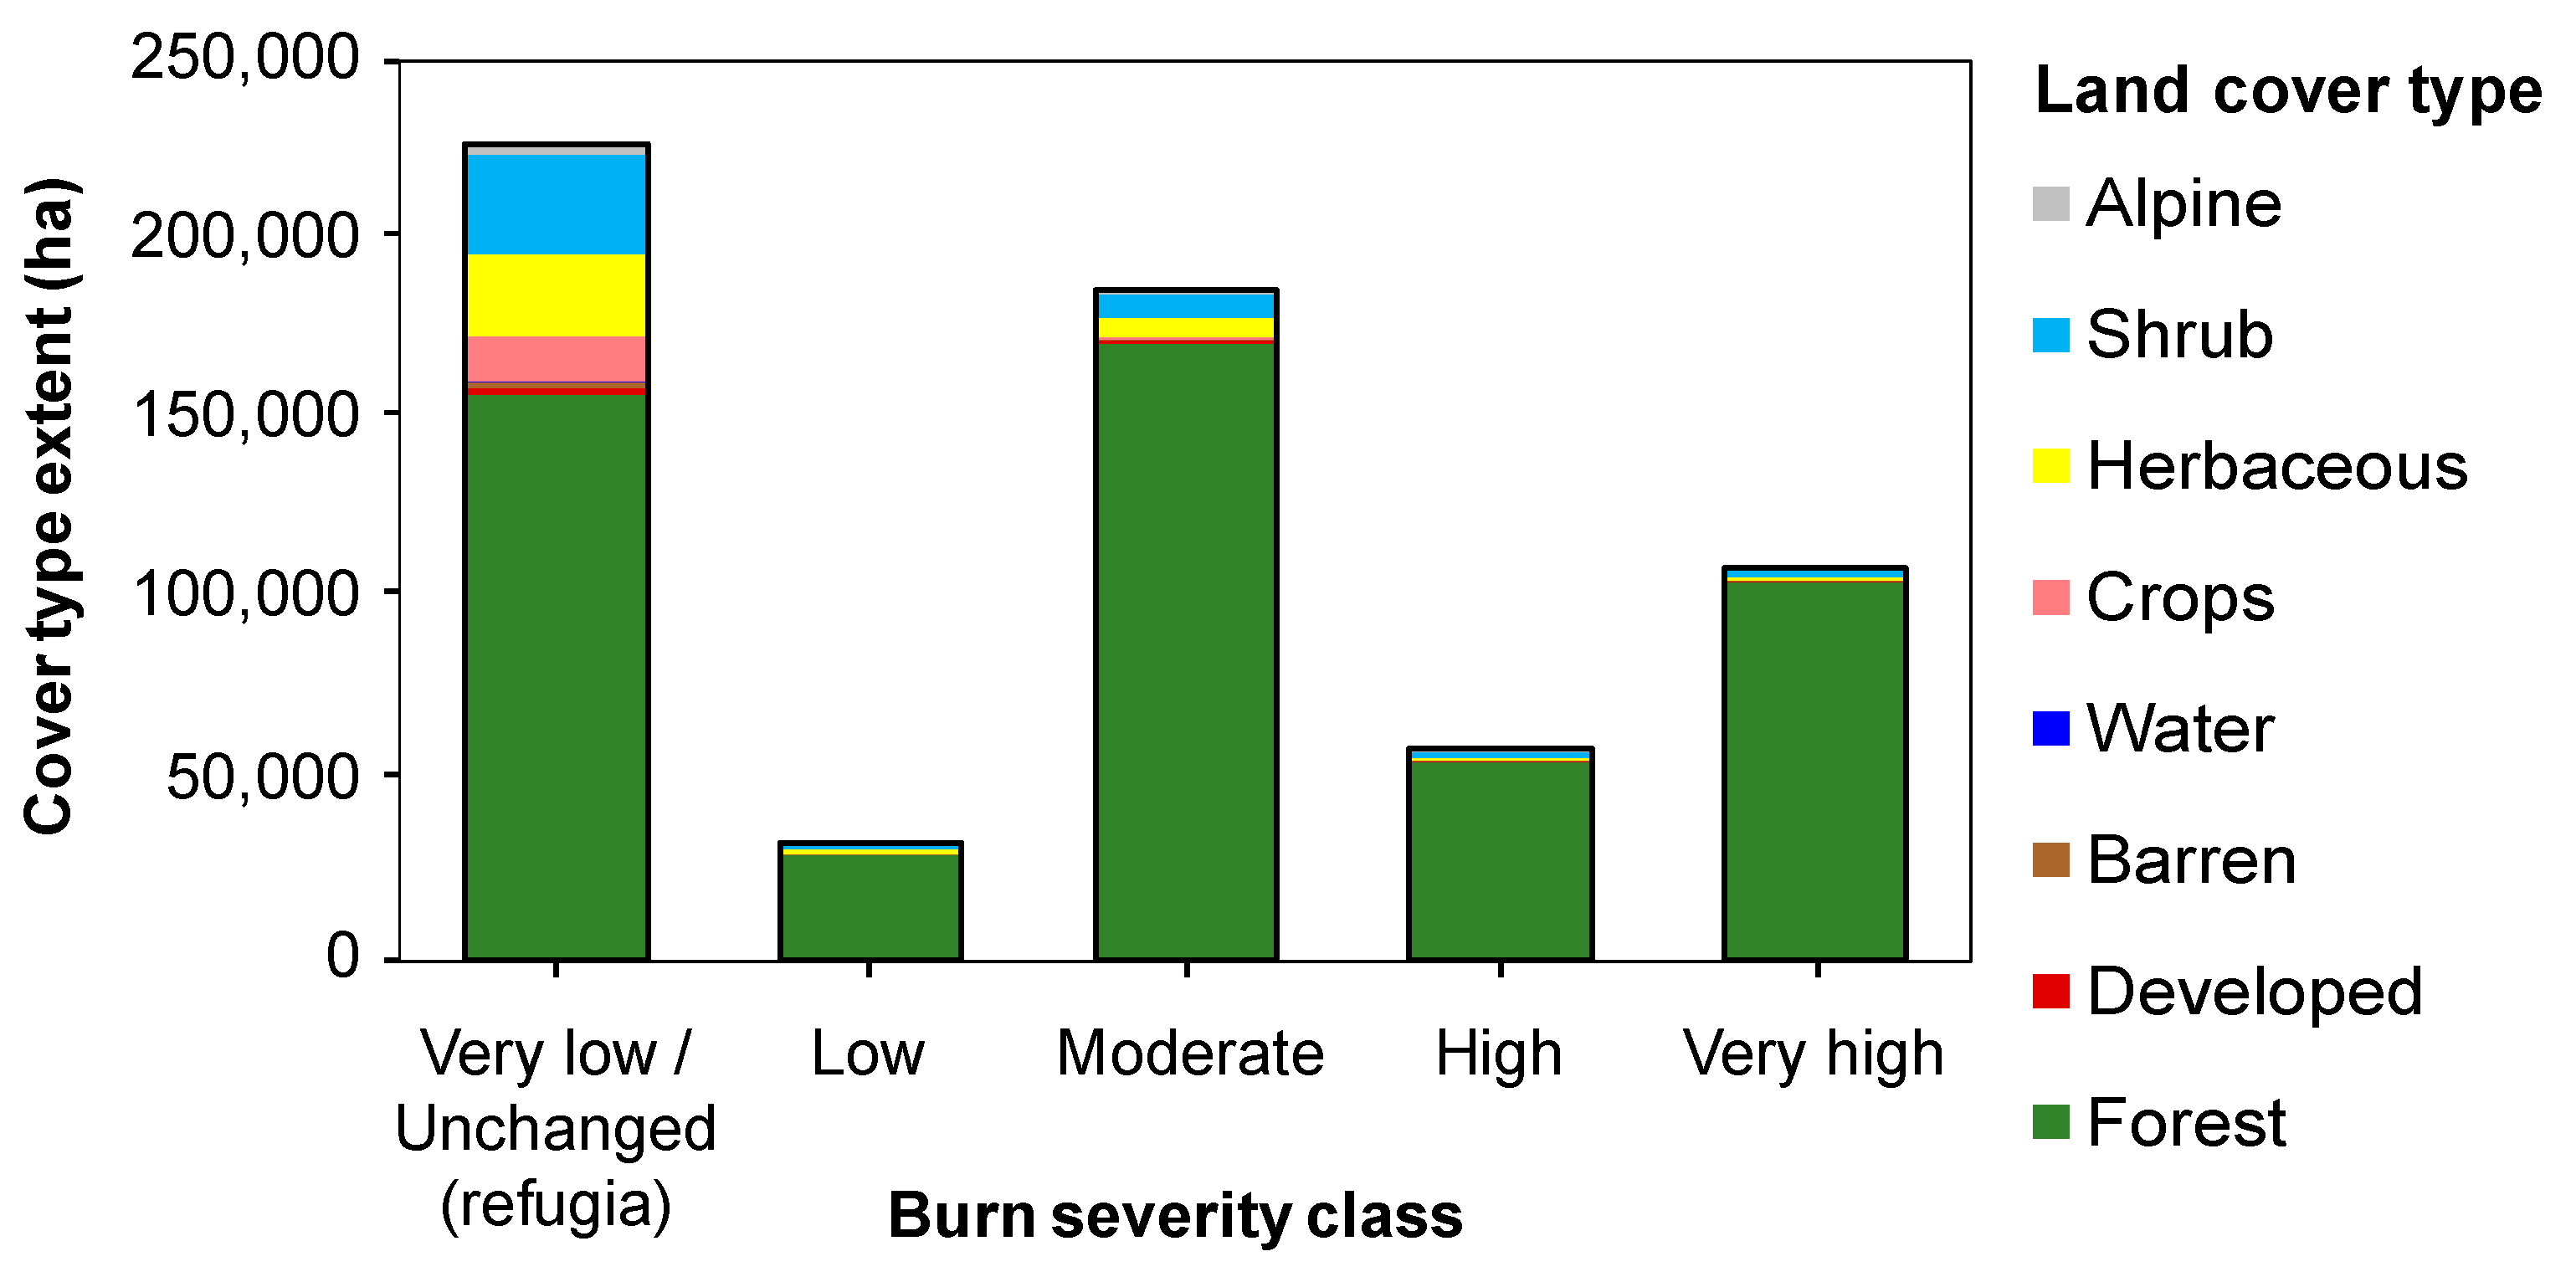
3.2. Composition and Structure of Fire Refugia

Across the study fires, forests were the most extensive land cover type (Table 1, Figure 6). Total fire extent was 85% forested and 15% non-forested (Table 1). In refugia areas, however, the non-forested component was substantially higher (31%) (Table 1, Figure 6). Across all burn severity classes, the most prevalent vegetated non-forest cover types were shrub (42%), herbaceous (34%), and crops (14%), cumulatively representing 90% of non-forest areas (Figure 6). Within the refugia class, these cover types exhibited a similar distribution, with shrub (40%), herbaceous (33%), and crops (18%) accounting for 91% of non-forest areas (Figure 6). Unvegetated areas cumulatively represented 1.6% of refugia areas and 6% of non-forest extent (3% developed [including roads], 2% barren, 0.5% water) (Table 1).
In forested areas, fire refugia extent varied with pre-fire forest composition. Mixed-conifer forests in relatively dry parts of the region were the most extensive forest type and contained the most refugia, covering 46,000 ha (Figure 7a). Refugia extent was similar in the Douglas-fir/western hemlock, subalpine, ponderosa pine, and other forest types, with each forest type covering approximately 25,000 ha (Figure 7a). Western juniper woodland was the least extensive forest type and contained the lowest refugia extent, covering 11,000 ha (Figure 7a). As demonstrated by the Table Mountain landscape, pre-fire forest types were intermixed but changed with increasing elevation, with ponderosa pine transitioning into mixed-conifer and subalpine forests (Figure 4b,e).
Fire refugia extent also varied with pre-fire forest structure. Closed forests (>40% canopy cover) dominated by medium trees (dominant tree QMD of 25–50 cm) contained the most refugia, encompassing 53,000 ha (Figure 8a). Open forests also contained substantial refugia (44,000 ha), followed by closed forests with small trees (27,000 ha), sparse forests (17,000 ha), and closed forests with large trees (16,000 ha; Figure 8a). As illustrated by the Table Mountain landscape, forest structural conditions varied with elevation but to a lesser degree than forest types (Figure 4c,f). Non-forest areas contained a substantial number of locations identified as refugia based on spectral change alone, representing 69,000 ha (Figure 7a and Figure 8a), although such areas are qualitatively different from forest fire refugia.

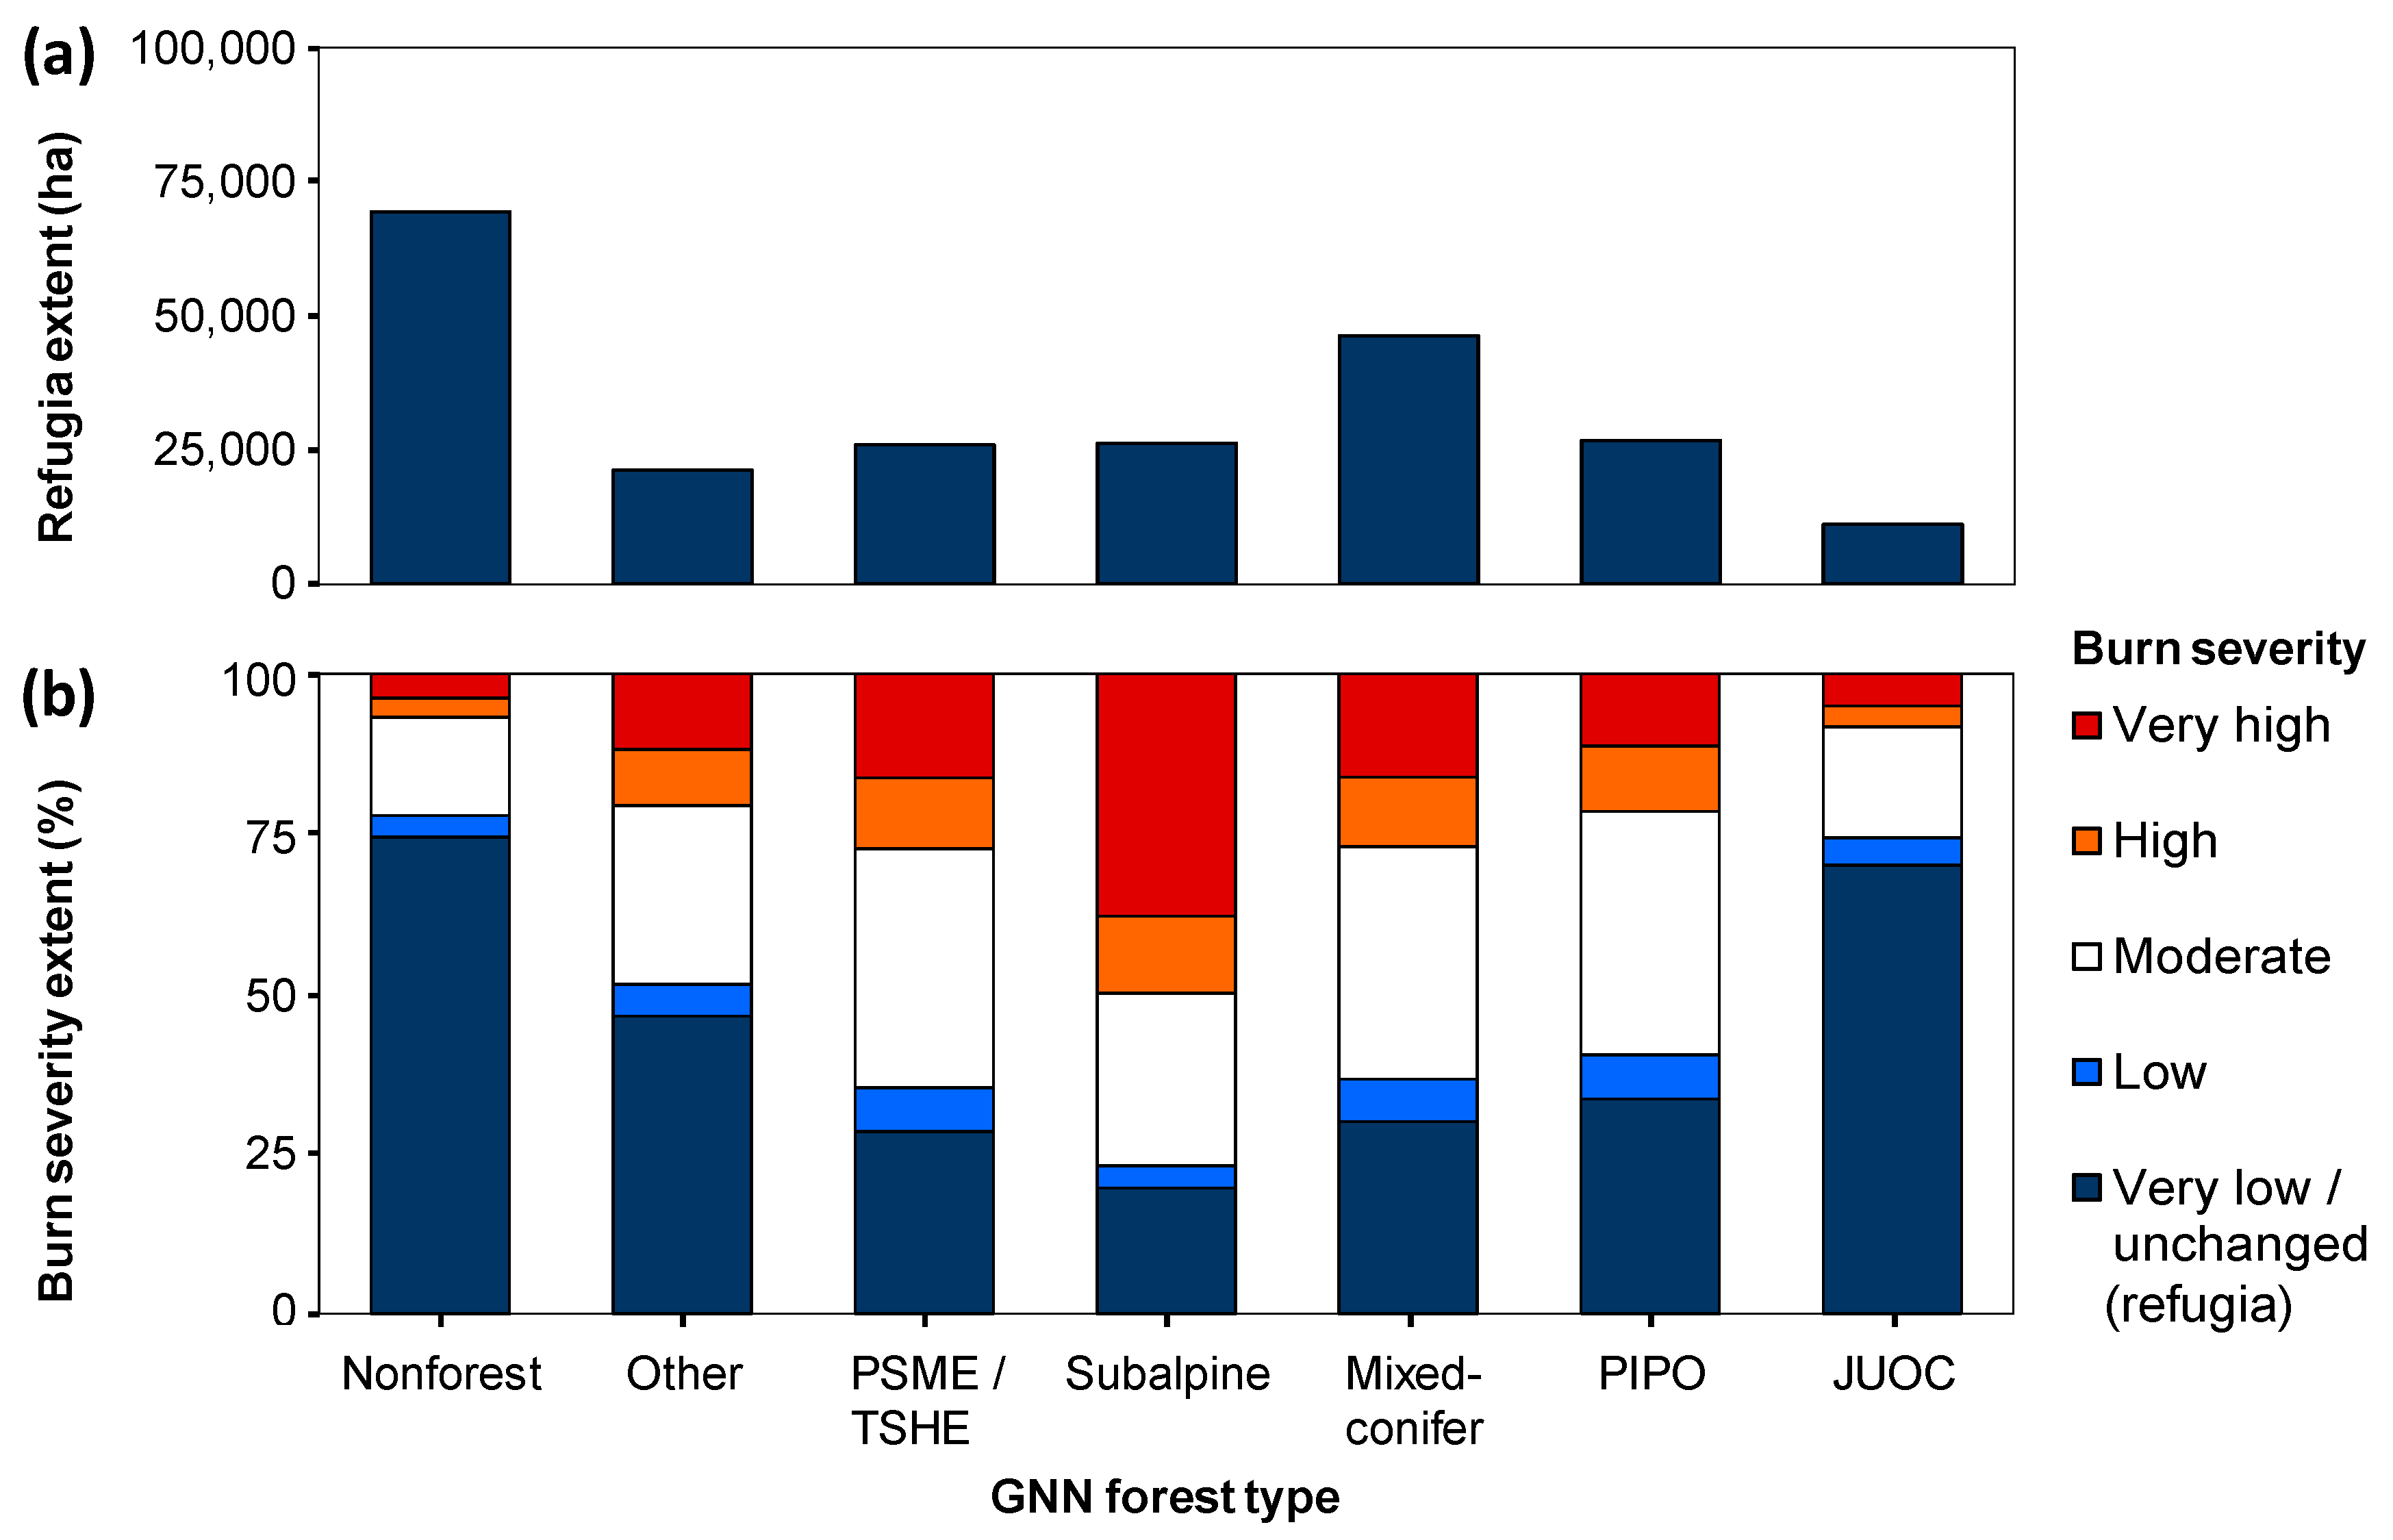
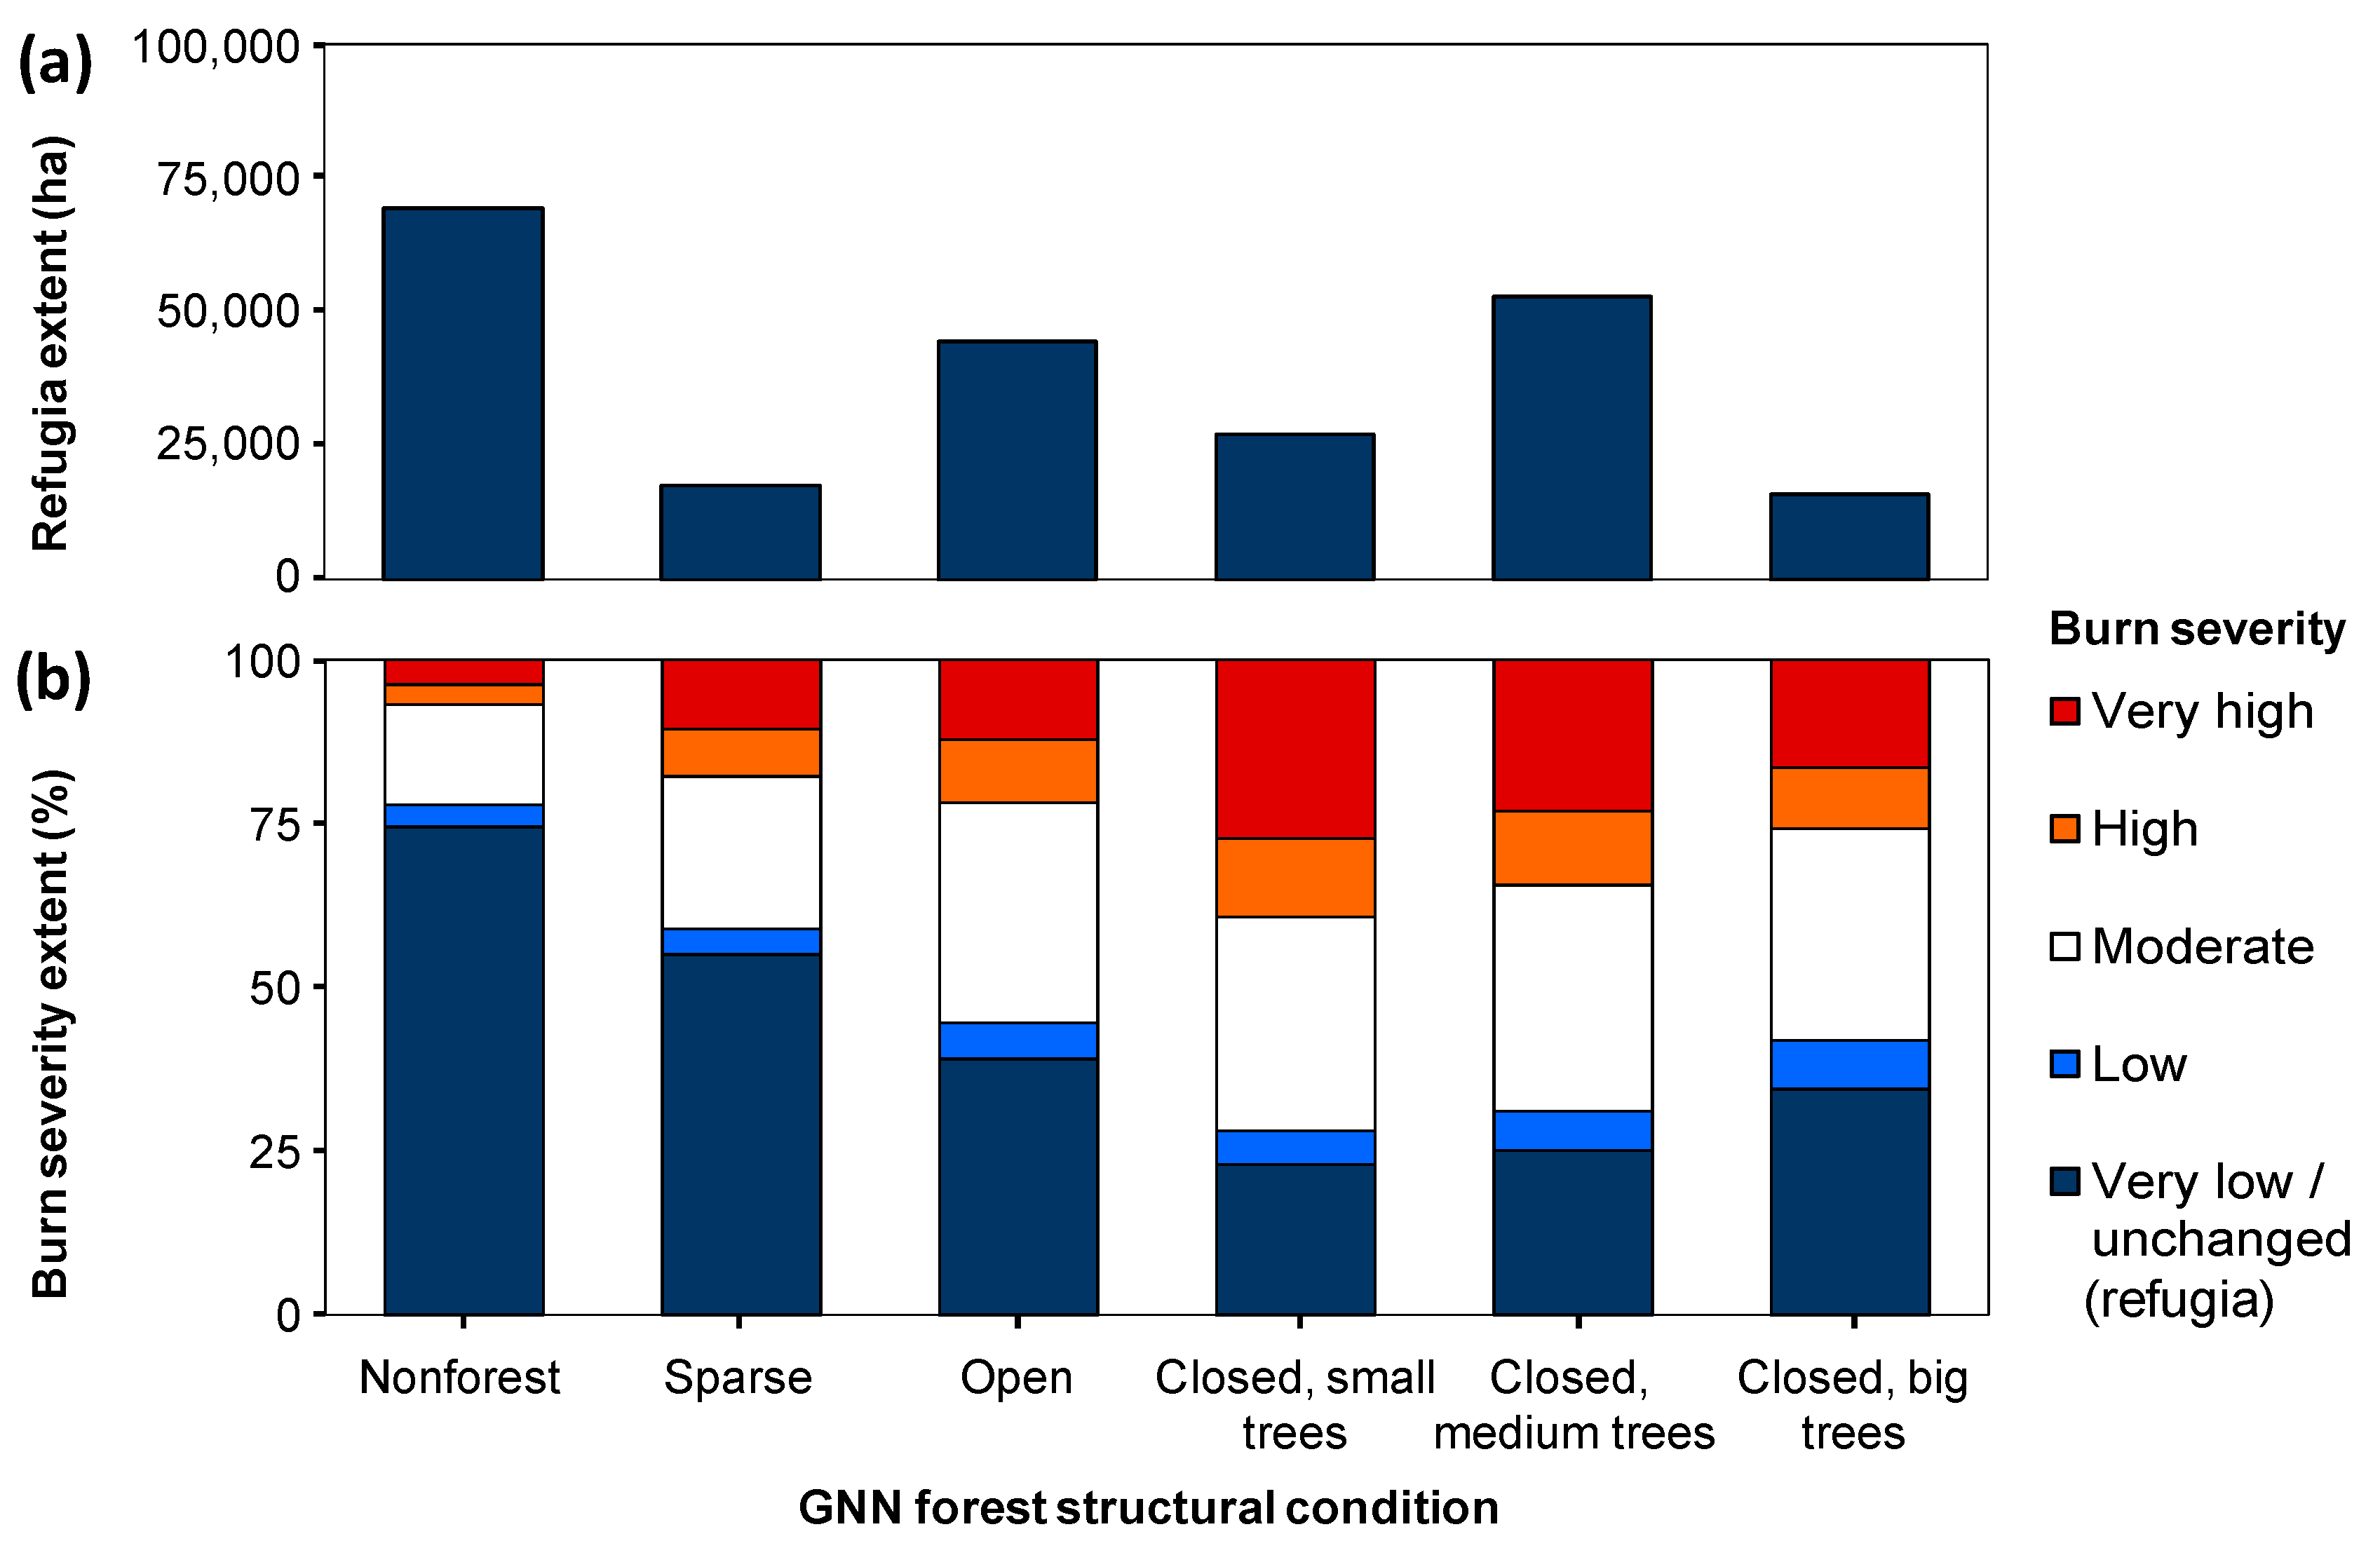
3.3. Fire Refugia and Burn Severity across Forest Composition and Structure Types

Fire refugia and the other burn severity classes were not evenly distributed among forest types, and refugia were generally most abundant where high- and very high-severity fire were least abundant (and vice versa; Figure 7b). The relative abundance of fire refugia ranged from 20% of fire extent in subalpine forests to 70% in juniper woodlands (Figure 7b). Conversely, the relative abundance of very high-severity fire ranged from 5% of fire extent in juniper woodlands to 38% in subalpine forests (Figure 7b). The Douglas-fir/western hemlock, mixed-conifer, and ponderosa pine forests exhibited very similar amounts of the lowest and highest burn severity classes, with refugia ranging from 28% to 34% and very high severity ranging from 11% to 16% of fire extent (Figure 7b).
As with forest composition, fire refugia and burn severity classes varied among forest structural conditions (Figure 8b). In general, the relative abundance of refugia was lower in settings with moderate tree cover and size. Importantly, however, refugia abundance was higher in closed forests with large trees than in closed forests with medium trees (Figure 8b). Refugia areas ranged from 23% of fire extent in closed forests dominated by small trees to 55% in sparse forests (Figure 8b). In contrast, very high-severity areas ranged from 11% of fire extent in sparse forests to 27% in closed forests with small trees (Figure 8b). The other three forest structural conditions were intermediate in their distributions of burn severity classes. Closed forests dominated by medium trees were similar to closed forests with small trees, and closed forests with big trees were similar to open forests (Figure 8b). For the continuous structural variables, refugia tended to have lower live tree basal area and density, while very high-severity fire occurred in forests with higher live basal area and density (Table 5). Similarly, refugia tended to exhibit lower pre-fire tree age, quadratic mean diameter (an indicator of dominant tree size), and structural complexity (based on tree diameter distributions) than areas experiencing very high burn severity (Table 5).

4. Discussion

4.1. Composition and Structure of Forest Fire Refugia across the US Pacific Northwest

This study elucidates substantial variability in the composition and structure of fire refugia across forested ecosystems of the PNW study area, underscoring the need to account for pre-fire forest and non-forest conditions when creating and interpreting burn severity maps. In many cases, our analyses support the common intuition that fire refugia identified in classified severity maps (such as MTBS) broadly capture forests that experience minimal fire effects. These forested fire refugia vary in forest type and structural condition, demonstrating a range of forested conditions that will influence the transmission of ecological memory from the pre- to post-fire environment (i.e., information and material legacies [28]). However, non-forest vegetation accounted for a substantial component of mapped refugia, highlighting the importance of these areas both for ecosystem functions and mapping applications. Unvegetated conditions within mapped fire refugia were relatively rare in our study fires, but they may contribute disproportionately to landscape fire patterns if they influence the distribution of fire refugia in adjacent vegetated areas (e.g., by acting as fuel breaks). Overall, our assessment illustrates that the ecological role of fire refugia depends on site-specific pre-fire conditions, as well as the broader burn severity mosaic. As such, ecological interpretation of burn severity maps generated according to Landsat spectral change requires users to leverage additional datasets, such as the regional land cover and forest maps used here, to refine fire refugia assessments to specific ecosystems of interest and to characterize ecosystem legacies more comprehensively.
In addition to characterizing important variability of fire refugia, our study quantifies general ranges of conditions where fire refugia occur across the PNW study area. For example, although the extent and proportion of mapped refugia varied from year to year, refugia were widespread across burned areas, averaging 38% of mapped fire extent annually. Indeed, refugia were relatively extensive even in the forest type with the lowest percentage of refugia, subalpine fir. Although subalpine forests typically are characterized by infrequent, high-severity fire, our analyses identify one fifth of subalpine forests as unburned or low-severity refugia and one half experiencing <75% basal area mortality. The prevalence of non-stand-replacing fire in the forest type with the most severe fire effects, coupled with less extensive but notable high-severity conditions in the other forest types, supports increasing recognition of the importance of mixed-severity fire regimes [3,29]. The substantial extent of fire refugia across recent fires highlights that pre-fire conditions persist in many cases, despite concerns about increasing fire activity [15,17,25]. In addition, because the percentage of fire refugia was lower in forest compositional and structural conditions with a higher percentage of high-severity fire and vice versa, our findings demonstrate relative differences in fire effects among forest types that are consistent with expectations from fire history studies and fire regime theory [1,6,30].
As expected in these generally forested locations, forests were the dominant land cover type overall (85%) and in refugia areas (69%). However, our study also indicates that the nature of post-fire ecosystem legacies and potential functions of fire refugia depends on specific forest conditions in the pre-fire landscape. For example, the post-fire trajectory of a refugia site with surviving dense, large trees will be very different from a sparsely forested or unvegetated site. Locations with abundant overstory trees likely will function as forest refugia with live tree legacies (i.e., seed sources [11]) and fauna source populations [12]. These ecological functions are particularly important for refugia sites adjacent to high-severity areas and in cases where drought conditions hinder seedling establishment [11,14]. Another key function for forested refugia is the provision of critical habitat for forest specialists both during and following fire [12,20,23]. In western portions of the Pacific Northwest region, because late-successional and old-growth forests provide nesting and roosting habitat for the Northern Spotted Owl (Strix occidentalis caurina Merriam), fire refugia in closed canopy forest with large trees represent an especially vital subset of refugia for this and other vulnerable species.
Although the majority of mapped refugia were forested prior to the most recent fires, non-forest conditions represented 31% of refugia extent, a considerable component of burned landscapes with distinct implications for forest ecosystems and fire dynamics. For example, locations with non-forest vegetation prior to fire likely contain shrub and herbaceous communities that contribute to heterogeneity in both the pre- and post-fire landscape, providing habitat for early-successional species that might otherwise require stand-replacing disturbance. Non-forest vegetation also may respond rapidly following fire [31,33], increasing surface fuel connectivity and potential exposure of forest refugia to future fires, at least where herbaceous grasslands interface with forests. In contrast, unvegetated non-forest conditions like rocky slopes in barren and alpine locations may protect adjacent forested areas from fire via fuel breaks despite not harboring surviving trees themselves. The different ways that non-forest cover types intermix, and potentially influence, forest fire refugia within generally forested ecosystems highlights the need to account for the diversity of land cover types and spatial complexity of burn severity mosaics in fire assessments.

4.2. Implications for Fire Refugia Research, Monitoring, and Management

This study describes previously undocumented variability in remotely mapped fire refugia across a heterogeneous region and numerous fire events, suggesting several avenues for future research. Finer-resolution analyses are possible in both forest and non-forest areas, including examination of more specific forest types, forest structural conditions, or non-forest land cover types. Such assessments could be particularly fruitful at sub-regional scales, especially where detailed pre-fire field data are available within specific landscapes or land-management units (i.e., National Forests). The landscape-scale maps of the Table Mountain Fire (Figure 3 and Figure 4) illustrate important pixel- and stand-scale variation that future studies could integrate further with intensive field surveys (e.g., [8,9]). In addition to assessing composition and structure as separate components of forest ecosystems, future work could explore the interactions of composition and structure, identifying, for instance, the structural conditions more conducive to fire refugia in forest types with the least amount of refugia. Additional studies also could investigate the variability of post-fire forest and non-forest conditions in order to document the influence of pre-fire heterogeneity on post-fire heterogeneity and ecosystem responses, building on recent analyses of refugia spatial patterns. For example, Meddens et al. [19] determined that refugia patch size varies with land cover type and topography (i.e., larger patch size in flatter locations with sparse vegetation). Finally, subsequent work could focus on statistical modeling of the environmental controls underpinning the predictability and persistence of fire refugia (e.g., [7,24]), as well as how fire refugia might overlap with hydrological and climate refugia (e.g., [10]). In anticipation of these prospects for further inquiry, the current study provides more detailed ecological resolution than previous efforts for a regional sample of large fires spanning a broad range of environmental settings. The opportunity to conduct this type of assessment will only increase with ongoing improvements in fire [49], vegetation [52], and land cover [56] mapping.
Our findings have immediate applications for the development and interpretation of refugia and burn severity maps. Specifically, this study underscores that the same estimate of spectral change (or lack thereof) can mean very differ things in forested and non-forested areas with differing composition and structure [32,34]. Categorical maps amplify this potential ambiguity because burn severity classes necessarily include a range of change values. As such, map users should exercise caution when interpreting burn severity products, particularly classified maps at the low end of the severity gradient in environments with a substantial non-forest component. If one’s primary interest is forest applications, rather than assuming that tree-based thresholds are applicable throughout fire perimeters, a prudent approach would be to apply a robust forest mask and assess only those fire events occurring after the forest mask imagery date (as in this study). This principle applies whether the refugia maps are based on two-image Landsat change detection with dNBR (an absolute change index, as in the MTBS classification) or Landsat time-series change detection with RdNBR (a relative change index, as in our classification). A related implication of this finding is that current off-the-shelf approaches (e.g., MTBS) overestimate the extent of forest fire refugia if an appropriate forest mask is not incorporated (e.g., Figure 3).
Finally, this study has direct implications for fire and forest management in the PNW region and other temperate forests with abundant wildfires. First, our findings suggest that land managers explicitly consider the pre-fire variability of burned areas when developing and applying burn severity maps, post-fire management activities, and ecosystem service assessments (e.g., [2]). The estimated difference between conditions before and after fire—whether spectral or field-based—is only one piece of the fire effects puzzle. The full picture of burn severity and ecosystem response to fire depends on pre-fire conditions, short-term fire effects, and post-fire vegetation trajectories [4,31]. Second, the substantial extent and variability of non-forest vegetation within fire refugia warrant special management attention and coordination with non-forest specialists. Because we assessed only those fire events with >50% forest cover, the prevalence of non-forest areas is higher across the broader PNW [19] and western North America. Accordingly, monitoring and management activities should integrate pre-fire land cover and other ancillary spatial data to characterize contemporary burn mosaics more comprehensively. Third, the high variability within mapped refugia locations confirms the value of developing clear terminology and conceptual frameworks for fire refugia [57], especially in the context of broader discussions of refugia conservation [10].

5. Conclusions

As fire activity continues to increase due to changing climate and land use [15,16,17], the topic of fire refugia will become increasingly important in ecosystems throughout the world. In the Pacific Northwest, fire extent has increased dramatically in recent years, although the proportion of different burn severity classes has remained relatively consistent [6,19]. This study develops a new approach to map and describe forest fire refugia and overlays those refugia with readily available land cover and vegetation maps, illustrating that not all fire refugia are equivalent. The variability and potential interactions of land cover types, forest types, and forest structural conditions demonstrate the importance of understanding the full range of pre-fire conditions in burned areas. Our findings also underscore that burn severity map users should be careful in their assumptions when identifying potential forest fire refugia with satellite imagery because non-forest and sparsely forested areas can represent a considerable percentage of locations experiencing minimal spectral change, which could result in the overestimation of functional forest fire refugia. Future research, monitoring, and management activities could further elucidate the patterns and ecological functions of fire refugia, as well as strategies to increase the capacity of refugia to enhance forest resistance and resilience in fire-prone landscapes.

Supplementary Materials

The following are available online at https://www.mdpi.com/1999-4907/9/5/243/s1: Figure S1: Forest composition across the Pacific Northwest study area based on GNN data; Figure S2: Forest structure across the Pacific Northwest study area based on GNN data; Table S1: Attributes of selected fire events; Table S2: Land cover types from GAP data; Table S3: Forest types from GNN data.

Author Contributions

G.W.M. and M.A.K. conceived and designed the study; G.W.M. prepared and analyzed the spatial data; G.W.M. and M.A.K. wrote the paper.

Funding

This research was funded by Oregon State University and the USFS Rocky Mountain Research Station under 16-JV-11221639-101.

Acknowledgments

We are thankful for assistance with data analysis and interpretation from William Downing, Christopher Dunn, Matthew Gregory, and Matthew Reilly. We appreciate thought-provoking feedback from Geneva Chong, Jonathan Coop, Sandra Haire, Carol Miller, Marc-André Parisien, Marie-Pierre Rogeau, Ryan Walker, Ellen Whitman, and the Fierylabs at Oregon State University. We acknowledge constructive comments from two anonymous reviewers.

Conflicts of Interest

The authors declare no conflict of interest.

References

  1. Agee, J.K. The landscape ecology of western forest fire regimes. Northwest Sci. 1998, 72, 24–34. [Google Scholar]
  2. Meigs, G.W.; Donato, D.C.; Campbell, J.L.; Martin, J.G.; Law, B.E. Forest fire impacts on carbon uptake, storage, and emission: The role of burn severity in the Eastern Cascades, Oregon. Ecosystems 2009, 12, 1246–1267. [Google Scholar] [CrossRef]
  3. Halofsky, J.; Donato, D.; Hibbs, D.; Campbell, J.; Cannon, M.D.; Fontaine, J.; Thompson, J.R.; Anthony, R.; Bormann, B.; Kayes, L. Mixed-severity fire regimes: Lessons and hypotheses from the Klamath-Siskiyou ecoregion. Ecosphere 2011, 2, 1–19. [Google Scholar] [CrossRef]
  4. Lentile, L.B.; Holden, Z.A.; Smith, A.M.S.; Falkowski, M.J.; Hudak, A.T.; Morgan, P.; Lewis, S.A.; Gessler, P.E.; Benson, N.C. Remote sensing techniques to assess active fire characteristics and post-fire effects. Int. J. Wildland Fire 2006, 15, 319–345. [Google Scholar] [CrossRef]
  5. Kolden, C.A.; Lutz, J.A.; Key, C.H.; Kane, J.T.; van Wagtendonk, J.W. Mapped versus actual burned area within wildfire perimeters: Characterizing the unburned. For. Ecol. Manag. 2012, 286, 38–47. [Google Scholar] [CrossRef]
  6. Reilly, M.J.; Dunn, C.J.; Meigs, G.W.; Spies, T.A.; Kennedy, R.E.; Bailey, J.D.; Briggs, K. Contemporary patterns of fire extent and severity in forests of the Pacific Northwest, USA (1985–2010). Ecosphere 2017, 8, 1–28. [Google Scholar] [CrossRef]
  7. Krawchuk, M.A.; Haire, S.L.; Coop, J.; Parisien, M.A.; Whitman, E.; Chong, G.; Miller, C. Topographic and fire weather controls of fire refugia in forested ecosystems of northwestern North America. Ecosphere 2016, 7, 1–18. [Google Scholar] [CrossRef]
  8. Camp, A.; Oliver, C.; Hessburg, P.; Everett, R. Predicting late-successional fire refugia pre-dating European settlement in the Wenatchee Mountains. For. Ecol. Manag. 1997, 95, 63–77. [Google Scholar] [CrossRef]
  9. Kolden, C.A.; Bleeker, T.M.; Smith, A.; Poulos, H.M.; Camp, A.E. Fire effects on historical wildfire refugia in contemporary wildfires. Forests 2017, 8, 400. [Google Scholar] [CrossRef]
  10. Morelli, T.L.; Daly, C.; Dobrowski, S.Z.; Dulen, D.M.; Ebersole, J.L.; Jackson, S.T.; Lundquist, J.D.; Millar, C.I.; Maher, S.P.; Monahan, W.B. Managing climate change refugia for climate adaptation. PLoS ONE 2016, 11, 1–17. [Google Scholar] [CrossRef] [PubMed]
  11. Haire, S.L.; McGarigal, K. Effects of landscape patterns of fire severity on regenerating ponderosa pine forests (Pinus ponderosa) in New Mexico and Arizona, USA. Landsc. Ecol. 2010, 25, 1055–1069. [Google Scholar] [CrossRef]
  12. Robinson, N.M.; Leonard, S.W.; Ritchie, E.G.; Bassett, M.; Chia, E.K.; Buckingham, S.; Gibb, H.; Bennett, A.F.; Clarke, M.F. Refuges for fauna in fire-prone landscapes: Their ecological function and importance. J. Appl. Ecol. 2013, 50, 1321–1329. [Google Scholar] [CrossRef]
  13. Jõgiste, K.; Korjus, H.; Stanturf, J.A.; Frelich, L.E.; Baders, E.; Donis, J.; Jansons, A.; Kangur, A.; Köster, K.; Laarmann, D. Hemiboreal forest: Natural disturbances and the importance of ecosystem legacies to management. Ecosphere 2017, 8, 1–20. [Google Scholar] [CrossRef]
  14. Stevens-Rumann, C.S.; Kemp, K.B.; Higuera, P.E.; Harvey, B.J.; Rother, M.T.; Donato, D.C.; Morgan, P.; Veblen, T.T. Evidence for declining forest resilience to wildfires under climate change. Ecol. Lett. 2017, 21, 243–252. [Google Scholar] [CrossRef] [PubMed]
  15. Moritz, M.A.; Parisien, M.-A.; Batllori, E.; Krawchuk, M.A.; Van Dorn, J.; Ganz, D.J.; Hayhoe, K. Climate change and disruptions to global fire activity. Ecosphere 2012, 3, 1–22. [Google Scholar] [CrossRef]
  16. North, M.; Stephens, S.; Collins, B.; Agee, J.; Aplet, G.; Franklin, J.; Fulé, P. Reform forest fire management. Science 2015, 349, 1280–1281. [Google Scholar] [CrossRef] [PubMed]
  17. Abatzoglou, J.T.; Williams, A.P. Impact of anthropogenic climate change on wildfire across western us forests. Proc. Natl. Acad. Sci. USA 2016, 113, 11770–11775. [Google Scholar] [CrossRef] [PubMed]
  18. Meddens, A.J.H.; Kolden, C.A.; Lutz, J.A. Detecting unburned areas within wildfire perimeters using Landsat and ancillary data across the northwestern united states. Remote Sens. Environ. 2016, 186, 275–285. [Google Scholar] [CrossRef]
  19. Meddens, A.J.H.; Kolden, C.A.; Lutz, J.A.; Abatzoglou, J.T.; Hudak, A.T. Spatiotemporal patterns of unburned areas within fire perimeters in the northwestern United States from 1984 to 2014. Ecosphere 2018, 9, 1–16. [Google Scholar] [CrossRef]
  20. Banks, S.C.; Dujardin, M.; McBurney, L.; Blair, D.; Barker, M.; Lindenmayer, D.B. Starting points for small mammal population recovery after wildfire: Recolonisation or residual populations? Oikos 2011, 120, 26–37. [Google Scholar] [CrossRef]
  21. Wood, S.W.; Murphy, B.P.; Bowman, D.M.J.S. Firescape ecology: How topography determines the contrasting distribution of fire and rain forest in the south-west of the Tasmanian wilderness world heritage area. J. Biogeogr. 2011, 38, 1807–1820. [Google Scholar] [CrossRef]
  22. Keeton, W.S.; Franklin, J.F. Fire-related landform associations of remnant old-growth trees in the southern Washington Cascade Range. Can. J. For. Res. 2004, 34, 2371–2381. [Google Scholar] [CrossRef]
  23. Hylander, K.; Johnson, S. In situ survival of forest bryophytes in small-scale refugia after an intense forest fire. J. Veg. Sci. 2010, 21, 1099–1109. [Google Scholar] [CrossRef]
  24. Ouarmim, S.; Paradis, L.; Asselin, H.; Bergeron, Y.; Ali, A.A.; Hély, C. Burning potential of fire refuges in the boreal mixedwood forest. Forests 2016, 7, 246. [Google Scholar] [CrossRef]
  25. Reilly, M.J.; Elia, M.; Spies, T.A.; Gregory, M.J.; Sanesi, G.; Lafortezza, R. Cumulative effects of wildfires on forest dynamics in the eastern Cascade Mountains, USA. Ecol. Appl. 2018, 28, 291–308. [Google Scholar] [CrossRef] [PubMed]
  26. Reilly, M.J.; Spies, T.A. Regional variation in stand structure and development in forests of Oregon, Washington, and inland Northern California. Ecosphere 2015, 6, 1–27. [Google Scholar] [CrossRef]
  27. Meigs, G.W.; Morrissey, R.C.; Bače, R.; Chaskovskyy, O.; Čada, V.; Després, T.; Donato, D.C.; Janda, P.; Lábusová, J.; Seedre, M.; et al. More ways than one: Mixed-severity disturbance regimes foster structural complexity via multiple developmental pathways. For. Ecol. Manag. 2017, 406, 410–426. [Google Scholar] [CrossRef]
  28. Johnstone, J.F.; Allen, C.D.; Franklin, J.F.; Frelich, L.E.; Harvey, B.J.; Higuera, P.E.; Mack, M.C.; Meentemeyer, R.K.; Metz, M.R.; Perry, G.L. Changing disturbance regimes, ecological memory, and forest resilience. Front. Ecol. Environ. 2016, 14, 369–378. [Google Scholar] [CrossRef]
  29. Hessburg, P.F.; Spies, T.A.; Perry, D.A.; Skinner, C.N.; Taylor, A.H.; Brown, P.M.; Stephens, S.L.; Larson, A.J.; Churchill, D.J.; Povak, N.A. Tamm review: Management of mixed-severity fire regime forests in Oregon, Washington, and Northern California. For. Ecol. Manag. 2016, 366, 221–250. [Google Scholar] [CrossRef]
  30. Miller, R.F.; Rose, J.A. Fire history and western juniper encroachment in sagebrush steppe. J. Range Manag. 1999, 52, 550–559. [Google Scholar] [CrossRef]
  31. Keeley, J.E. Fire intensity, fire severity and burn severity: A brief review and suggested usage. Int. J. Wildland Fire 2009, 18, 116–126. [Google Scholar] [CrossRef]
  32. Miller, J.D.; Thode, A.E. Quantifying burn severity in a heterogeneous landscape with a relative version of the delta normalized burn ratio (dNBR). Remote Sens. Environ. 2007, 109, 66–80. [Google Scholar] [CrossRef]
  33. Keeley, J.E.; Brennan, T.; Pfaff, A.H. Fire severity and ecosytem responses following crown fires in California shrublands. Ecol. Appl. 2008, 18, 1530–1546. [Google Scholar] [CrossRef] [PubMed]
  34. Strand, E.K.; Bunting, S.C.; Keefe, R.F. Influence of wildland fire along a successional gradient in sagebrush steppe and western juniper woodlands. Rangel. Ecol. Manag. 2013, 66, 667–679. [Google Scholar] [CrossRef]
  35. Eidenshink, J.; Schwind, B.; Brewer, K.; Zhu, Z.L.; Quayle, B.; Howard, S. A project for monitoring trends in burn severity. Fire Ecol. 2007, 3, 3–21. [Google Scholar] [CrossRef]
  36. Key, C.H.; Benson, N.C. Landscape assessment: Ground measure of severity, the composite burn index; and remote sensing of severity, the normalized burn ratio. In FIREMON: Fire Effects Monitoring and Inventory System; General Technical Report RMRS-GTR-164-CD; USDA Forest Service: Fort Collins, CO, USA, 2006; pp. 1–55. [Google Scholar]
  37. Kennedy, R.E.; Yang, Z.G.; Cohen, W.B. Detecting trends in forest disturbance and recovery using yearly Landsat time series: 1. LandTrendr—Temporal segmentation algorithms. Remote Sens. Environ. 2010, 114, 2897–2910. [Google Scholar] [CrossRef]
  38. Ohmann, J.L.; Gregory, M.J.; Roberts, H.M.; Cohen, W.B.; Kennedy, R.E.; Yang, Z. Mapping change of older forest with nearest-neighbor imputation and Landsat time-series. For. Ecol. Manag. 2012, 272, 13–25. [Google Scholar] [CrossRef]
  39. Franklin, J.F.; Dyrness, C.T. Natural Vegetation of Oregon and Washington; General Technical Report PNW-GTR-8; USDA Forest Service: Portland, OR, USA, 1973; pp. 1–452.
  40. Hessburg, P.F.; Smith, B.G.; Salter, R.B.; Ottmar, R.D.; Alvarado, E. Recent changes (1930s–1990s) in spatial patterns of interior northwest forests, USA. For. Ecol. Manag. 2000, 136, 53–83. [Google Scholar] [CrossRef]
  41. Meigs, G.W.; Campbell, J.L.; Zald, H.S.J.; Bailey, J.D.; Shaw, D.C.; Kennedy, R.E. Does wildfire likelihood increase following insect outbreaks in conifer forests? Ecosphere 2015, 6, 1–24. [Google Scholar] [CrossRef]
  42. Littell, J.S.; Oneil, E.E.; McKenzie, D.; Hicke, J.A.; Lutz, J.A.; Norheim, R.A.; Elsner, M.M. Forest ecosystems, disturbance, and climatic change in Washington state, USA. Clim. Chang. 2010, 102, 129–158. [Google Scholar] [CrossRef]
  43. O’Neil, T.A.; Bettinger, K.A.; Vander Heyden, M.; Marcot, B.; Barrett, C.; Mellen, T.K.; Vanderhaegen, W.M.; Johnson, D.H.; Doran, P.J.; Wunder, L. Structural conditions and habitat elements of Oregon and Washington. In Wildlife Habitats and Relationships in Oregon and Washington; OSU Press: Corvallis, OR, USA, 2001; pp. 115–139. [Google Scholar]
  44. Omernik, J.M. Ecoregions of the conterminous United States. Map (scale 1:7,500,000). Ann. Assoc. Am. Geogr. 1987, 77, 118–125. [Google Scholar] [CrossRef]
  45. Meigs, G.W.; Kennedy, R.E.; Gray, A.N.; Gregory, M.J. Spatiotemporal dynamics of recent mountain pine beetle and western spruce budworm outbreaks across the Pacific Northwest Region, USA. For. Ecol. Manag. 2015, 339, 71–86. [Google Scholar] [CrossRef]
  46. Meigs, G.W.; Zald, H.S.; Campbell, J.L.; Keeton, W.S.; Kennedy, R.E. Do insect outbreaks reduce the severity of subsequent forest fires? Environ. Res. Lett. 2016, 11, 1–10. [Google Scholar] [CrossRef]
  47. Cansler, C.A.; McKenzie, D. Climate, fire size, and biophysical setting control fire severity and spatial pattern in the northern Cascade Range, USA. Ecol. Appl. 2014, 24, 1037–1056. [Google Scholar] [CrossRef] [PubMed]
  48. Harvey, B.J.; Donato, D.C.; Turner, M.G. Recent mountain pine beetle outbreaks, wildfire severity, and postfire tree regeneration in the US Northern Rockies. Proc. Natl. Acad. Sci. USA 2014, 111, 15120–15125. [Google Scholar] [CrossRef] [PubMed]
  49. Parks, S.A.; Dillon, G.K.; Miller, C. A new metric for quantifying burn severity: The relativized burn ratio. Remote Sens. 2014, 6, 1827–1844. [Google Scholar] [CrossRef]
  50. Max, T.A.; Schreuder, H.T.; Hazard, J.W.; Oswald, D.D.; Teply, J.; Alegria, J. The Pacific Northwest Region Vegetation and Inventory Monitoring System; Research Paper PNW-RP-493; USDA Forest Service: Portland, OR, USA, 1996; pp. 1–22.
  51. Comer, P.; Faber-Langendoen, D.; Evans, R.; Gawler, S.; Josse, C.; Kittel, G.; Menard, S.; Pyne, M.; Reid, M.; Schulz, K. Ecological Systems of the United States: A Working Classification of US Terrestrial Systems; NatureServe: Arlington, VA, USA, 2003; pp. 1–75. [Google Scholar]
  52. Kennedy, R.E.; Ohmann, J.; Gregory, M.; Roberts, H.; Yang, Z.; Bell, D.M.; Kane, V.; Hughes, M.J.; Cohen, W.B.; Powell, S. An empirical, integrated forest biomass monitoring system. Environ. Res. Lett. 2018, 13, 1–10. [Google Scholar] [CrossRef]
  53. Ohmann, J.L.; Gregory, M.J. Predictive mapping of forest composition and structure with direct gradient analysis and nearest-neighbor imputation in coastal Oregon, USA. Can. J. For. Res. 2002, 32, 725–741. [Google Scholar] [CrossRef]
  54. Ter Braak, C.J. Canonical correspondence analysis: A new eigenvector technique for multivariate direct gradient analysis. Ecology 1986, 67, 1167–1179. [Google Scholar] [CrossRef]
  55. Curtis, R.O.; Marshall, D.D. Why quadratic mean diameter? West J. Appl. For. 2000, 15, 137–139. [Google Scholar]
  56. Soulard, C.E.; Acevedo, W.; Stehman, S.V. Removing rural roads from the National Land Cover Database to create improved urban maps for the United States, 1992 to 2011. Photogramm. Eng. Remote Sens. 2018, 84, 101–109. [Google Scholar]
  57. Meddens, A.J.H.; Kolden, C.A.; Lutz, J.A.; Smith, A.M.S.; Cansler, C.A.; Abatzoglou, J.T.; Meigs, G.W.; Downing, W.M.; Krawchuk, M.A. Fire refugia: What are they and why do they matter for global change? BioScience 2018. in review. [Google Scholar]
Figure 1. Overview of key spatial datasets (black), processing steps (blue), and objectives (orange). See Section 2 for fire selection criteria. Data sources and references: MTBS: https://mtbs.gov; LandTrendr: Kennedy et al. [37]; RdNBR: Miller and Thode [32]; field-measured tree mortality: Reilly et al. [6]; GAP land cover: https://gapanalysis.usgs.gov; GNN based on Ohmann et al. [38].
Forests 09 00243 g001
Figure 2. Study area and fires of interest across Oregon and Washington. Pink polygons are the randomly selected portions of large wildfires (≥400 ha) with ≥50% forest cover that burned only once from 2004 to 2015 (n = 99). Study fires occurred primarily east of the Cascade Range. Dark blue polygons are all MTBS fires that burned between 1984 and 2015 within generally forested ecoregions (level three [44]). The orange perimeter indicates location of the Table Mountain Complex (Figure 3 and Figure 4). Oregon and Washington encompass ca. 40 M ha total and 20 M ha of forest (light green areas indicate forest cover [38]). Ecoregion abbreviations: NC: North Cascades; NR: Northern Rockies; CR: Coast Range; BM: Blue Mountains; WC: West Cascades; EC: East Cascades; KM: Klamath Mountains. We assess only the portions of ecoregions within Oregon and Washington.
Forests 09 00243 g002
Figure 3. Spatial patterns of burn severity mosaic, refugia, and non-forest areas across the 2012 Table Mountain Complex. Fire location is indicated in Figure 1. Burn severity classes in this study (a,b,d,e) are based on Landsat time series, RdNBR, and field-based tree mortality estimates (see Section 2). MTBS severity classes (c,f) are based on dNBR protocols described by Eidenshink et al. [35] and exhibit similar spatial patterns, particularly the lowest- and highest-severity classes. According to our severity maps, non-forest conditions (non-forest mask) accounted for 31% of refugia extent across all fires and 10% of refugia extent across the Table Mountain Complex. Zoom maps (df) show how non-forest conditions are more prevalent in some refugia areas. MTBS: Monitoring Trends in Burn Severity; https://mtbs.gov.
Forests 09 00243 g003
Figure 4. Spatial patterns of pre-fire land cover (a,d), forest type (b,e), and forest structural condition (c,f) across the 2012 Table Mountain Complex. Fire location is indicated in Figure 1. The 2003 GNN-based forest maps (be,f) illustrate more variability in forest type across this plateau landscape than in forest structure, which was generally closed-canopy forest dominated by medium trees (see Section 2 for classification details). Zoom maps (df) show how fine-grained variability of pre-fire conditions. Data sources and references: GAP (Gap Analysis Program) land cover: https://gapanalysis.usgs.gov; GNN (gradient nearest-neighbor imputation) based on Ohmann et al. [38]. See Supplemental Figures S1 and S2 for distribution of forest type and structural condition across the study area.
Forests 09 00243 g004
Figure 5. (a) Temporal patterns of study fires (n = 99) and available fires matching study criteria (n = 172). (b) Relative distribution of burn severity classes for study fires across all land cover types. The study fires exhibited the same temporal pattern as the available fires (see spatial pattern in Figure 1). The refugia class (very low/unchanged) was extensive but varied widely from year to year (mean ± SD: 38.1 ± 13.2%). Burn severity classes are based on the relationship between tree basal area mortality at federal inventory plots and Landsat spectral change (RdNBR; Reilly et al. [6]).
Forests 09 00243 g005
Figure 6. Pre-fire land cover across study fires according to GAP analysis data (https://gapanalysis.usgs.gov). Although these fires were predominantly forested (85%), a substantial portion of the refugia class was non-forested (31%). In addition, most of the non-forest extent (74%) was in refugia areas, and the most prevalent cover types in refugia were shrub (40%), herbaceous (33%), and crops (18%).
Forests 09 00243 g006
Figure 7. Forest composition of fire refugia in terms of extent of refugia (a) and relative distribution of other burn severity classes (b). Mixed-conifer forests in relatively dry parts of the region were the most extensive forest type and contained the most refugia (a). The percentage of refugia was lowest in subalpine forests and highest in juniper woodlands (b). Pre-fire forest types are consolidated into general forest types, ordered from west to east, and are based on live basal area of dominant tree species according to 2003 GNN maps [38]. See Section 2 for details regarding burn severity and forest-type classification and Figure 3 and Figure 4 for landscape spatial patterns. We include non-forested areas for reference but do not interpret the severity classes in direct comparison with the forested areas.
Forests 09 00243 g007
Figure 8. Forest structure of fire refugia in terms of extent of refugia (a) and relative distribution of other burn severity classes (b). Closed forests (>40% canopy cover) dominated by medium trees (dominant tree diameter 25–50 cm) were the most extensive structural class and contained the most refugia (a). The percentage of refugia generally declined with increasing tree cover and size but then increased in closed forests with large trees. Pre-fire structural conditions are based on live tree canopy cover and size classes according to 2003 GNN maps [38]. Structure classes are arranged in increasing order of tree cover and size. See Section 2 for details regarding burn severity and structure classification and Figure 3 and Figure 4 for landscape spatial patterns. We include non-forested areas for reference but do not interpret the severity classes in direct comparison with the forested areas.
Forests 09 00243 g008
Table 1. Land cover types across study fires according to GAP analysis data.
Land CoverExtent (Total ha)Extent (% of Total)Extent (Refugia ha)Extent (% of Refugia)
Forest519,39184.8157,38669.4
Non-forest total93,23815.269,41330.6
 Non-forest vegetation87,42614.365,68929.0
  Alpine39050.627841.2
  Shrub38,9516.427,49812.1
  Herbaceous31,3985.122,92610.1
  Crops13,1722.212,4815.5
 Unvegetated58120.937241.6
  Water4390.13260.1
  Barren22790.416890.7
  Developed30940.517090.8
Total612,629100.0226,798100.0
Notes: See Figure 5 for example of landscape spatial pattern and Figure 6 for distribution among burn severity classes. Refugia areas are the lowest burn severity class (very low/unchanged).
Table 2. Gradient nearest-neighbor (GNN) variables included in spatial analysis.
VariableUnitsDescription
Forest typecategoricalForest type, which describes dominant tree species (based on basal area) of current vegetation; simplified to general types (Table 3).
Structural conditioncategoricalStructural condition based on size class and cover class (O’Neil et al. 2001)
Live tree basal aream2 ha−1Basal area of live trees ≥2.5 cm DBH
Live tree densitystems ha−1Density of live trees ≥2.5 cm DBH
Tree ageyearsBasal area weighted stand age based on field recorded or modeled ages of dominant and codominant trees
Quadratic mean diameter of dominant treescma Quadratic mean diameter (QMD) in centimeters of trees whose heights are in the top 25% of all tree heights on the plot
Diameter diversity indexH’b Diameter diversity index (DDI): a measure of stand structural complexity, based on tree densities in different diameter classes
Notes: GNN analysis imputes inventory plot data to forested pixels [38]. Full list of mapped variables available online (https://lemma.forestry.oregonstate.edu/data/structure-maps). a QMD of the upper quartile indicates the average size of dominant overstory trees. QMD can be calculated as the square root of the arithmetic mean of squared diameters or based on basal area and tree number [55]. b DDI is based on the number of live trees in four standardized tree size classes, and higher values correspond to higher levels of structural complexity.
Table 3. Forest types across study fires according to GNN data [38].
Forest TypeExtent (Total ha)Extent (% of Forested Total)Extent (Refugia ha)Extent (% of Refugia)
Other45,5248.821,17613.5
PSME-TSHE91,23417.625,98016.5
Subalpine133,31125.726,20716.7
Mixed-conifer153,76329.646,20829.4
PIPO79,81815.426,78617.0
JUOC15,7413.011,0307.0
Forested total519,391100.0157,387100.0
Notes: See Figure 4 for landscape spatial pattern and Figure 7 for distribution among burn severity classes. Species codes: PSME-TSHE = Douglas-fir-western hemlock; PIPO = ponderosa pine; JUOC = western juniper. Other species include miscellaneous conifers (7.3%) deciduous hardwoods (1.5%).
Table 4. RdNBR values, tree mortality ranges from forest inventory data, and extent of severity classes across study fires.
Burn Severity ClassRdNBR ValueBasal Area Mortality (%)Extent (ha)Extent (%)
Very low/unchanged (refugia)≤166.480–10226,79837
Low>166.48–235.20>10–2532,6455
Moderate>235.20–648.73>25–75185,95730
High>648.73–828.13>75–9058,28710
Very high>828.1390–100108,94318
Notes: See Section 2 for burn severity classification equation between RdNBR and basal area mortality (adapted from Reilly et al. [6]).
Table 5. GNN structure variables across study fires.
Burn Severity
Variable (Units)StatisticVery Low/Unchanged (Refugia)LowModerateHighVery High
Live tree basal areamean16.6325.6024.9826.9132.49
  (m2 ha−1)SD19.1719.0018.0517.9818.52
Live tree densitymean589.96904.37951.251094.741385.24
  (stems ha−1)SD904.281014.741099.791230.421277.28
Tree agemean80.98108.15109.02112.68123.21
  (year)SD72.2963.8460.3758.1756.44
Quadratic mean diametermean12.5117.2216.9916.8716.52
  (QMD; cm)SD11.119.839.338.928.43
Diameter diversity indexmean2.403.563.493.593.80
  (DDI; H’)SD2.292.081.951.871.82
Notes: See Table 3 for descriptions of GNN variables including QMD and DDI.

