1. Introduction
Currently, demands for precise information about individual trees and forest stands are increasing in forestry [
1]. The most important parameter for the estimation of forest information is the trunk diameter [
2]. The diameter is related strongly to other descriptors of tree size such as total height [
3] and crown dimensions [
4]. Thus, it is a key predictor to estimate the stem and tree volume [
5], biomass [
6], and other information [
7]. In addition to the forestry practice, the high demand for precise and complex three-dimensional (3D) data is evident in multiple research fields; for example, in functional-structural models [
8] where it is crucial to obtain accurate temporal 3D data. Furthermore, the demand for a high-quality visualization of the forest environment is high.
Many types of measuring instruments exist that exhibit different properties (e.g., precision, accuracy, operational simplicity, and cost). The methods used can be divided into two categories: contact methods (tape, caliper, electronic tree measuring fork) and non-contact methods (optical calipers, rangefinder dendrometers, optical forks) [
9]. The contact methods allow for the highest accuracy. Owing to time constraints and safety issues, they are limited to measurements of the lower bole. Meanwhile, non-contact methods are inaccurate or expensive in terms of time and instrument expense. Hence, alternative methods must be sought [
1].
During the last two decades, development methods have rendered 3D point clouds as a useful data source for tree measurements [
2]. The 3D data of trees from the ground may be characterized by three primary acquisition methods: (1) magnetic motion tracker, (2) terrestrial laser scanner (TLS), and (3) close-range photogrammetry (CRP) [
10]. The magnetic motion tracker allows for the detailed 3D point clouds to be used as a basis for determining the tree diameter. However, this method is expensive and time-consuming [
11]. Terrestrial laser scanning produces extremely high point densities and fills the gap between tree-scale manual measurements and large-scale airborne laser scanning measurements by providing a large amount of precise information on various forest structural parameters [
12]. The TLS can provide an estimation accuracy of 1–2 cm when the diameter at breast height (DBH) and the diameter on stem curve are estimated [
13]. The disadvantage of the TLS is its relatively high cost and lack of personnel training.
CRP is an approach allowing for the automatic reconstruction of 3D models using sets of overlapping two-dimensional digital images [
14]. Terrestrial photogrammetry is a perspective method to create 3D point clouds, because hand-held cameras are appropriate for end-users owing to their low-cost, and low-weight sensors that are highly portable and easy to access [
15]. Several authors used terrestrial photogrammetry to determine tree parameters [
1,
2,
7,
10,
15,
16,
17,
18,
19]. For example, Liang et al. [
15] described a method for terrestrial photogrammetry using a hand-held consumer camera. Forsman et al. [
2] developed a method for terrestrial mapping of a tree structure using a multi-camera rig. Surový et al. [
10] described the accuracy of point reconstruction on individual stems using a hand-held camera with stop-and-go. Miller et al. [
18] designed and described a method for individual tree models. Bauwens et al. [
7] used terrestrial photogrammetry as a tool for the non-destructive method of modelling irregularly shaped tropical tree trunks. However, in these studies, the authors did not focus on trunk perimeter estimation from CRP. The perimeter may be more accurate for deriving other parameters such as the diameter. Furthermore, the impact of different types of bark was not investigated. Most of the previous studies focused on trees within a research plot and created images for the whole research area. Capturing the trees individually within the forest stand can result in better estimation accuracies.
The aim of this study was to design an appropriate CRP method in order to create 3D point clouds of individual trees. Furthermore, we estimated the diameter and perimeter of individual trees with different types of bark, at different heights on the tree stem using a digital single-lens reflex (DSLR) camera with a non-fisheye lens and a fisheye lens, separately. The research itself is a first step towards the workflow development that starts from data acquisition to functional-structural forest modelling and visualization.
2. Materials and Methods
2.1. Study Site
The research area is located in the central part of Slovakia, which belongs to the Kremnica Mountains. The forest stands are unique according to the tree species composition, primarily European beech (
Fagus sylvatica L.), sessile oak (
Quercus petraea (Matt.) Liebl.), Norway spruce (
Picea abies (L.) H. Karst.), and European silver fir (
Abies alba Mill.). These four species differ significantly by bark type. Therefore, we chose 10 trees from each tree species. However, the light conditions and slope (0%–5%) were the same for all trees. The age varied from 55 to 80 years. Further, the age was equal, and the trees were located in the same forest stand within each tree species (
Figure 1).
2.2. Reference Data Acquisition
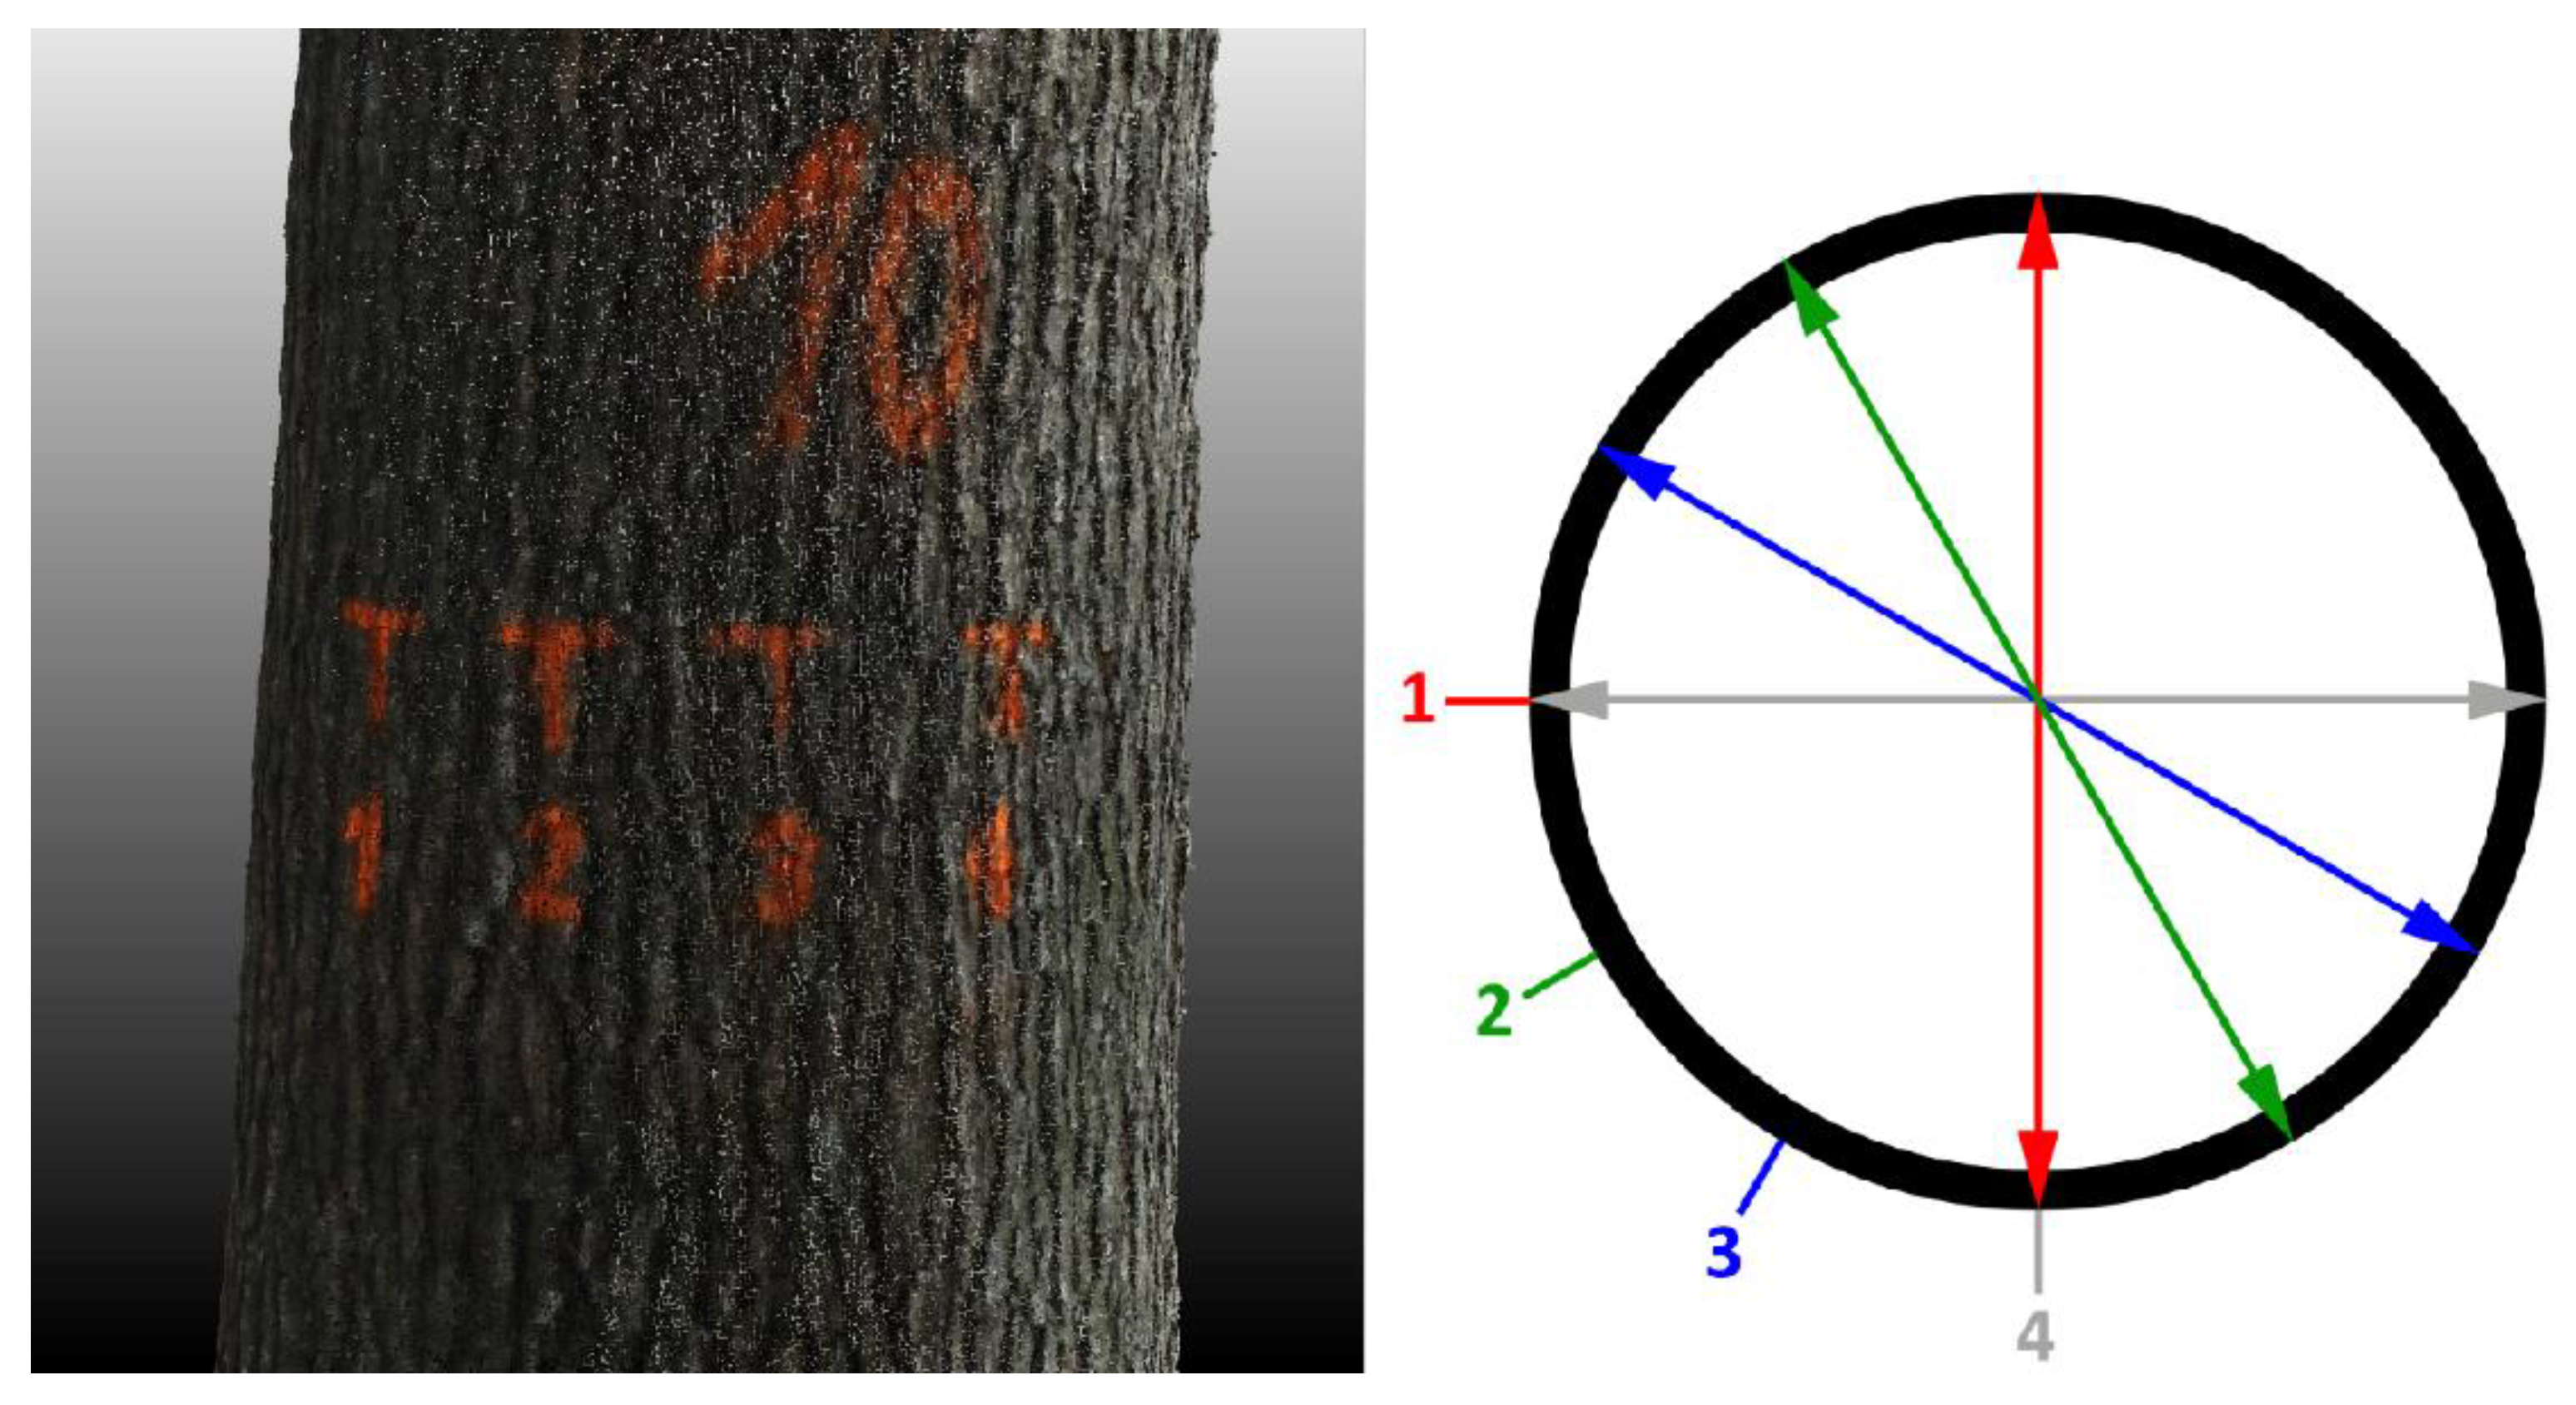
Tree diameter measurements were performed using a caliper and measuring tape. The diameter was measured at three heights: 0.8 m, 1.3 m, and 1.8 m. At each of those height levels, we marked the trunk on its perimeter with four markings. The diameter was measured with a caliper to be perpendicular to those markings, as shown in
Figure 2. The caliper measurement was performed four times for every marking. After measuring with the caliper, we also measured the perimeter by measuring the tape four times starting from each of the markings, and then we calculated the diameter. Altogether, we measured the diameter 20 times at each of the three height levels on the trunk, thus 60 times per tree.
2.3. Image Acquisition
Images of trunks were captured using a DSLR camera, Canon 70D (Canon Inc., Tokyo, Japan), with a CMOS sensor and 20.2-megapixel resolution. Two different lenses were used. The first was the Canon EF 35 mm f/2 IS USM (Canon Inc., Tokyo, Japan) with fixed focal length (non-fisheye). The second lens was the Canon EF 8–15 mm f/4L Fisheye USM (fisheye) (Canon Inc., Tokyo, Japan). The fisheye lens was fixed to 15 mm.
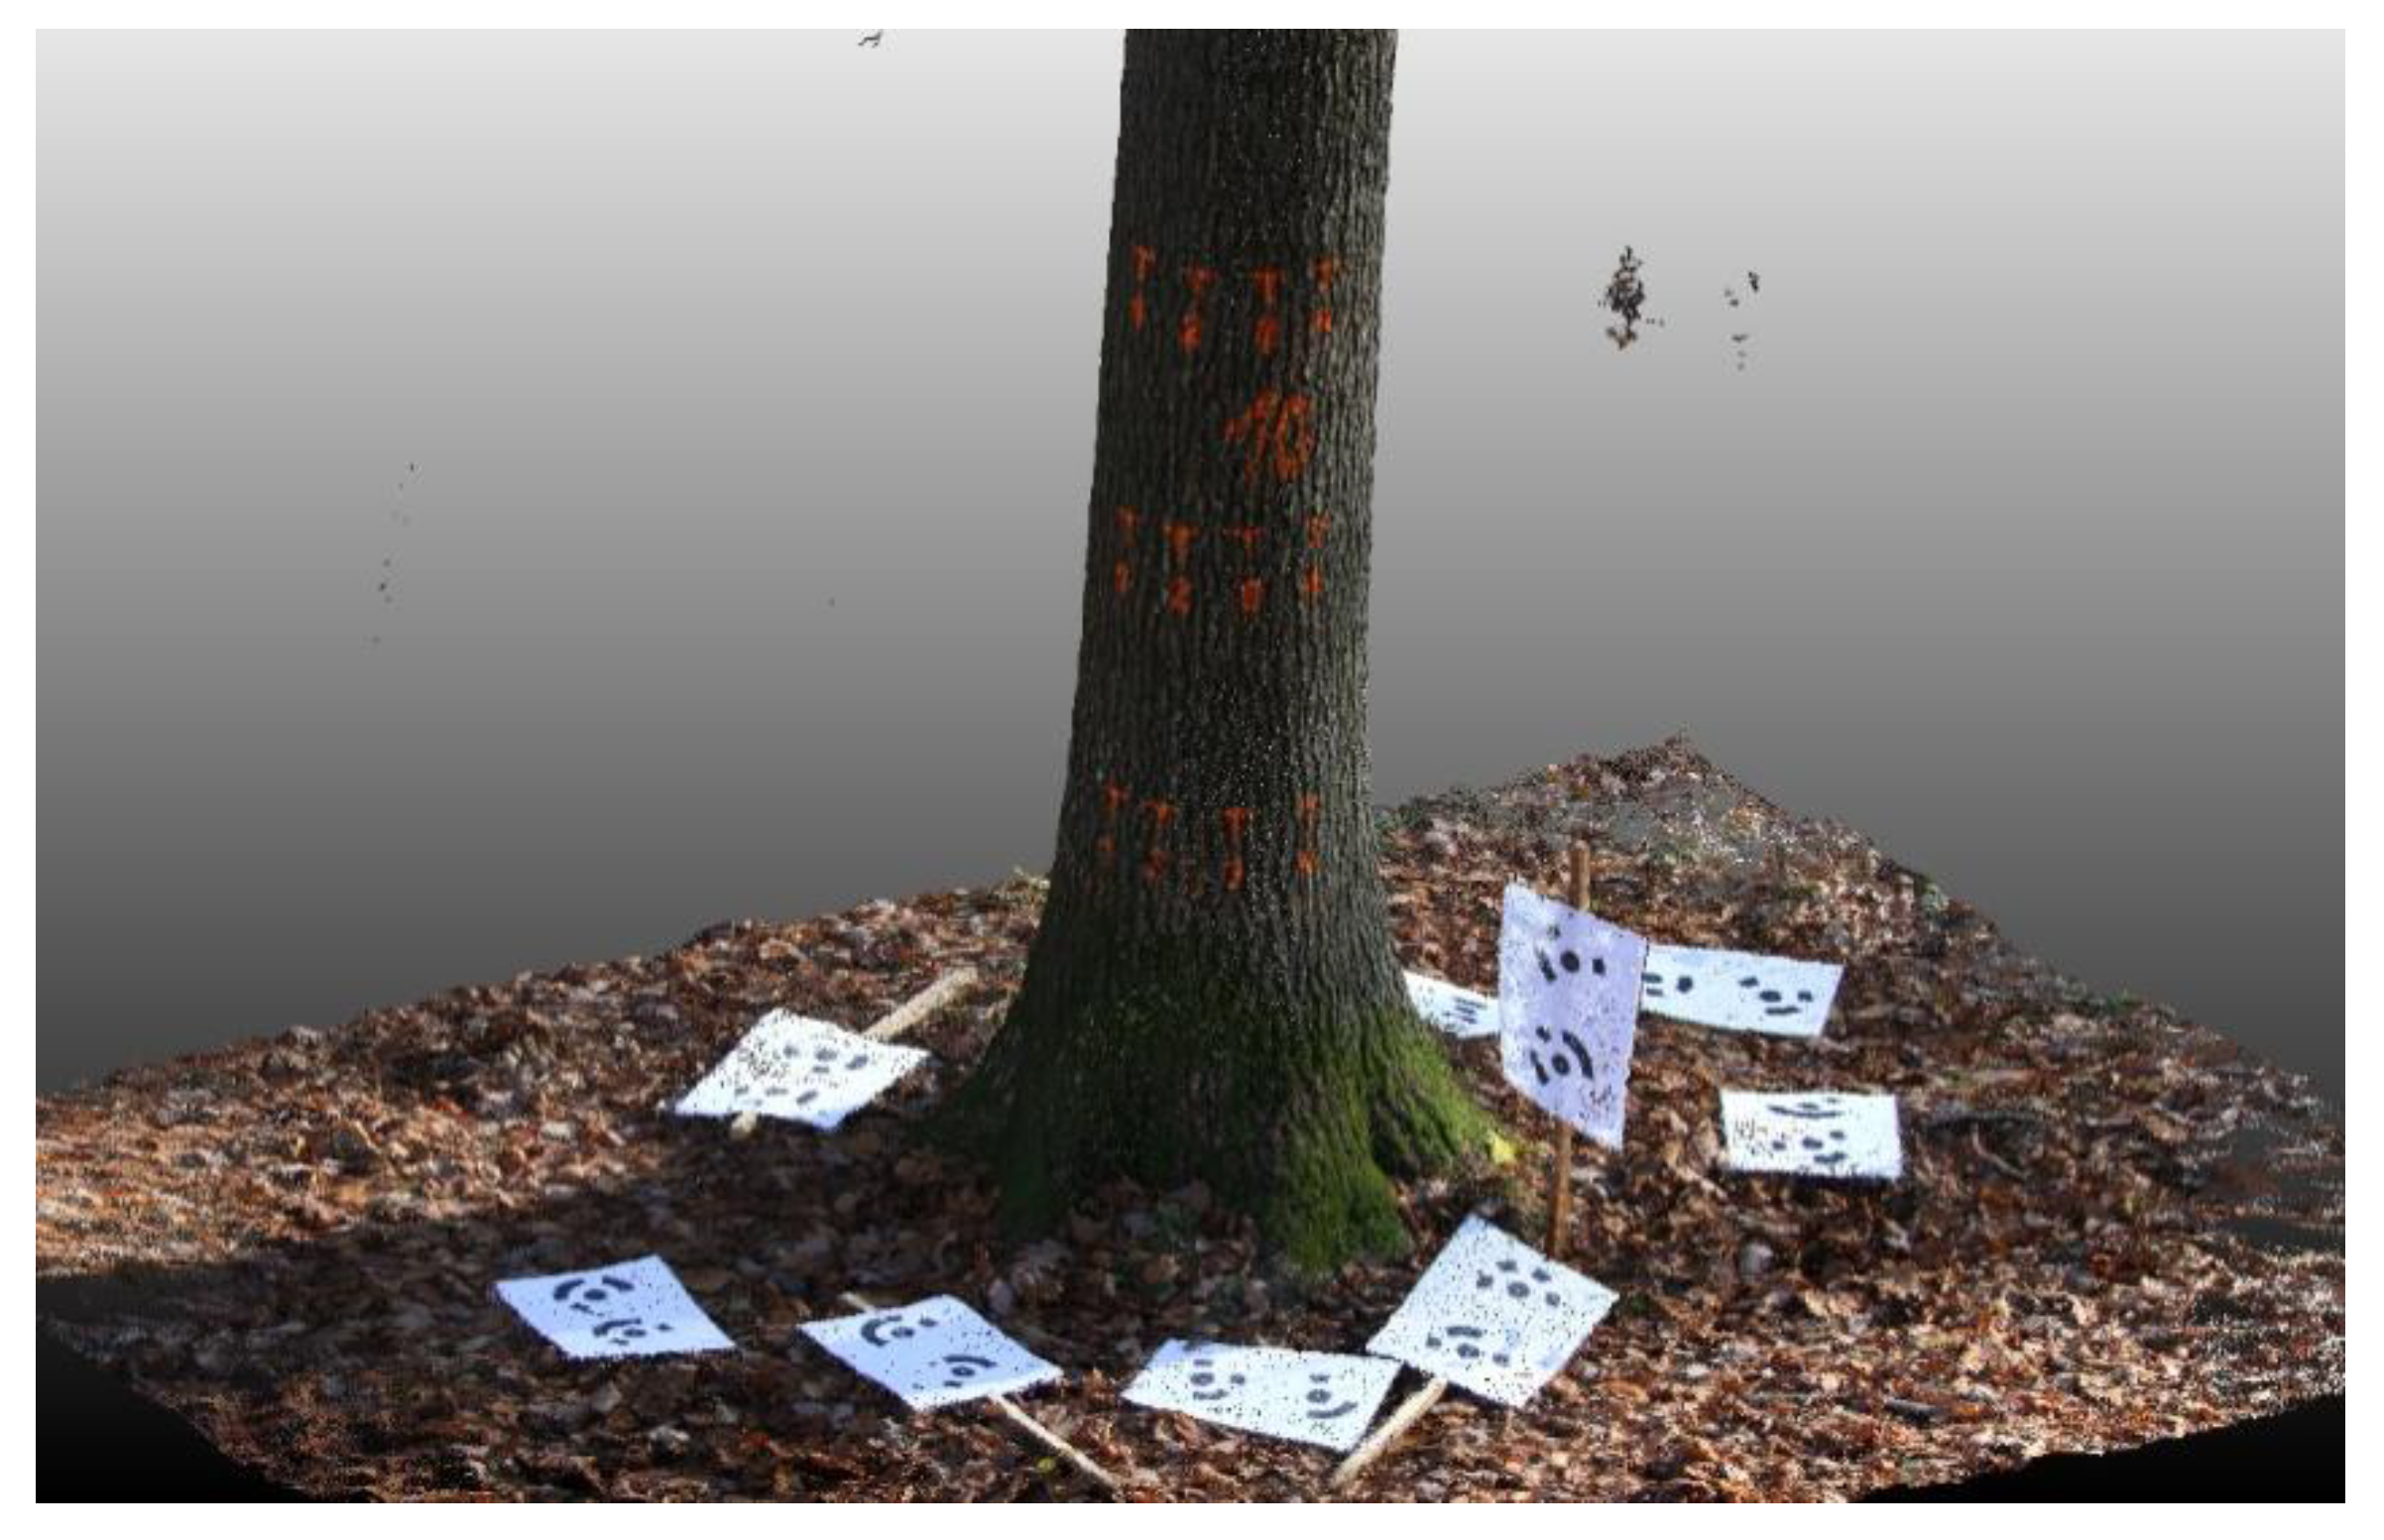
Before the image acquisition, eight A4 papers formatted with 8-bit markers (two on each paper) were placed on the ground, and one was mounted on the reference stick. The reference stick was placed near the trunk (<1 m distance). These markers were used for the scaling and orientation of the point clouds. Altogether, we used nine such papers. For scaling purposes, only one was required. We used multiple papers for verifying the accuracy. The accuracy achieved was under 1 mm in almost all cases. Each tree was captured twice using the non-fisheye lens and subsequently by the fisheye lens. The distance from the tree was maintained at 3 m. The path was a circle around the tree for both lenses. The images were captured in the static position of the operator, and the distance between the positions was approximately 1 m. Two images per position were captured when the non-fisheye lens was used to include the ground and the highest section (1.8 m). When the fisheye lens was used, only one image was required to capture the ground and the highest section. The average number of positions was 35. The average time to collect the images was 4 min for the non-fisheye lens and 2 min for the fisheye lens.
2.4. Data Processing
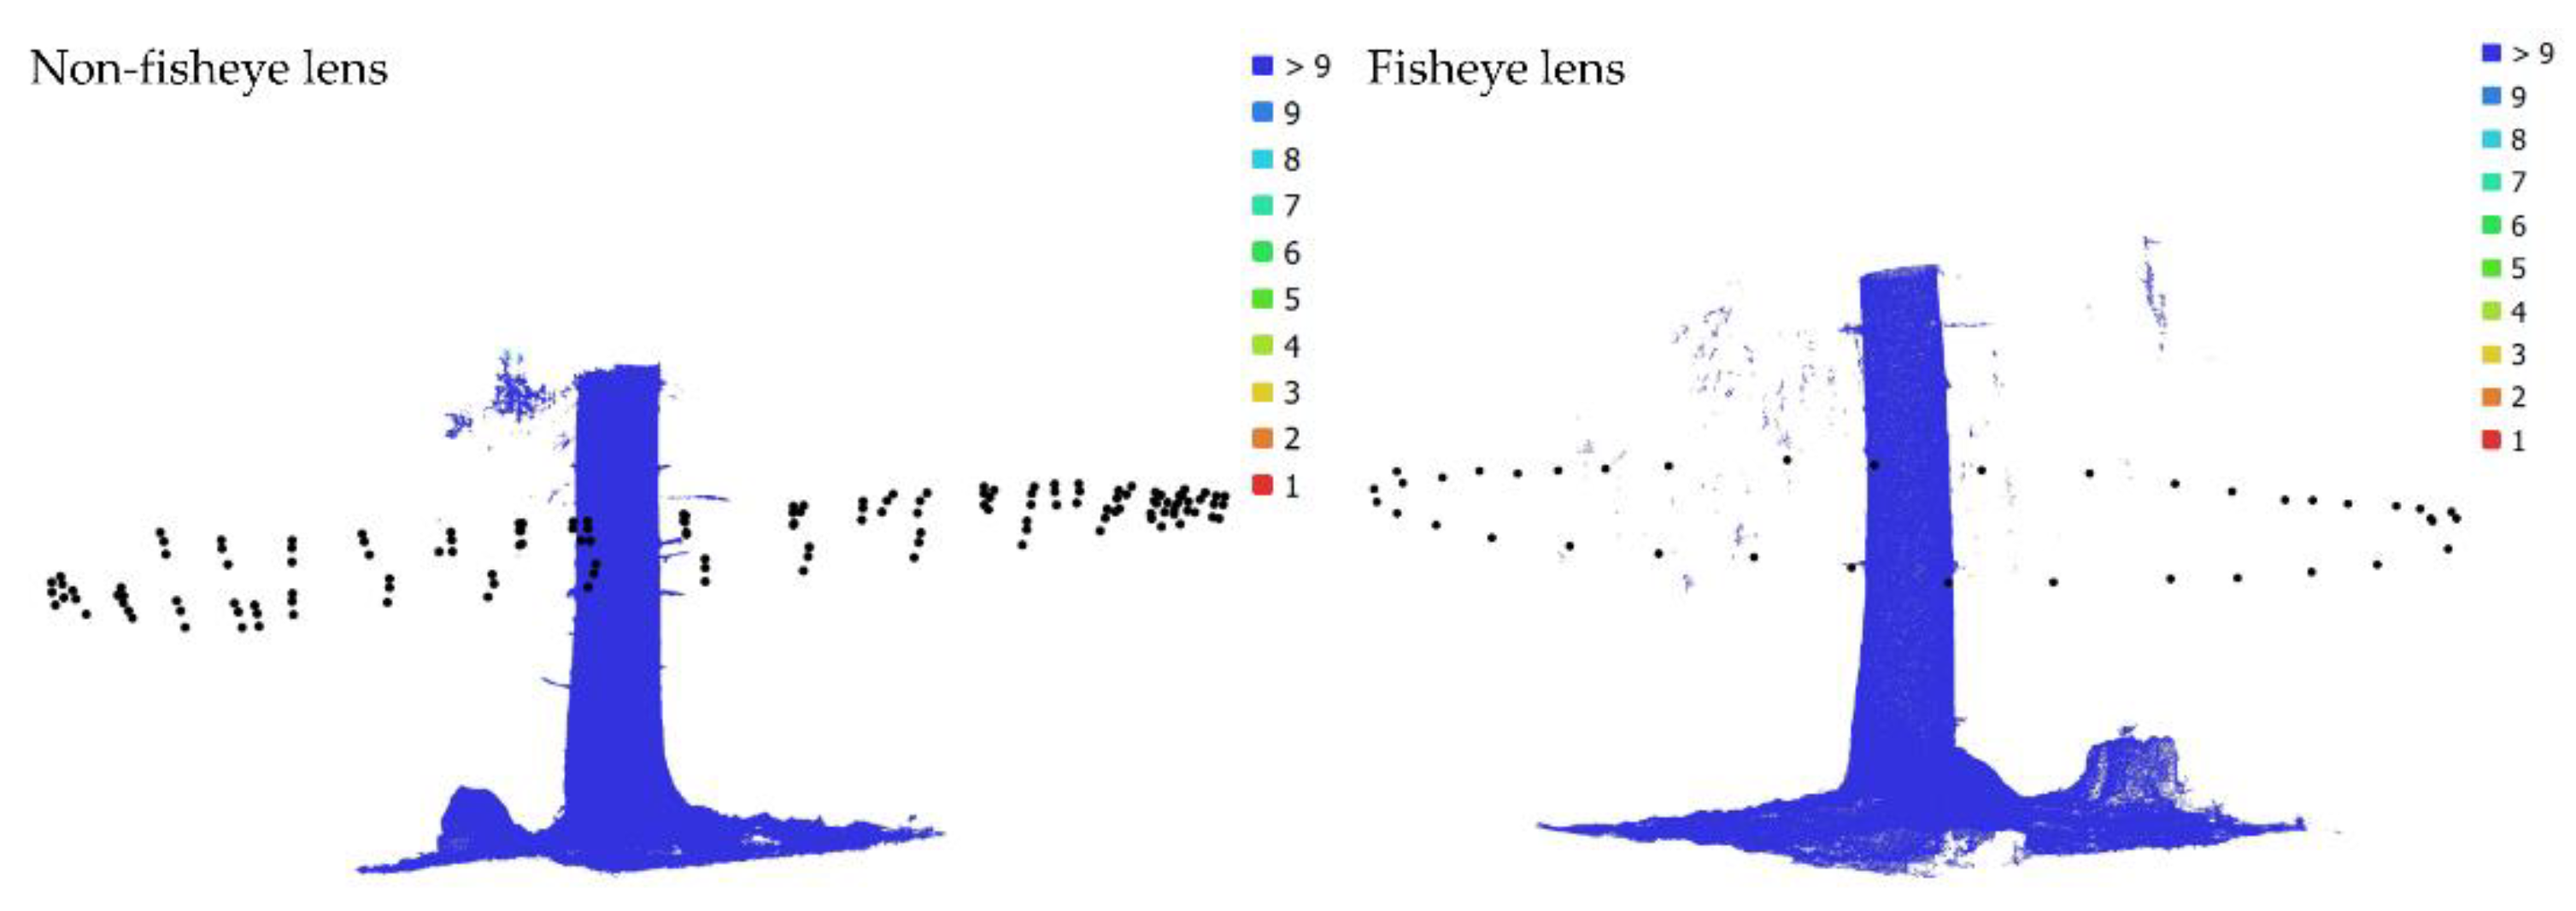
Images were processed into scaled and oriented point clouds using Agisoft PhotoScan Professional 1.2.6 software (Agisoft LCC, St. Petersburg, Russia). The images were separated into non-fisheye and fisheye. The images were subsequently split into groups. Each grouping corresponded to one individual tree. Subsequently, the images were aligned with automatic camera calibration. When the non-fisheye lens was used, the “frame” camera type was chosen; for the fisheye lens, the “fisheye” camera type was chosen within the calibration options in Agisoft PhotoScan Professional. For all trees, reports were generated. In the reports is information about camera calibration, image overlap, scaling error, etc. Reports are available as
Supplementary Materials. An example of the image overlap and camera locations is shown in
Figure 3.
Thereafter, we used an option where each image was compared to all other images within the grouping in full resolution with high accuracy, after the alignment markers were detected automatically. Each A4 paper contained two markers that were used for scaling. First, we paired the markers that shared the A4 paper and subsequently set a scale (
Figure 4). The distance between the centers of the markers was 14.2 cm. The orientation of the
Z axis was set by the markers placed on the reference stick. Subsequently, we generated the dense point cloud and exported the point cloud to the .txt format for further processing.
First, the trunk cross-sections at 0.8 m, 1.3 m, and 1.8 m on the tree trunk were extracted from the point clouds. DendroCloud software was used for this task [
20,
21]. To cut the cross-sections at different height levels, a digital elevation model (DEM) was generated. We set 0.5 as the grid size where the minimum Z value was assigned from the point cloud. Based on the DEM cross-section at 1.3 m, it was sliced with a 2 cm thickness. The points within the cross-section were grouped spatially, and a circle fitting algorithm was used to calculate the initial diameter and position of the tree. We used the Monte Carlo method with the automatic initial method. More information about the algorithm is reported in [
20]. The normalized DEM was calculated based on the position and diameter, and multiple cross-sections at the desired heights were generated. Subsequently, the points in each height were grouped spatially. Each tree contained three grouped cross-sections (0.8 m, 1.3 m, and 1.8 m) for the non-fisheye lens and fisheye lens. The results were exported to the .csv format and subsequently imported to ArcGIS for Desktop software 10.2 (Environmental Systems Research Institute (ESRI), Redlands, CA, USA). Within ArcGIS for Desktop, the convex hull algorithm was applied by the Minimum Bounding Geometry module. Altogether, 240 perimeters were calculated.
The calculated perimeter values were exported by the ArcGIS for Desktop software in a *.txt file, where the name consisted of the following identifiers: tree species with its number, lens type, and height of the tree referred by the calculated perimeter. The file itself contained the value of the calculated perimeter. We created a script in the Python programming language, version 2.7 (Python Software Foundation, Beaverton, OR, USA), to perform the automated acquisition of the above-mentioned parameters from the file name along with the calculated value of the perimeter as a record for each *.txt file. After processing all files, the script saved the array of records (dataset) into the database for further analysis.
To compare the diameters measured using the caliper, we used the position of the markers that were sprayed on the trunks. In Agisoft PhotoScan Professional, these markers were identified as control points. These markers indicated the position where the diameter was measured. Subsequently, the points were exported to ArcGIS for Desktop. Together with points from the cross-section, we measured the diameter in the same position and direction as in the field using the caliper for each tree and cross-section. The entire workflow is shown in
Figure 5.
2.5. Data Evaluation
The estimation error was calculated as the difference between the reference measurement and the estimation from the point cloud. The root mean square error (RMSE) (1) of the diameter and perimeter estimation was also calculated. The error and RMSE were calculated for the estimations from the point clouds generated from both lenses that were used:
where
Ri represents the reference diameter or perimeter.
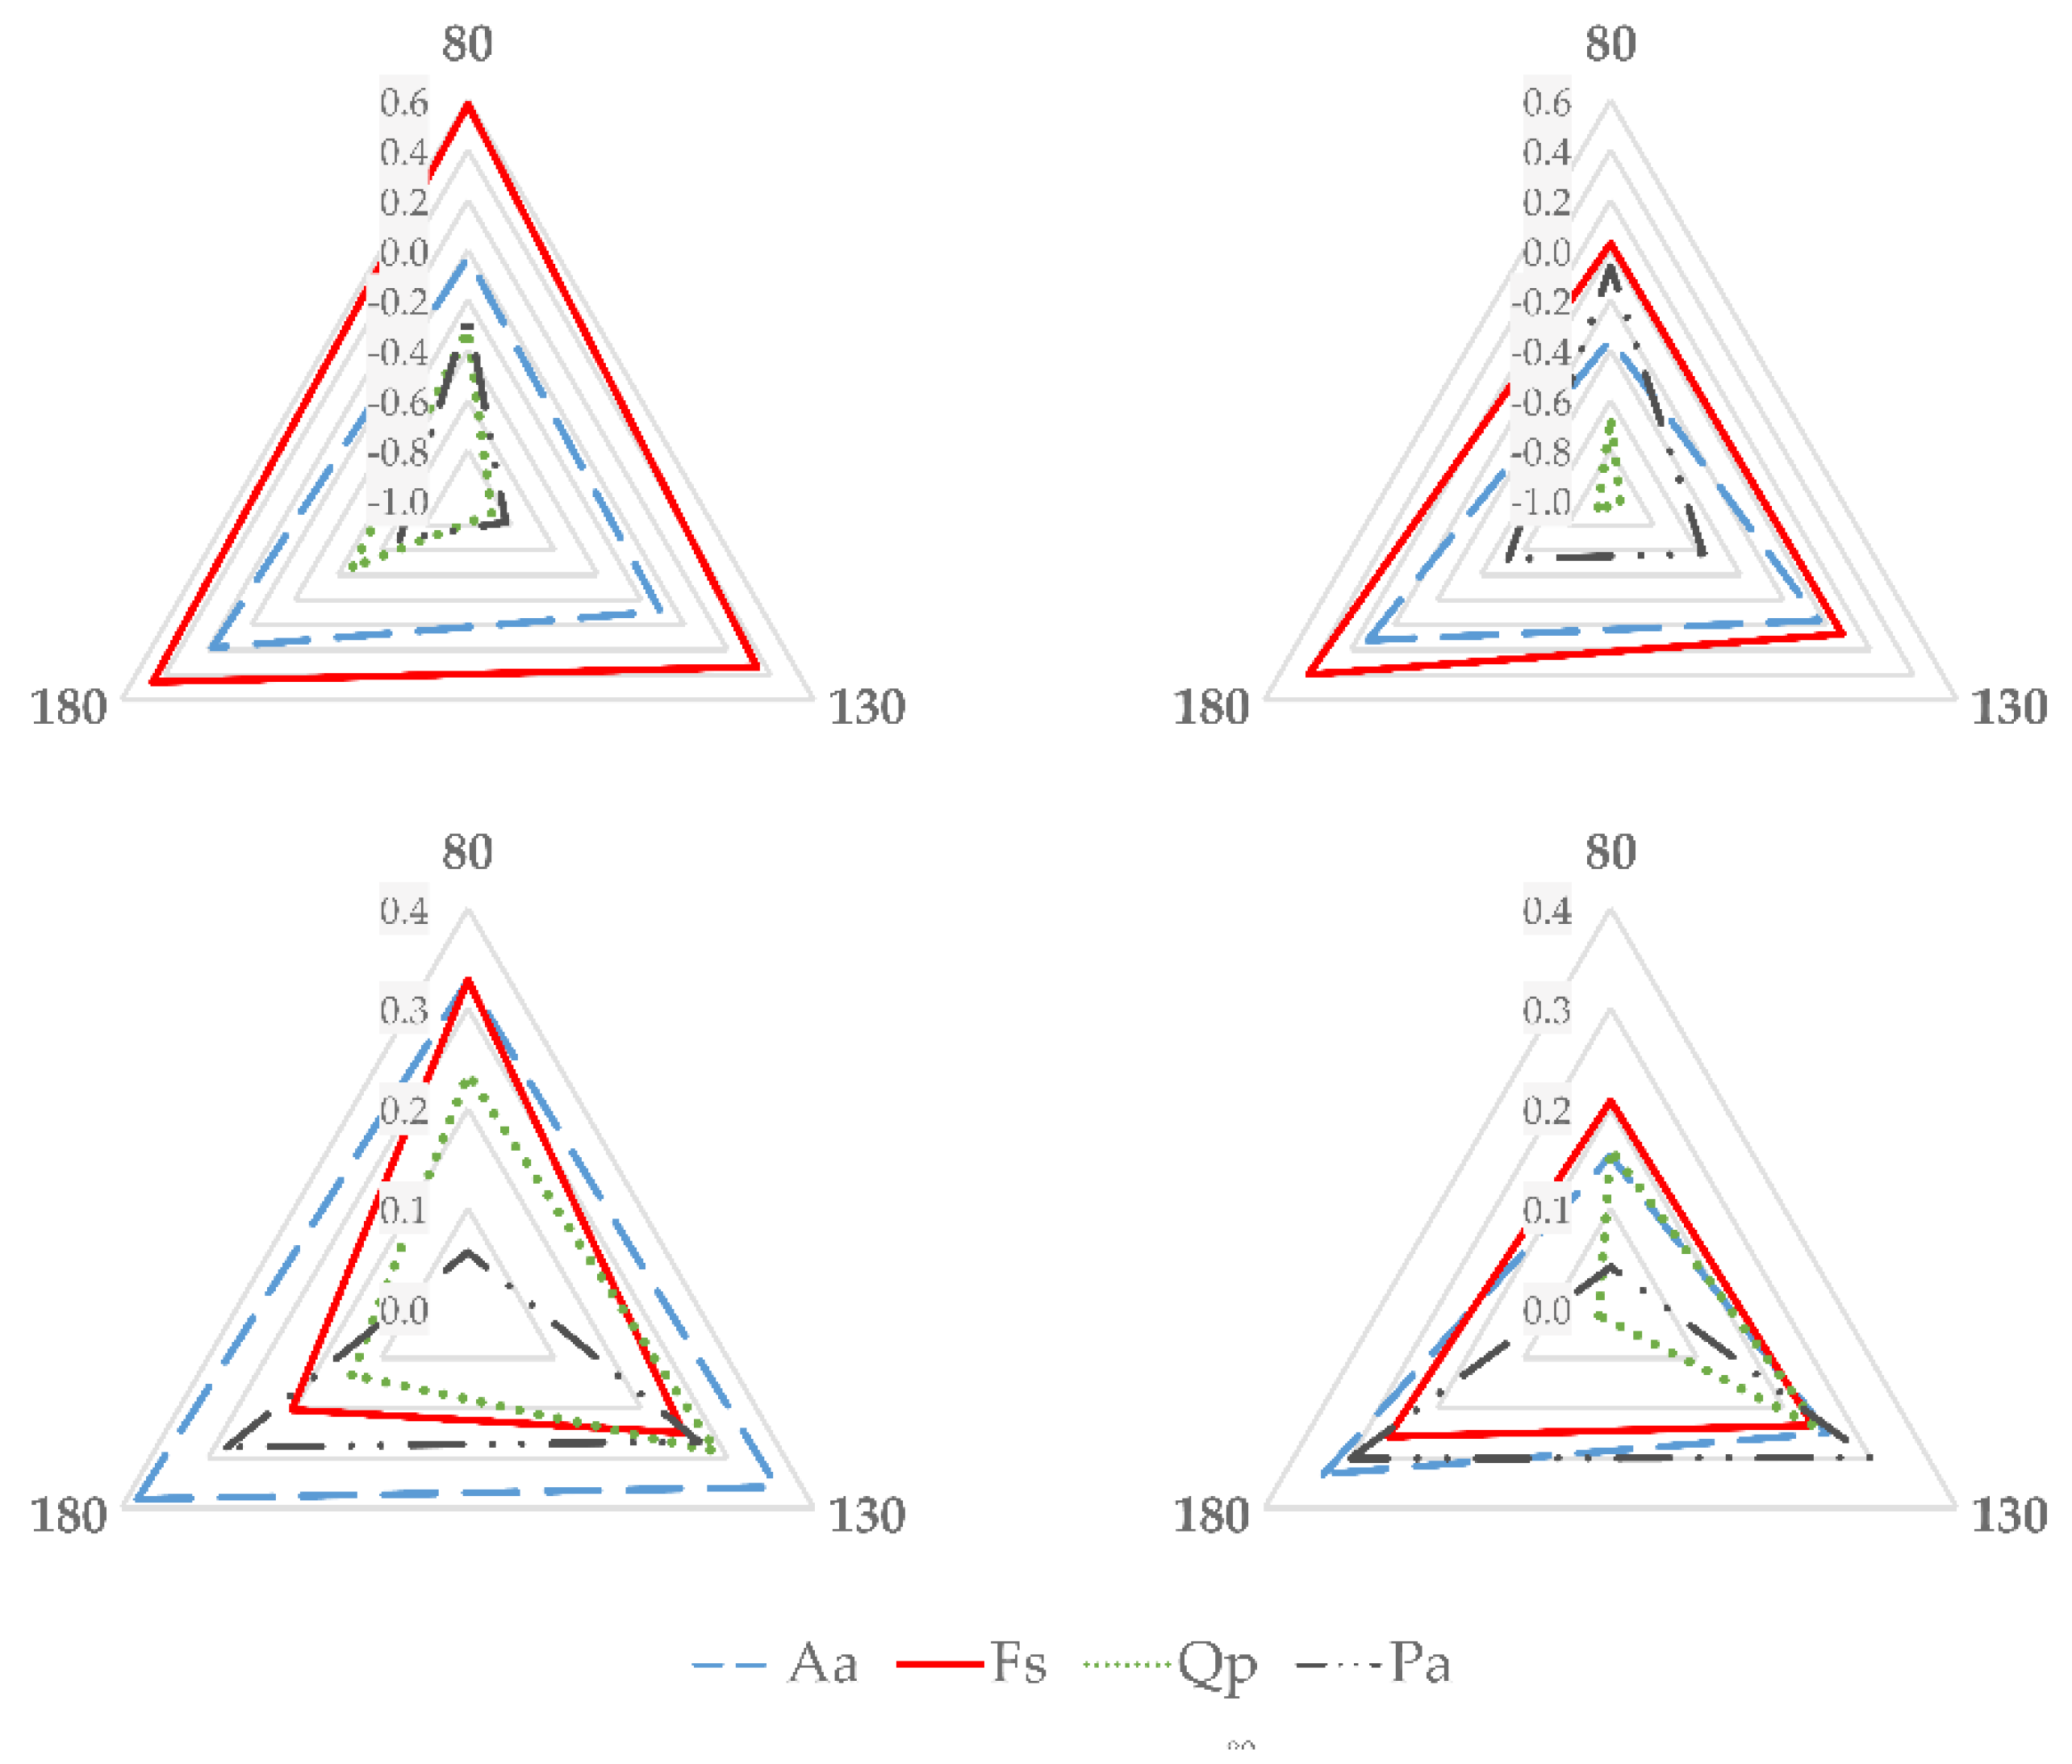
Furthermore, the factorial analysis of variance (ANOVA) was performed to detect the effects of lens, tree species, and height of measurements (0.8, 1.3, 1.8) on the estimation error. The factorial ANOVA was used separately for the perimeters and diameters. Additionally, the datasets for the perimeters and diameters were separated based on the type of lens, and factorial ANOVA was used again on these datasets.
4. Discussion
Research on the application of photogrammetry (both terrestrial and airborne) in forestry has increased after the invention of the structure-from-motion (SfM) and multi-view stereo (MVS) techniques, which are closely related to computer vision and learning [
14,
18]. Forests are measured photogrammetrically at the stand [
1], plot [
15,
17], and tree levels [
10,
18]. Our study provides the results of the 3D capture and reconstruction of individual trees that can potentially be applied towards quality and quantity estimations [
22], the creation of high-precision tree models for growth models and simulations [
23], etc. In addition to SfM and MVS, other photographic methods have been reported to be applicable in the evaluation of spatial relations in forests. For example, Dick et al. [
24] used 360° panoramic images to measure forest stands using a relation between a known focal length and partially measured field data. Hapca et al. [
25] used two converging digital images to reconstruct standing trees up to a height of 12 m.
The accuracy of the photogrammetric 3D reconstruction of trees has already been studied widely, where the DBH is the most frequently estimated parameter. For the DBH of 20 specimens of
Cryptomeria japonica, Surový et al. [
10] reported an RMSE of 0.59 cm with an SD of 0.72 cm, thus achieving sub-centimeter accuracy as reported in the current study. According to ANOVA, the tree species affected the accuracy significantly; however, these differences were only in the millimeter scale. Liang et al. [
15] reported a DBH RMSE of 2.39 cm; however, the data acquisition was plotted based on a 30 m × 30 m rectangular plot. In another study [
26], an average DBH error of 1.15 cm was reported for 500 m
2 circular plots.
For a fisheye camera, Berveglieri et al. [
16] reported an average DBH error of 1.46 cm with a standard deviation of 1.09 cm for a small forest plot consisting of seven trees. They considered these results comparable with manual measurements and values generated from laser scanning. Rodríguez-García et al. [
27] studied an application of stereoscopic hemispherical fisheye images and achieved a DBH RMSE of 1.51 cm. Fisheye lenses allow for the coverage of a large area, thereby requiring a lesser number of images. However, their imaging geometry causes large variations in scale, and must be addressed using proper calibration. Some authors [
28,
29,
30] described this calibration process. For example, Berveglieri et al. [
16] calibrated a fisheye camera in a terrestrial calibration field composed of coded targets. Our results indicate that, currently, even the “on-the-job” calibration in specialized software can provide results comparable with non-wide-angle cameras. Furthermore, the reprojection errors (
Supplementary Materials) ranged from 0.70 pix. to 0.95 pix. for non-fisheye lens and from 0.42 pix. to 0.57 pix. for fisheye lens (
Table 5). “Reprojection error is the distance between the point on the image where a reconstructed 3D point can be projected and the original projection of that 3D point detected on the photo and used as a basis for the 3D point reconstruction procedure” [
31]. Reprojection errors of fisheye lens are lower for each tree species. Reader should consider that the impact of the automatic camera calibration was not investigated.
In the present study, diameters and perimeters were tested at three heights up to 1.8 m. However, measurements of longer sections of the stem are often required. Bauwens et al. [
7] conducted a research where tropical, irregularly shaped trees with massive buttresses were reconstructed up to 12 m in height with an RMSE under 5%. In terms of error variability with increasing height, Surový et al. [
10] observed an increased variability in reconstruction errors only on the lowest part of the stem, 10 cm above ground. This likely demonstrates an advantage of the current CRP methods, as a higher error with increasing height was reported for older photogrammetric methods [
25].
Laser scanning methods might still be more precise and less laborious, but the high price of the devices is restrictive with respect to a wider application [
10]. In addition, if only basic parameters (e.g., tree position and DBH) are required, these can be measured quickly using simple equipment (compass, rangefinder, caliper). The applicability of “classical” methods is also confirmed in our study where references for both perimeters and diameters were measured with a variability of less than one centimeter. The advantage of point cloud applications is related to the estimation of advanced attributes such as the stem curve and stem quality [
15].
As suggested by the afore-mentioned studies, the accuracy of the current CRP methods is high, and fully applicable for the most typical tasks related to the trees’ dimensions. Although the computational power of the current computers is extremely high, photogrammetrical processing can be highly time-consuming, as it can potentially continue for days. A photogrammetric assessment of the inevitable data required could be crucial for the optimization of the whole process. Miller et al. [
18] measured small trees using 150–180 photos per tree. Surový et al. [
10] reported a crucial shift in accuracy for five to eight cameras simultaneously based on the same point. With more than eight cameras, the accuracy did not increase. To reconstruct the stem, 40 photos were captured. This corresponds with our study, where 40 images captured by the fisheye lens were used. The number of necessary images captured using the standard lens was approximately two times higher. The distance between the operator and the tree must also be considered. Bauwens et al. [
7] processed the photographs of large tropical trees captured with the focal length of 25 mm; however, the processing of images captured with focal lengths of 35 mm and 50 mm failed. This was likely caused by the small distance between the operator and the tree that led to images with almost the same area and texture as those of the tree. The distance could also be crucial for accuracy. James and Robson [
14] suggested a ratio of 1:1000 for the accuracy and distance; however, further testing is required. In our case, the DBH RMSEs ranged from ~4 to ~7 mm at a distance of 3 m. The accuracy could have been influenced by the artificial signs on and around the stems, which could facilitate photo alignment.

 ,
, 


