1. Introduction
One of the biggest challenges facing conservation biologists and ecologists is the development of a knowledge base that is sufficient to make cogent management decisions in protecting threatened species. Often, expert opinion is used to address the key question: What comprises suitable habitat for key species and how large an area is necessary? Such opinion, and even modeling, tends to support what is commonly known but does not always capture needed spatial composition. For example, the ideal habitat of the San Joaquin Kit Fox (
Vulpes macrotis mutica) is a grassy plain that has not been plowed or cultivated and tends to avoid riparian areas. Conventional wisdom suggests that they would avoid urban areas as they would end up as road kill [
1,
2,
3,
4,
5]. However, the kit fox has recently been found in sizable numbers living in urban areas [
6], including the town of Bakersfield, CA—burrowing under portable school buildings, hunting on school grounds and even eating the leftovers from McDonald’s and other fast food restaurants [
7]. One might then ask oneself, “What is wrong with this picture?” The Kit Fox is doing what expert opinion had once thought impossible: living in an urban area. However, upon a closer look at school grounds, one can see habitat elements that were less understood, but are now brought into better focus. There are large open grassy spaces, protected den areas under portable classrooms, food sources such as mice, squirrels, etc. within easy reach, and quiet school grounds at night. Thus, some of the key habitat elements exist in an urban area for the Kit Fox.
How a species uses or avoids a landscape is dependent upon the distribution and spatial configuration of habitat elements within it. Significant habitat elements are typically ascertained based upon a species recurrent use of a landscape feature, usually constructed as a landscape classification. For instance, if a species is found to den in large trees with cavities such as the fisher (
Pekania pennanti; formerly
Martes pennanti [
8]), and trees with cavities tend to be in forest classes consisting of mature to late-seral forest [
9], there is a tendency to include this classification (mature to late-seral stands) as the requisite for habitat, rather than understanding the needed distribution of such structures. This is partly due to the fact that large trees with cavities (structure trees) are certain to exist in mature forest classes. However, a scattering of older structure trees with cavities over a more heterogeneous landscape containing younger stands on the average could be just as suitable as those that are homogeneous and old. Thus, broad habitat characterizations by experts should be tested in a manner for which habitat significance may be assessed [
10]. Understanding that mature to late seral stand elements are necessary, has significant implications for forest management (for example, thinning and removing fuels for promoting fire resilience [
11]).
This paper proposes a statistical framework to identify significant structural components (like large trees) and their distribution within the landscape to help support such management implications. An evaluation procedure, which we call k-Max-l, is developed in conjunction with the well-known Kolmogorov-Smirnov significance test as an indicator function to evaluate habitat element distribution across several spatial scales. We apply this approach as a means to better characterize the needs of female fishers during the spring to early summer denning season, a critical time for successful reproduction. In the next section we describe our study area, the fisher, and the three spatial scales of analysis.
4. Discussion
We must first acknowledge that our study area contains a relatively small number of fishers, having only five females tracked over a two-year time span, although our data set contains almost two times the number of den sites as the recent study of Zhao et al. [
17]. However, measured den locations and tree sizes in our study area are similar to tree sizes reported in other fisher studies. The results have clearly shown that highly detailed plot data in conjunction with radio-telemetry and other observational data can be used to better understand habitat composition. In this case, habitat that would generally be considered poor using existing models can be shown to contain important distributional compositions using the
k-Max-
l technique. By utilizing a common analysis unit, the Neighborhood Cluster (NC), a more complete picture emerges with regard to forest habitat use. This technique demonstrates that there is a significant selection by females for those NCs that contain at least a few plots with large trees, even when the landscape is not a continuous canopy covered mature to late seral forest. The fact that most NCs contain at least 2 plots that have few trees suggest that numerous open areas exist even within the neighborhoods chosen by females for denning. Zhao et al. [
17] concluded that, “denning structures were associated with forested areas with relatively high canopy cover, large trees, and high levels of vertical structural diversity.” Although it is true that a den site is often surrounded by large trees (based upon a special inventory conducted around each den tree) and perhaps vertical structural diversity, such den sites may not be surrounded by forested stands of high canopy closure within the context of the broader forest area. This is something that Zhao et al. [
17] did not address, and that this paper does—how to evaluate a broader area with regard to identifying significant habitat within the broad landscape.
The results help to support the notion that an infrequent inventory plot sampling (e.g., FIA plots of 1 per 2428 ha (6000 acres)) may not be sufficient in estimating or describing habitat suitability for a species like the fisher. It also supports the view that particular features within a matrix of general habitat can be more important, even when not spatially extensive. Within the context of the fisher, those portions of the forest that are older and contain larger trees are indeed significant components of fisher habitat, particularly for den use. Such structures are clearly important for their survival, in that they require such structures for reproduction. However, it is important to understand that large structures are simply not present over great spatial extents and that forest areas consisting of smaller trees with greater canopy openings often occur outside of the best three plots (l > 3) within most NCs. More importantly, it appears that many habitat components are only present in the top 6 levels, leaving the bottom 4 levels to be less than desirable (equivalent to an average of 6.475 ha (16 acres) out of 16.187 ha (40 acres)). This is an important finding, when attempting to define habitat suitability for the fisher. However, the spatial connectivity and clustering of these elements that are core elements of fisher habitat should be further studied. There are several points that need to be further addressed in this discussion.
First, it is important to address a short-coming of the approach related to significance testing with regard to computing the Zielinski RRHS [
14] score using plot data attributes. While the Zielinski RRHS score was found to be statistically significant at many levels, the significance may be somewhat misleading in levels that exceed 3 or 4. This is because at such levels the values of the measured attributes are often low, resulting in a low Zielinski score (a score that depicts something that may be avoided). Statistical significance at these levels can also be found when plots with low values of attributes are compared to plots with very low values of attributes, even when one would characterize all such plots as not supportive of the needs of the fisher with respect to dens and resting habitat. That is, comparing poor to very poor is not very informative. While the scores may be subtly different, it is still considered to be poor resting habitat. This suggests that an overall composite score of resting habitat may be less meaningful than considering the attributes themselves. Therefore, while these results are significant as computed using our significance test, they are not meaningful within the context of overall forest composition beyond levels 3 or 4. The major take-away from this is that on the average, stands and cover tend to be low for nearly half the landscape, even for areas close to den and resting sites.
Second, it is important to discuss the findings here with regard to other studies of the fisher, and highlight some of the important implications of this methodology applied at three important scales: comparison of den neighborhoods to a reference potential den neighborhood (den NCs compared to remaining forest NCs), home range components to other remaining potential home range components (home range NCs compared to remaining forest NCs), and how areas surrounding den sites differ from surrounding home range areas (den NCs compared to remaining home range NCs). As one might expect, several attributes of den NCs were significant as compared to NCs in the rest of the forest (
Table 2). Many of the attributes related to tree size such as maximum dbh of the largest conifer and the largest hardwood tree, basal area, and tree volume are significant measured at the ranked plot level,
l. Notable exceptions that were not significant at the
l = 1 level are quadratic mean diameter and the number of hardwood trees greater than or equal to 20.32 cm (8 inches). This indicates that the size distribution of trees, as measured by quadratic mean diameter, is the same as that which is distributed within the forest at the best level (
l = 1) in general. However, if one is looking at the largest trees found in den NCs, they are significantly different than what you would find in an average forest NC. That is, the larger hardwood and conifer trees within the forest are generally found in den NCs.
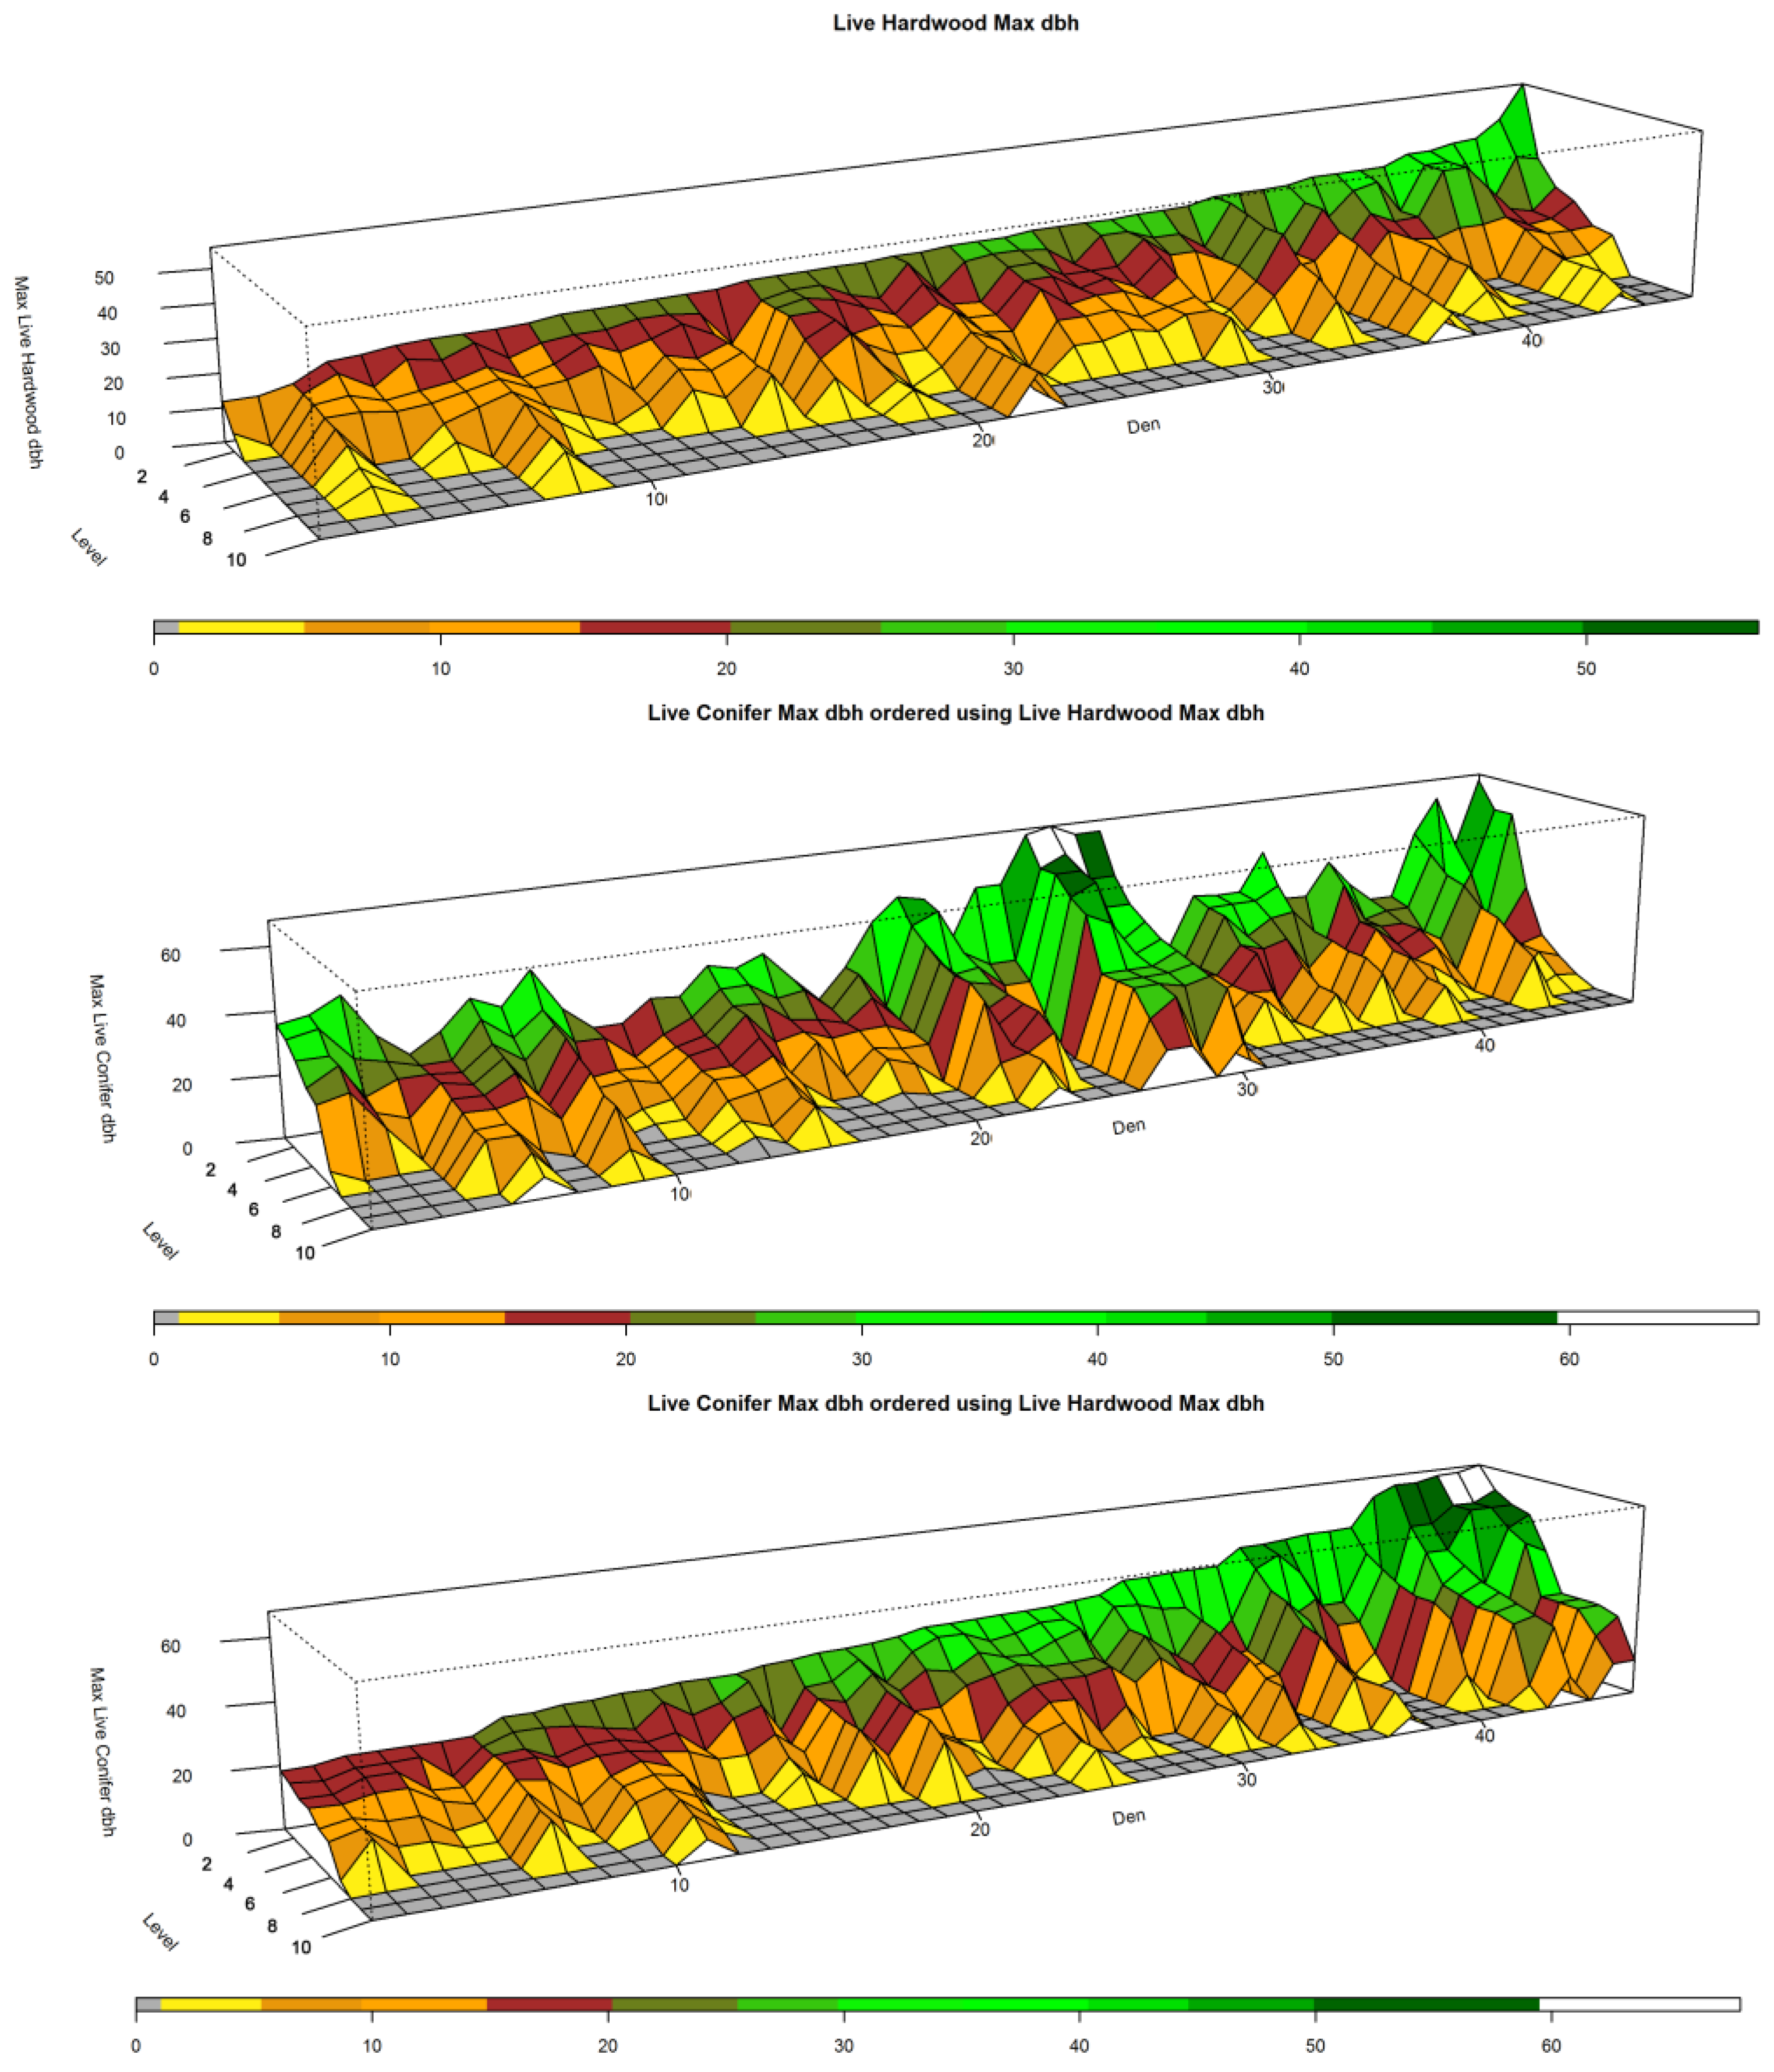
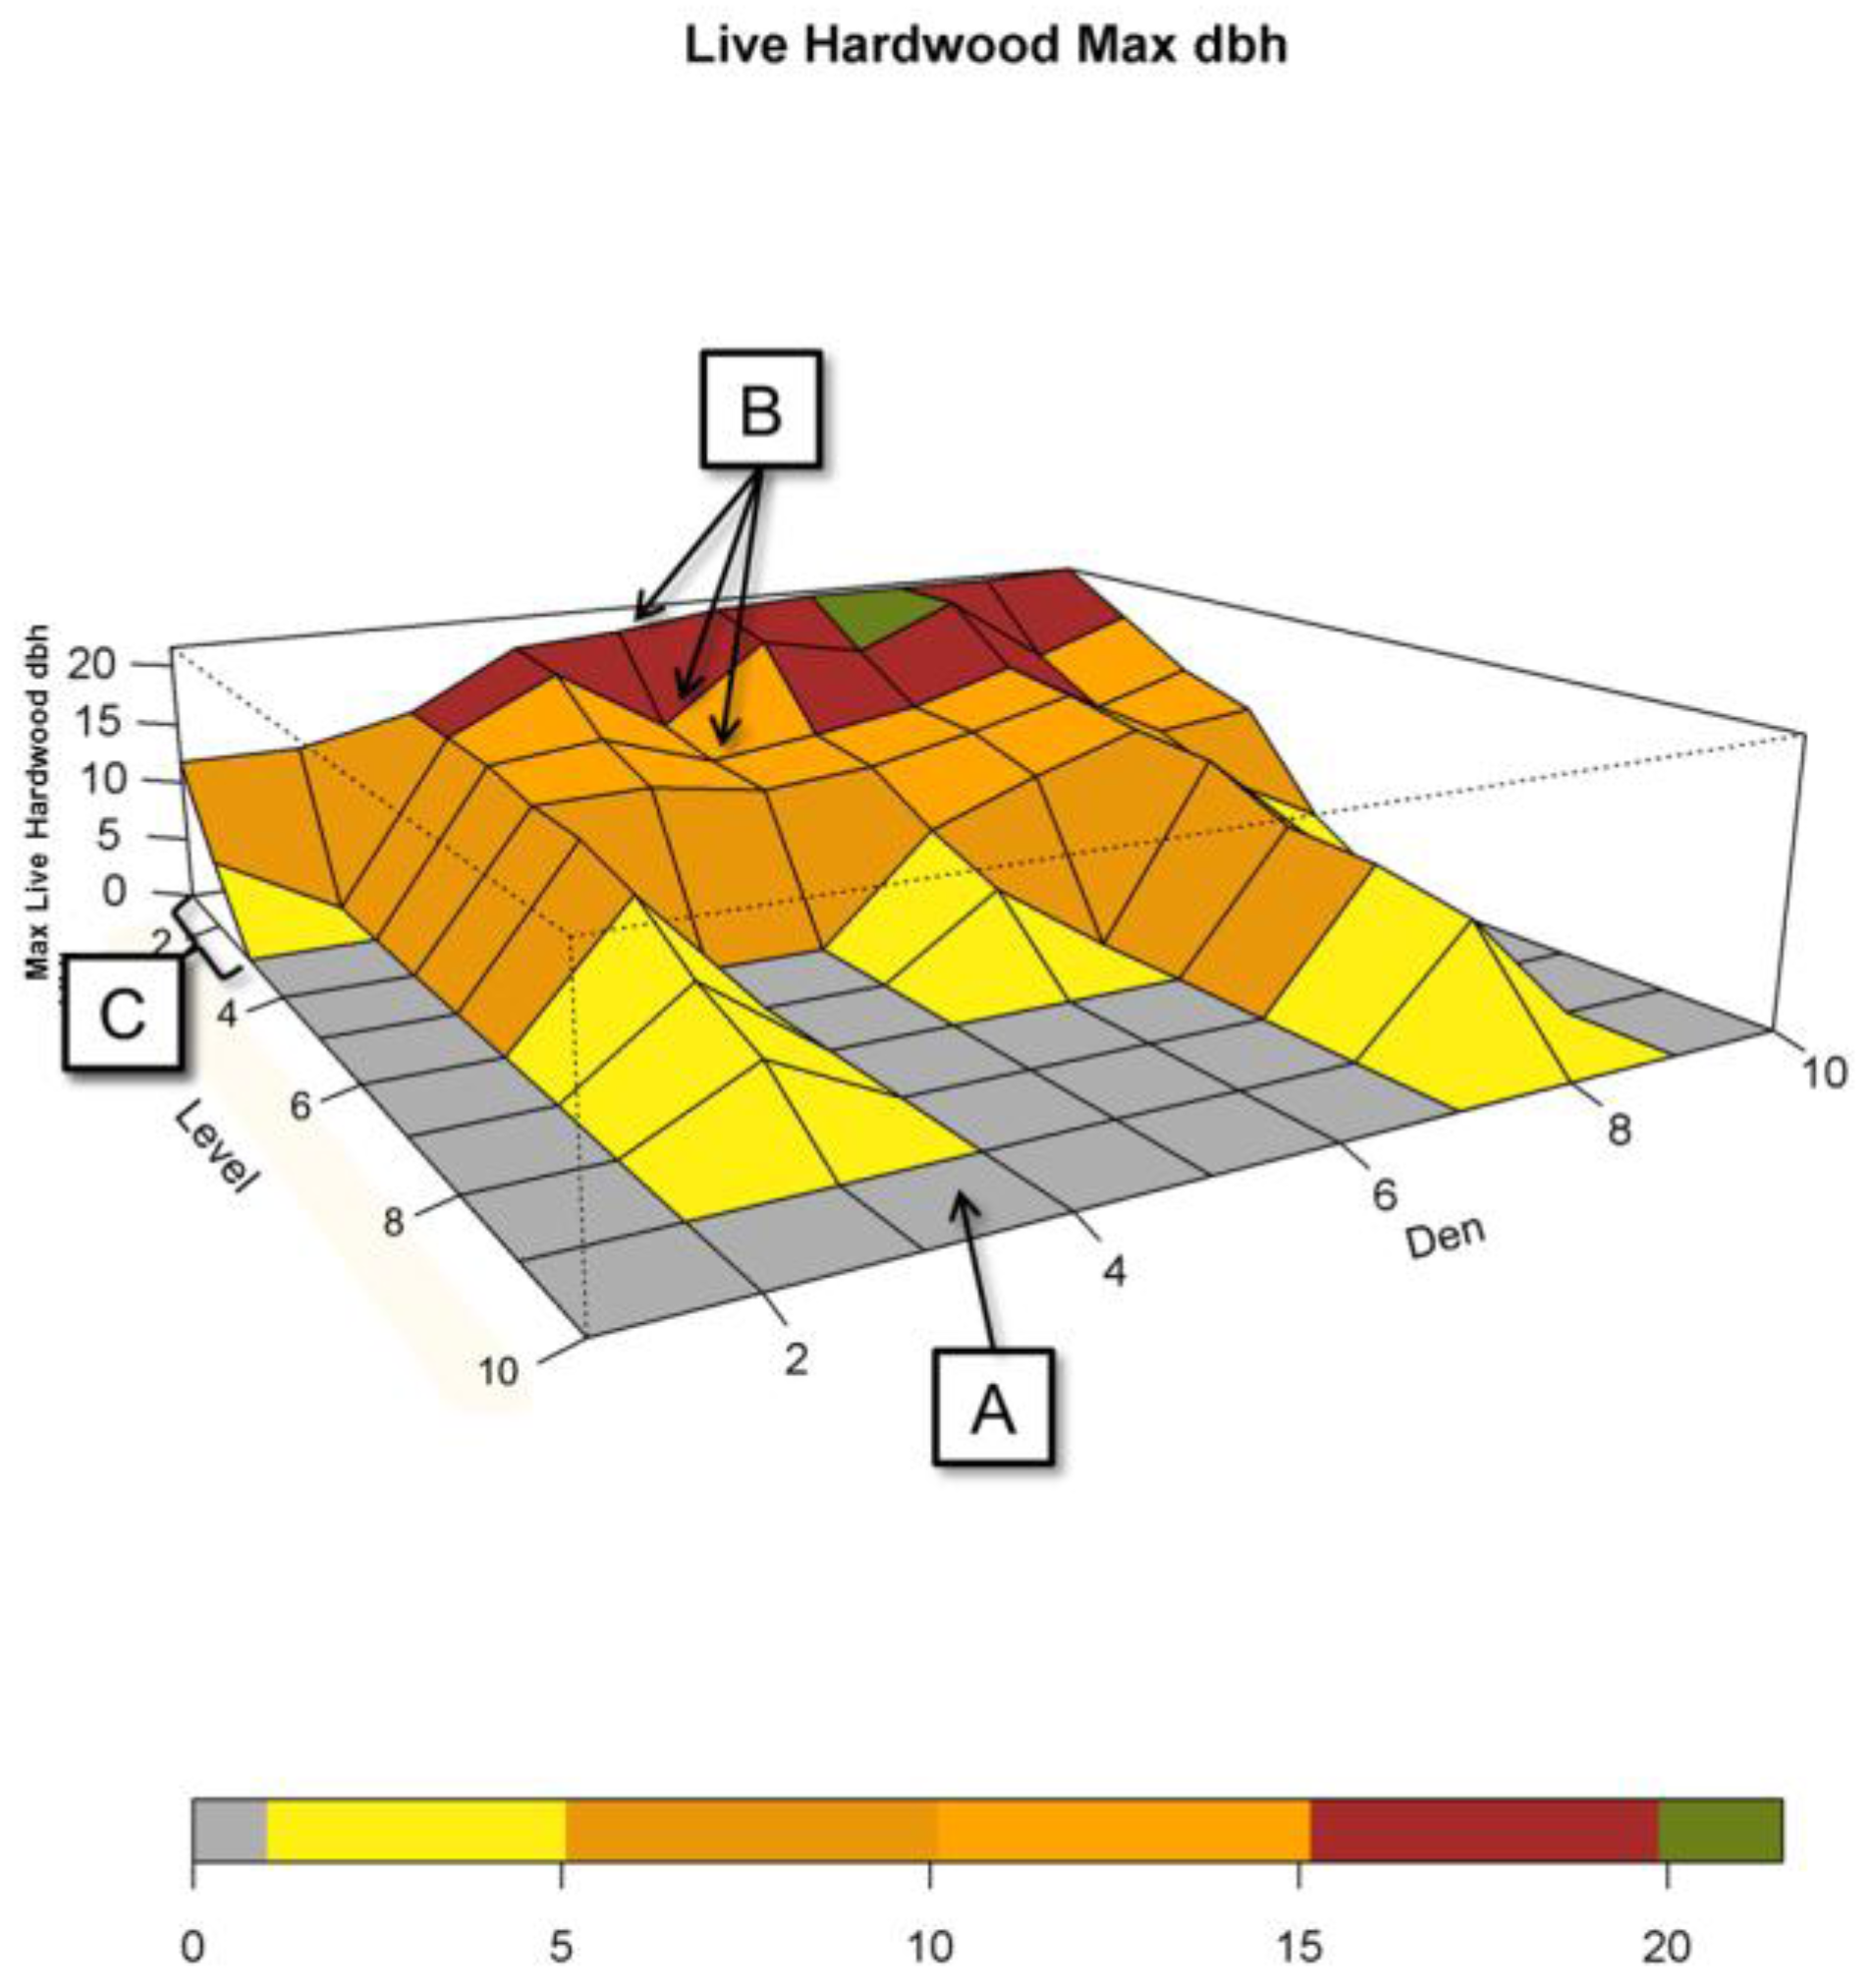
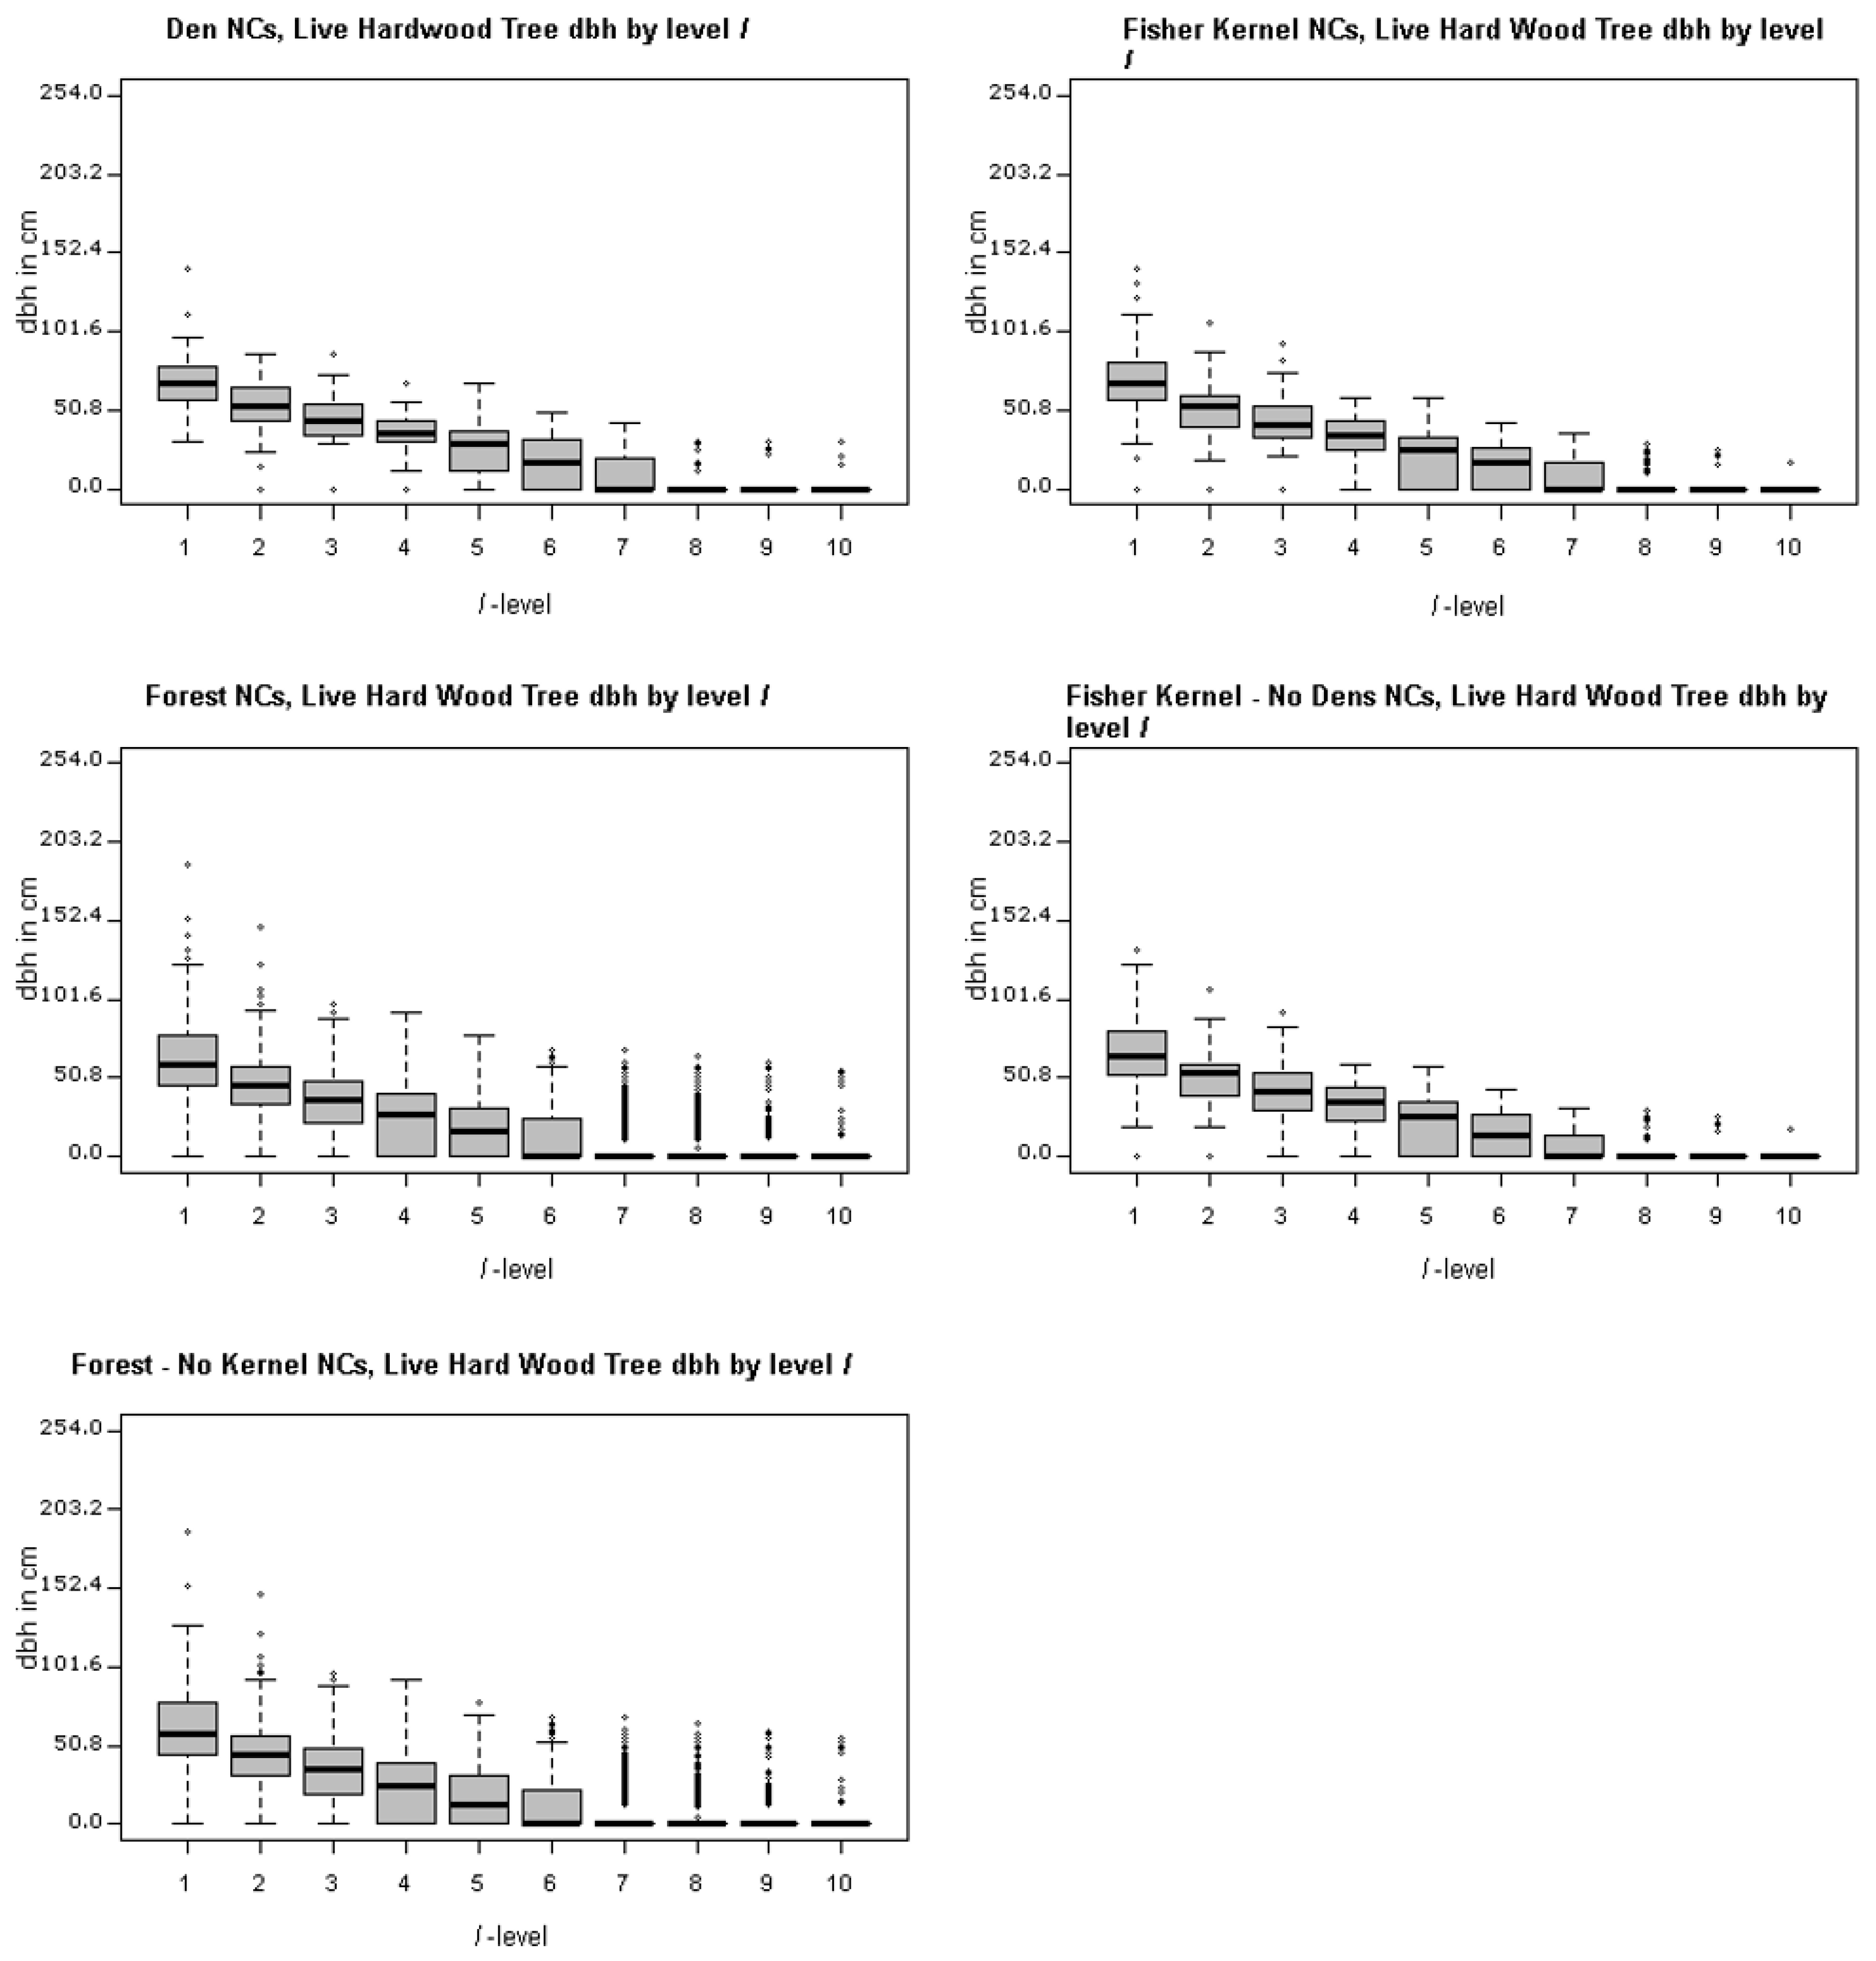
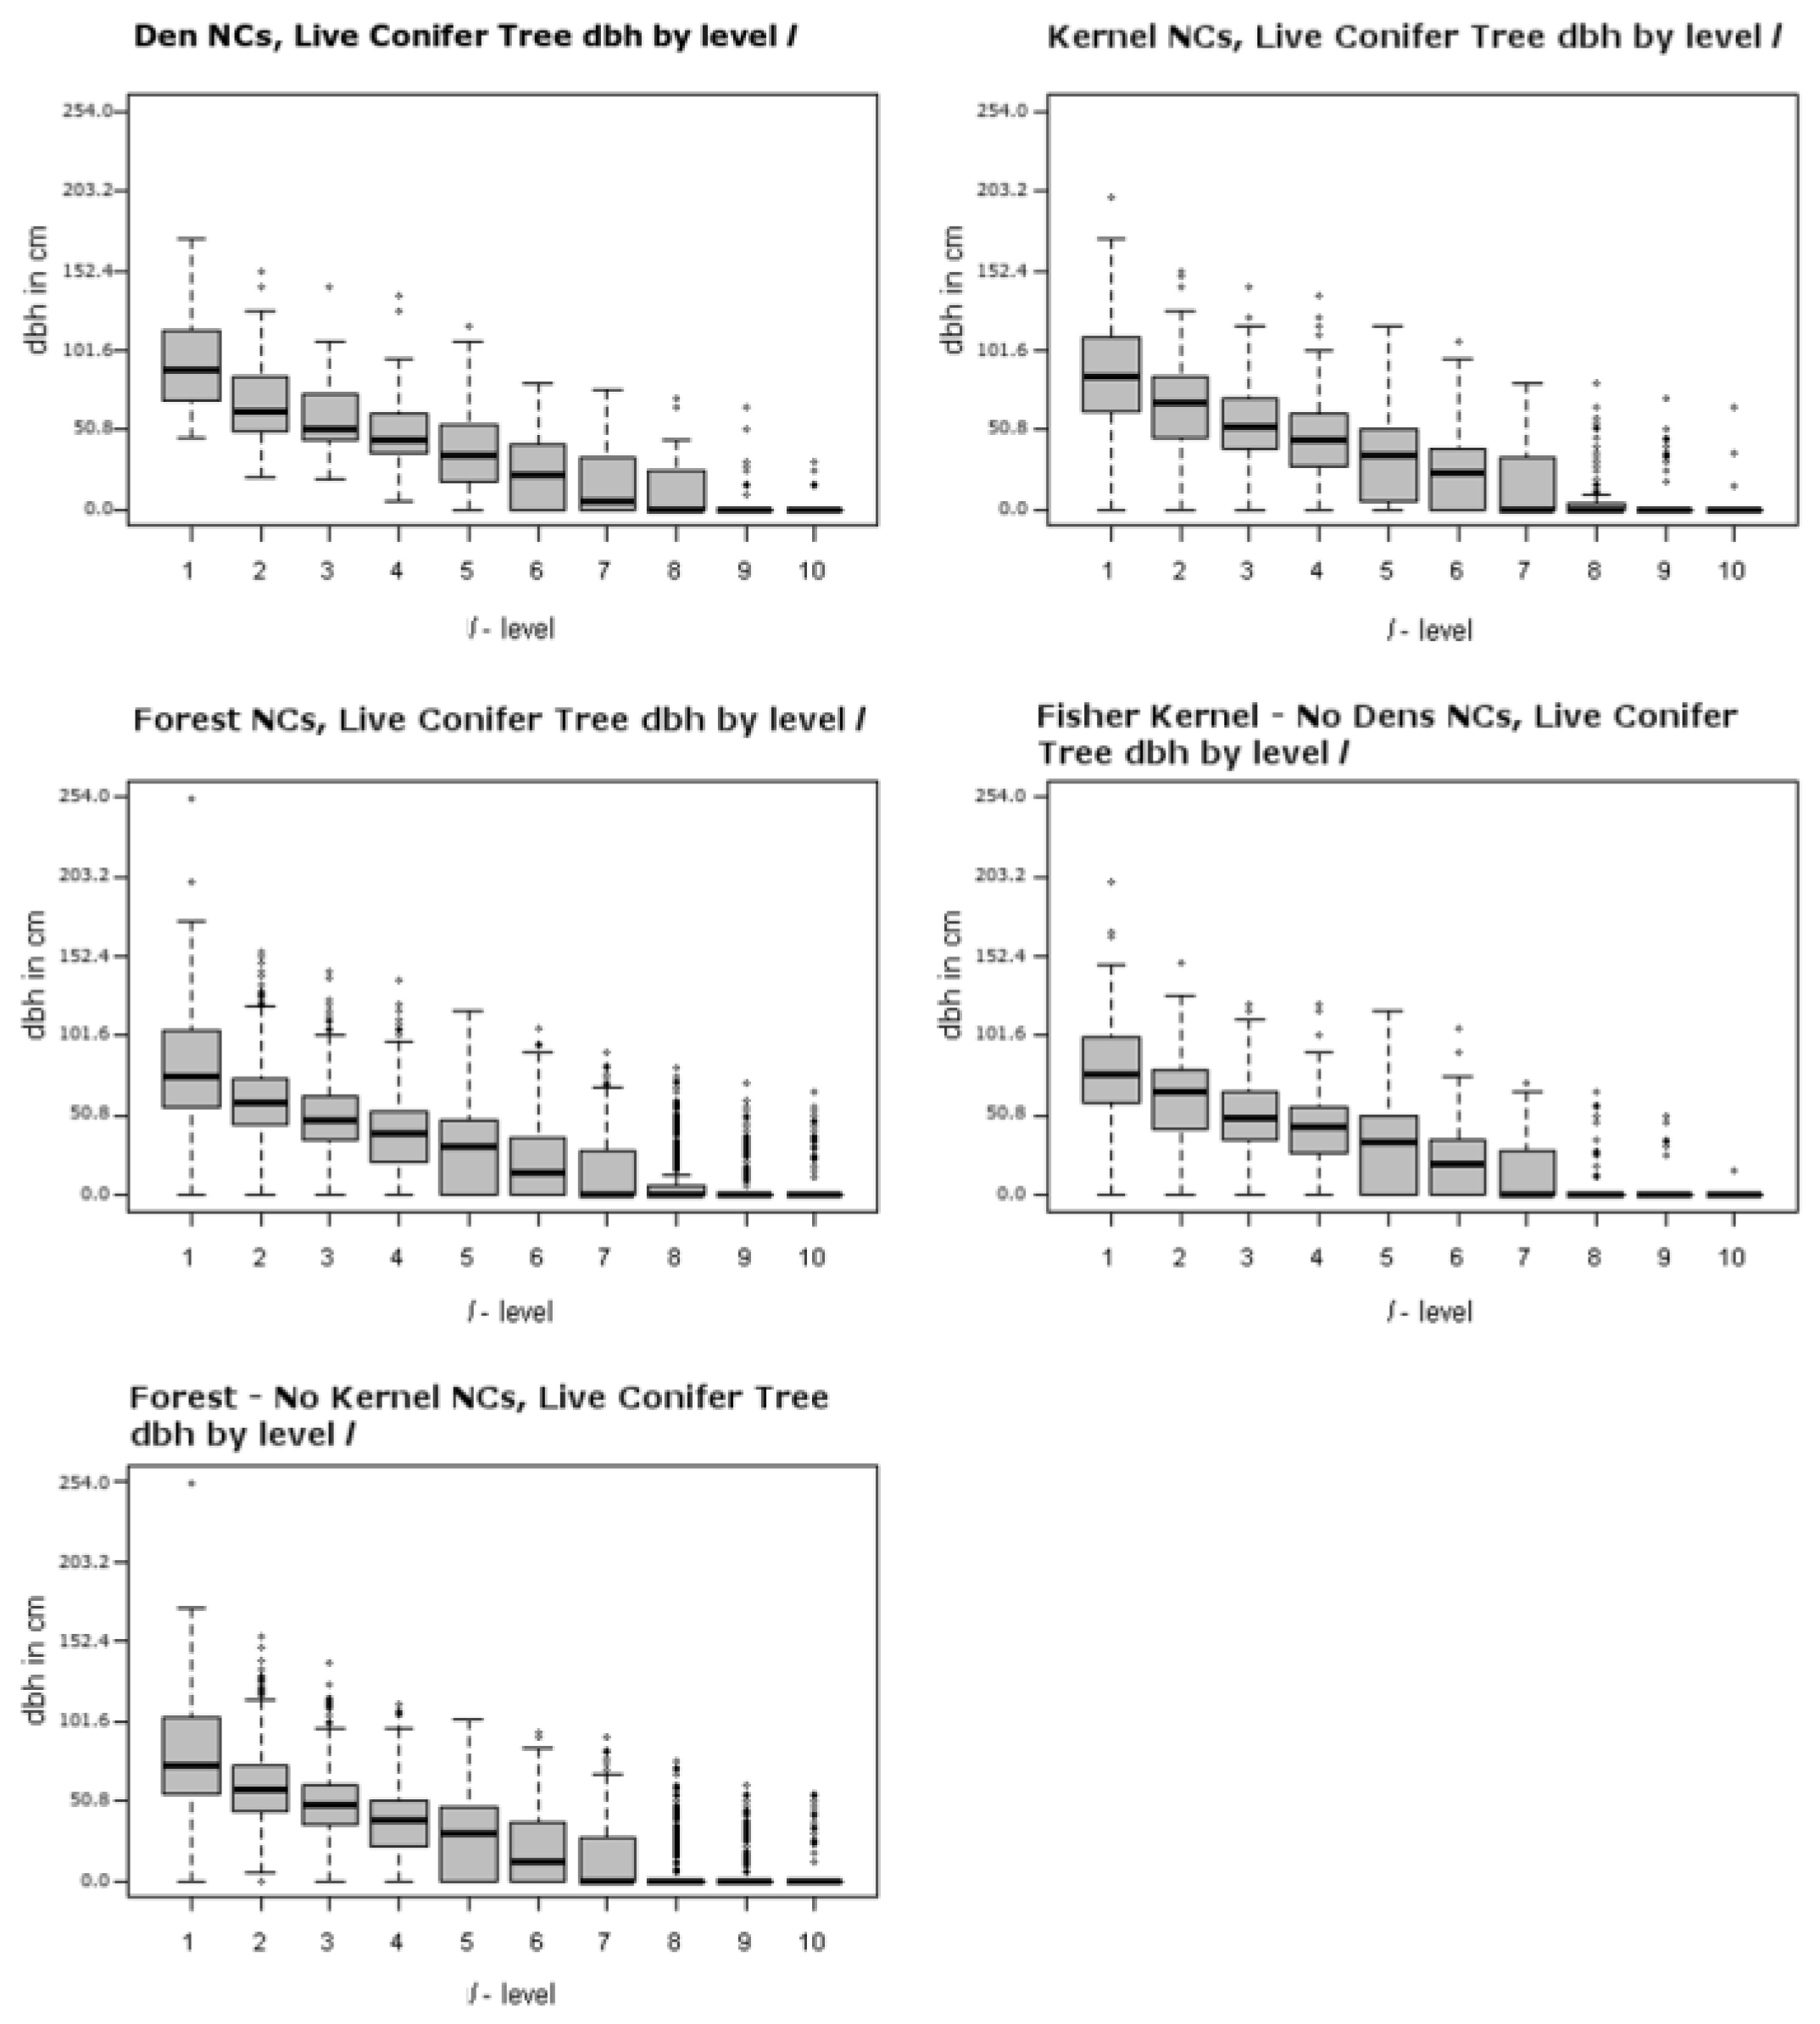
Figure 4,
Figure 5 and
Figure 6 show the ranges for which attribute values occur by level for each of the test and reference distributions. One can think of each of the panels contained within them as being a collapsed version of
Figure 3 that shows the overall distribution by level.
Figure 4 and
Figure 5, top left panels, show that the distribution of large hardwood and conifer structure trees, those with larger dbh, within den NCs is much higher than the remaining forest NCs. For the den NCs where
l ≤ 3 (the best three plots), the average size of the largest conifers found is 76.5 cm (30.1 inches) dbh in size. The average largest conifer dbh over the range of significance in den NCs (levels 1:4) is 70.2 cm (27.6 in). Similarly, the largest hardwood found in den NCs where
l ≤ 3 average dbh is 55.9 cm (22.0 in), and 40.8 cm (16.1 in) over the range of significance (levels 1 through 6). Typically, the best plot (
l = 1) had a conifer at least 76.2 cm (30.0 inches) or a hardwood that was at least 50.8 cm (20.0 inches). These were in line with the measured attributes of known den trees (
Table 6). The average black oak hardwood den tree, the tree used for a majority of den sites, was 53.3 cm (21.0 inches). In general, black oaks used for denning appear to have lower average dbh (53.3 cm, 21.0 inches) than other hardwood species dbh used for denning which average 65.2 cm (25.7 inches). Both of these averages, black oak and other hardwood den trees, are less than the average resting hardwood dbh (69.0 cm, 27.17 inches) reported by Zielinski et al. [
20] for California fisher in northern California coastal and Sierra Nevada ranges.
Dens in live conifer trees, in this case Douglas fir, were in larger trees where average dbh was 129.79 cm (51.10 inches), though there was a total of just three dens in this type of tree (they measured 189.99, 134.11, and 65.28 cm (74.80, 52.80, and 25.70 inches)). Thus, the confidence in the average size of a potentially suitable Douglas fir den tree is not high as there is great variability in tree size. Nevertheless, the average dbh size of living Douglas fir (129.79 cm, 51.10 inches) and snag (119.43 cm, 47.02 inches) den trees are similar in size to resting live conifer (117.3 cm, 46.18 inches) and snag (119.8 cm, 47.17 inches) trees described by Zielinski et al. [
20]. The den conifers size found in this study are also larger than the average dbh for live conifer (97.40 cm, 38.35 inches) and snag (98.83 cm, 38.91 inches) resting trees described by Purcell et al. [
28] for a Sierra Nevada fisher population. This is similar to the average dbh of the largest living conifer tree found at the best level (
l = 1) in the den NCs of our study area (94.26 cm, 37.11 inches). Zhao et al. [
17] used LiDAR data in a Sierra Nevada forest to determine forest structure tree size and density about fisher den sites for 20, 30, and 50 m. ranges. They found that den structure trees in their study area tended to be clustered with other large trees within circles of those radii. Our result appears to confirm this, albeit in a forest with greater fragmentation. Given that the top 3
l-levels contain a large live conifer tree (>50.8 cm, 20 inches), a greater proportion of total basal area, and Scribner volume which are indicative of the presence of other large trees, it is likely that there are other large structures near the largest measured tree.
Figure 4 and
Figure 5, top left panel, illustrate the range of largest dbh of live hardwood and conifer trees for dens over the
l-levels. The middle left panels of
Figure 4 and
Figure 5 illustrate the range for the forest NCs excluding dens over the
l-levels. They clearly illustrate that the largest trees are generally concentrated in the best ranked plots; tree size drops off dramatically as one moves toward lower ranked
l levels starting around the 4th and 5th levels. In addition to the larger trees, there appears to be greater amounts of measured above ground biomass in average den NCs as compared to average forest NCs (
Table 5). The average above ground biomass difference between the top three levels (
l ≥ 3) of den NCs to forest NCs exceeds 100 metric tons per hectare; for mid-levels (
l = 4, …, 8) it is between 100 and 50 metric tons per hectare; and for the lower levels (
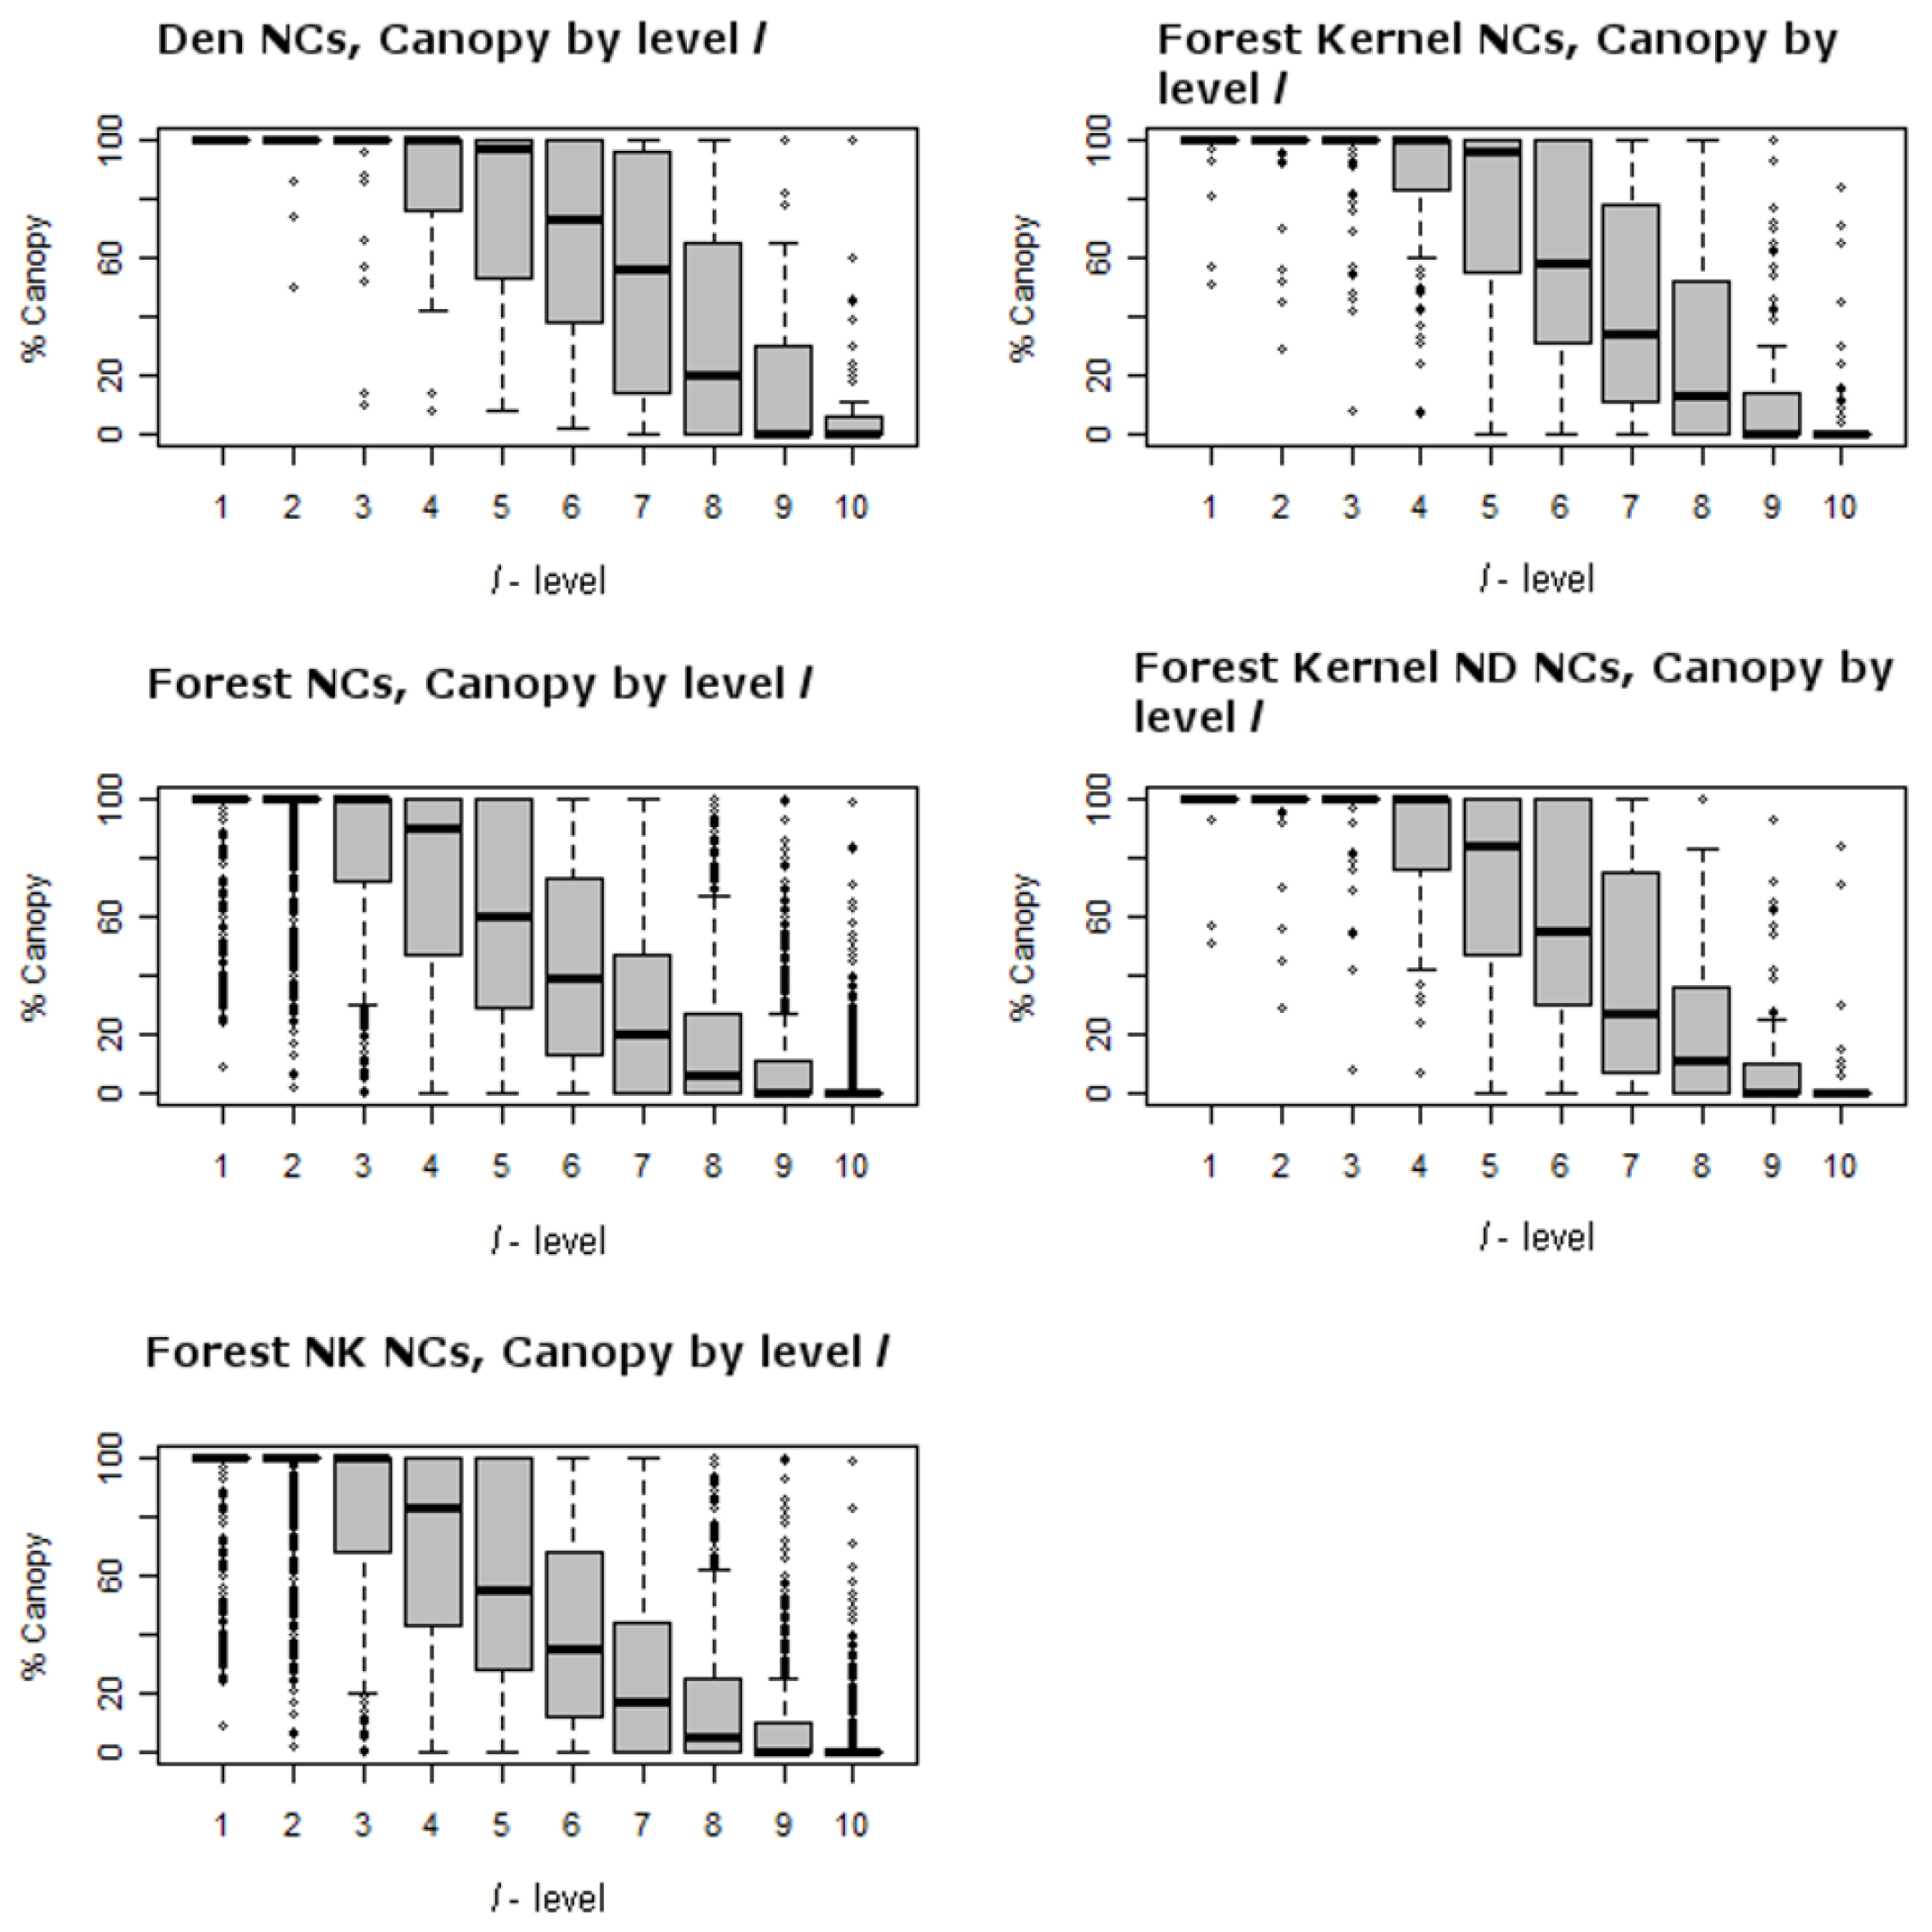
l = 9 and 10) it is less than 50 tons per hectare. This suggests that den NCs generally contain greater portions of forest than an average forest NC where above ground biomass is generally much less. It is no surprise then that canopy cover is significant for fisher home ranges, but for
l = 4, …, 8, there is likely to be a greater portion of forest openings. Significance of canopy is found when comparing den NCs to home range NCs at levels 3–8. This suggests that canopy cover for den NCs is greater than that of home range NCs. This is also confirmed by the higher levels of canopy cover generally found for den and home range NCs as compared to the general forest found in
Table 5.
Third, it is important to understand how this forest differs from that of other studies that suggest that extensive moderate to dense canopy cover is an important predictor of fisher habitat and where fisher home ranges consisted of less than 5% forest openings (e.g., [
22]). Level of canopy cover has been termed dense (100–60%), moderate (59–40%), open (39–25%), and sparse (<25%) using the California Wildlife Habitat Relationship (CWHR) system by Mayer and Laudenslayer [
29]. Our study area contains a much greater proportion of forest area that is open, 24% of the study area, than what has been suggested as essential. For example, total canopy closure within den NCs drops below 40% after the
l = 6 level (
Table 5).
Figure 6 (top left panel) shows the canopy cover distributions for ranked plots (
l-level) within NCs as box-whisker plots. For
l = 1 to 5, canopy is dense. In
l = 6 and 7 canopy cover is moderate and for
l = 8, 9, and 10 it is open to sparse. It is clear that for other NC comparisons where
l = 8, 9, and 10, a majority of the NCs contain sparse to open canopy cover as well. This suggests that fisher indeed requires dense canopy for portions of their home range and den sites. This is similar to what Zhao [
17] observed. Heterogeneous forests are also likely to contain greater numbers of hardwoods, which appear to be critical den structures—they were the greatest types of structures used for denning in this study area, and how den cavities form [
30].
Finally, it should be underscored here that a suitable unit of analysis and methodology for understanding portions of that unit must be used when attempting to understand broad scale habitat requirements for a species. This is especially true within the context of developing rules for environmental planning and analysis. We also believe that the framework of this paper may be used to evaluate other species habitat requirements to make informed policy based upon best science.
5. Conclusions
This research has significant implications for management strategies for the future provision and current protection of habitat, especially fisher habitat. This is a first attempt at addressing the spatial extent to which habitat must be an older, mature forest, generally accepted as a major habitat requirement. To address this question, we developed a framework called k-Max-l. Using this approach we are able to determine significant habitat components even when they are not spatially abundant. One key finding is that fishers occupied neighborhood clusters that often contained open areas of up to 25%, and their den sites often involved one of the largest available trees in the cluster, even when such sites were scarce and close to plots that were classified as open. This new k-Max-l approach can help to identify and understand the distribution of critical habitat elements as well as help in developing metrics for analyzing and managing habitat over time. It is necessary that long-term spatially extensive management considerations account for these types of habitat complexities in order to ensure long term fisher occupation.
In this study, we have analyzed an area where significant portions of the forest contain few large trees and where there are numerous openings in significantly greater proportions than previously reported in the literature [
22] as being needed for fisher habitat. However, we have also shown that the few large trees that do exist, particularly those in areas where their numbers are higher, tend to be near den locations and within home ranges. This appears to agree with the recent work of Zhao et al. [
17] which involved LiDAR to determine the density of other large trees in close proximity to known den sites in an area inhabited by the fisher. Our approach is the first such study that has used detailed fine scale plot data collected over a large forested area. Because of this, we could group this fine scale data into larger, meaningful spatial units, called Neighborhood Clusters or NCs. Neighborhood Clusters could then be classified as to whether they contain a Den site, are part of known habitat as defined by kernel density estimates of female fisher territories, or part of the remaining landscape. Distributions of habitat elements within each neighborhood cluster can then be compared to test significance even when larger average forest measures lack explanatory power.
There are three elements not addressed in this study but which are of great concern. The first is that there is an assumption that a large tree contains a suitable cavity. While this is likely to be true for our study area given its prior land use, if forest conditions change due to increased logging activity and management, caution should be used when using this measure. The reason for this concern is as follows. Though large trees, either at or exceeding the size of current ones, can be produced faster in an industrial forest it is unknown if a cavity potentially useful to denning will be produced in that same length of time as in less managed areas. It seems clear that maintaining suitable conditions for the fisher, when an area may be subject to logging, will require a significant effort to maintain older and larger trees, even in areas being cut, to ensure that regenerated stands exist over time that have a number of suitable structures, canopy, and that the density of such stands is high enough to support movement between suitable “denning site” neighborhood clusters. These constraints may be significant in controlling the spatial arrangements in harvesting while maintaining a landscape suitable for the fisher, as well as potentially extend rotation schedules significantly beyond 100 or more years. Thus, attention should be focused on understanding how to use data such as this to evaluate plans that alter the landscape, such as logging activities, in order to maintain and provide future conditions suitable for species habitat.
The second element is that existing hardwoods present in the forest have played an important role in supporting the fisher, as they have provided many suitable denning sites. If the area is managed so that hardwoods are eliminated in the regeneration process with a move to replant only conifers, larger and older conifers will be necessary to support this function over time.
The third is that while the k-Max-l method shows that the proportion of large trees suitable for resting and denning are not spatially extensive, and are likely clustered, there is no information related to connectivity. This is an important area of future research that should be explored as this is likely to provide greater insight into how a home range is connected, and thus supportive of the fisher. Such an understanding would aid in estimating the impacts of proposed management activities on possible habitat. Understanding this third point is of great importance as a majority of a fisher home range appears to be connected in some way with canopy cover and the presence of suitable den and rest trees. Even though there are numerous openings surrounded by forest stands of varying age, we have assumed here that there is a matrix of forest stands that are reasonably connected. An initial analysis of this tends to bear this out. We suspect that isolated NCs, regardless of their quality, should not be considered viable for denning or as part of a possible home-range.
Future work will help to further characterize the needs of the fisher, but several elements have been uncovered in this work that have significant management implications. We found that fishers select areas of denser forest with large trees for den site areas, and that to maintain fisher populations on their lands, and reduce adverse impacts, private timberland owners may wish to take this into account when planning logging activities.


