Article

Detection of Airborne Inoculum of Hymenoscyphus fraxineus and H. albidus during Seasonal Fluctuations Associated with Absence of Apothecia

1
Department of Forest Protection and Wildlife Management, Faculty of Forestry and Wood Technology, Mendel University in Brno, Zemedelska 1, 613 00 Brno, Czech Republic
2
Department of Experimental Biology, Masaryk University, Kamenice 735/5, 625 00 Brno, Czech Republic
*
Author to whom correspondence should be addressed.
Forests 2016, 7(1), 1; https://doi.org/10.3390/f7010001
Submission received: 1 October 2015 / Revised: 30 November 2015 / Accepted: 9 December 2015 / Published: 22 December 2015

Abstract

:
Hymenoscyphus fraxineus is an invasive fungal species causing the most serious disease of ashes (Fraxinus spp.) in Europe—ash dieback. The biology of this fungus is not totally elucidated, neither its relation to the saprophytic species Hymenoscyphus albidus, native in Europe. Our study is focused on the description of seasonal spore dispersal of both fungi and its relation to meteorological conditions, which is needed for more precise and effective control of the disease. For this experiment one long time infected mixed forest in the SE Czech Republic was chosen. A seven-day automatic volumetric spore trap and a weather station were installed to continuously sample the aerospora from April to October 2014. In seven periods a rotating arm spore trap was also used to obtain 48-h air samples to compare the efficiency of these two types of air samplers. Air samples were evaluated solely by qPCR with a very low detection limit. Results show co-occurrence of inoculum of both fungi throughout the entire sampling period with peak levels in August. The origin of the inoculum sampled in the periods without apothecia is discussed. Air-inoculum occurrence of both fungi is significantly correlated with each other, suggesting their coexistence in this forest.

1. Introduction

Hymenoscyphus fraxineus (T. Kowalski) Baral, Queloz, and Hosoya (anamorph Chalara fraxinea T. Kowalski) and H. albidus (Gillet) W. Phillips are closely related species with a notably different biological behavior [1]. H. albidus is a widespread indigenous ascomycetous fungus in Europe, which behaves as a saprotroph, decomposing fallen petioles of common ash (Fraxinus excelsior L.) after autumn shedding [2]. It is a cryptic species and has never been reported as pathogen in the European continent [1]. H. fraxineus is a lethal invasive pathogen from East Asia [3] and the main causal agent of ash dieback (ADB) in Europe [4,5]. It attacks living shoots [6], leaves [7] and, later, stems, collars, and roots [8] of all ages of F. excelsior, F. angustifolia Vahl, and F. ornus L. [9] trees, and later lives as a saprotroph on fallen petioles. Although more detailed information is needed to entirely comprehend the life cycle of H. fraxineus, Gross et al. [7] described a hypothetical cycle used as reference in further studies [10,11]. Airborne ascospores seem to be the only infectious propagules and outset of new infections on green leaves [2,12]. They are released by apothecia on decomposing, pseudosclerotial leaf petioles and rachises found in the leaf litter mainly in summer [1]. The characteristic black pseudosclerotial plate on the surface of the petioles serves the fungus to survive the winter [2]. The pathogen establishment on leaves is terminated before the onset of the leaf senescence [13]. Conidia, which are produced on the petiole in autumn at low temperatures [14], may act as spermatia for sexual reproduction, but most likely do not play any role infecting the host. Next summer (growing season) new apothecia develop and a new infection cycle starts [7].
H. fraxineus and H. albidus overlap their niches. Both species may colonize living leaves of F. excelsior [15]. However, H. fraxineus fructifies earlier, which may enhance its colonization to the detriment of H. albidus [13]. The rapid invasion of H. fraxineus in Europe has been pointed out as the main cause of the vanishing of H. albidus in its natural habitat. Thus, in many localities of different European countries, such as Scotland or Denmark, H. albidus has been extinguished after ash dieback onset [16]. Nevertheless, in some locations in central and NW France where the disease was not totally established both species have been reported [17]. Likewise, ascospores of H. albidus were detected (in low density) in one location in Belgium in early autumn [10]. Furthermore, in Norway, Hietala et al. [13] registered the presence of H. albidus by quantitative PCR (qPCR) in a heavily infested stand with H. fraxineus at the end of July.
Biological studies focused on the occurrence of the H. fraxineus air-inoculum and its relation to meteorological conditions are essential for a more precise disease management [10]. Several authors have examined the spore dispersal of H. fraxineus and H. albidus. Timmermann et al. [12] and Hietala et al. [13] employed seven-day automatic volumetric spore trap based on the description of Hirst [18] to investigate the diurnal and seasonal pattern of H. fraxineus in Southern Norway from the beginning of July until the end of September. Chandelier et al. [10] applied rotating arm spore traps based on principles of Perkins [19] and McCartney et al. [20]. Their results described the spatial (horizontal and vertical) spore dispersal together with the seasonal pattern of the occurrence of H. fraxineus ascospores, sampled extensively in different years at different localities from April to November. However, rotating arm spore traps have certain disadvantages. They are not suitable to sample very small particles and after a relatively short time they may become overloaded [21]. Basically, they are not applicable for continuous sampling to follow ascospore occurrence in real-time. These handicaps can be overcome until certain limits are reached, by using a set of samplers operated by microprocessors with programmable speed of rotation and timer (e.g., rotating arm samplers produced by Vision Micro Systems in India). Conversely, compared to seven-day volumetric spore traps, they normally work with higher sampling rate, even over 100 L·min−1 [20,21]. Other advantages of rotating arm spore traps are their lower price and weight [10,20,21].
In the Czech Republic, ash decline has been observed since the end of the 1990s, but it was not until 2009 when H. fraxineus was reported [22]. Since then, the disease has been increasingly observed in a number of areas with different severity [23]. Therefore, the aims of this study were (i) to thoroughly describe the seasonal pattern of H. fraxineus and H. albidus ascospores dispersal in the locality where the ash dieback was firstly described in our country; (ii) to determine the influence of meteorological conditions on its biology; and (iii) to compare efficiency of rotating arm spore trap and seven-day automatic volumetric spore trap together with evaluation of the samples by qPCR.

2. Experimental Section

2.1. Sampling Locality
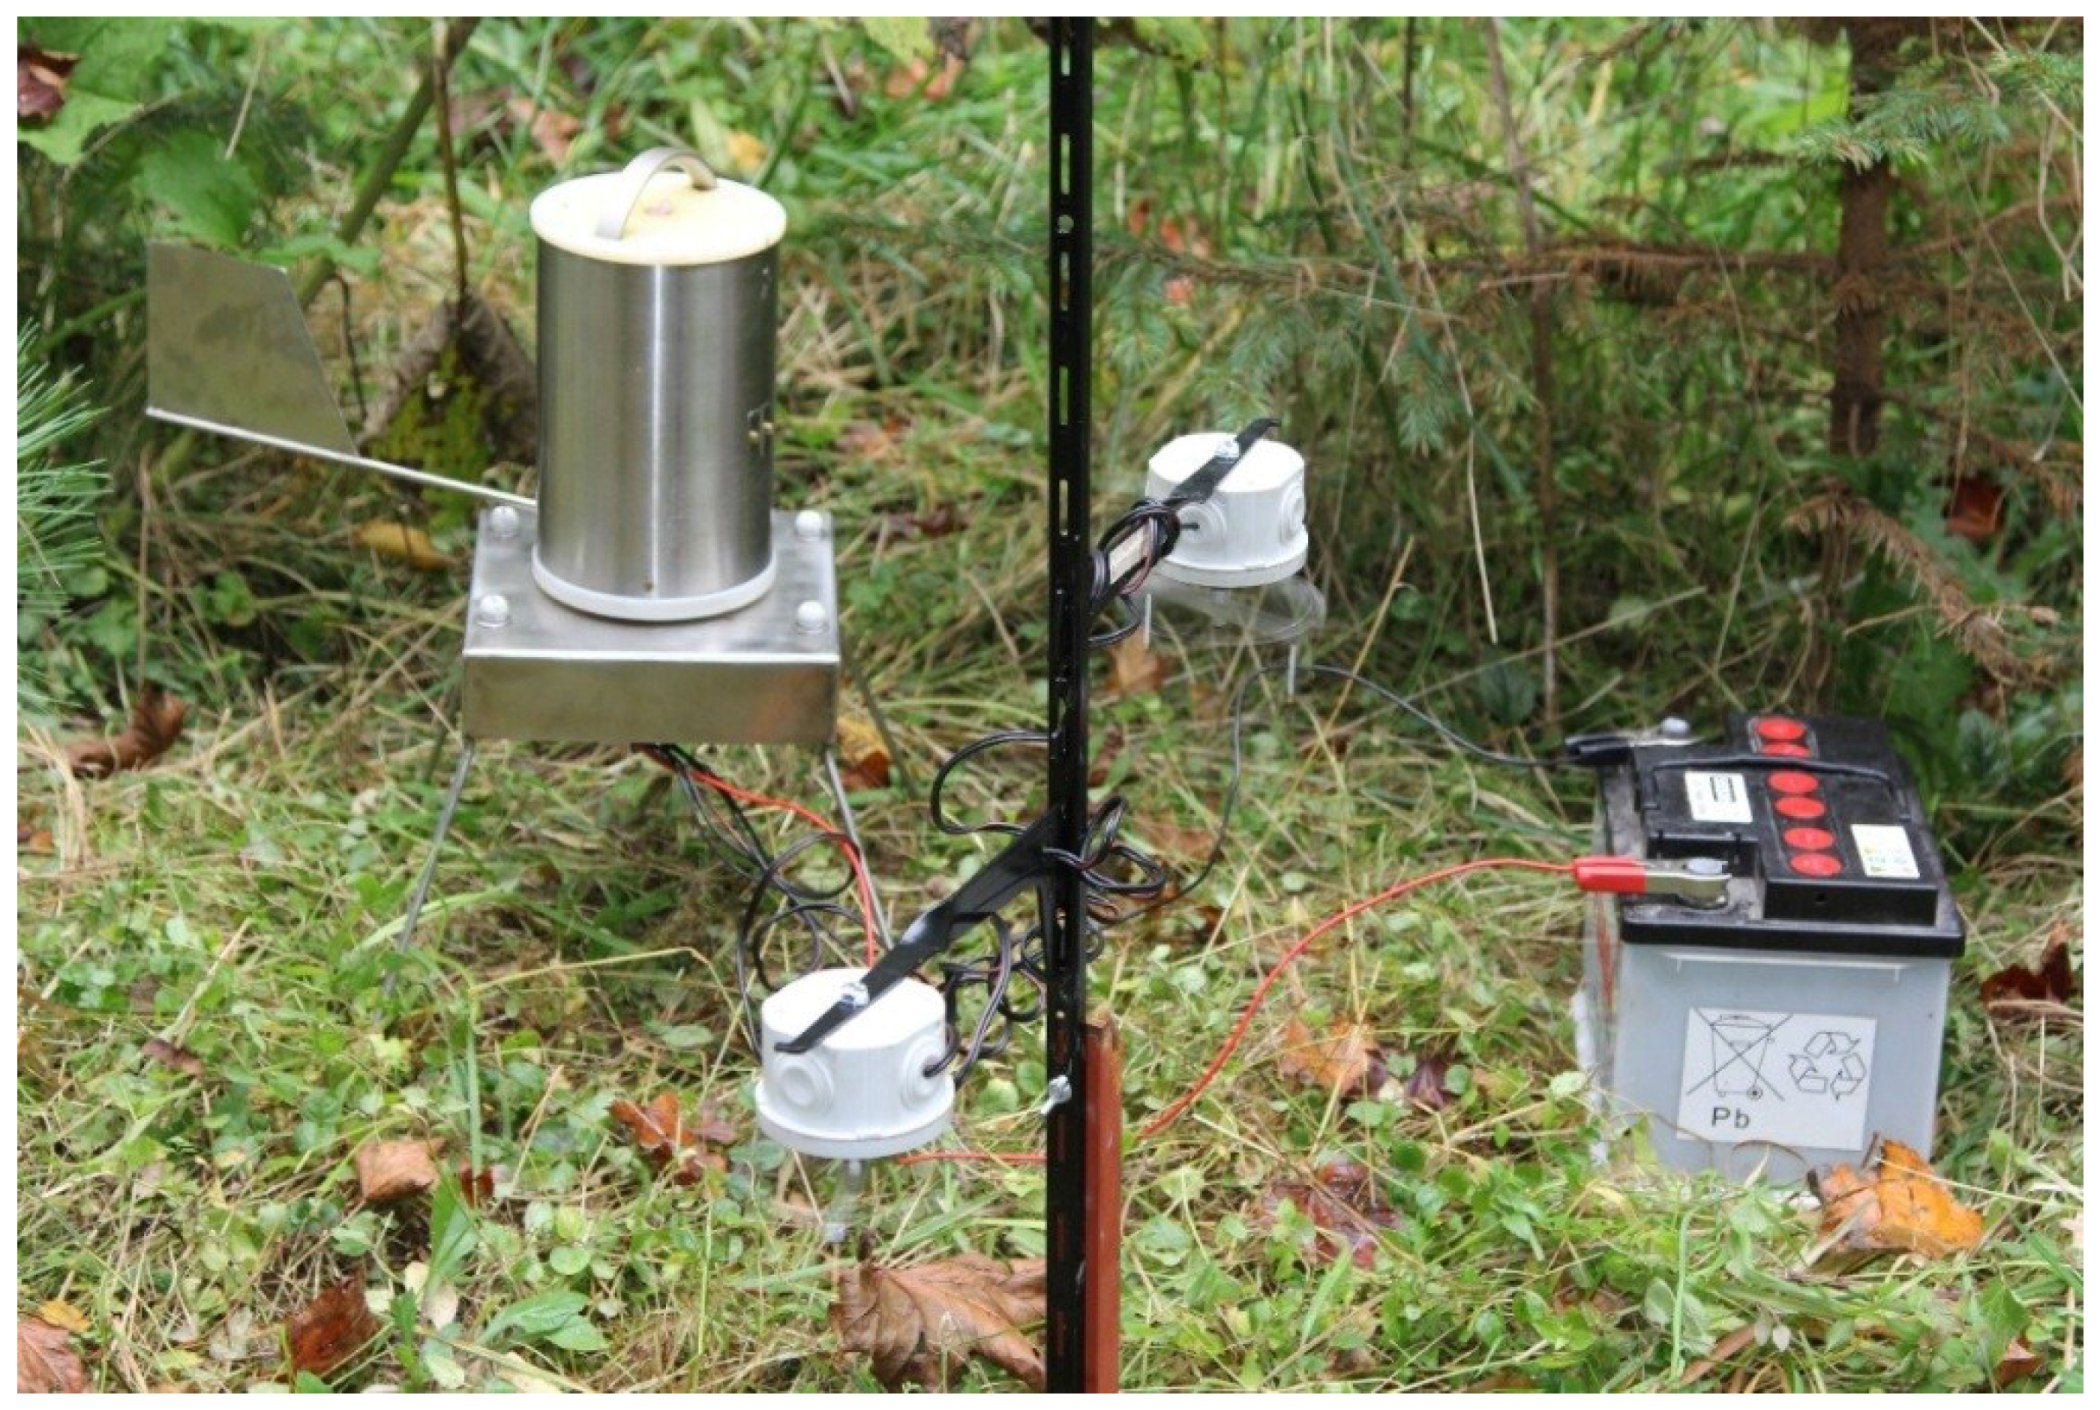
The experiment was carried out in an ancient experimental forest nursery called “Hackerova skolka” situated in Southern Moravia (South East of the Czech Republic, GPS: 49.3232069 N, 16.7437356 E), 470 m.a.s.l. (meters above sea level). This nursery is located in a mixed broadleaved forest with a high number of European ashes (Fraxinus excelsior). Almost all of the trees showed more or less severe infection of ADB. Air temperature, relative humidity, and leaf wetness were measured every hour by an automatic weather station Signalizátor (Amet, Velké Bílovice, Czech Republic) through the whole air-sampling season. A weather station was placed on the ground to measure the microclimatic conditions of the source of inoculum—ash leaf litter, which was checked weakly for presence/absence of apothecia of Hymenoscyphus spp.

2.2. Air Samplers

A seven-day automatic volumetric spore trap (SAVST) made by AMET (Velké Bílovice, Czech Republic) based on the principle published by Hirst [18] was implemented. Melinex tape covered by petroleum jelly as a trapping medium was fixed to a revolving drum of the spore trap, facing an orifice through which 10 L of sampled air were sucked every minute. This spore trap was installed to sample the air inoculum continuously from 1 April to 1 November 2014. It was placed under one of the severely-infected ashes having its orifice 30 cm above soil surface. Exposed tapes were cut into pieces simulating particular days and stored in 2 mL microtubes at −20 °C before further processing. Atmospheric concentration of H. fraxineus spores for this arrangement is calculated according to Equation (1):
[ c H f = X H f I   ×   P   ×   E   ×   0.001 ]
where: cHf = atmospheric concentration of H. fraxineus ascospores (number of spores in 1 m3 of air); Xhf = number of H. fraxineus spores detected in the sample; E = efficiency of sampling determined by construction of the air sampler and shape and size of sampled particles (% × 0.01); I = intensity of the sampling (L·min−1); p = length of the period of the sampling (min).
For SAVST used in this study the atmospheric concentration (chf) was calculated to 6.93 × 10⁻² XHf.
Rotating arm spore traps ROTTRAP 68 (RAST) made by Miloň Dvořák (Boršov nad Vltavou, Czech Republic) were used to compare the efficiency of Hymenoscyphus spp. sampling. Two RASTs were installed 1 m apart of the SAVST, sampling in the same height as the orifice of SAVST (Figure 1). The construction of this air sampler was published by Chandelier et al. [10] based on the description of Perkins [19] and McCartney et al. [20]. It consists of a horizontally rotating arm (2400 rpm) with removable 2 mm thick squared wooden rods (pieces of matches) fixed vertically in both ends of the arm in the distance of 44 mm from the center. In this experiment two RASTs were used. Two different materials were used as trapping medium in both spore traps (i) double-sided non-woven tape (Tesa), used by Chandelier et al. [10] and (ii) petroleum jelly, also used and suggested by the producer of SAVST (AMET), providing an impact surface of 50 mm2 per rod. In this performance the RAST samples 34 L·min−1 per rod (68 L·min−1 per each spore trap) with the efficiency for H. fraxineus ascospores 10%–15% [8]. RASTs were installed for 48 h periods, seven times (one sampling in June, another in July, and five samplings in October) during the SAVST sampling season. The exposed rods were stored in 2 mL microtubes at −20 °C before further processing. For RAST used in this study the atmospheric concentration (chf) was calculated to 4.08 × 10⁻² XHf.
Figure 1. Installation of two rotating arm spore traps (RASTs) and one seven-day automatic volumetric spore trap (SAVST) in Hackerova skolka, SE Czech Republic.
Forests 07 00001 g001

2.3. DNA Extraction

DNA was extracted from all the samples together with an empty microtube as a negative control of extraction. Spores’ disruption was processed similarly to Hospodsky et al. [24]: 0.3 g of 0.1 mm and 0.1 g of 0.5 mm balotina beads were added to the microtubes with the samples together with 250 µL of 0.1% Nonidet P40—substitute (AppliChem, Darmstadt, Germany) and disrupted for 10 min by 30 Hz in Mixer Mill MM400 (Retsch, Haan, Germany). For further processing the DNEasy Plant Mini Kit (Qiagen, Valencia, CA, USA) was used with a modified lysis buffer [25] and an incubation prolonged up to 60 min. In the last step, DNA of each sample was eluted only once with 100 µL of preheated elution buffer previously incubated for 10 min.

2.4. qPCR Conditions

Direct specific qPCR was performed using a LightCycler ® 480 Instrument II (Roche Diagnostics, Basel, Switzerland), TaqMan Universal PCR Master Mix (Applied Biosystems, Foster City, CA, USA) and specific primers and probes (Table 1) according to the manufacturer’s instructions (pre-incubation: 10 min, 95 °C followed by 45 cycles of denaturation: 10 s, 95 °C; annealing: 30 s, 60 °C; extension: 1 s, 72 °C—single acquisition mode). Composition of the reaction mixture was following: 0.2 µL of each primer (final concentration 400 nM), 0.2 µL of TaqMan probe (200 nM), 5 µL of TaqMan Universal PCR Master Mix, 1.9 µL of sterile deionized water and 3 µL of template DNA.
Every reaction was performed in three technical repetitions together with a negative control containing the master mix without template DNA.
Table 1. Specific primers and probes used in this study, species amplified, and reference of their source.
Nucleotide DesignationSequence (5′–3′)Detected OrganismSource
Halb-FTATATTGTTGCTTTAGCAGGTCGCH. albidusHusson et al. [17]
Halb-RATCCTCTAGCAGGCACGGTCH. albidusHusson et al. [17]
Halb-PYY-CCGGGGCGTTGGCCTCG-BHQ2H. albidusHusson et al. [17]
Cf-FCCCTTGTGTATATTATATTGTTGCTTTAGCH. fraxineusChandelier et al. [26]
Cf-RGGGTCCTCTAGCAGGCACAGTH. fraxineusChandelier et al. [26]
Cf-S6FAM-TCTGGGCGTCGGCCTCGG-BHQ1H. fraxineusChandelier et al. [26]

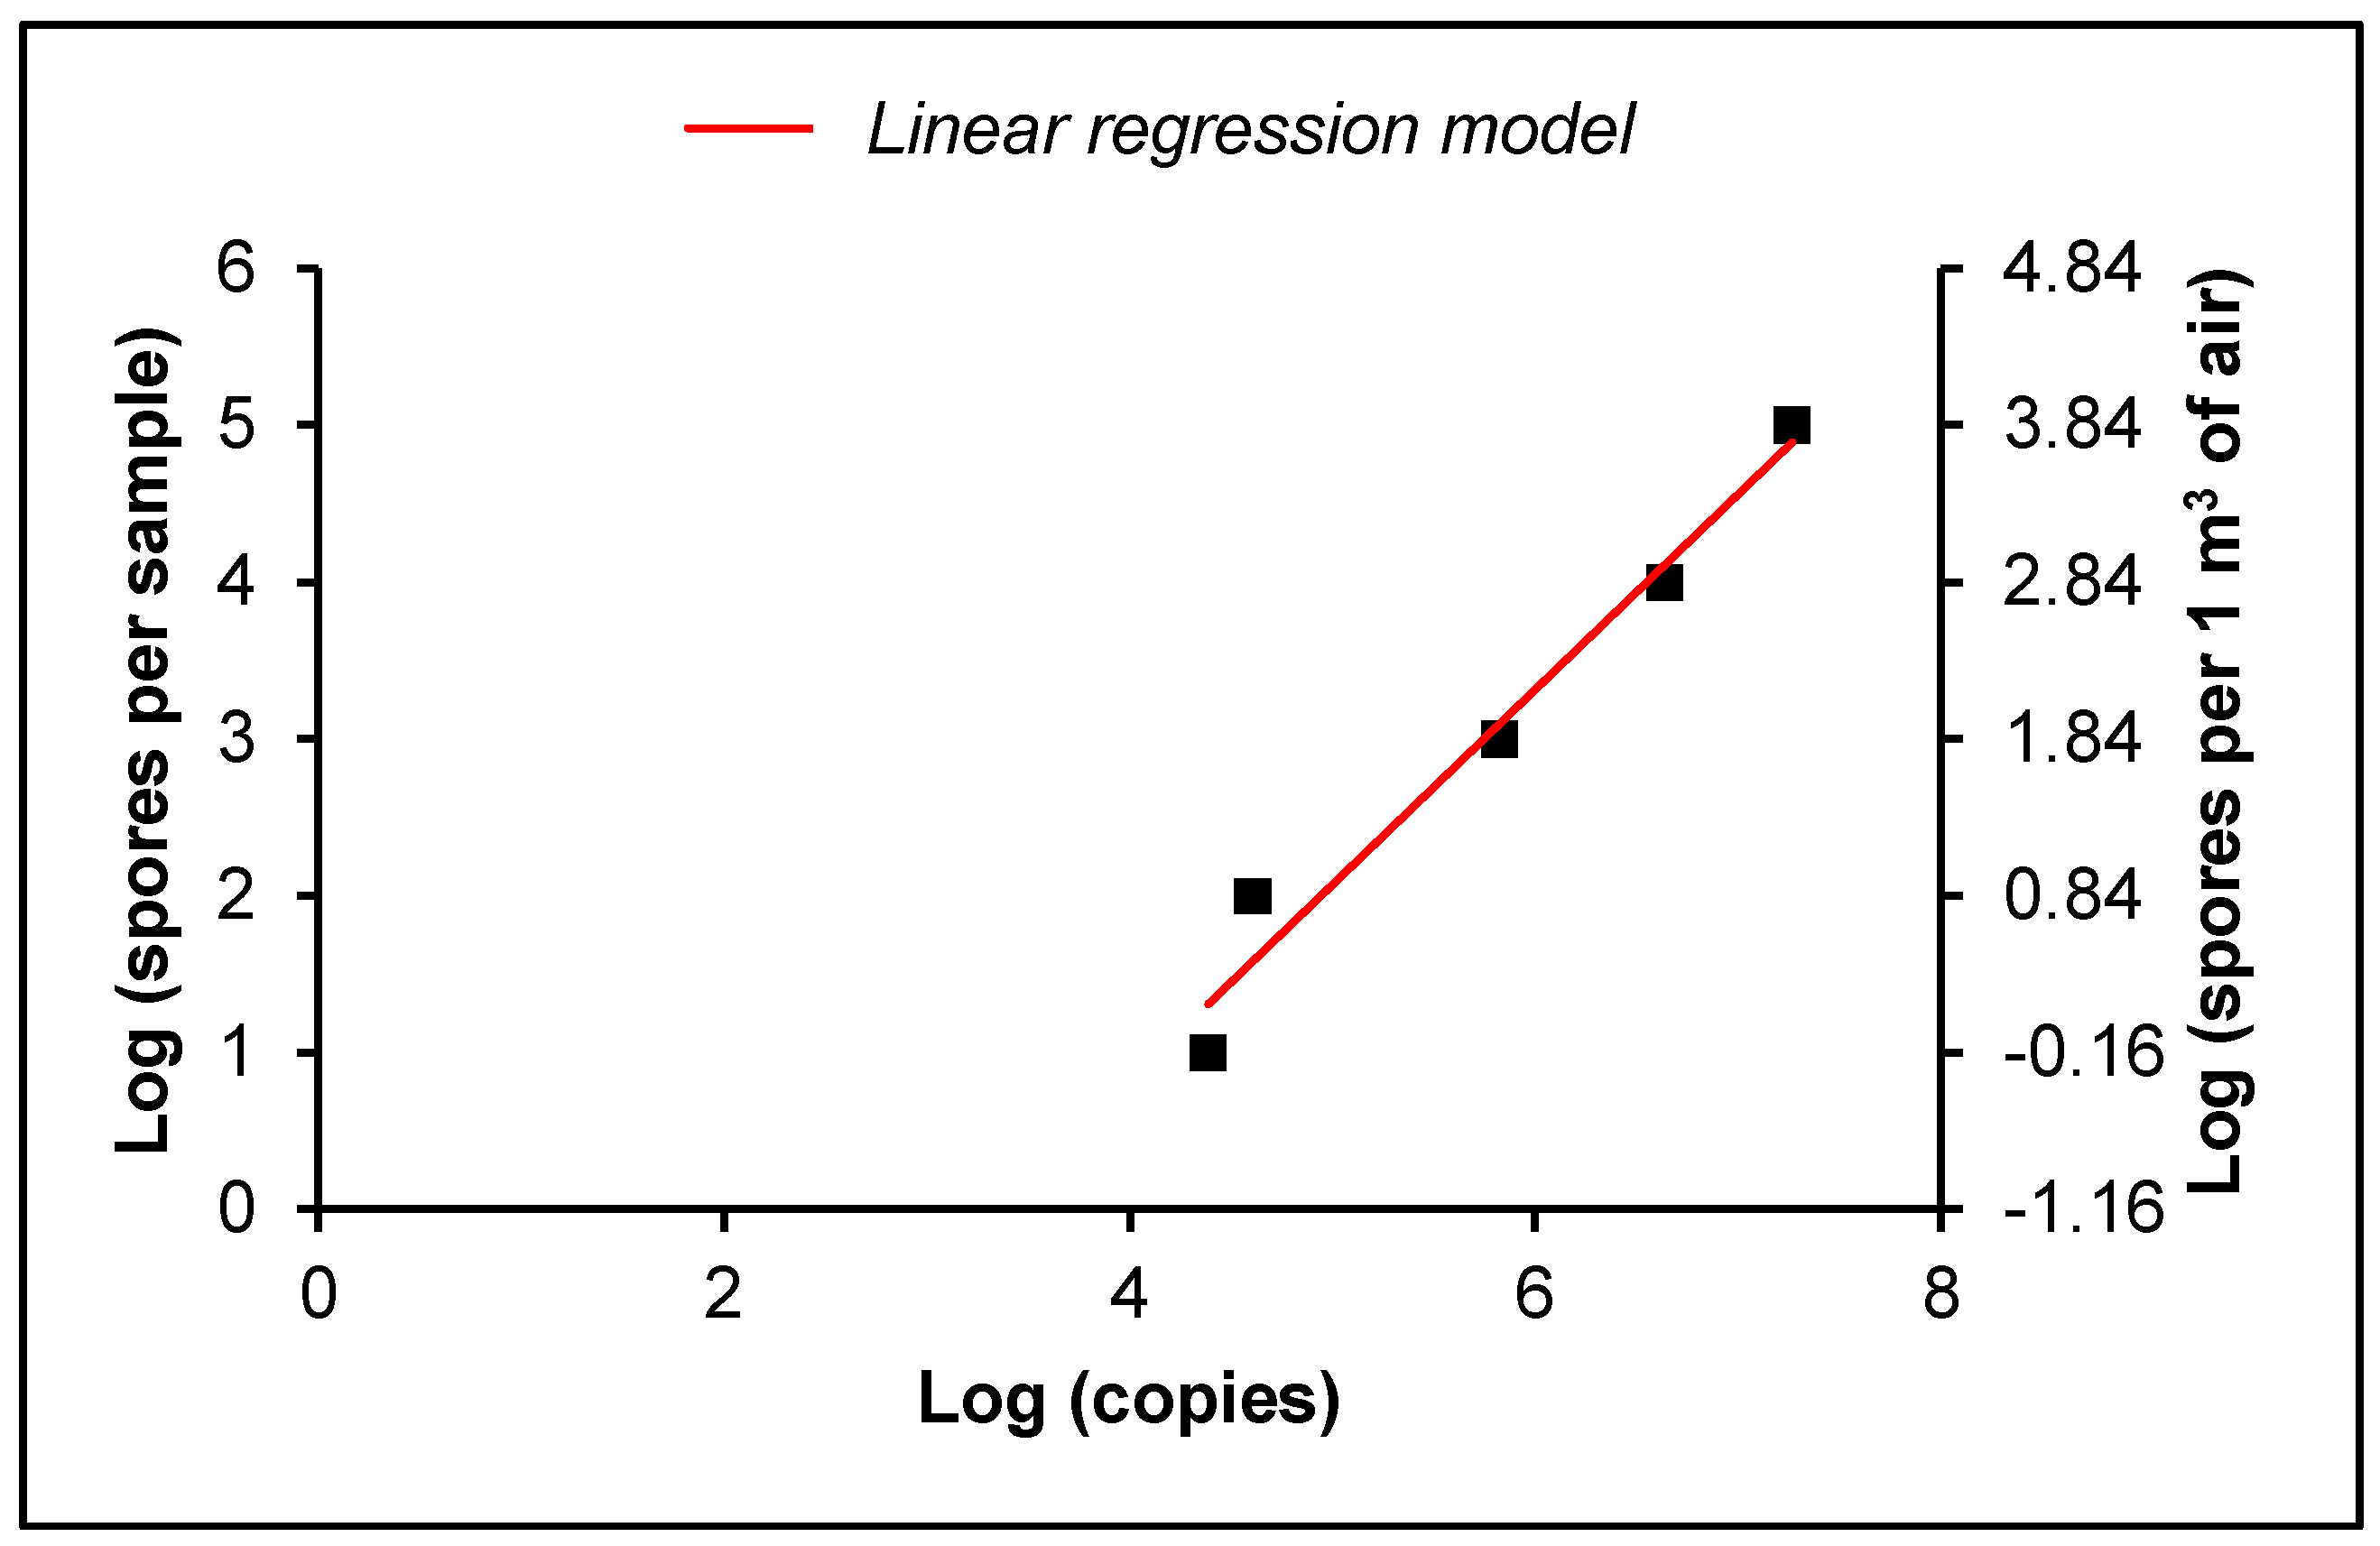
2.5. Absolute Quantification

The concentrations of H. albidus and H. fraxineus DNA in the samples were expressed as numbers of copies of the target sequence in 1 µL of template DNA (further only numbers of copies). These numbers of copies were quantified using a standard curve generated by reactions with different amounts of plasmid pCR™2.1-TOPO® TA vector (Invitrogen, Carlsbad, CA, USA) by The LightCycler® 480 Software (Roche Diagnostics, Basel, Switzerland). Plasmids contained species-specific inserts (PCR products amplified with primers described in Table 1). DNA was extracted from pure cultures of H. fraxineus (collection of Mendel University in Brno) and H. albidus (obtained from the personal collection of T. Kirisits, Institute of Forest Entomology, Forest Pathology, and Forest Protection, Vienna, Austria).
To calculate the amount of ascospores of H. fraxineus in every sample, a suspension of ascospores from matured apothecia was prepared in Nonidet P40-substitute (AppliChem, Darmstadt, Germany). Serial dilutions of 10 to 105 ascospores in 250 µL of Nonidet were added into 2 µL microtubes with unexposed melinex tape coated by petroleum jelly to simulate standard content of SAVST exposed sample. Further processing was equal to the natural samples, including the absolute quantification with the plasmid. An Equation (2) expressed linear regression of the numbers of copies and numbers of spores of the serial dilutions:
[ logY H f = 1.24 × logX H f 4.15 ]
where: YHf = number of H. fraxineus ascospores in the sample; XHf = number of H. fraxineus copies.
The H. fraxineus numbers of copies were recalculated by using Equations (1) and (2) to obtain atmospheric concentrations.The amount of H. albidus ascospores remains unknown, since we were not able to find any H. albidus apothecia to prepare ascospore suspension. Different dilutions of ascospore suspension, calculated model and amounts of ascospores recalculated to 1 m3 of air sampled by SAVST are displayed in the Figure 2. The lowest detected amount of ascospores in one processed sample was 10 ascospores, which equates to 0.694 ascospores in 1 m3 of air.
Figure 2. Standard curve of the number of ascospores of H. fraxineus in logarithmic scale and the corresponding numbers of copies of the target sequence in 1 µL of template DNA in logarithmic scale (left) accompanied by atmospheric concentration sampled by SAVST (in logarithmic scale as well).
Forests 07 00001 g002

2.6. Statistical Analysis

All the statistical analysis were performed by STATISTICA version 12 (StatSoft, Tulsa, OK, USA).
Numbers of copies obtained by comparison of different air samplers were evaluated separately for H. fraxineus and H. albidus. Cases with negative detection were discarded from the analysis. Normality was tested by the Shapiro–Wilk test. Data did not show normal distribution neither in the case of H. fraxineus (W = 0.57, p = 0.00) nor H. albidus (W = 0.88, p = 0.02). Normality was achieved by logarithmic transformation (W = 0.96, p = 0.57; resp. W = 0.18, p = 0.10). Transformed data were analyzed by one-way ANOVA with post hoc analysis calculated by Duncan’s test.
Numbers of copies detected in the samples of ascospore’s suspensions and known numbers of ascospores (serial dilutions) in these samples were not showing normal distribution in Shapiro–Wilk test (numbers of copies: W = 0.71, p = 0.01; serial dilutions: W = 0.62, p = 0.00). Therefore, they were successfully log-transformed (W = 0.92, p = 0.55; W = 0.99, p = 0.97). High correlation (R = 0.98) of these two variables was expressed and confirmed by a highly significant (R2 = 0.97, p = 0.00) linear regression model (2).
Comparison of H. fraxineus and H. albidus ascospore occurrence was based on the comparison of positive numbers of copies in every particular sample. Negative records were discarded from this analysis. Positive numbers of copies did not show normal distribution by using the Kolmogorov–Smirnov test (H. fraxineus: d = 0.52, p = 0.01; H. albidus: d = 0.27, p = 0.01). Data were successfully log-transformed (d = 0.10, p = 0.20; d = 0.10, p = 0.20). Relation between these two variables was expressed by linear regression (3, 4) described in the section of results.
Relation between ascospore occurrence and meteorological data was expressed as follows. The compared variables were daily mean, minimal and maximal values of air temperature, relative humidity, and leaf wetness. The correlations between meteorological data and ascospore records were calculated separately for 0–14 days of ascospore records to determine the conditions influencing the reproduction of H. fraxineus and H. albidus. Values of ascospore records did not show normal distribution, even after log-transformations the Kolmogorov–Smirnov test never showed d-values lower than 0.14 neither p-value higher than 0.01. Log-transformation led to normal-like distributed positive values together with high occurrence of negative records. Due to this reason the Spearman correlation was used to express putative relations of detected inoculum to meteorological variables in all cases. Meteorological parameters had similar problems with distribution, therefore, the Spearmen correlation was used for their comparison as well.

3. Results

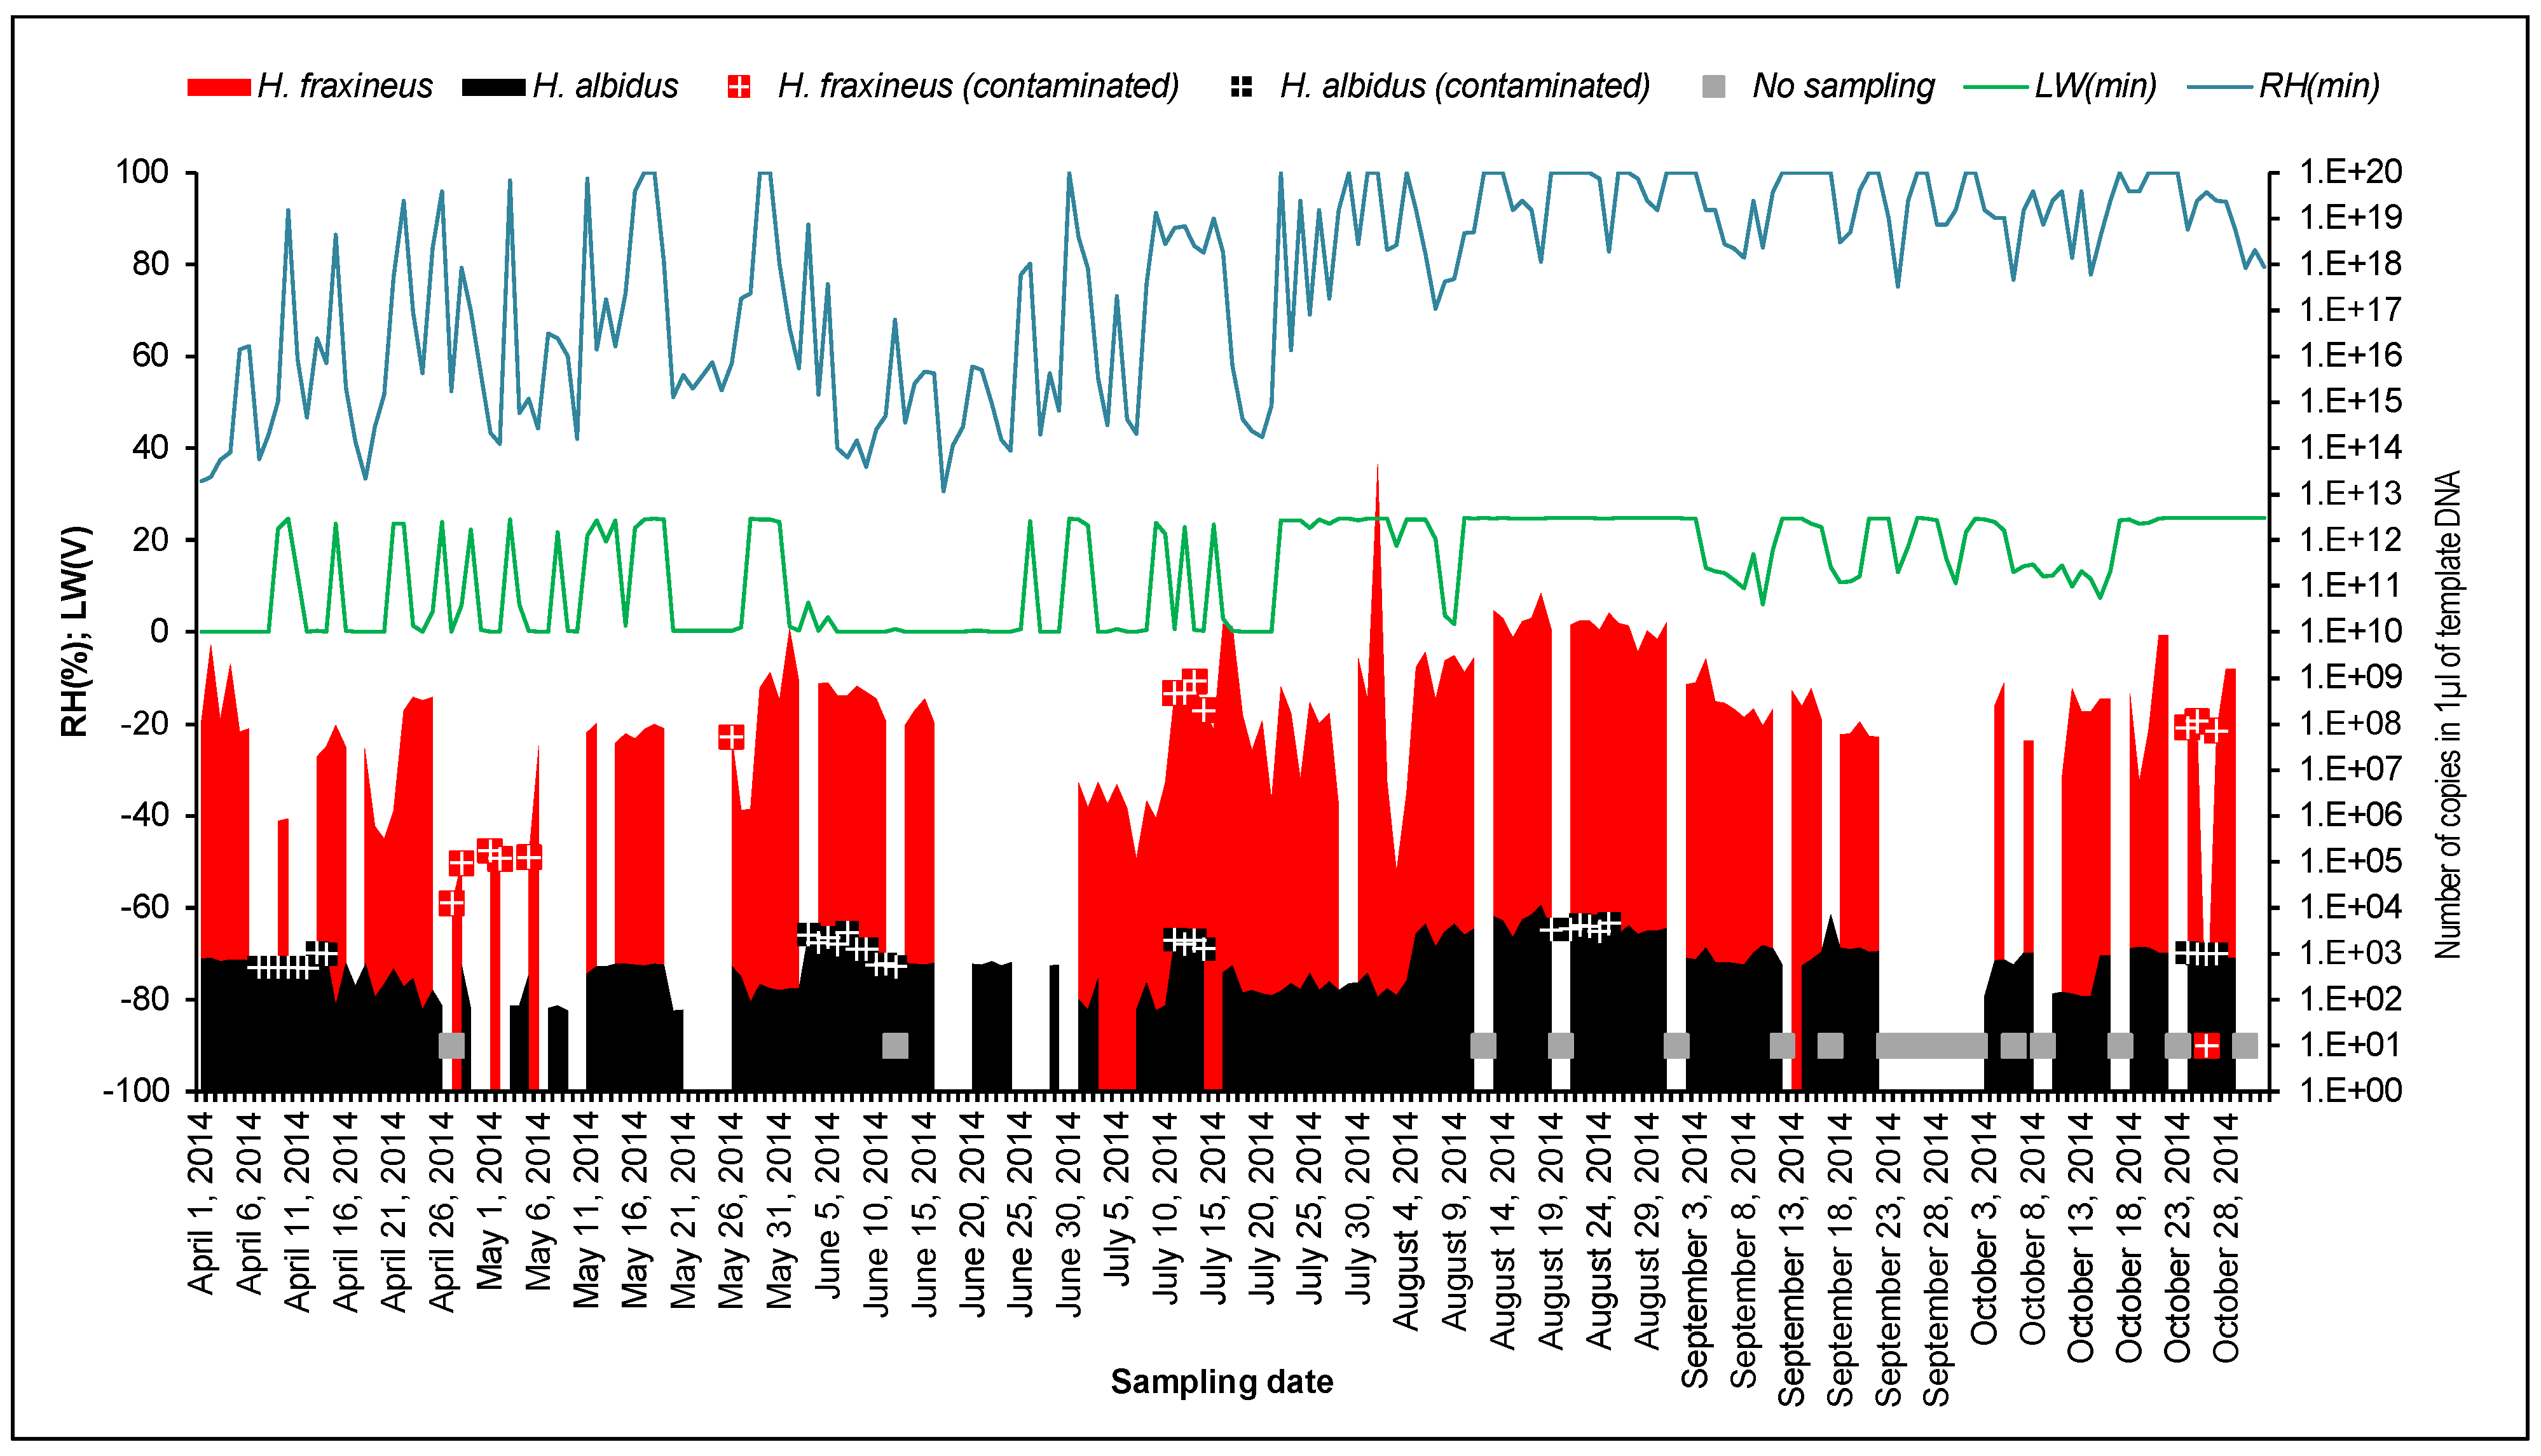
3.1. Detection of H. fraxineus and H. albidus Air Inoculum

DNA of both target fungi was detected in the samples from the beginning of the experiment (April 1) until almost the end (29 October) (Figure 3). The period of highest and most sustainable amount of air-inoculum of both fungi was determined from 13 August to 31 August. The amounts of H. fraxineus ascospores were ranging between 0 and 4.83 × 10¹¹ per 1 m3 of air sampled by SAVST, respectively, were 0 and 6.98 × 10⁷ sampled by RAST. However, the period of permanent occurrence of air-inoculum can be pointed from the beginning of July until the end of September with extremely variable values, i.e., 1 August, 4.83 × 10¹¹ and 3 August, 4.20 ascospores per 1 m3 of air sampled by SAVST. The long-term occurrence of air-inoculum was also observed during other months. The beginning and second half of April show values up to 1.89 × 10⁶, which decreased to a couple of tens of thousands in mid-May, the values of the first half of June are in the hundreds of thousands of ascospores per m3 sampled by SAVST. The end of the season in October also showed very high concentrations, sometimes even higher than 107 ascospores per 1 m3 (SAVST), but not so continuously.
Figure 3. Seasonal spore dispersal pattern of H. fraxineus and H. albidus (numbers of copies of the target sequence in 1 µL of template DNA in particular days of sampling by SAVST in logarithmic scale), accompanied by curve of minimal leaf wetness (LW—dimensionless value) and minimal air relative humidity (RH—%). Black squares with grey “X” indicate days without sampling, black or grey squares with white “+” are qPCR results of reaction with contamination in negative control of DNA extraction.
Forests 07 00001 g003
Matured fruiting bodies of Hymenoscyphus spp. on leaf petioles were found from the half of June until the half of September. The air sampling was interrupted by few technical problems causing one-day and 10-days long gaps (23 September–2 October). Other losses of data were caused by possible contamination of samples during DNA extraction, which revealed positive detection of negative controls of extraction. All failures are indicated in the Figure 3. These missing and/or unreliable data were discarded from all analyses.

3.2. Comparison of Different Air Samplers

Efficiency of SAVST and RAST with tape and petroleum jelly as trapping medium was tested separately for H. fraxineus and H. albidus. Numbers of detected copies are displayed in the Figure 4. One-way ANOVA did not indicate any significant differences between spore traps collecting H. fraxineus (F = 0.67, p = 0.53), however, it revealed differences (F = 4.06, p = 0.04) between SAVST and RAST with tape as the trapping medium among H. albidus detection (p = 0.02), showing higher mean value of RAST with tape. RASTs did not detect air inoculum in few of the cases. RAST with petroleum jelly as trapping medium failed in three samplings. It did not detect H. fraxineus in two and H. albidus in one case. RAST equipped by tape failed only once with a false negative detection of H. albidus.
Figure 4. Comparison of different air samplers: SAVST = seven-day automatic volumetric spore trap; RAST-tape = rotating arm spore trap with double sided tape as the trapping medium; RAST-jelly = rotating arm spore trap with petroleum jelly as the trapping medium. Values are expressed as numbers of copies of the target sequence in 1 µL of template DNA in particular period of sampling in logarithmic scale.
Forests 07 00001 g004

3.3. qPCR Detection of H. fraxineus and H. albidus

The copy number of H. fraxineus varied from 0 to 4.51 × 10¹³ (Figure 3), recalculated to the number of ascospores it corresponds to 0 to 6.96 × 10¹². According to the sampling rate of SAVST, it means a concentration of 4.83 × 10¹¹ ascospores per 1 m3. The number of H. albidus copies per 1µL of qPCR product were considerably lower; 0 to 1.23 × 10⁴ (Figure 3).
Positive number of H. albidus copies ranged from 2.528−10% to 0.214% with a mean value 2.702−4% of positive concentrations of H. fraxineus. Comparison of H. fraxineus x H. albidus ascospore concentration resulted in highly significant regression models (3) and (4) (R2 = 0.29; F = 47.8; df = 117; p = 0.00), respectively:
[ H f r a x = 10 4.542126 + 1.375042 × log H a l b ]
resp.:
[ H a l b = 10 0.983776 + 0.211033 × log H f r a x ]
where: Hfrax = number of H. fraxineus copies; Halb = number of H. albidus copies.

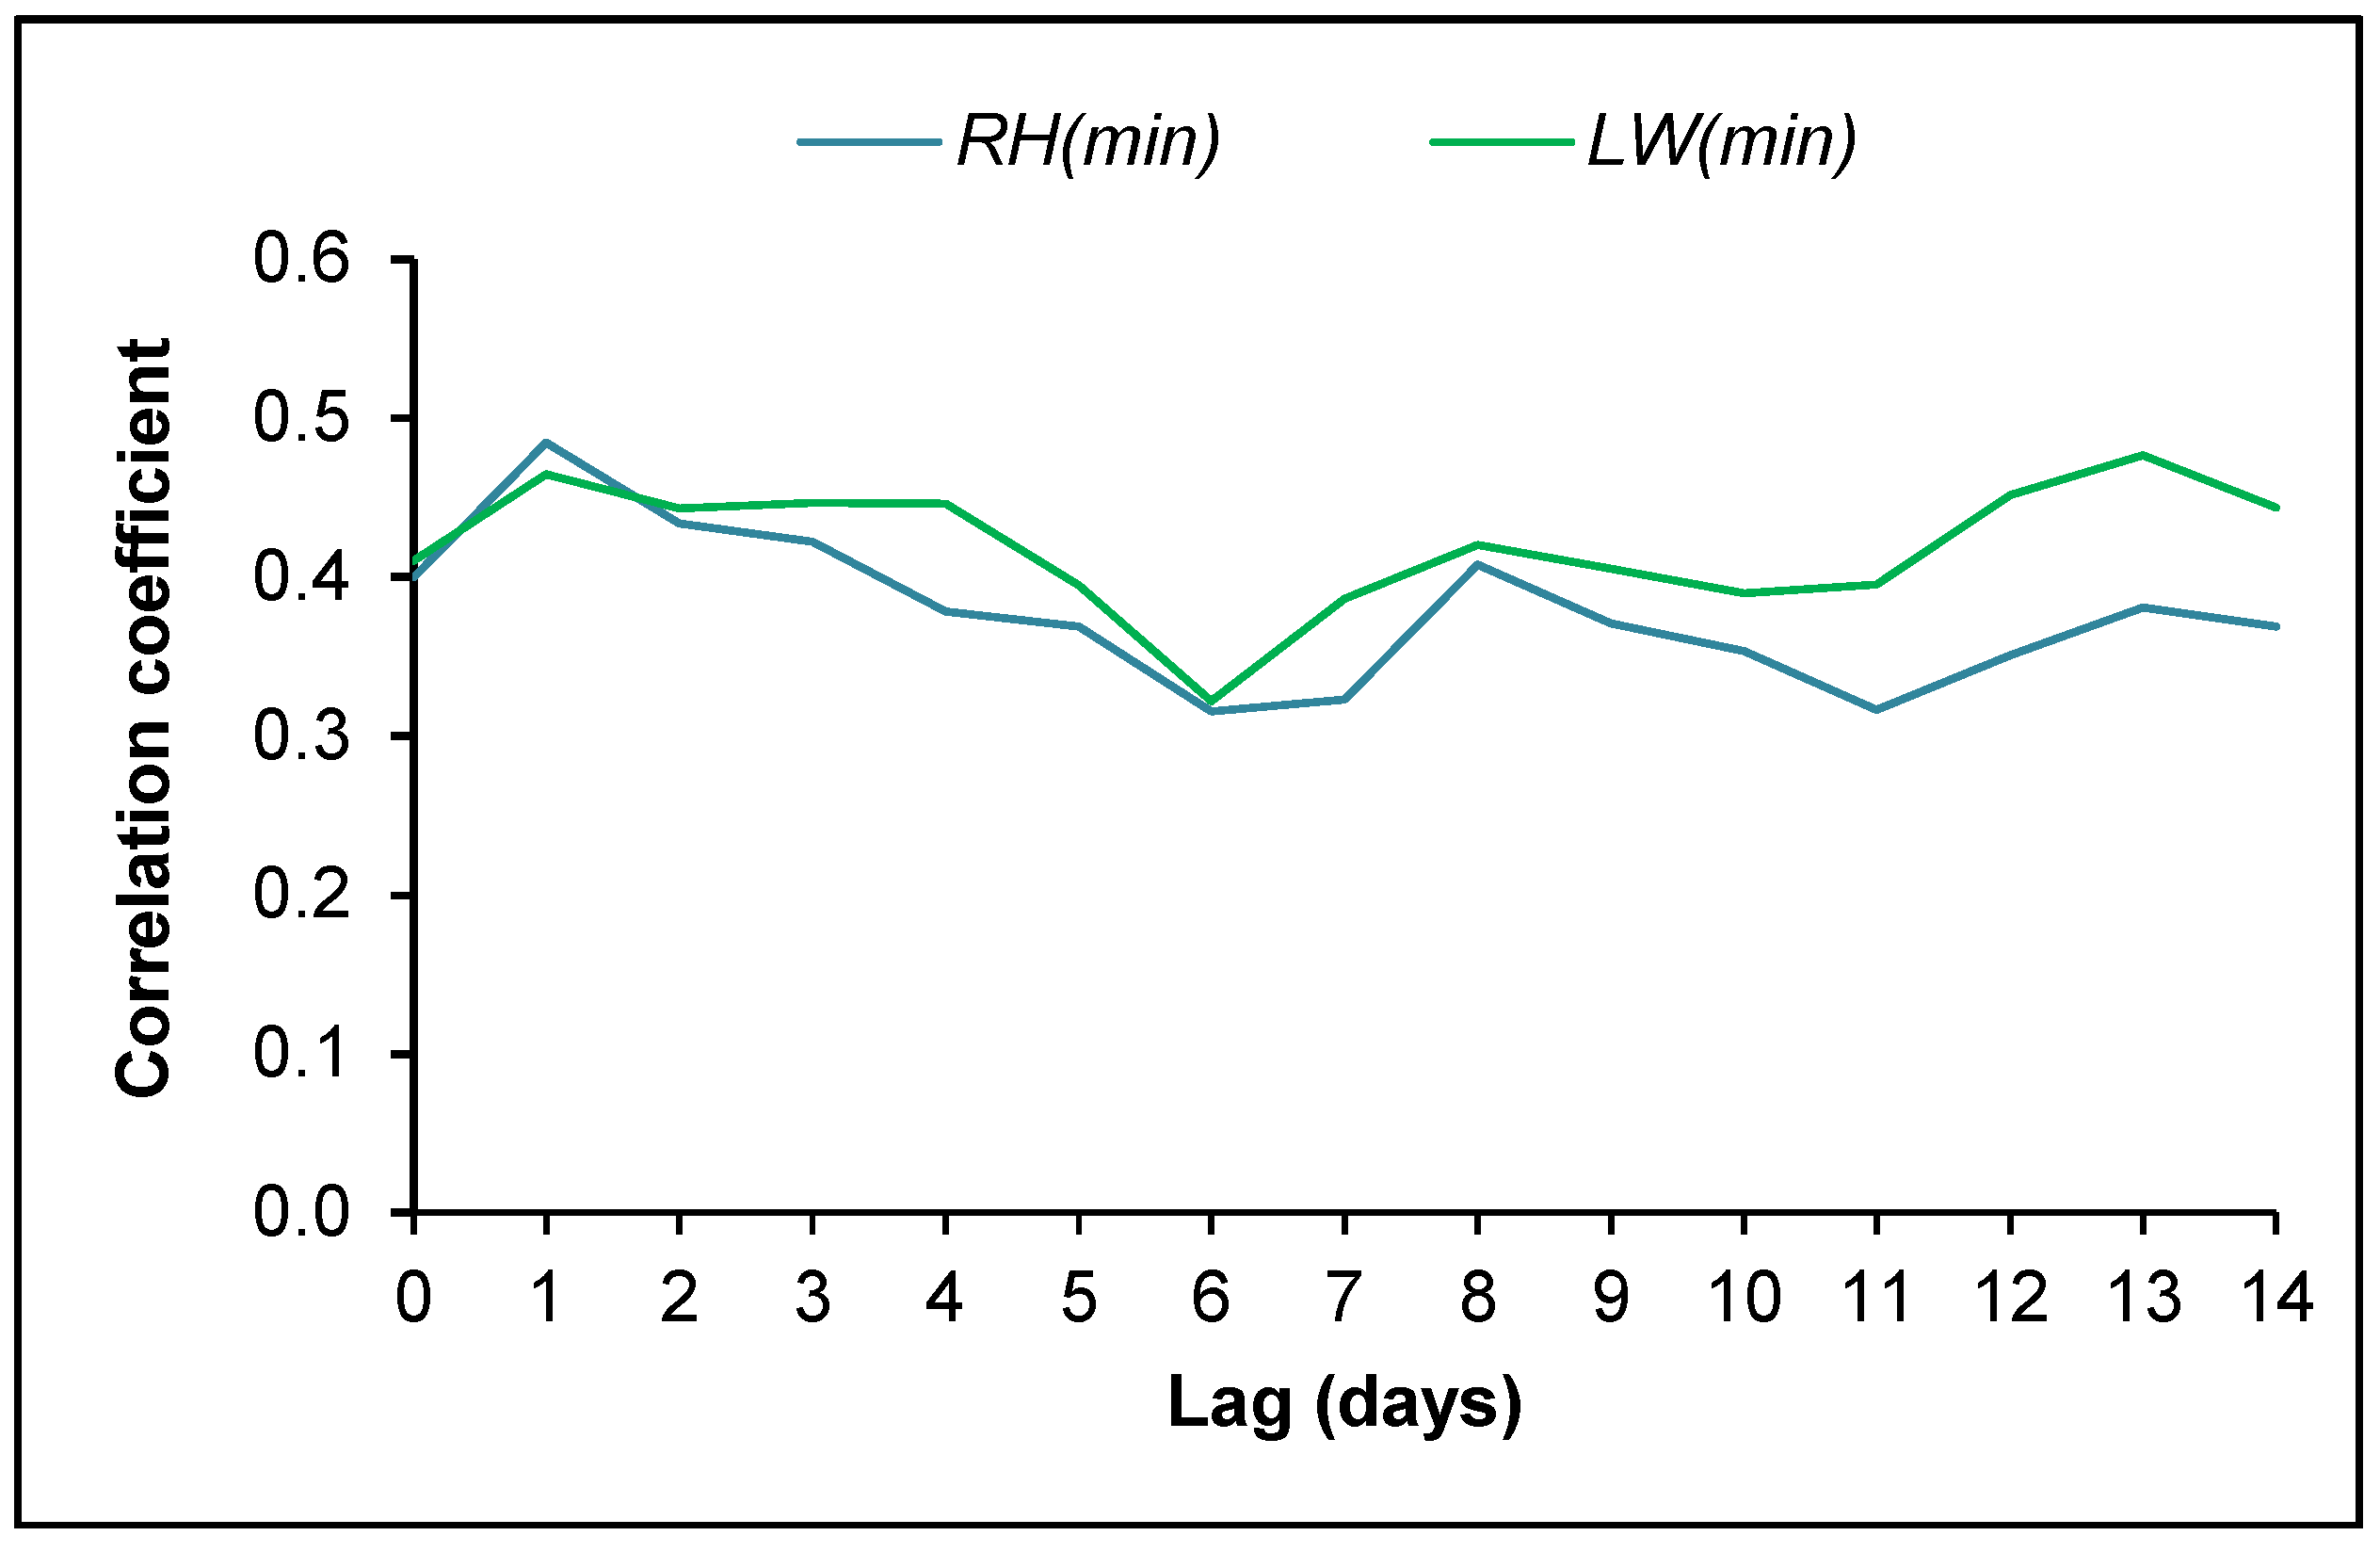
3.4. Ascospore Occurrence vs. Meteorological Data

The highest significant correlation coefficients with H. fraxineus air-inoculum records were reached with (i) daily minimal relative humidity (R = 0.485) one day before the air-inoculum record and (ii) daily minimal leaf wetness (R = 0.477) 13 days before the air-inoculum record (Figure 5). These two meteorological parameters variables are closely related to each other (R = 0.834) and its influence in the air-inoculum production of H. albidus is very similar (Figure 6). A negative effect of the low relative humidity and leaf wetness on the occurrence of air-inoculum was appreciated from 22 to 26 May, when no ascospores were detected after 1–2 days of a sudden drop of these variables.
Figure 5. Correlation (R) of leaf wetness (LW) and air relative humidity (RH) with H. fraxineus air inoculum lag (days).
Forests 07 00001 g005
Figure 6. Correlation (R) of leaf wetness (LW) and air relative humidity (RH) with H. albidus air inoculum lag (days).
Forests 07 00001 g006

4. Discussion

4.1. Detection of Air-Inoculum

Since ash dieback was observed in the Czech Republic since late 1990’s and detected in 2007 [22] the disease has spread over forests, plantations, urban areas, and nurseries throughout the country [23]. However, no biological studies about the causal agent of ash dieback had been carried out in our country so far. Our results demonstrate that H. fraxineus and H. albidus are present in the air of the infected forest Hackerova školka since the beginning of April until the end of October (Figure 3), what means some time before and after the ascospores are known to be released and wind-dispersed in nature [7,12,13,14]. These results are supported by two independent air sampling technics. Ascospore dispersal reached the highest values in August, which is in agreement with the findings obtained by Hietala et al. [13]. Based on the hypothetical life cycle of H. fraxineus depicted by Gross et al. [7], we consider that, despite not observing fresh fruiting bodies on ash rachises, the air-inoculum detected in October may correspond to late produced ascospores that remain in the air. Long distance transport of inoculum by air masses [27] cannot be neglected, but the authors throughout Europe limited the ascospore release season equally [7,10,12,13,14]. Therefore, there is no reason to await long distance-transported inoculum apart from the main season of ascospore production, although we cannot fully rule out the possible occurrence of conidia. Conidia of the anamorphic stage of H. fraxineus do not directly serve to the spread of the pathogen, but they might act as spermatia produced on petioles of ash leaves in autumn [14]. However, there is a major technical concern. As it is discussed further in the text, RAST which, together with SAVST, were also used for sampling during October, detected H. fraxineus. The size of H. fraxineus conidia is known to be up to 7 × 2.5 µm [4]. RASTs used in this study are not efficient enough to collect such small particles. An equation calculating the sampling efficiency of RAST according to the performance of RAST and particle parameters [28] assessed the efficiency for the conidia tending to zero. Nevertheless, only SAVST was used in the experiment during spring. The sampling efficiency of original Burkard seven-day volumetric spore trap (similar construction to SAVST made by AMET) is almost not affected by particle size [29], therefore it has the capacity to detect such small particles, even if they are not airborne (proven on SAVST made by AMET) [30]. Therefore, we are tempted to believe that what is detected in early spring (beginning of April) might be (i) conidia (spermatia), which start to be dispersed to fertilize ascogonia [7]; (ii) ascospores from apothecia appearing in pseudoscplerotial petioles with postponed fructification [31]; and/or (iii) pseudosclerotia of disintegrated petioles which may become airborne particles.

4.2. Ascospore Production vs. Meteorological Data

Air humidity and leaf wetness were the most influential meteorological variables in the production of air-inoculum in our study. These factors are emphasized by other authors as crucial for ascospore release of plant pathogens [32,33,34]. Hietala et al. [13] highlighted the possible role of leaf wetness, especially the morning dew, which ensures the protection of H. fraxineus ascospores against desiccation. Our results support this hypothesis, showing highest influence of leaf wetness 1–2 days before air-inoculum records. Leaf wetness is an important factor not only for the propagule release, but also for their germination and infection process, which was proved in Venturia pirina causing the pear scab [35] or in Septoria apiicola infecting celery [36]. Our results show the highest correlation of relative humidity and air-inoculum records with around 13 days lag. According to Gross et al. [7] the high relative air humidity is important for the apothecium development, which is in accordance with our result. In conclusion, sufficient air humidity seems to be needed for the apothecial development and, 11–12 days after, when apothecium is mature, high leaf wetness enhances the ascospore release, which occurs with a delay of 1–2 days.

4.3. Absolute Quantification

The lowest detected amount of H. fraxineus was 10 ascospores contained in one prepared ascospore suspension. A very similar result was achieved when quantifying natural samples, such as the sample on April 27, in which nine ascospores were determined. This limit of detection is lower than the limit achieved by Chandelier et al. [10], whose limit was 20 ascospores in one sample. Hietala et al. [13] detected only amounts of ascospores higher than 10 pcs·m−3 of air with SAVST of the same parameters as used in our study. Recalculated to one sample, it means a detection limit of 144 ascospores per sample, which is also higher. Our methodology of DNA extraction, in which the disruption of the sample is performed with balotina beads combined with two different lysis buffers (as described before) together with qPCR measurement is, therefore, the most sensitive technique for detection of H. fraxineus and H. albidus in nature.

4.4. H. fraxineus vs. H. albidus

A major concern in our results is the coexistence of H. fraxineus and H. albidus in this forest, especially when some authors had pointed out that H. albidus appeared to be extinct in the Czech Republic [15]. H. albidus has been infrequently recorded in Europe over the last 150 years [15]. However, lastly, several authors have reported the presence of H. albidus in forests affected by H. fraxineus. Hietala et al. [13] recorded H. albidus ascospores in a diseased pure ash stand in Southern Norway, where the estimated ascospore number of H. albidus was less than half a percent of the H. fraxineus. Additionally, very low ascospore density in the air was recorded at a site with low ADB incidence in Southwest Belgium [10]. The most extended assumption proposes that H. albidus is being gradually shifted and suppressed by H. fraxineus, and whether it occurs is because ADB is not well-established in that area [10,16]. However, in our experiment H. albidus appears over the whole studied period. The amount of H. albidus spores was generally lower than H. fraxineus, but the occurrence of these two species showed a positive correlation supported by the regression model. Consequently, a case of cryptic extinction or suppression of H. albidus by H. fraxineus, such as those in Denmark or Scotland [16], does not seem to be happening in our locality. Unfortunately, we have no evidence of the real distribution and abundance of H. albidus prior to the invasion of H. fraxineus in the Czech Republic. However, in Hackerova školka the disease is thought to be present for at least 10 years [22], time enough for H. fraxineus to have effectively suppressed H. albidus if we compare it with McKinney et al. [16], who expected H. albidus to be excluded by H. fraxineus within five years.
Although the biology of H. albidus is not fully understood, it also forms white apothecia on fallen, previous year’s rachises and leaflet veins of ash leaves in summer and early autumn. The fungus also develops a “pseudosclerotial plate”, which may be apparent during the winter months, but no conidia e.g., acting as spermatia are described [15]. Our data suggest that its biological cycle overlaps H. fraxineus cycle, also in the periods when ascospore production is not very probable because of lack of apothecia. Their similar spore dispersal patterns could lead to hypothesize a possible misidentification due to an introgressive hybridization [37] of H. fraxineus (invader species) on H. albidus (local species). However, in most of the organisms this process seems to be problematic on nuclear ribosomal DNA, where the specific primers are located [17,26] because of a diverse set of processes [38]. Furthermore, in a recent study developed by Bengtsson et al. [39] substantial genetic differences were detected between the two species and no alleles were shared among the species. Nevertheless, further research regarding this genetic process should be conveniently addressed.

4.5. Comparison of Different Air-Samplers

According to the parametric test the use of SAVST or RAST for air-sampling of H. fraxineus give the same results. The sampling of H. albidus yields with only slightly higher values in case of RAST with double-sided tape. RAST performance gives a sampling rate of 68 L·min−1, which is 6.8-times higher in a volume of air than SAVST. On the other hand, this difference in sampled volume is balanced by the efficiency of sampling. According to Lacey and West [29] the efficiency of the Burkard seven-day volumetric spore trap (similar construction to SAVST used in this study) is almost indifferent to the size of sampled particles, if the particles are bigger than 2 µm. This limit cannot affect the sampling of ascospores of H. fraxineus and H. albidus, whose size is 13–21 × 3.5–5 µm [2,9]. RASTs are generally not suitable for sampling of very small particles [28,21,20,29]. Noll [28] published an equation to calculate the efficiency of RASTs according to the speed of rotation, width of trapping rods and spherical diameter of the sampled particles, corrected by other environmental variables. Chandelier et al. [10] calculated the efficiency of the same RASTs, which are used in this study for sampling of H. fraxineus ascospores. The result was 10%–15%. Such efficiency means an effective RAST sampling rate (sampled air volume multiplied by efficiency/100) of 6.8–10.2 L·min−1. This interval already comprises the sampling rate of SAVST (10 L·min−1), which clarifies the same results of these two different air sampling techniques. Comparing the number of negative detections, double-sided non-woven tape (Tesa®) was slightly more successful in RAST than petroleum jelly. It is probably more stable at high temperatures, when petroleum jelly seems to be absorbed by the wood of the rods because of its lower viscosity. Rods with absorbed petroleum jelly are not sticky enough and particles are not trapped appropriately. This problem can be solved by using another material of rods, e.g., brass, glass, stainless steel, or plastic. Anyway, this part of comparison is not supported statistically and it would demand further testing with more repetitions.

5. Conclusions

We profiled the airborne inoculum of the pathogen H. fraxineus and the harmless species H. albidus in a Czech forest since the beginning of April until the end of October 2014. The spore production of H. fraxineus was considerably higher but both species appeared to have a similar spore dispersal pattern, significantly influenced by the air humidity and leaf wetness. In addition, both types of spore traps used for the experiment were similarly effective and our process of DNA extraction, complemented with qPCR techniques appear to be remarkably sensitive to detect H. fraxineus and H. albidus in nature.

Acknowledgments

This work was supported by COST Action FP1103: Fraxinus dieback in Europe: elaborating guidelines and strategies for sustainable management (FRAXBACK), the project COST LD13020: “Infection biology of Chalara fraxinea and factors influencing fructification of teleomorph Hymenoscyphus pseudoalbidus, causal agent of Ash dieback” and by the project of the National Agency of Agricultural Research QJ1220218: “The development of effective measurements eliminating the impact of Chalara fraxinea in forest nursery and in subsequent aspects of forest and water management.” Furthermore, we would like to thank to Bc. Lenka Vrtěnová for maintaining of SAVST.

Author Contributions

M.D. designed and performed the field experiments, extracted DNA of air-samples, prepared spore suspensions and analysed the data; G.R. optimized and performed qPCR analyses; L.B. prepared plasmids for absolute quantification and corrected the language of the paper; M.D. and L.B. wrote the paper.

Conflicts of Interest

The authors declare no conflict of interest.

References

  1. Queloz, V.; Grünig, C.R.; Berndt, R.; Kowalski, T.; Sieber, T.N.; Holdenrieder, O. Cryptic speciation in Hymenoscyphus albidus. For. Pathol. 2011, 41, 133–142. [Google Scholar] [CrossRef]
  2. Kowalski, T.; Holdenrieder, O. Pathogenicity of Chalara fraxinea. For. Pathol. 2009, 39, 1–7. [Google Scholar] [CrossRef]
  3. Zhao, Y.; Hosoya, T.; Baral, H.O.; Hosaka, K.; Kakishima, M. Hymenoscyphus pseudoalbidus, the correct name for Lambertelle albida reported from Japan. Mycotaxon 2012, 122, 25–41. [Google Scholar] [CrossRef]
  4. Kowalski, T. Chalara fraxinea sp. nov. associated with dieback of ash (Fraxinus excelsior) in Poland. For. Pathol. 2006, 36, 264–270. [Google Scholar] [CrossRef]
  5. Pautasso, M.; Aas, G.; Queloz, V.; Holdenrieder, O. European ash (Fraxinus excelsior) dieback—A conservation biology challenge. Biol. Conserv. 2013, 158, 37–49. [Google Scholar] [CrossRef]
  6. Kräutler, K.; Treitler, R.; Kirisits, T. Hymenoscyphus fraxineus can directly infect intact current-year shoots of Fraxinus excelsior and artificially exposed leaf scars. For. Pathol. 2015, 45, 274–280. [Google Scholar] [CrossRef]
  7. Gross, A.; Zaffarano, P.L.; Duo, A.; Grünig, C.R. Reproductive mode and life cycle of the ash dieback pathogen Hymenoscyphus pseudoalbidus. Fungal Genet. Biol. 2012, 49, 977–986. [Google Scholar] [CrossRef] [PubMed]
  8. Husson, C.; Caël, O.; Grandjean, J.P.; Nageleisen, L.M.; Marçais, B. Occurrence of Hymenoscyphus pseudoalbidus on infected ash logs. Plant Pathol. 2012, 61, 889–895. [Google Scholar] [CrossRef]
  9. Kirisits, T.; Schwanda, K. First definite report of natural infection of Fraxinus ornus by Hymenoscyphus fraxineus. For. Pathol. 2015, 45, 430–432. [Google Scholar] [CrossRef]
  10. Chandelier, A.; Helson, M.; Dvorak, M.; Gischer, F. Detection and quantification of airborne inoculum of Hymenoscyphus pseudoalbidus using real-time PCR assays. Plant Pathol. 2014, 63, 1296–1305. [Google Scholar] [CrossRef]
  11. Gross, A.; Holdenrieder, O.; Pautasso, M.; Queloz, V.; Sieber, T.N. Hymenoscyphus pseudoalbidus, the causal agent of European ash dieback. Mol. Plant Pathol. 2014, 15, 5–21. [Google Scholar] [CrossRef] [PubMed]
  12. Timmermann, V.; Borja, I.; Hietala, A.M.; Kirisits, T.; Solheim, H. Ash dieback: Pathogen spread and diurnal patterns of ascospore dispersal, with special emphasis on Norway. EPPO Bull. 2011, 41, 14–20. [Google Scholar] [CrossRef]
  13. Hietala, A.M.; Timmermann, V.; Borja, I.; Solheim, H. The invasive ash dieback pathogen Hymenoscyphus pseudoalbidus exerts maximal infection pressure prior to the onset of host leaf senescence. Fungal Ecol. 2013, 6, 302–308. [Google Scholar] [CrossRef]
  14. Kowalski, T.; Bartnik, C. Morphological variation in colonies of Chalara fraxinea isolated from ash (Fraxinus excelsior L.) stems with symptoms of dieback and effects of temperature on colony growth and structure. Acta Agrobot. 2010, 63, 99–106. [Google Scholar] [CrossRef]
  15. Baral, H.; Bemmann, M. Hymenoscyphus fraxineus vs. Hymenoscyphus albidus—A comparative light microscopic study on the causal agent of European ash dieback and related foliicolous, stroma-forming species. Mycology 2014, 5, 228–290. [Google Scholar] [CrossRef] [PubMed]
  16. McKinney, L.V.; Thomsen, I.M.; Kjær, E.D.; Bengtsson, S.B.K.; Nielsen, L.R. Rapid invasion by an aggressive pathogenic fungus (Hymenoscyphus pseudoalbidus) replaces a native decomposer (Hymenoscyphus albidus): A case of local cryptic extinction? Fungal Ecol. 2012, 5, 663–669. [Google Scholar] [CrossRef]
  17. Husson, C.; Scala, B.; Caël, O.; Frey, P.; Feau, N.; Ioos, R. Chalara fraxinea is an invasive pathogen in France. Eur. J. Plant Pathol. 2011, 130, 311–324. [Google Scholar] [CrossRef]
  18. Hirst, J.M. An automatic volumetric spore-trap. Ann. App. Biol. 1952, 36, 257–265. [Google Scholar] [CrossRef]
  19. Perkins, W.A. The Rotorod Sampler; 2nd Semiannual Report; Aerosol Laboratory Department of Chemistry and Chemical Engineering, Stanford University; CML: Stanford, CA, USA, 1957; Volume 66, p. 186. [Google Scholar]
  20. McCartney, H.A.; Fitt, B.D.L.; Schmechel, D. Sampling bioaerosols in plant pathology. J. Aerosol Sci. 1997, 28, 349–364. [Google Scholar] [CrossRef]
  21. Dhingra, O.; Sinclair, J.B. Basic Plant Pathology Methods; CRC Press, Inc.: Boca Raton, FL, USA, 1985; p. 376. [Google Scholar]
  22. Jankovsky, L.; Holdenrieder, O. Chalara fraxinea—Ash Dieback in the Czech Republic. Plant Prot. Sci. 2009, 45, 74–78. [Google Scholar]
  23. Hanackova, Z.; Koukol, O.; Havrdova, L.; Gross, A.; Cleary, M. Local population structure of Hymenoscyphus fraxineus surveyed by an enlarged set of microsatellite markers. For. Pathol. 2015. [Google Scholar] [CrossRef]
  24. Hospodsky, D.; Yamamoto, N.; Peccia, J. Accuracy, precision, and method detection limits of quantitative PCR for airborne bacteria and fungi. Appl. Environ. Microbiol. 2010, 76, 7004–7012. [Google Scholar] [CrossRef] [PubMed]
  25. Vainio, E.J.; Korhonen, K.; Hantula, J. Genetic variation in Phlebiopsis gigantea as detected with random amplified microsatellite (RAMS) markers. Mycol. Res. 1998, 102, 187–192. [Google Scholar] [CrossRef]
  26. Chandelier, A.; André, F.; Laurent, F. Detection of Chalara fraxinea in common ash (Fraxinus excelsior) using real time PCR. For. Pathol. 2010, 40, 87–95. [Google Scholar] [CrossRef]
  27. Sadys, M.; Skjøth, C.; Kennedy, R. Back-trajectories show export of airborne fungal spores (Ganoderma sp.) from forests to agricultural and urban areas in England. Atmos. Environ. 2014, 84, 88–99. [Google Scholar] [CrossRef]
  28. Noll, K.E. A rotary inertial impactor for sampling giant particles in the atmosphere. Atmos. Environ. 1970, 4, 9–19. [Google Scholar] [CrossRef]
  29. Lacey, M.E.; West, J.S. The Air Spora; Springer: Dordrecht, The Netherlands, 2006. [Google Scholar]
  30. Dvorak, M.; Jankovsky, L.; Drapela, K. Dothistroma septosporum: Spore production and weather conditions. For. Syst. 2012, 21, 323–328. [Google Scholar] [CrossRef]
  31. Gross, A.; Holdenrieder, O. On the longevity of Hymenoscyphus pseudoalbidus in petioles of Fraxinus excelsior. For. Pathol. 2013, 43, 168–170. [Google Scholar] [CrossRef]
  32. Brook, P.J. Effects of light, temperature, and moisture on release of ascospores by Venturia inaequalis (Cke.) Wint. N. Z. J. Agric. Res. 1969, 12, 214–227. [Google Scholar] [CrossRef]
  33. Villalta, O.; Washington, W.S.; Kita, N.; Bardon, D. The use of weather and ascospore data for forecasting apple and pear scab in Victoria, Australia. Australas. Plant Pathol. 2002, 31, 205–215. [Google Scholar] [CrossRef]
  34. McCartney, H.A.; Lacey, M.E. The production and release of ascospores of Pyrenopeziza brassicae on oilseed rape. Plant Pathol. 2007, 39, 17–32. [Google Scholar] [CrossRef]
  35. Villalta, O.; Washington, W.S.; Rimmington, G.M.; Taylor, P.A. Effects of temperature and leaf wetness duration on infection of pear leaves by Venturia pirina. Crop Pasture Sci. 1999, 51, 97–106. [Google Scholar] [CrossRef]
  36. Mathieu, D. Effects of temperature and leaf wetness duration on the infection of celery by Septoria apiicola. Phytopathology 1993, 83, 1036–1040. [Google Scholar] [CrossRef]
  37. Mooney, H.A.; Cleland, E.E. The evolutionary impact of invasive species. Proc. Natl. Acad. Sci. USA 2001, 98, 5446–5451. [Google Scholar] [CrossRef] [PubMed]
  38. Vollmer, S.V.; Palumbi, S.R. Testing the utility of internally transcribed spacer sequences in coral phylogenetics. Mol. Ecol. 2004, 13, 2763–2772. [Google Scholar] [CrossRef] [PubMed]
  39. Bengtsson, S.B.K.; Vasaitis, R.; Kirisits, T.; Solheim, H.; Stenlid, J. Population structure of Hymenoscyphus pseudoalbidus and its genetic relationship to Hymenoscyphus albidus. Fungal Ecol. 2012, 5, 147–153. [Google Scholar] [CrossRef]

