1. Introduction
Oil sands mining developments in northern Alberta, Canada have currently (as of December 2012) disturbed 767 km
2 of boreal forest, with the total surface mineable area being 4800 km
2 [
1] which will likely be developed over the coming decades. Of this disturbed area, only 77 km
2 has been reclaimed which means that reclamation activities will be increasing in the future. Therefore, any lessons learned and risks identified now at the relatively early stages of reclamation in this region will have the potential to greatly influence future reclamation operations and the resulting forest ecosystems as they develop. The overall goal for land reclamation after oil sands mining is to create a self-sustaining, locally common boreal forest that is on a similar developmental trajectory as native forests [
2]. More specifically, naturally occurring site types are being targeted for the future forest ecosystems. However, vegetation community establishment changes substantially during early development and may not stabilize until the stand reaches approximately 20 years of age [
3,
4].
Long-term monitoring plots offer one way of determining if reclaimed ecosystems are developing in a manner consistent with natural eco-sites and if vegetation community dynamics in stands <20 years of age are developing as expected. In the oil sands area of northern Alberta, the Cumulative Environmental Management Association (CEMA), a multi-stakeholder group responsible for developing guidance documents that provide recommendations and best practices for land reclamation in the area, has established a long-term plot network (LTPN) designed to do this. Specifically, the key objectives of the LTPN were to track the progression of plant communities and soils across different reclaimed site types in relation to natural forest ecosystems in the area [
5]. The objectives of the LTPN have recently been re-focused to evaluate the effectiveness of the guidance documents, not the effectiveness of the reclamation itself.
The land reclamation operations used to create the future forest ecosystems all follow a similar pattern. Initial landforms are created using either tailings sand or finer textured overburden material. This material may have chemical or physical limitations to plant growth, such as high salinity or bulk density, so it is covered by up to 2 m of suitable reclamation soil material. This is then covered by approximately 0.2–0.5 m of an organic matter rich cover soil. In past reclamation activities, most of this organic matter was derived from peat salvaged from wetland bogs and fens and is referred to as peat–mineral mix. The peat used in this constructed soil is mainly of fen origin and composed of
Sphagnum, brown moss and
Carex peat. The mineral soil component is from the naturally occurring mineral soil underlying the peat deposit. The ratio of peat to mineral soil ranges from almost pure peat to a 60:40 peat to mineral ratio depending on the specific location. Due to its abundance in the region, peat-based soils will be very common in the final reclaimed landscapes. Some of the potential benefits of using peat–mineral mix soil are related to higher natural tree establishment rates [
6], high initial tree growth rates [
7], and high nitrogen mineralization rates [
8]. However, the longer term sustainability of these soils has not been verified for all ecosystem attributes. The reclaimed areas in which the LTPN plots are established were generally constructed in this fashion using peat–mineral mix as the surface soil so the main differences among reclamation sites are in the lower soil layers. Newer reclamation techniques, including the use of upland forest floor material [
9], application of coarse woody debris [
10] or the creation of wetlands [
11], are not included in this analysis of the LTPN.
The key metrics of ecosystem development measured on the LTPN plots relate to plant communities and soil, including vegetation structural attributes, species composition and soil nutrient availability. Major plant community groups such as forbs, graminoids and shrubs provide for a basic characterization of ecosystem structural attributes and in the boreal forest, newly disturbed areas tend to be dominated by forbs and graminoids with shrubs becoming a larger component of the ecosystem as the stand develops. Non-native species can be particularly problematic in heavily disturbed areas such as post-mining land reclamation areas [
12], as they have the potential to alter ecosystem development over time [
13]. Some non-native plant species, in particular agronomic species such as barley (
Hordeum vulgare) and alfalfa (
Medicago sativa), were intentionally planted in reclaimed areas to provide initial site stability, but non-native plants are generally absent from natural forests [
14]. Tree height growth provides a measure of site productivity and future land use potential for commercial forestry [
15]. The tree canopy also controls many environmental characteristics of the understory such as light availability, which in turn controls understory plant species composition with earlier successional species tending to be shade intolerant while later successional species are capable of growing in the shade of the understory. Soils provide water and nutrients to the plants growing on site with differences in moisture and nutrient regimes expected between different site types depending on factors such as topographic position, slope, aspect, soil texture, organic matter content and mineral composition. Soil nutrient availability differs between reclamation soil types and may be a limiting factor for plant development [
16]. The presence of a forest floor is a defining feature of forest soils and it plays a vital role in storing moisture, nutrients and carbon on site but the forest floor is completely lacking from newly created sites [
17]. All of these metrics of ecosystem development are likely to change over time and between site types and therefore may be good indicators of whether reclaimed ecosystems are on desired trajectories.
Much of the current oil sands reclamation research focusing on ecosystem development has utilized a similar approach of comparing reclaimed and natural ecosystems. This has been done for a variety of different ecosystem properties including soil microbial communities [
18], nutrient supply profiles [
19], aquatic vegetation [
20], and tree growth [
15]. Other studies have compared selected reclamation treatments to each other, but not necessarily to natural forests, in terms of initial plant community establishment [
21], tree growth [
22], tree seedling establishment [
6], soil nutrient availability [
16], or microbial communities [
23]. Most of these studies have shown significant differences in the studied ecosystem properties between different reclamation treatments and natural forests, but few studies have examined temporal changes on different reclamation site types. The unique aspect of our study is the replicated chronosequence analysis approach we have taken to analyze the most extensive oil sands reclamation dataset available from long-term monitoring plots. Specifically, the goal of this study is to examine the major plant community and soil nutrient availability trends in ecosystem development on different reclaimed site types in comparison to mature natural forests. This information can then be used to help prioritize future reclamation research and operational reclamation activities along with being used in the development of thresholds for reclamation certification in the context of developing functional and productive forests.
2. Methods
This analysis is based on the CEMA LTPN to examine upland forest development on reclaimed lands and mature natural forests in the mineable oil sands area of north-eastern Alberta north of the city of Fort McMurray (57°20′ N, 111°49′ W). The natural upland forest in the area is boreal mixed wood, which consists of mixtures of trembling aspen (
Populus tremuloides) and white spruce (
Picea glauca) with components of jack pine (
Pinus banksiana), balsam poplar (
Populus balsamifera), white birch (
Betula papyrifera) and balsam fir (
Abies balsamea) present on some sites [
24]. Approximately half of the landscape is upland forests while the other half is wetland bogs and fens dominated by black spruce (
Picea mariana) and tamarack (
Larix laricina). The most common natural upland eco-sites are drier sites on sandy soil (“a” and “b” ecosites referred to as dry site types) and more mesic sites on finer textured soils (“d” and “e” ecosites referred to as moist—rich site types) [
2,
25]. This region has a continental climate with long, cold winters and short, warm summers. Average temperatures range from −18.8 °C in January to 16.8 °C in July with a mean annual precipitation of 455 mm (Fort McMurray 1971–2000 Environment Canada climate normals).
The CEMA LTPN consists of 66 permanent plots located on reclaimed sites of a variety of ages and reclamation treatments and another 50 plots in mature, natural forest sites ([
5],
Table 1). The reclaimed sites range in age from 0 to 24 years while the mature stands are all greater than 50 years of age. Plots were initially located to capture the range of reclamation practices and site types common in the region. Measurements began in the year 2000 and new plots have been established in subsequent years and some reclaimed plots have been re-measured on a five-year interval resulting in a total of 116 measurements on reclaimed plots. The database used in this analysis was accessed in February 2014 and is based on measurements taken from 2000–2009. Since 2010, the LTPN has been redesigned with new plot layout and new measurements being taken beginning in 2013, but these have not been included in this analysis [
26].
Table 1.
Basic soil and stand type attributes for each site type and age grouping.
Table 1.
Basic soil and stand type attributes for each site type and age grouping.
| Site type | Major soil groups | Major stand types | Age | # plots |
|---|
| Dry | Reclaimed plots | Reclaimed plots | 0–2 | 7 |
| | Peat-mineral mix over tailing sand | Jack pine | | |
| | | Jack pine and aspen | 3–7 | 8 |
| | | Jack pine and white spruce | | |
| | | White spruce and aspen | 8–12 | 12 |
| | Natural plots | Natural plots | 13–17 | 16 |
| | Dystric brunisol | Jack pine | | |
| | | Jack pine and aspen | 18–24 | 10 |
| | | White spruce and aspen | | |
| | | | Mature (50+) | 25 |
| | | | | |
| Moist-rich | Reclaimed plots | Reclaimed plots | 0–2 | 22 |
| | Peat-mineral mix over overburden | White spruce and pine | | |
| | Mineral soil over overburden | White spruce and aspen | 3–7 | 17 |
| | | White spruce | | |
| | | | 8–12 | 14 |
| | Natural plots | Natural plots | | |
| | Gray luvisol | Aspen | 13–17 | 3 |
| | | White spruce and aspen | | |
| | | White spruce | 18–24 | 3 |
| | | Balsam poplar | | |
| | | | Mature (50+) | 25 |
Plot layout on the LTPN plots consists of a main 10 × 40 m plot [
5]. Tree height was measured for each canopy tree and averaged for the plot. Plant community measurements are taken from ten 0.4 × 1.0 m quadrats systematically located around the plot. Plant species cover was determined for each species in the quadrat and values for the plot are the average of 10 quadrats. Species richness was calculated as the total number of species per quadrat. Species were also grouped according to vegetation form including forbs, graminoids and shrubs and percent cover was determined for each of these groups. Non-native plant species were also identified and the total number of non-native species and the total cover of non-native species was calculated.
Soil parameters are based on composite samples from ten sub-samples taken by hand auger within each plot. Soils were sampled by layer (topsoil to 20 cm depth, upper subsoil and lower subsoil for reclaimed plots and soil horizons for natural plots) and pooled for subsequent analyses. Soil analyses focused on plant available nutrients in the topsoil for reclaimed plots and the A horizon for natural plots with total plant available nitrogen (sum of NO
3− and NH
4+), phosphorus, potassium and sulphur being measured for each plot. Soil analyses followed standard field and laboratory procedures including quality assurance and control procedures [
27]. Forest floor development was estimated by using percent litter cover from the plant community measurements. Other measurements, such as soil pH, bulk density and texture, foliar chemistry and soil metal concentrations were taken on some, but not all plots, and were therefore not included in the current analysis.
A variety of different reclamation treatments have been used and are represented in the LTPN. Generally though, peat–mineral mix was placed over finer textured overburden or coarser textured tailings sand. Other reclamation practices used on a small number of plots included using mineral soil directly as a topsoil layer and using petroleum coke as sub-surface substrate. All reclaimed plots were grouped into the same two categories of site types as the natural sites,
i.e., dry and moist-rich, based on the field determined soil moisture regime which was based on key features such as topography, parent material, soil drainage, water table depth and texture [
27]. Sites with sub-mesic, sub-xeric and xeric soil moisture regimes were classified as dry site types while sites with mesic and sub-hygric soil moisture regimes were classified as moist–rich site types. These soil moisture regimes correspond directly to the moisture regimes in the natural site types.
After reclamation soils were placed, all of the sites were planted with trees. Older sites were planted mainly with conifers such as white spruce and jack pine while newer sites also included planting deciduous trees such as trembling aspen. Fertilization and seeding of cover crops such as barley would have been applied to most, if not all, sites as this was the standard reclamation practice, but exact reclamation operational records for all sites are not available. However, the standard fertilization practice was to fertilize peat-based soils for up to five years with a balanced immediately available fertilizer such as 23.5-25-8, 29-9-9, or 31.5-16-5 N-P-K at a rate of 250–300 kg·ha−1. This is equivalent to an application rate of between 60–100 kg N·ha−1, 27–62 kg P·ha−1 and 15–27 kg K·ha−1 depending on fertilizer formulation and application rate.
Reclaimed plots were grouped into five age classes (0–2, 3–7, 8–12, 13–17, 18–24) labelled age 1, 5, 10, 15 and 20 respectively for each of the site type groups for analysis. All plot measurements, including re-measurements which represent only 44 of the 166 total plots, were included in the analysis as re-measurements were never in the same age group. Analysis consisted of two-way ANOVA to examine changes over time and between each site type for the soil and plant response variables on the reclaimed plots, and t-tests were used to compare variables between mature natural site types. Natural and reclaimed plots are not directly compared statistically but are presented to allow for comparisons. Statistical analyses were completed using Systat 13 (Systat Software Inc., Chicago, IL, USA).
3. Results
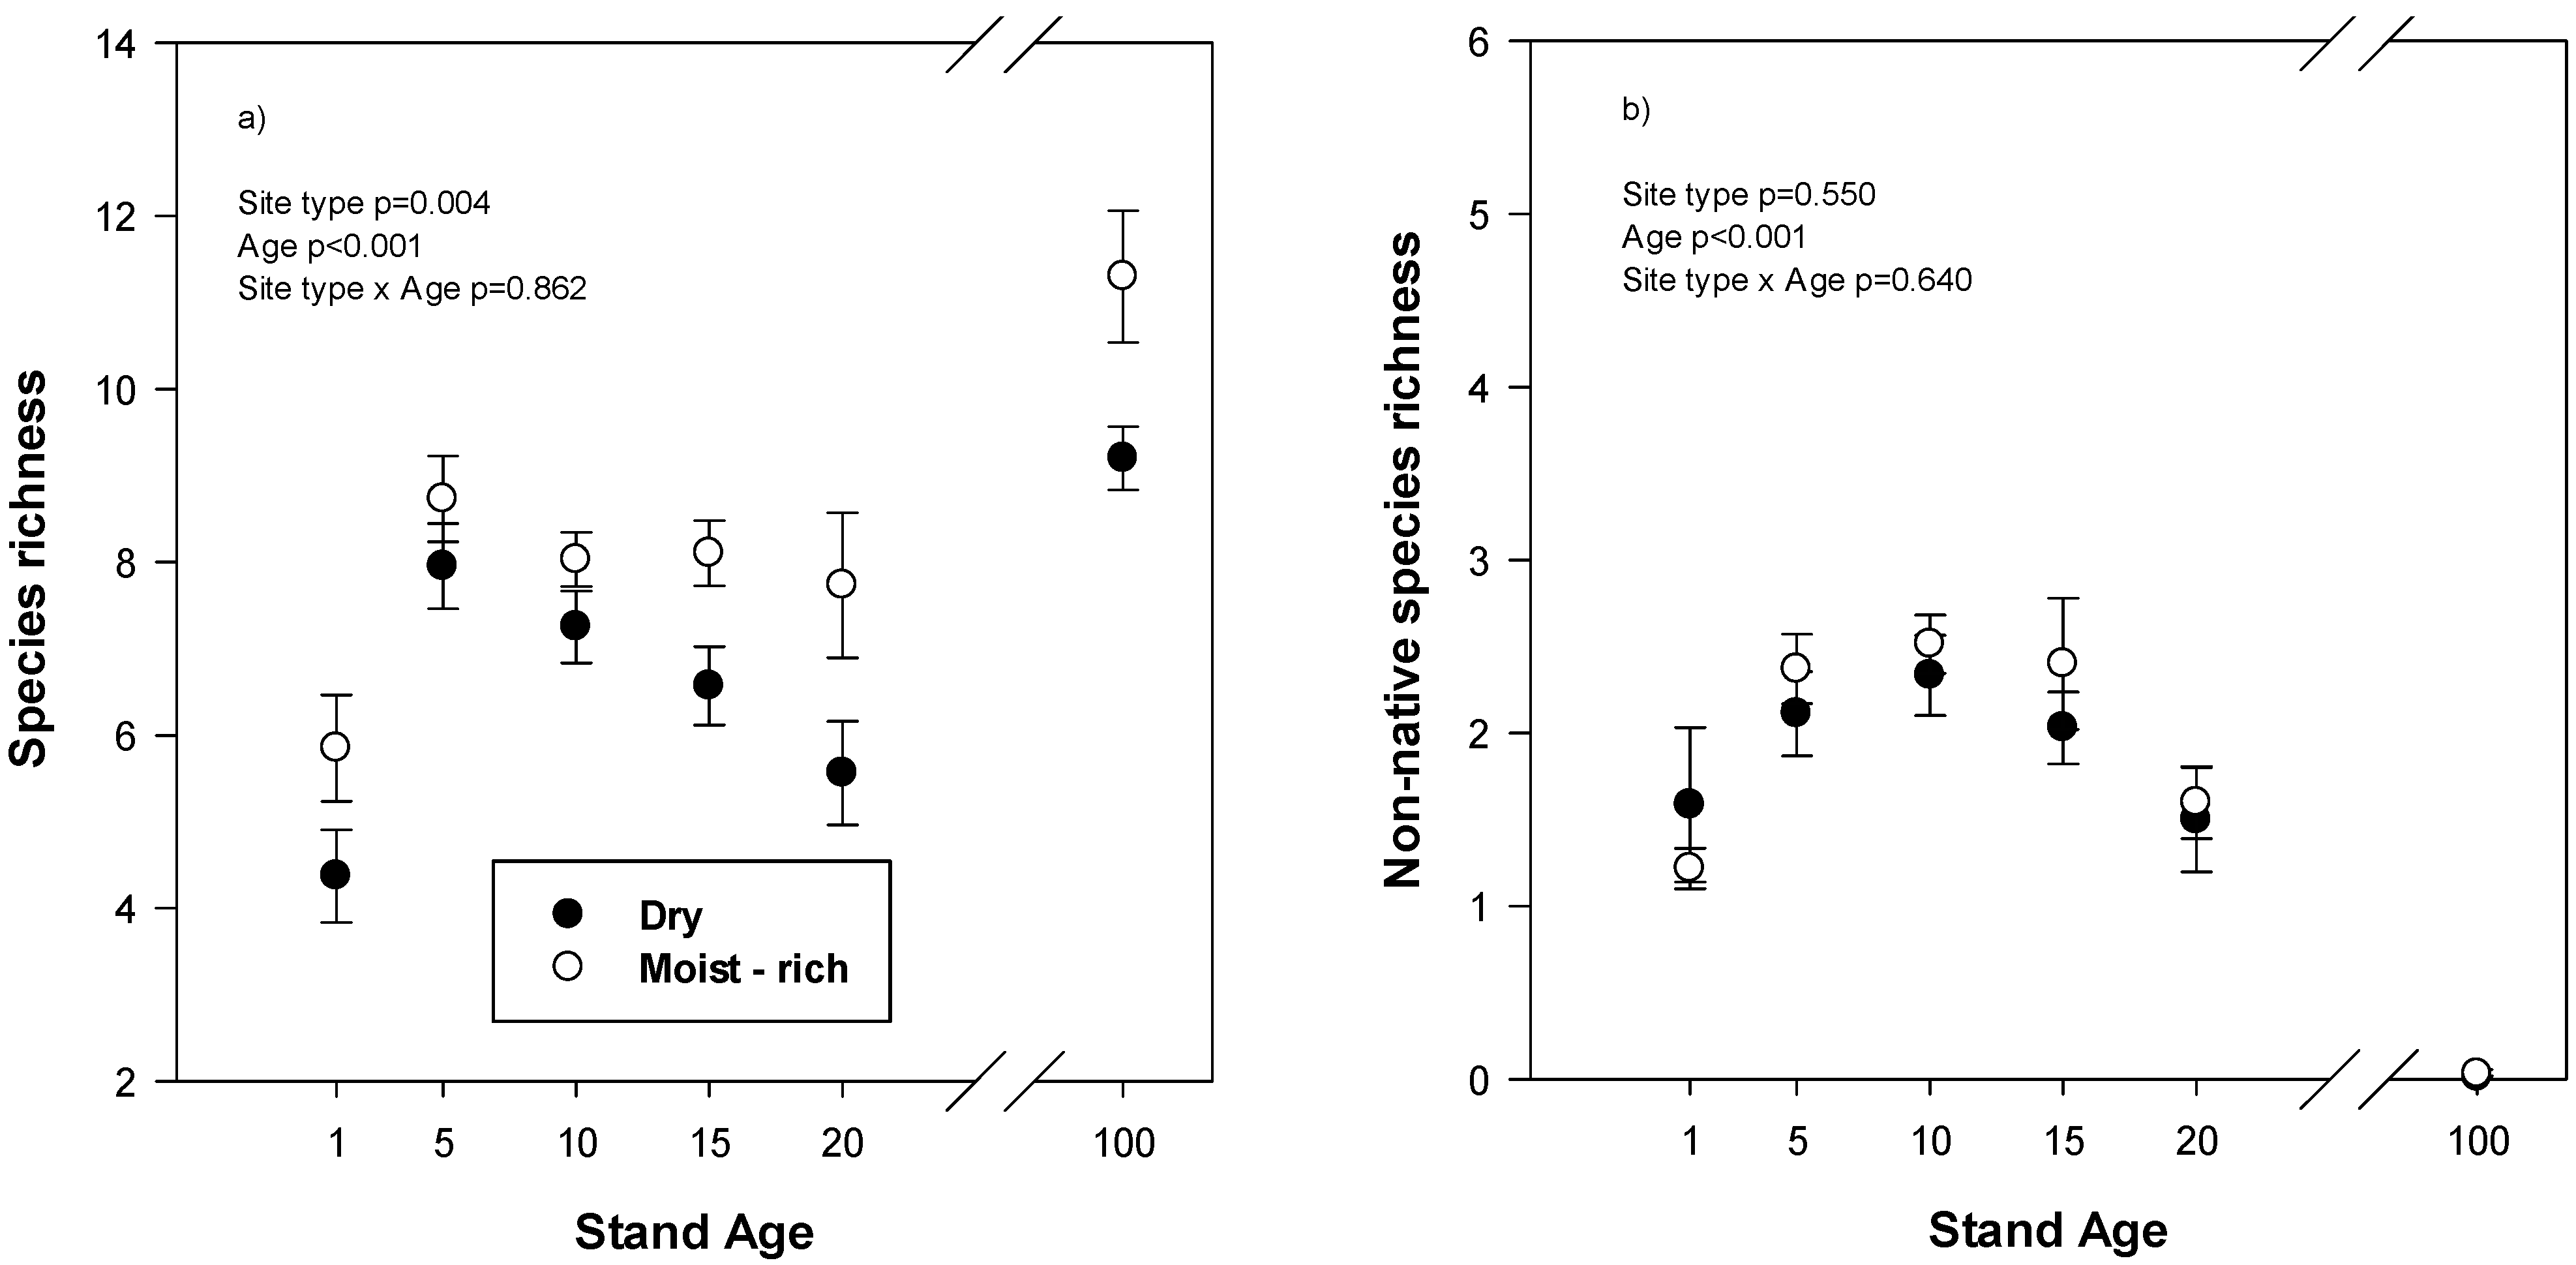
Reclaimed plots species richness, the average number of plant species per 0.4 × 1.0 m quadrat, reached a maximum in reclaimed plots at age 5 and then declined (
Figure 1a). Species richness was also greater on moist-rich than dry reclaimed site types. In mature stands, species richness was also greater on moist-rich than dry site types (
p = 0.016) and there were approximately 50% more species present per quadrat than in reclaimed plots at year 20. The number of non-native species per quadrat on reclaimed plots was lowest in year 1 and year 20 but was not different between site types (
Figure 1b). The most common non-native species found across all reclaimed plots were sow thistle (
Sonchus arvensis), common dandelion (
Taraxacum officianale), barley and sweet clover (
Melilotus sp.) In mature stands, there were virtually no non-native species found.
Figure 1.
(a) Total species richness, average number of species per 1.0 × 0.4 m quadrat, and (b) non-native species richness in relation to stand age on different site types in reclaimed and mature natural forests. Reclaimed plots are from stand age 1–20 and the mature forest is labelled stand age 100. Values are mean and standard error. ANOVA statistics are for reclaimed plots only.
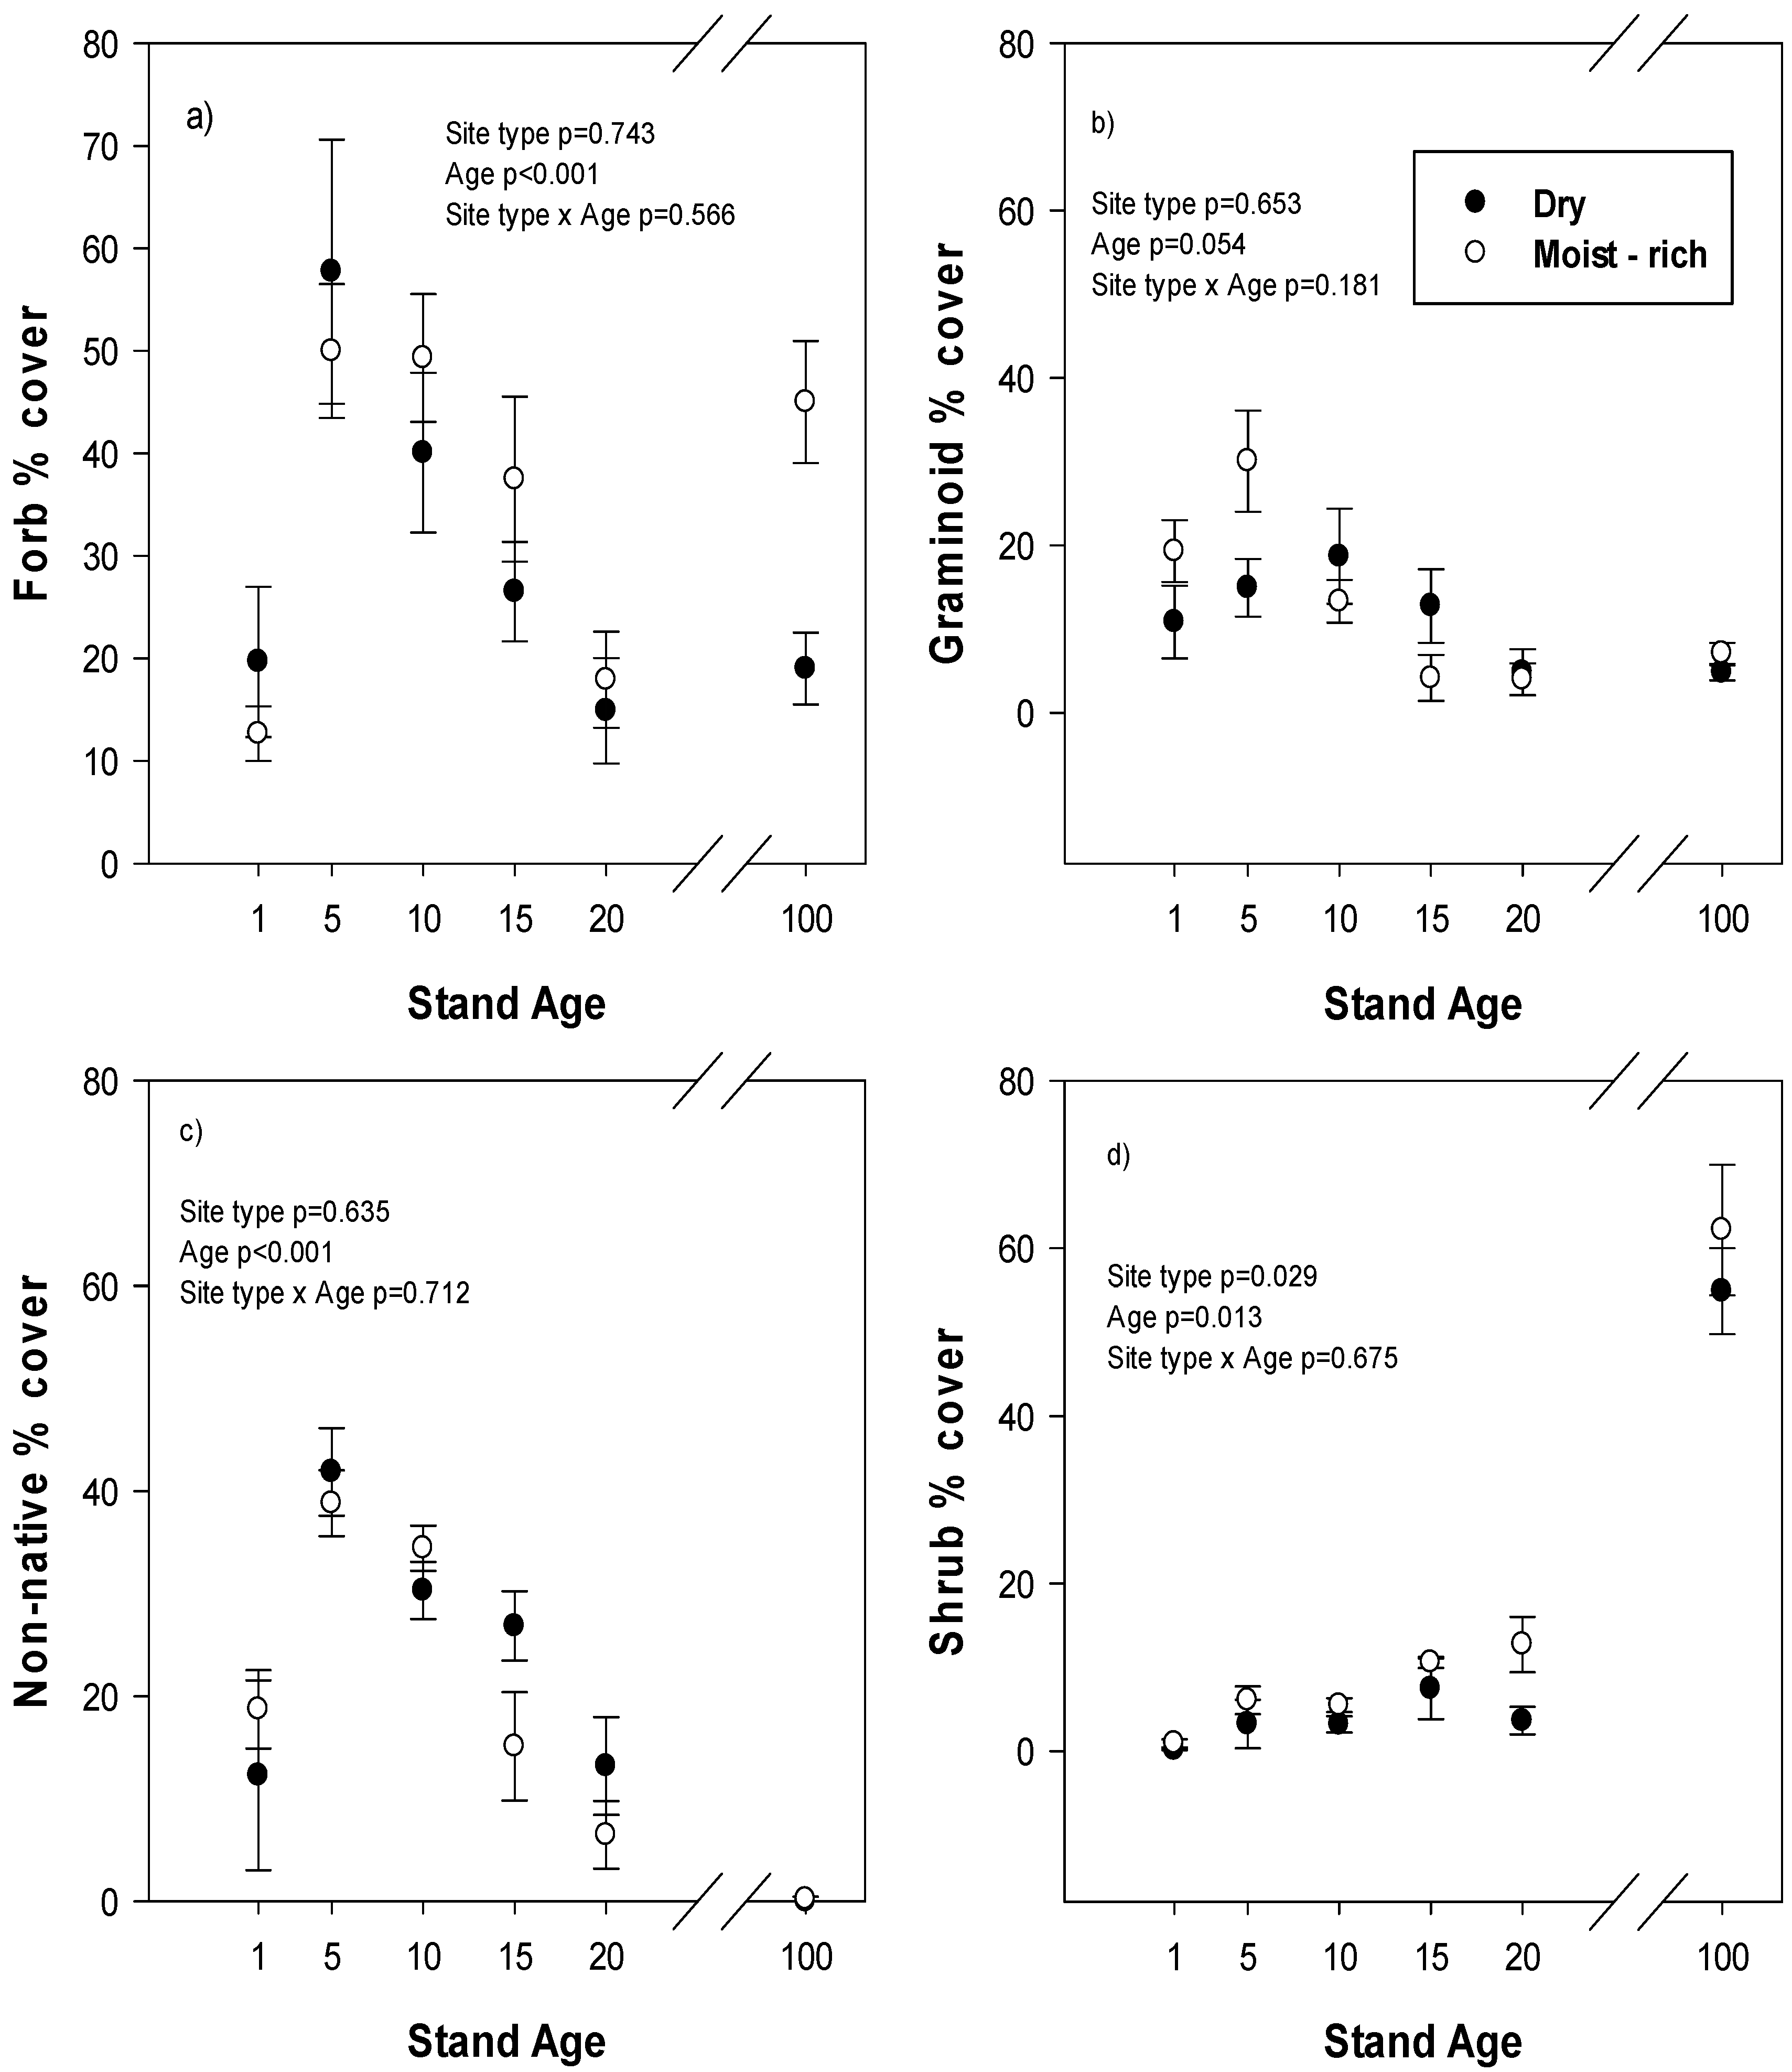
Average cover of forbs, graminoids and non-native plants in reclaimed plots all showed a similar developmental pattern over time with a distinct peak in cover at year 5 followed by a decline up to year 20 but there was no difference between reclamation site types in average cover (
Figure 2a–c). In mature stands, forb cover was greater on moist-rich compared to dry site types (
p < 0.001) and was approximately three times greater than forb cover on reclaimed plots at year 20 on moist-rich site types but was similar between mature and year 20 plots on dry site types (
Figure 2a). Graminoid cover was not different between site types in mature forests (
p = 0.140) and was similar between mature and reclaimed plots at year 20. Non-native cover was very low in mature plots (average 0.12% cover), was not different between eco-site types (
p = 0.291) and was much higher in reclaimed plots at year 20 (average 10%) relative to mature stands.
Figure 2.
(a) forb cover, (b) graminoid cover, (c) non-native plant cover and (d) shrub cover in relation to stand age on different site types in reclaimed and mature forests. Reclaimed plots are from stand age 1–20 and the mature natural forest is labelled stand age 100. Values are mean and standard error. ANOVA statistics are for reclaimed plots only.
Shrub cover on reclaimed plots increased over time and was significantly greater on moist-rich than dry-site types (
Figure 2d). In mature stands, there was no difference in shrub cover between site types (
p = 0.435), but shrub cover was more than three times higher than in reclaimed plots at age 20. In addition, the dominant shrub species in the mature dry site types were ericaceous shrubs such as blueberry (
Vaccinium myrilloides), bog cranberry (
Vaccinium vitis-idaea) and bearberry (
Arctostaphylos uva-ursi) while in the mature moist-rich site types, the dominant shrub species were prickly rose (
Rosa acicularis), low bush cranberry (
Viburnum edule) and Saskatoon (
Amelanchier alnifolia) so that even though average cover was similar, the species composition was very different between eco-sites. In the reclaimed plots, the most common shrub species on both site types were raspberry (
Rubus idaeus), prickly rose, and willow (
Salix sp.).
Canopy tree height increased over time on reclaimed plots and was significantly greater on moist-rich site types (
Figure 3). In mature stands, canopy height was also greater on moist-rich site types (
p < 0.001).
Figure 3.
Canopy tree height in relation to stand age on different site types in reclaimed and mature forests. Reclaimed plots are from stand age 1–20 and the mature, natural forest is stand age 100. Values are mean and standard error. ANOVA statistics are for reclaimed plots only.
Figure 3.
Canopy tree height in relation to stand age on different site types in reclaimed and mature forests. Reclaimed plots are from stand age 1–20 and the mature, natural forest is stand age 100. Values are mean and standard error. ANOVA statistics are for reclaimed plots only.
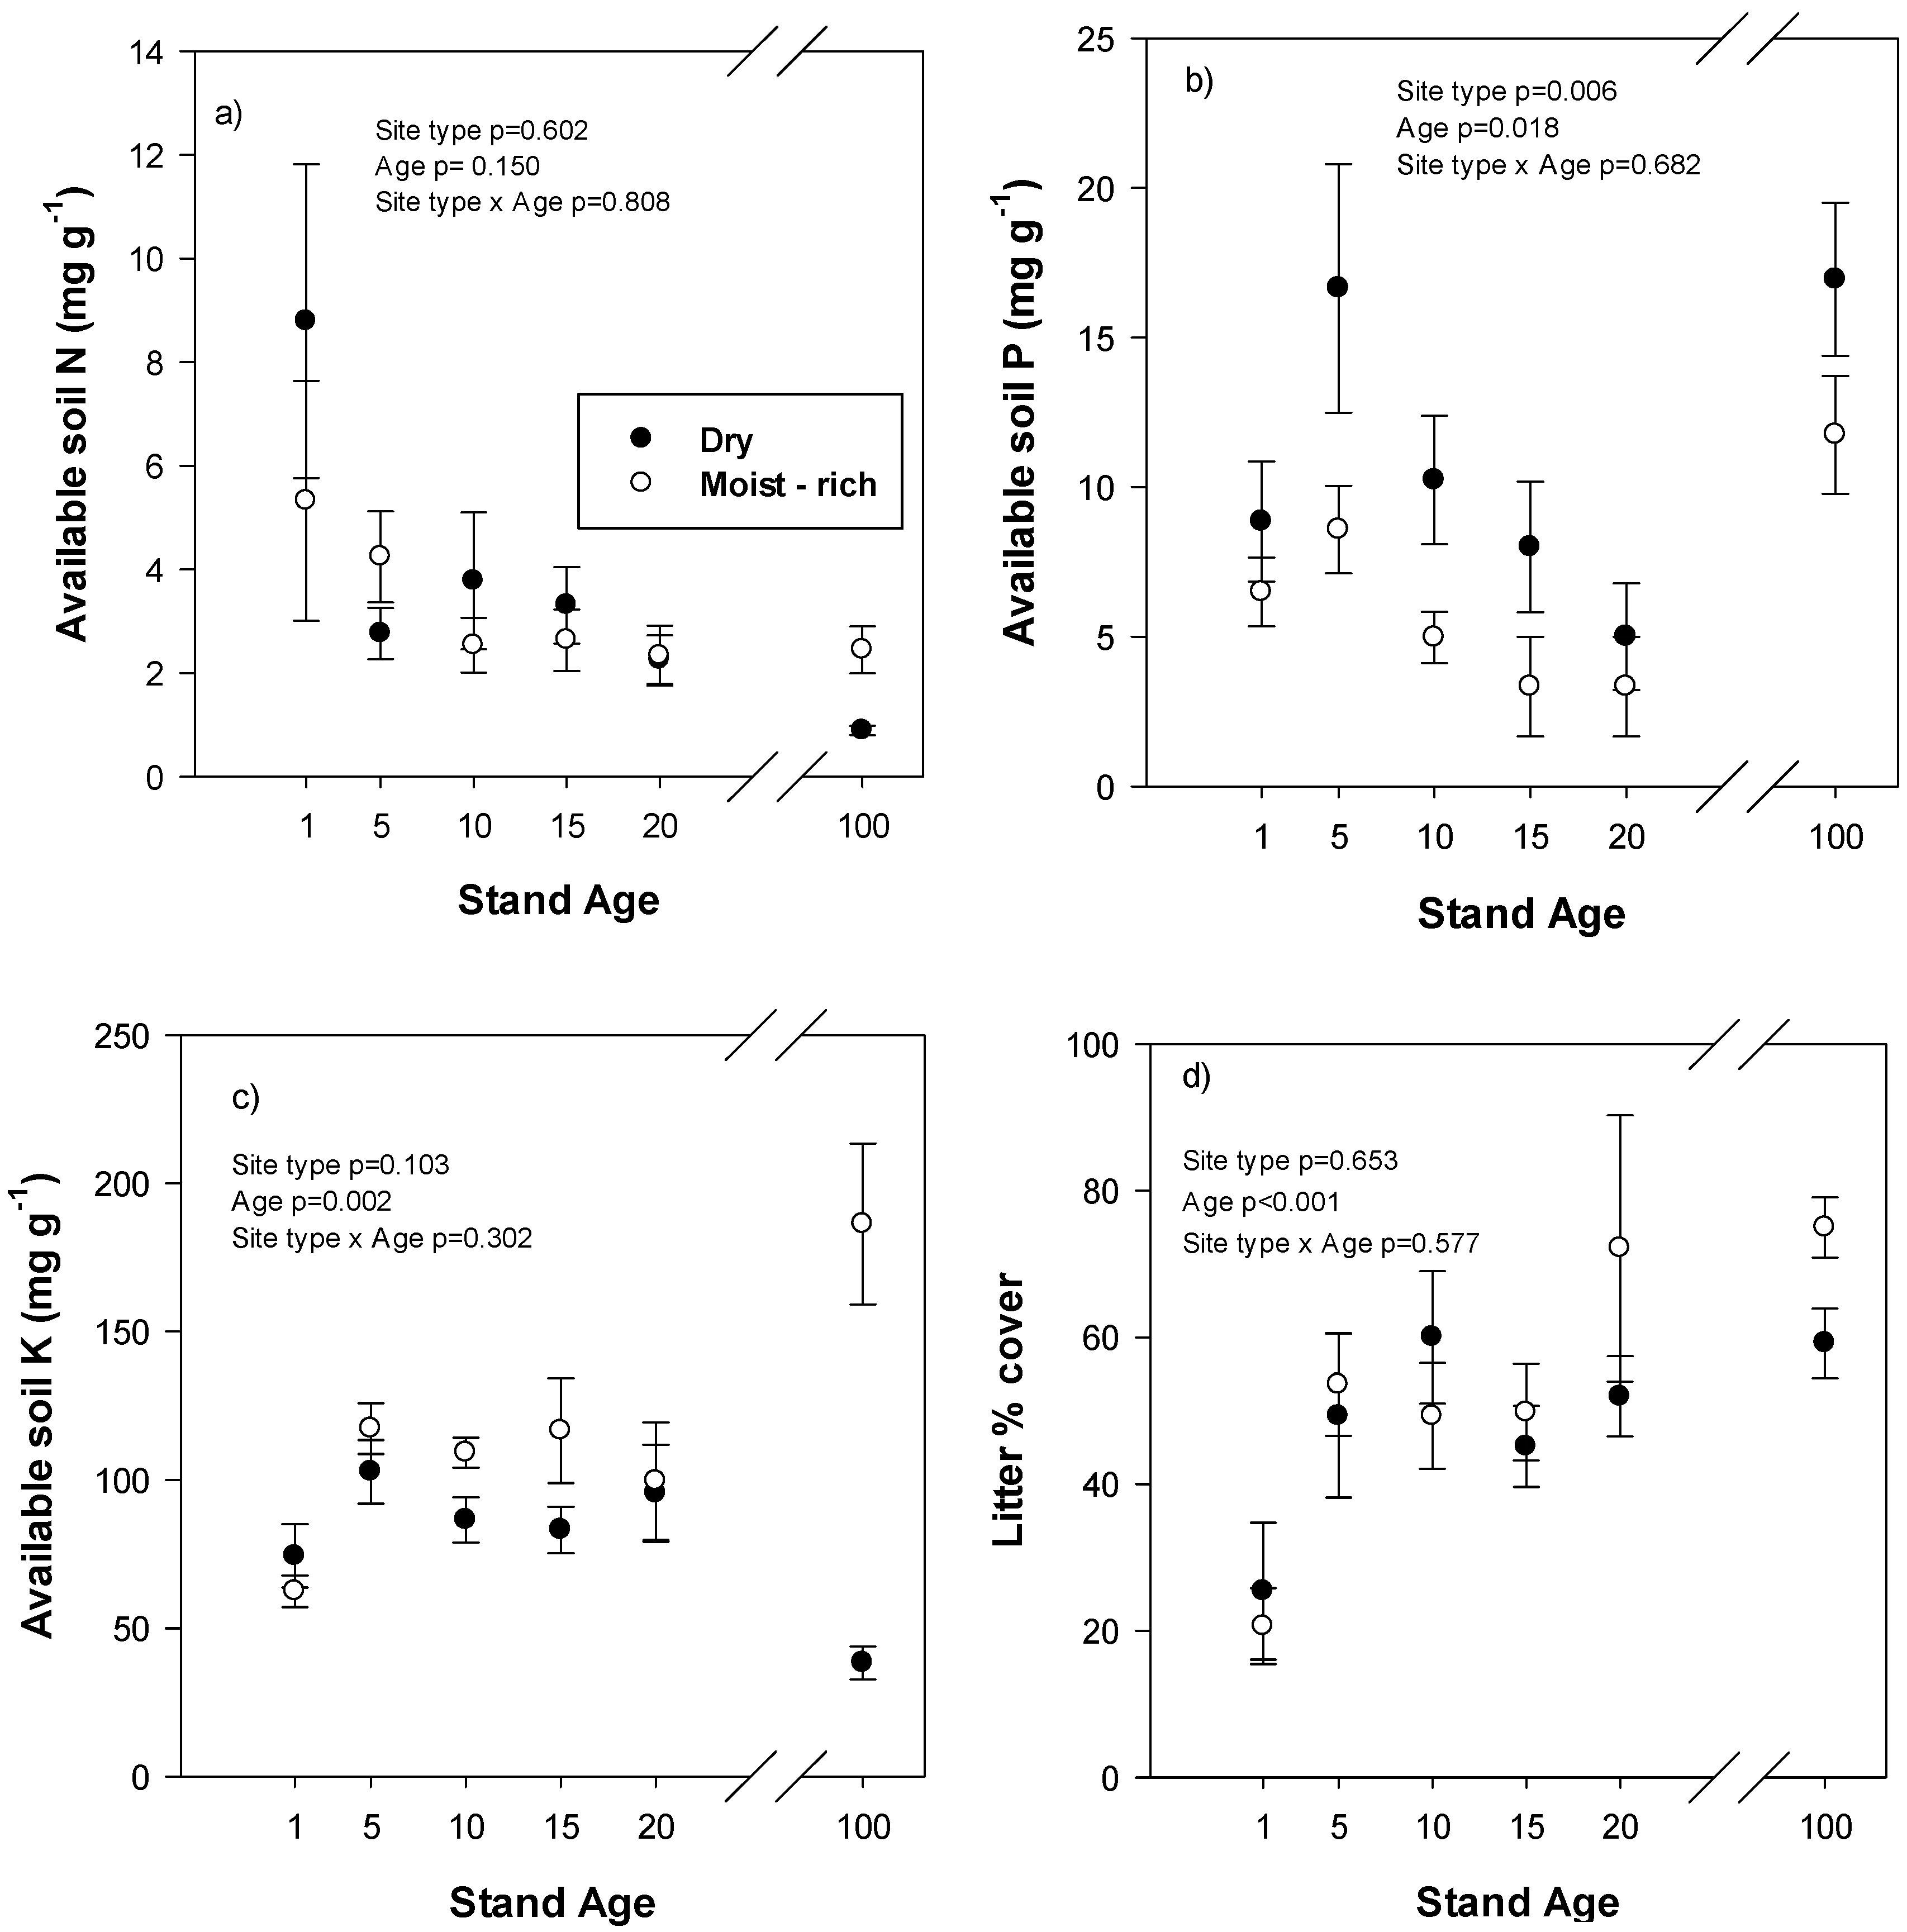
Available soil N (sum of NO
3− and NH
4+) in reclaimed areas did not vary over time or by site type (
Figure 4a). In mature stands, available soil N was greater in moist-rich site types (
p = 0.008), but there was little difference in available soil N between reclaimed stands at year 20 and mature stands. Available soil P varied with time in the reclaimed plots with a peak at year 5 followed by a decline to year 20 and was greater in dry-site types compared to moist-rich site types (
Figure 4b). In mature stands, there was no significant difference in available soil P between site types (
p = 0.146), but the values in mature stands were approximately three times higher than in reclaimed stands at year 20. Available soil K in reclaimed plots was lowest at age 1 but was not different between site types (
Figure 4c). In mature stands, available soil K is greater (
p < 0.001) in moist-rich eco-site types with reclaimed plots at year 20 falling in between the mature site types. Forest floor litter cover increased over time in the reclaimed plots and was not different between site types (
Figure 4d). In mature stands, litter cover is higher in moist-rich compared to dry site types (
p = 0.013), but these levels are similar to those found in reclaimed plots at year 20.
Figure 4.
(a) Available soil N, (b) available soil P, (c) available soil K and (d) forest floor litter cover in relation to stand age on different site types in reclaimed and mature forests. Reclaimed plots are from stand age 1–20 and the mature, natural forest is stand age 100. Values are mean and standard error. ANOVA statistics are for reclaimed plots only.
Overall in the reclaimed plots, most measured soil and plant community variables varied with time (all except available soil N) but there were fewer differences between site types (only species richness, shrub cover, canopy tree height and available soil P). There were no significant interactions between stand age and eco-site type for any measured variables in the reclaimed plots. In the mature stands, there were more differences in measured variables between site types and most variables were substantially different than in reclaimed plots at year 20. The variables that appear similar between mature and reclaimed plots were graminoid cover, available soil N and forest floor litter cover.
4. Discussion
There were few differences in measured ecosystem development metrics between the two site types on reclaimed sites, but in natural stands, there are substantial differences. This is likely because the cover soil used in almost all of the reclamation prescriptions examined in this study were the same,
i.e., peat-mineral mix. Therefore, the perceived differences between sites due to soil moisture regime were based on subsoil characteristics,
i.e., coarse textured sand or finer textured overburden, while most of the measured plant and soil properties, including plant cover and soil nutrient availability, were likely controlled by the upper cover soil which was similar across plots. In the longer term, as the developing forest plant community stabilizes and begins to rely more on internal nutrient cycling, the underlying soil properties may play a larger role. Other ecosystems have taken up to 20 years to begin differentiating after disturbance [
4] suggesting that at least 20 years may be required before notable differences in plant community are observed on reclaimed lands.
Non-native species can be problematic in reclaimed areas with some post coal mining reclamation sites showing greater than 95% plant cover in non-native species after 19 years [
12]. In our study, even after 20 years, reclamation sites are still averaging 10% cover of non-native species while in mature natural forests, there are virtually no non-native species. Non-native species have the potential to drive ecosystem processes such as community composition and biodiversity [
13,
28] and nutrient cycling [
29] so having these species on site may not be desirable. However, it is not known whether the non-native species present on reclamation sites will act as drivers of ecosystem development [
30] or if they are simply exploiting the resources abundantly available after land reclamation and will be eliminated over time as native species develop. The fact that reclaimed ecosystems have 10% cover in non-natives after 20 years and lower species richness than natural forests indicate that non-native species at least have the potential to alter ecosystem development on reclaimed sites. Future research could focus on the potential long-term impacts of non-native species in the ecosystem, identifying which resources the non-native species are responding to and developing management techniques to favour native species.
Shrub cover and composition are both different between reclaimed and natural forests. Low shrub cover is common on reclaimed plots [
31], but the trajectory of shrub cover in our study is moving towards eventually being similar to natural forests. However, the reclamation sites have very different shrub species composition relative to natural sites. Natural dry-site types have shrub communities dominated by ericaceous species but on reclaimed sites, all shrub species are more typical of mesic sites. In the longer term, these shrub species on dry reclaimed sites may not be suitable and a series of successional cohorts may be required before the appropriate species arrive on site, which could take decades or longer. Shrubs were previously planted in some reclamation areas and shrub establishment has been identified as a priority for new oil sands land reclamation [
32], but planting desirable shrub species in older reclamation sites may also be required so work is currently underway to determine the most appropriate time during stand development to plant shrubs. Planting of shrubs, specifically alder inoculated with nitrogen fixing actinomycetes, has shown the potential to improve soil chemical and biological quality [
33] indicating potential feedbacks between shrubs and other ecosystem components.
Tree growth is greater on moist-rich sites, likely due to the finer textured subsoil which provides more water to trees than on the dry soils, which is particularly important in this dry part of the boreal forest. Another possible explanation for the difference in tree growth between site types is that faster growing aspen trees were planted more often on soils with finer textured subsoils while slower grower jack pine was planted on soils with coarse textured subsoils. The limiting factors for tree growth of different species and on different site types have been shown to differ with soil moisture limiting tree growth more on tailings reclamation sites while nutrients are a greater limitation on overburden sites [
22]. Other studies have shown that initial tree growth on reclaimed land is similar to that of natural forests [
15], but given that the oldest reclaimed sites in our analyses were only 24 years old, it is not possible to comment on long-term sustainability.
Available soil N is thought to be a defining feature of different site types in boreal forests and N is considered to be one of the main limiting resources for tree growth in reclaimed ecosystems [
34,
35]. The lack of difference in available N between reclamation site types or over time in our study, however, indicates that available N may not be as good an indicator of ecosystem function as other metrics of N cycling such as mineralizable N [
34]. This is supported by other studies on reclaimed soils that have found that tree (trembling aspen) and plant (fireweed,
Chamerion angustifolium) growth is not related to available soil N [
7,
36]. The high variability in soil N seen in year 1 may have been due to early stand fertilization which tended to be heavily weighted towards N, but this effect appears to be very short lived and have little lasting impact on the soil nutrient regime. However, caution must be used when extrapolating our results to other reclamation sites which have not been fertilized as other nutrients or site limitations may be of more importance. Another confounding factor for N cycling on reclaimed sites may be atmospheric deposition which is many times the natural background levels in areas near major industrial installations [
37], which is where most of the current and future reclamation areas are located.
Available soil P concentration is greater on dry site types in both reclaimed and natural sites but is much lower in reclaimed plots at year 20 than in mature natural plots [
31]. Phosphorus has also been positively related to tree growth [
7] indicating that low P availability may be a long-term risk to ecosystem development on reclaimed areas. Available soil K has been shown to be significantly related to plant growth on reclamation soils [
7] and in the current study it was not different between reclaimed site types, but there were significant differences between natural site types. It is not clear, however, how long or if ever soil P and K will take to return to levels found in natural forests and if the reclaimed site types will eventually diverge. Available soil nutrient data likely reflects a past bias in monitoring towards tree productivity but boreal forest land reclamation goals have shifted from mainly being based on growing trees to more holistic measures of ecosystems such as establishing locally common and self-sustaining plant communities. The monitoring metrics used to track these changing goals should likely be updated to reflect this change in goals.
Forest floor development is one of the key features of boreal forest soils associated with the storage of water, nutrients and biodiversity [
17] and is mainly the result of above ground litter deposition from trees and plants. After 20 years on the reclaimed plots, litter cover is very similar to natural plots, which indicates that this process of forest floor development is progressing. The rate at which the forest floor develops is likely to be impacted by the canopy tree species with deciduous forests showing faster forest floor development than coniferous forests due to the annual leaf fall which begins after the first growing season [
38].


