Article

Modeling Forest Lightning Fire Occurrence in the Daxinganling Mountains of Northeastern China with MAXENT

1
College of Forestry, Beijing forestry University, 35 Qinghua East Road, Beijing 100083, China
2
National Forest Fire Prevention Headquarters, 18 Hepingli East Street, Beijing 100714, China
*
Author to whom correspondence should be addressed.
Forests 2015, 6(5), 1422-1438; https://doi.org/10.3390/f6051422
Submission received: 2 December 2014 / Revised: 16 March 2015 / Accepted: 24 March 2015 / Published: 24 April 2015
(This article belongs to the Special Issue Climate Change and Forest Fire)

Abstract

:
Forest lightning fire is a recurrent and serious problem in the Daxinganling Mountains of northeastern China. Information on the spatial distribution of fire danger is needed to improve local fire prevention actions. The Maxent (Maximun Entropy Models), which is prevalent in modeling habitat distribution, was used to predict the possibility of lightning fire occurrence in a 1 × 1 km grid based on history fire data and environment variables in Daxinganling Mountains during the period 2005–2010.We used a jack-knife test to assess the independent contributions of lightning characteristics, meteorological factors, topography and vegetation to the goodness-of-fit of models and evaluated the prediction accuracy with the kappa statistic and AUC (receiver operating characteristic curve) analysis. The results showed that rainfall, number of strikes and lightning current intensity were major factors, and vegetation and geographic variable were secondary, in affecting lightning fire occurrence. The predicted model performs well in terms of accuracy, with an average AUC and maximum kappa value of 0.866 and 0.782, respectively, for the validation sample. The prediction accuracy also increased with the sample size. Our study demonstrated that the Maxent model can be used to predict lightning fire occurrence in the Daxinganling Mountains. This model can provide guidance to forest managers in spatial assessment of daily fire danger.

1. Introduction

Forest fire is a major environmental problem in many forest biomes across the world [1]. Forest fire can be divided into natural and human-caused, according to source of fire ignition, and lightning is the main natural source causing forest fire occurrence. Many lightning fires occur annually in China, of which the most frequent and concentrated area is the Daxinganling Mountains [2]. According to the statistics compiled from 1988–2007, the number of lightning fires accounted for more than 60% of the fire incidents in the Daxinganling Mountains of Heilongjiang province, with burned areas of 4833 ha, and there was a significant increase in lightning-caused fires (especially in the number of fires and fire days) during this period [3]. Lightning fires are more difficult to suppress than those caused by humans because of their remoteness and aggregation in time and space [4,5]. Therefore, lightning fires usually cause serious damage to forest resources and the environment [6].
Lightning fires do not occur at random, but rather tend to start in specific places [7]. The efficiency of individual lightning strikes in igniting a forest fire is mainly affected by the variety in lightning properties such as the quantity, polarity and intensity [5]. Research has shown that the long-continuing current intensity of a lightning discharge is responsible for most, if not all, lightning-caused fires [8,9,10]. The advent of lightning location systems has advanced lightning-caused fire prediction [11,12,13]. Models of lightning fire occurrence have greater temporal and spatial specificity (correct prediction) than human-caused fires because the proximate cause is obvious.
Various mathematical models have been applied to predict lightning fire occurrence, such as the ordinary least squares (OLS) regression model [14], binary logistic regression model [15,16,17,18], cellular automaton model [19], weights-of-evidence model [20], generalized linear model (GAM) [21], negative binomial regression model [22], etc. Most of these models have their limitations for application. For the least squares regression model, the distribution of fire data needs to be normal and of equal variance. Negative binomial regression model requires the variance of distribution for fire data be greater than the average. Modern data-mining techniques, artificial neural networks and vector-support machines may be superior to parametric methods, but risk overfitting to the data.
The principle of maximum entropy is to estimate the probability distribution of maximum entropy, which is, under a set of constraints (the environmental conditions), the most spread-out or closest to uniform [23]. Maxent (Maximum Entropy Models) iteratively evaluates the contrasts between the values of these observations and those of a background consisting of the mean observations over the entire study area, as sampled from a large number of points. One of Maxent’s most important features is the capacity to fit highly complex response functions by combining several function types (linear, quadratic, product, threshold, and hinge). It can fit jagged and sharply discontinuous responses that cannot be modeled in even the most flexible regression techniques, such as generalized additive models. It is also adjusted for over fitting through a process called “regularization”, a mechanism that prevents the algorithm from matching the data too closely.
Maxent has been proved to perform well in modeling habitat distribution in comparison with other methods. It aims to predict potential geographical distribution of biological species from the observation of species occurrences [24,25]. This is a very similar problem to predicting a fire risk level as a function of external explanatory variables [26]. Fire is similarly strongly regulated by the “fire environment triangle”, i.e., topography, fuels and weather [27,28], which can be assessed from the conditions in which fires have already been observed. The model can express a per-pixel probability of fire occurrence from a set of environmental raster layers, which can be used as a critical tool for forest management.
Several studies have tried to apply the Maxent models to research the susceptibility of fire occurrence to environmental conditions. Parisien [28] used a Maxent model to assess the relationship between fire occurrence and environmental factors at three spatial scales in the USA. The results showed that the model and its relevant concepts can be applied to study spatial distribution of fire occurrence. Renard [1] applied the Maxent algorithm to provide a quantitative understanding of the environmental controls regulating the spatial distribution of forest fires in the Western Ghats of India, and constructed local models for predicting annual forest fire occurrence.
The aims of this study are to apply the Maxent model to predict the risk of daily lightning fire occurrence based on historical fire data and environment factors in the Daxinganling Mountains during the 2005–2010 period, and to provide a new method for spatially explicit assessment of daily lightning fires occurrence.

2. Materials and Methods
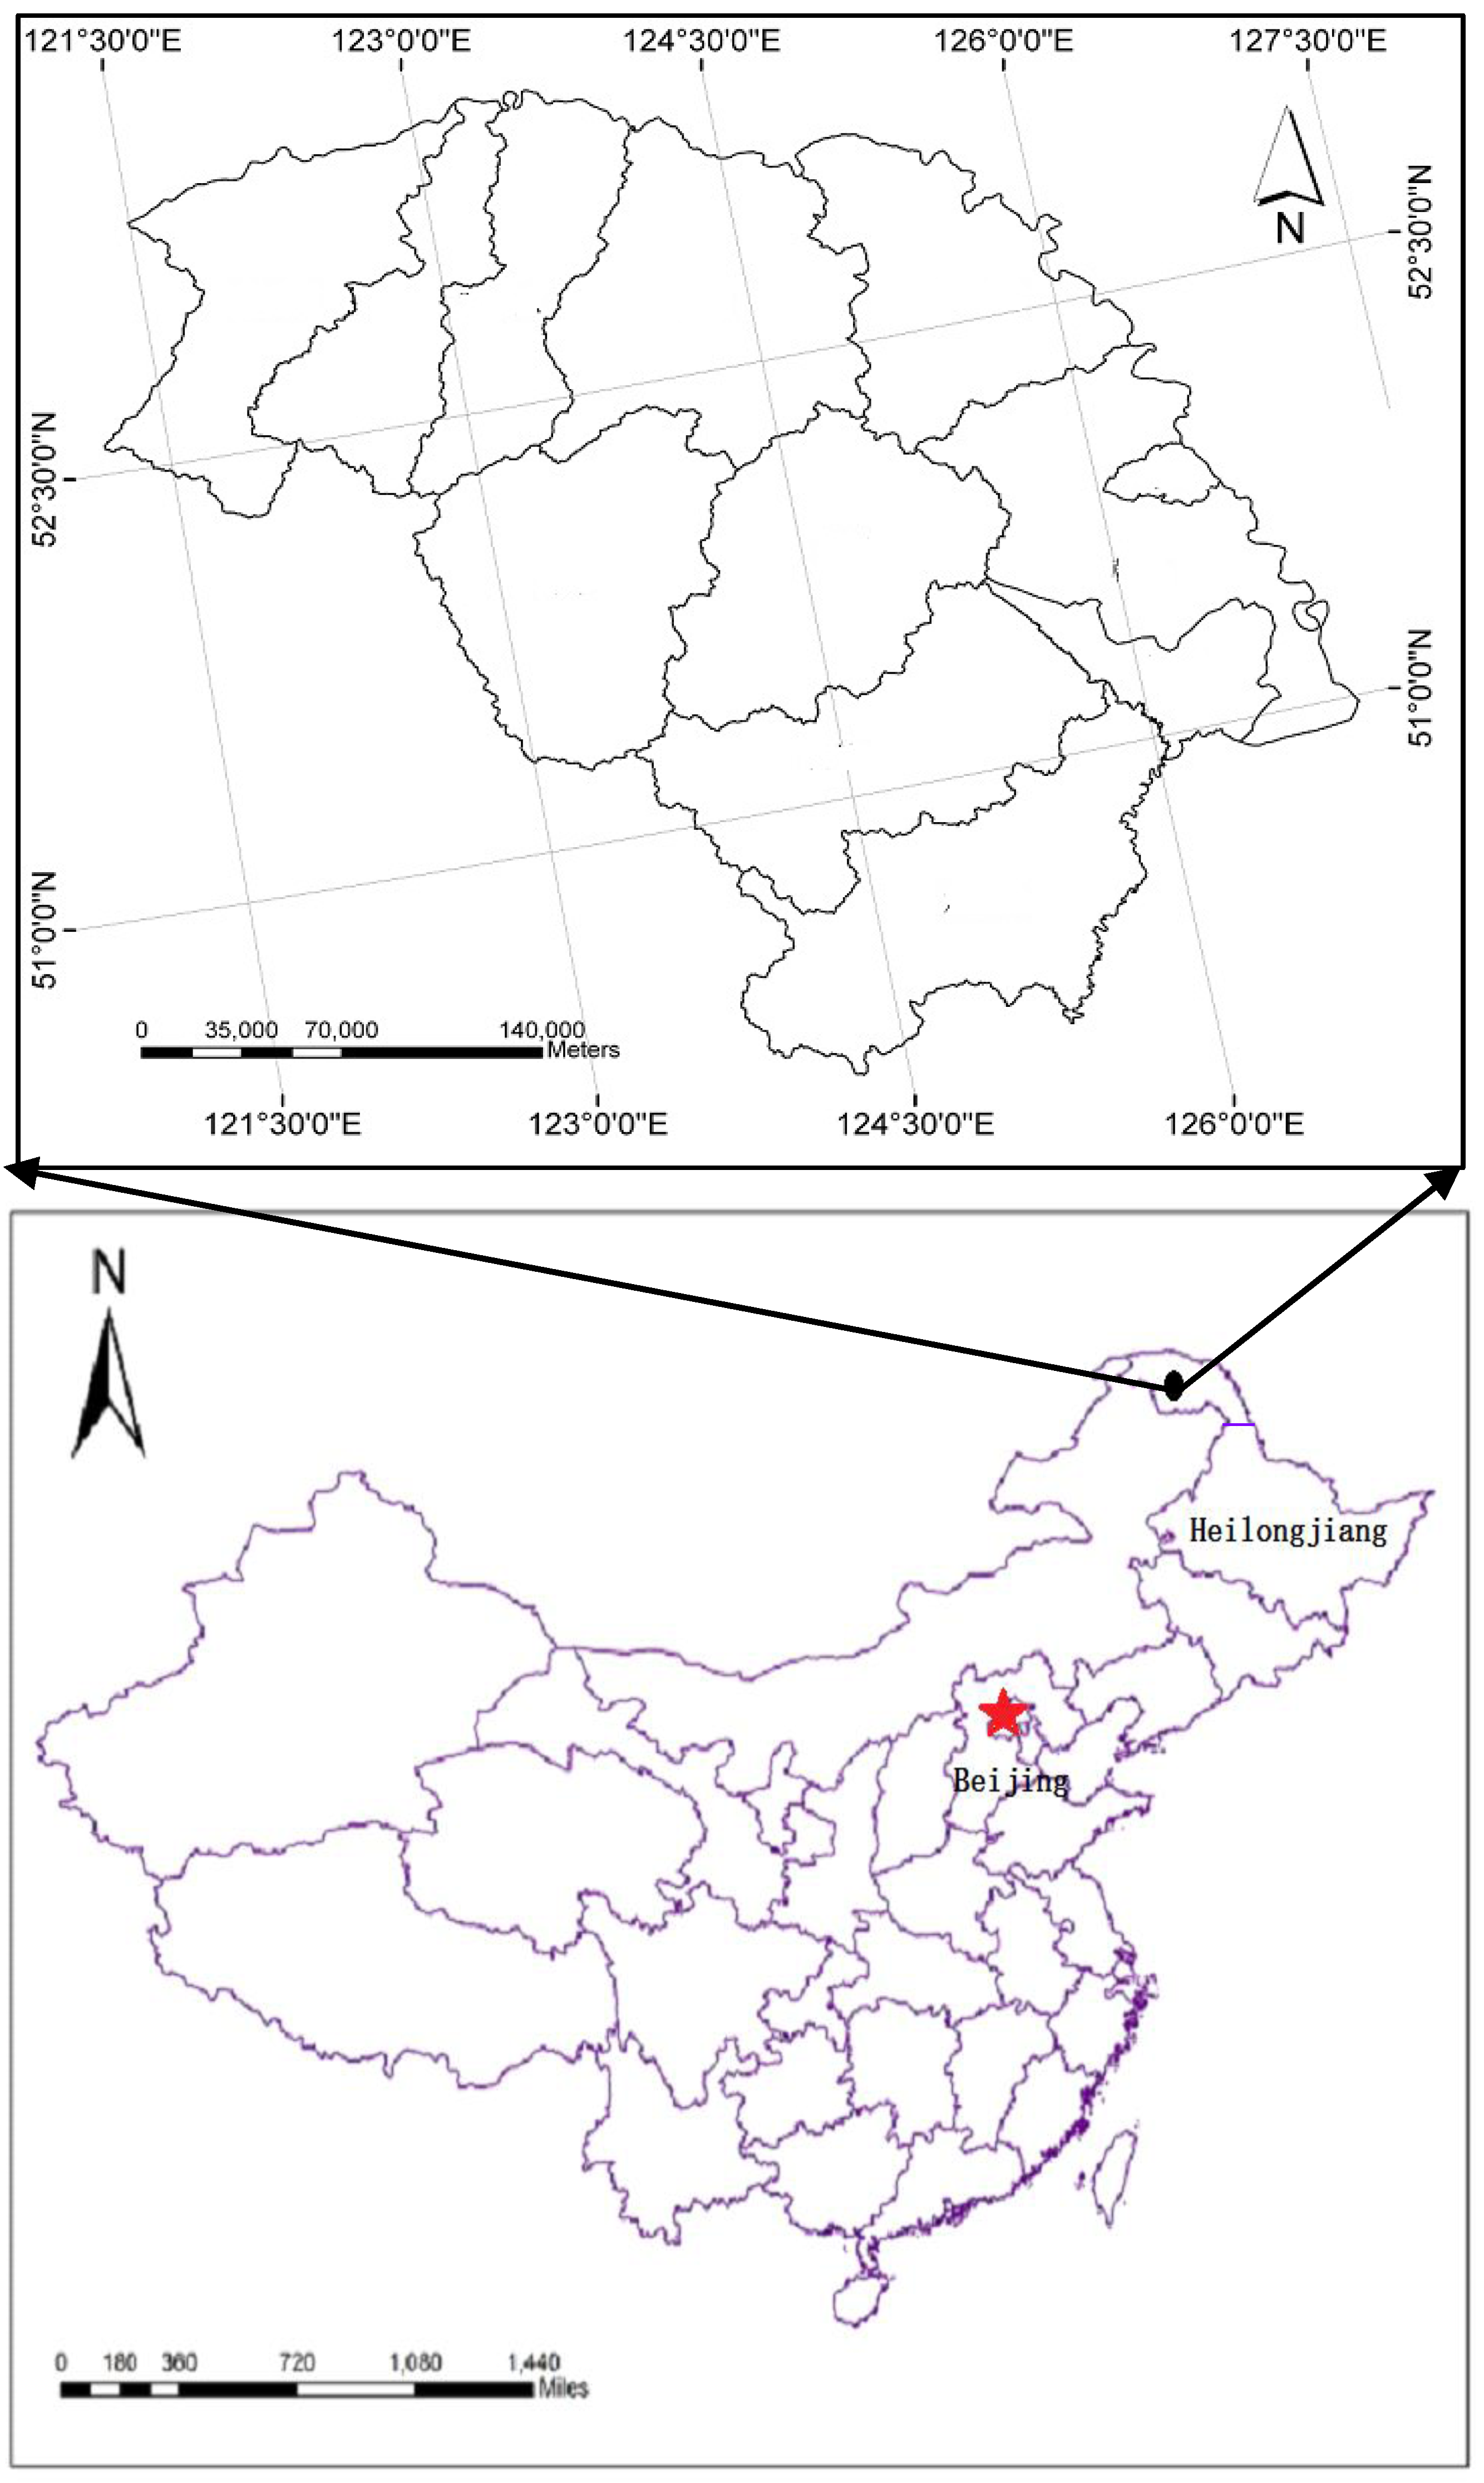
2.1. Study Areas

The Daxinganling Mountains are located at 50°10′–53°33′ N, 121°12′–127°00′ E in the Heilongjiang province of China (Figure 1), with an area of 8.46 × 10⁴ km2. The study area has a cool continental monsoon climate, with annual average temperature of 2.8 °C and annual precipitation of 350–500 mm mainly concentrated in July-August. Snow covers last five months in winter and snow depth can be of 30–50 cm in forest areas. The area has a relatively flat terrain and the elevation ranges from 300 to 1400 m, with gentle slopes <15° accounting for >80% of the area. Forest cover is 76.3% of the area. Dominant tree species include of Larix gmelinii, Betula platyphylla, Pinus sylvestris var. mongolica. Owing to a high frequency of summer thunderstorms, lightning fires usually occur from April to July each year, with a peak in June. The numbers and burned areas of lightning fires of the region rank first in China.

2.2. Data Resources

The data used in this paper consist of 627 historical lightning fire records with geographical coordinates and the time of occurrence in the Daxinganling Mountains during the 2005–2010 period, lightning data (location and date of lightning strikes, lightning current intensity and charge amount), weather over the last three days before ignition (temperature, relative humidity, wind speed, rainfall), forest fuel type of ignition, and topography (altitude, slope and aspect). The particular period (2005–2010) was selected because the lightning detection system began to operate in 2005.
Lightning fire historic records were provided by the Forest Fire Prevention Department of the Forestry Group Company of Daxinganling in the Heilongjiang province. Lightning location data was obtained from the lightning device monitoring system of the National Weather Service located in Daxinganling. Meteorological data were from 10 meteorological observation stations of the national daily meteorological data sharing network, five stations in the research area and the other five stations near the study area. The daily meteorological data for the area were generated by using Daymet [29], which uses regression and digital elevation maps to interpolate data from existing weather stations over complex terrain.
Figure 1. Location of the study areas in Heilongjiang province, northeastern China.
Forests 06 01422 g001

2.3. Data Preparation and Variable Selection

The dependent variable was the probability of fire ignitions divided in a grid cell on each day. An estimated ignition, or start date, of each fire was determined by examining the daily lightning strike record prior to the detection of the fire. That is, we estimated the ignition date of each fire as the most recent day, prior to the fire’s detection date, on which lightning occurred within a 10 km radius of the fire ignition location. Based on experience from related modeling work and preliminary analyses, the environmental variables in Table 1 were considered as candidate explanatory variables.
The Maxent software (Princeton, NJ, USA) requires inputs of environment variables to be in an excel file in ESRI ASCII raster format or csv format. Therefore, the inputs of all environmental variables in this study were in form of ASCII grid raster layer at a 1 × 1 km spatial resolution. The raster layers were generated in ArcGIS10.0 software (Stanford, CA, USA). Meteorological data were interpolated to raster layers with a 1 × 1 km spatial resolution. Topography data were derived from DEM in a 90 m resolution. Due to the difference in combustion characteristics [17,30,31], fuel types of ignition were categorized into five classes according to combustion characteristics of forest fuel, which were larch forest, Scots pine forests, mixed forest with larch, birch and oak trees, mixed forest with Scots pine, birch and oak trees, and grass.
Table 1. Candidate variables for predicting the probability of lightning fire occurrence in area of Daxinganling Mountains, China.
Variable TypeVariable CodeDescriptionUnit
meteorological factorDMTDaily average maximum temperature in the 3 days before the ignition°C
DRRainfall in the 3 days before the ignitionmm
DAHDaily average relative humidity in the 3 days before the ignition%
DAWSDaily average wind speed in the 3 days before the ignitionm/s
Lightning LNNumber of strikes on the day of the ignition
LCILightning current intensity for all strikesA
NCNeutralized charge amount for all strikesC
LELightning energy for all strikesJ
Fuel FTForest fuel type of ignitioncategorical
TopographyALTAltitudem
SLOSlope
ASPAspect %
Environmental variables may influence each other, and hence we conducted multi-collinearity diagnostics for all environmental candidate factors and excluded the variables which had a closely linear relationship with other variables before model building. The VIF (variance inflation factor) value was employed to measure the collinearity among environmental factors. Variables with VIF values >5 were removed from the analysis.

2.4. Maxent Modelling of Fire Occurrences

The principle of the Maxent model is to estimate the probability distribution of maximum entropy, which is, under a set of constraints (the environmental conditions), the most spread-out or closest to uniform [23]. Maxent iteratively evaluates the contrasts between the values of these observations and those of a background consisting of the mean observations over the entire study area, as sampled from a large number of points. One of Maxent’s most important features is the capacity to fit highly complex response functions by combining several function types (linear, quadratic, product, threshold, and hinge). It can fit jagged and sharply discontinuous responses that cannot be modeled in even the most flexible regression techniques, such as generalized additive models. It is also adjusted for overfitting through a process called “regularization”, a mechanism that prevents the algorithm from matching the data too closely.
The Maxent model was fitted to our data using 70% of the fire occurrences (training points). The predictive power of models was assessed by cross-validations using the 30% remaining occurrences (test points) not used to fit the model [23,32] and a set of 1000 random locations representing background (or pseudo-absence) points [24].
Models were computed in Maxent 3.1 [24]. The fitted parameters were used in the model to produce a raw probability map that underwent a transformation to produce the so-called “logistic” output [33]. The mapped value of each cell of this output represented an estimate of relative probabilities ranging from 0 to 1, and a high value of the Maxent function at a particular location indicates that it is fire-prone. The default values of the regularization parameters were used in the model [34].

2.5. Contribution of Environmental Variables

We analyzed the relative contribution of each environmental variable to the most suited models based on jack-knifes of regularized training gain and AUC value methods [35]. The regularized training gain was measured using a heuristic estimate in which the increase or decrease in model gain attributed to each variable from one iteration of the training algorithm to the next was added to the variable contribution. At the end of the iteration, the larger the value of the environment variable gained, the greater the contribution of the environment variable was. The AUC value method assessed which variables matter most by calculating the AUC values in both cases of only including and excluding each environment variable. When the AUC value of only including the variable was not remarkably less than that of including all variables, or the AUC value of excluding the variable was remarkably less than that of including all the variables, the environment variable had a larger contribution. The graphics were produced in SigmaPlot 10.0 software (Stanford, CA, USA).

2.6. Model Evaluation

Model prediction usually produces two types of errors (Table 2). The first type of error was underestimation, considering the fire presence area as low risk of fire occurrence, namely a false negative. The second was overestimation, considering the fire absence area as high risk of fire occurrence, namely a false positive. These two types of errors were closely related to the choice of the threshold value. The following indices are often used to evaluate the accuracy of the model: overall accuracy, true positive rate and negative rate, and kappa statistics (Table 3). The overall accuracy, which is prone to bias, reflects the fire number. True positive rate reflects the prediction ability of fire presence, while it is vulnerable to the second type of error. True negative rate indicates the prediction ability of fire absence, but it is vulnerable to the first type of error.
Table 2. An error matrix used to evaluate the predictive accuracy of models.
PredictedObserved
PresenceAbsence
Presencetrue positivefalse positive
Absencefalse negativetrue negative
Table 3. Measures of predictive accuracy indicators for the common models.
IndicatorFormula
Overall accuracy(a+d)/n
True positive rate (sensitivity)a/(a+c)
False positive rateb/(b+d)
True negative rate (specificity)d/(b+d)
False negative ratec/(a+c)
Kappa statistic a+d n ( a+b )( a+c )( b+d )( c+d ) n 2 1 ( a+b )( a+c )( b+d )( c+d ) n 2
Notes: a: true positive; b: false positive; c: false negative; d: true negative; n: total sample number.
The kappa statistic considers the true positive rate and negative rate, but it is vulnerable to the threshold value. The kappa value ranges from −1 to1. The maximum kappa value is close to 1, which means the prediction effect is very high. Landis and Koch [36] have suggested the following ranges of agreement for the kappa statistic: poor K < 0.4, good 0.4 < K < 0.75 and excellent K > 0.75. A kappa value equal to or less than 0 indicates the prediction effect is inferior to a random distribution model.
ROC (receiver operating characteristic curve) analysis is also a threshold-independent method for evaluating the accuracy of prediction. A pair of positive or false values can be obtained by changing the diagnostic threshold value. The plot of sensitivity (true positives rate) versus one negative specificity (false positives rate) is the ROC curve. AUC is the area value under the ROC curve. AUC values typically vary between 0.5, indicating that model predictions are no better than a random classification of observations, and 1. Generally, the AUC value ranges from 0.5 to 0.7, implying that the model accuracy is low, 0.7 to 0.9, meaning that the accuracy is moderate, and more than 0.9, suggesting that the accuracy is high [37].
The AUC value and the maximum kappa value were used to measure the performance of the predicted model in the study.

2.7. Sample Size

To evaluate how many observations were required to build good predictive models, the effect of increasing the sample size of the training points was assessed by building the Maxent model. Models created from a subsample of training points can produce different predictions for the entire data set. Ten iterations of the model were run, each iteration using a random selection of training data. The mean and variability of the predictions were examined for each data set. A set of 1000 random background (or pseudo-absence) points was used for the increased sets of sample points for model training.

3. Results

3.1. Multi-Collinearity Relations between Environmental Variables

The VIF values of lightning energy (LE) and neutralized charge amount (NC) were greater than 5 (Table 4), indicating that these two variables had a significant linear relationship with other variables and they were excluded for model training. This may be due to the interaction between lightning energy (LE), neutralized charge amount (NC) and lightning current intensity (LCI). The VIF values of other environmental variables were all less than 5 (Table 4), implying no significant collinearity exists between them and they can be used for model training.
Table 4. Multi-collinearity diagnostics for environmental candidate variables.
Eigenvalue of the Correlation MatrixProportion of Variation
DMTDAHDAWSDRFTALTASPSLOLCILNLENC
7.91090.00090.00030.00210.00180.00400.00210.00260.00340.00290.00170.00340.0041
1.21410.00150.00040.00030.08790.00450.00010.02650.00190.01420.06910.00190.0009
0.48660.00090.00080.00130.01580.29860.00020.06320.24890.03320.00310.24890.1024
0.37210.00700.00060.05920.08490.15180.03460.01470.31600.02070.02850.01600.1160
0.29610.00060.00000.00000.07010.48840.03560.06290.01100.27390.06520.01100.1240
0.23860.00470.00020.08150.23600.01630.05260.40880.01070.15380.01870.01070.0136
0.17220.00250.00010.36340.14520.01840.00160.07340.03910.21790.38640.03910.0362
0.13920.07760.03130.23720.13320.00040.00030.01000.08890.12970.16000.08890.0089
0.11480.00350.00060.04050.00270.00330.85660.31940.26630.14120.02080.56630.5361
0.04670.84030.10310.00120.05760.00010.01370.01690.01380.01170.24590.01380.0246
0.00880.06050.86260.21340.16490.01410.00250.00140.00000.00090.00060.00000.0000
VIF1.95301.78501.18602.06301.25401.14801.53401.79001.32202.64405.01206.2310
Notes: DMT: daily average maximum temperature in the 3 days before the ignition; DAH: daily average relative humidity in the 3 days before the ignition; DAWS: daily average wind speed in the 3 days before the ignition; DR: rainfall in the 3 days before the ignition; FT: forest fuel type of ignition; ALT: altitude; ASP: aspect; SLO: slope; LCI: lightning current intensity for all strikes; LN: number of strikes on the day of the ignition; LE: lightning energy for all strikes; NC: neutralized charge amount for all strikes.

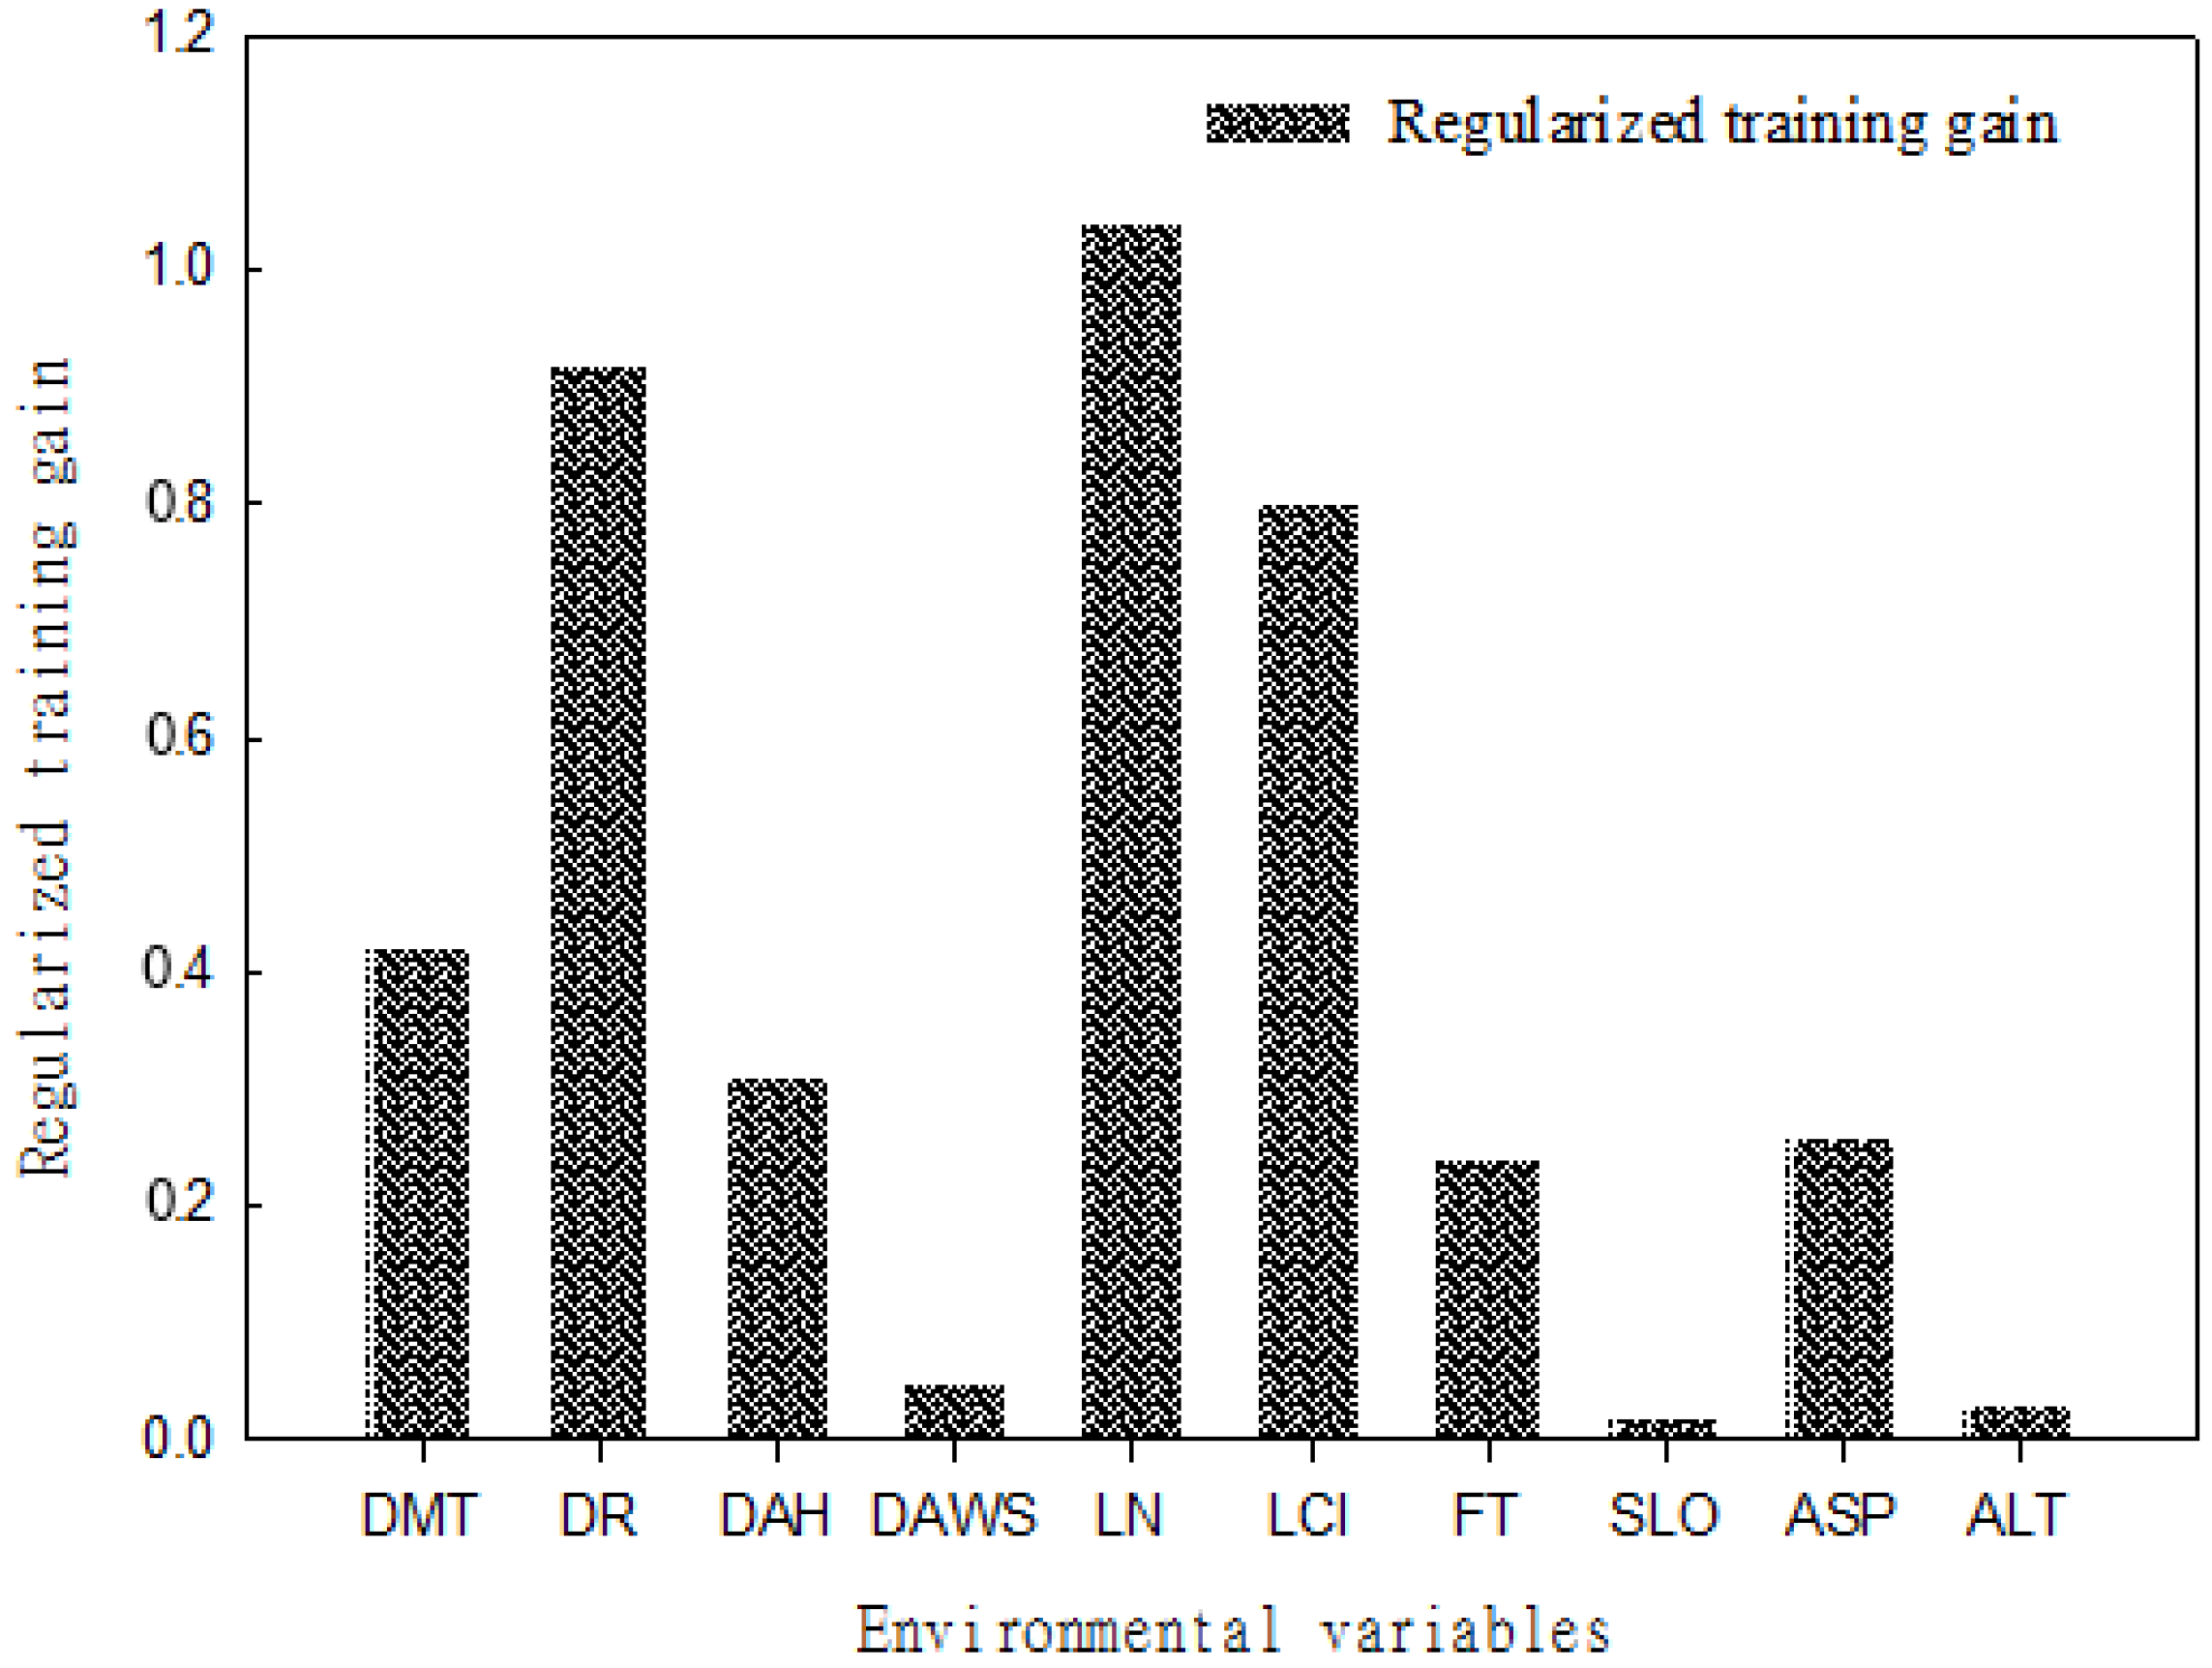
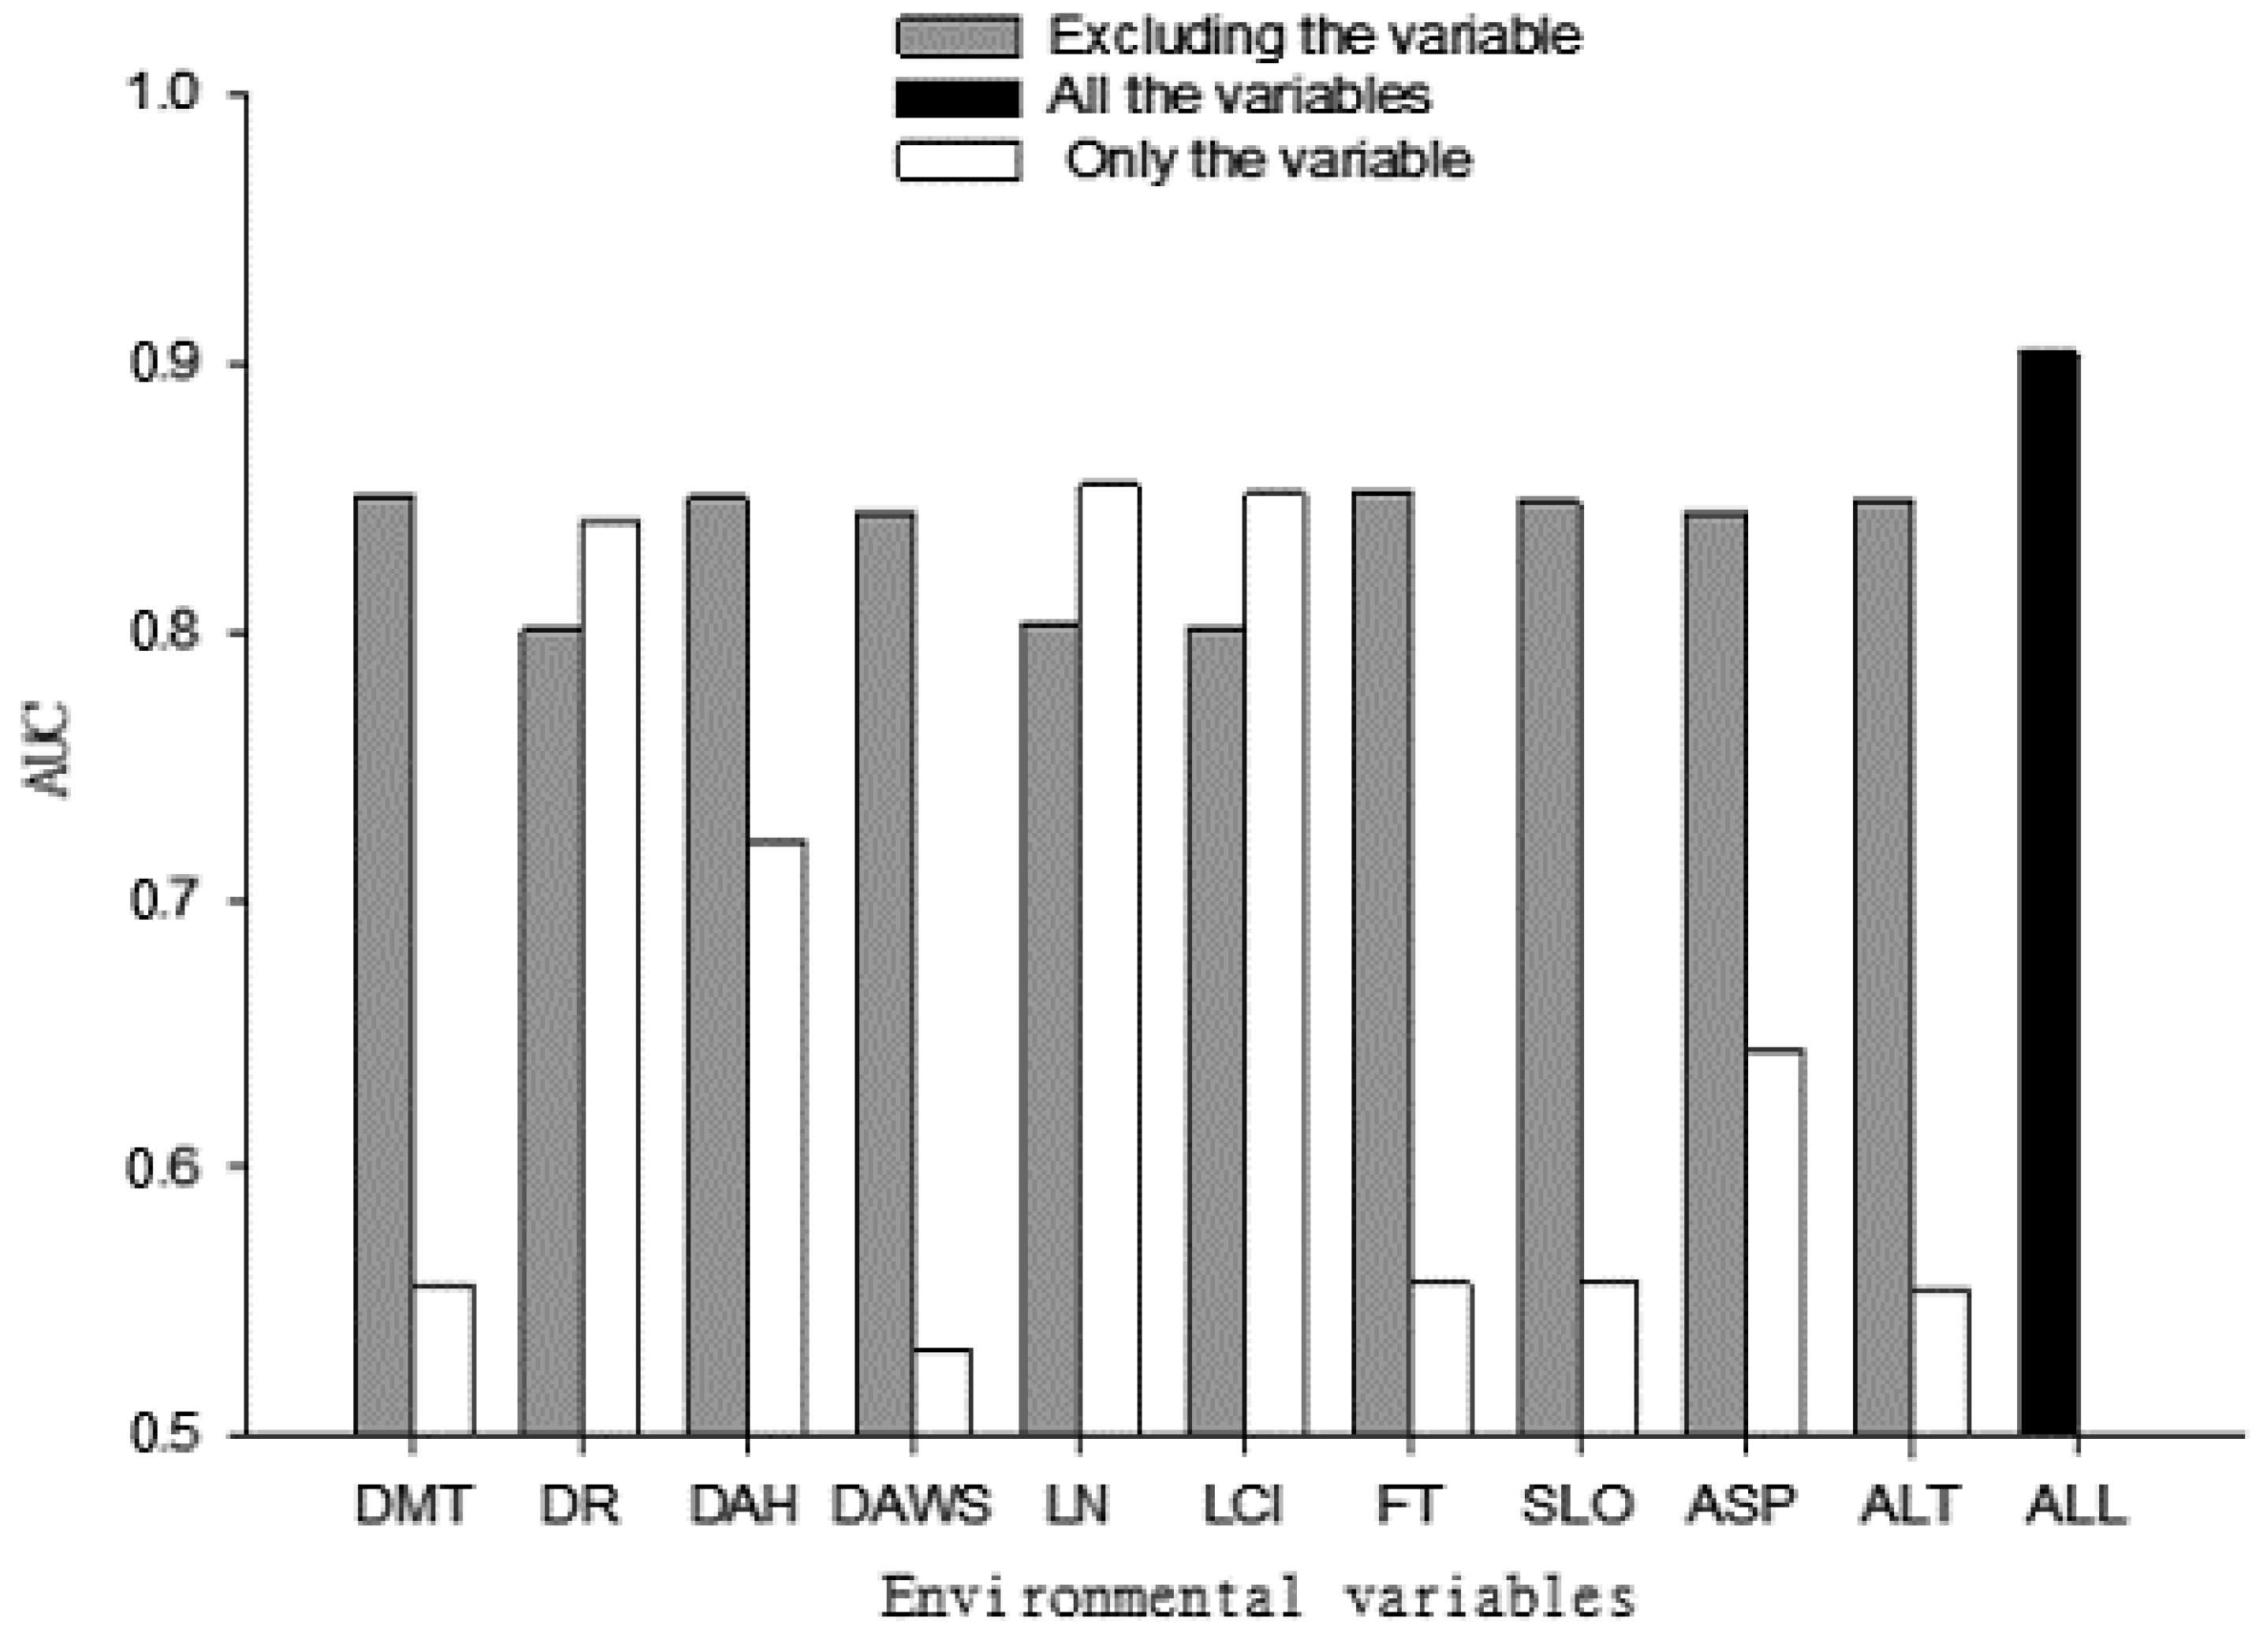
3.2. Variables Contribution to the Predicted Model
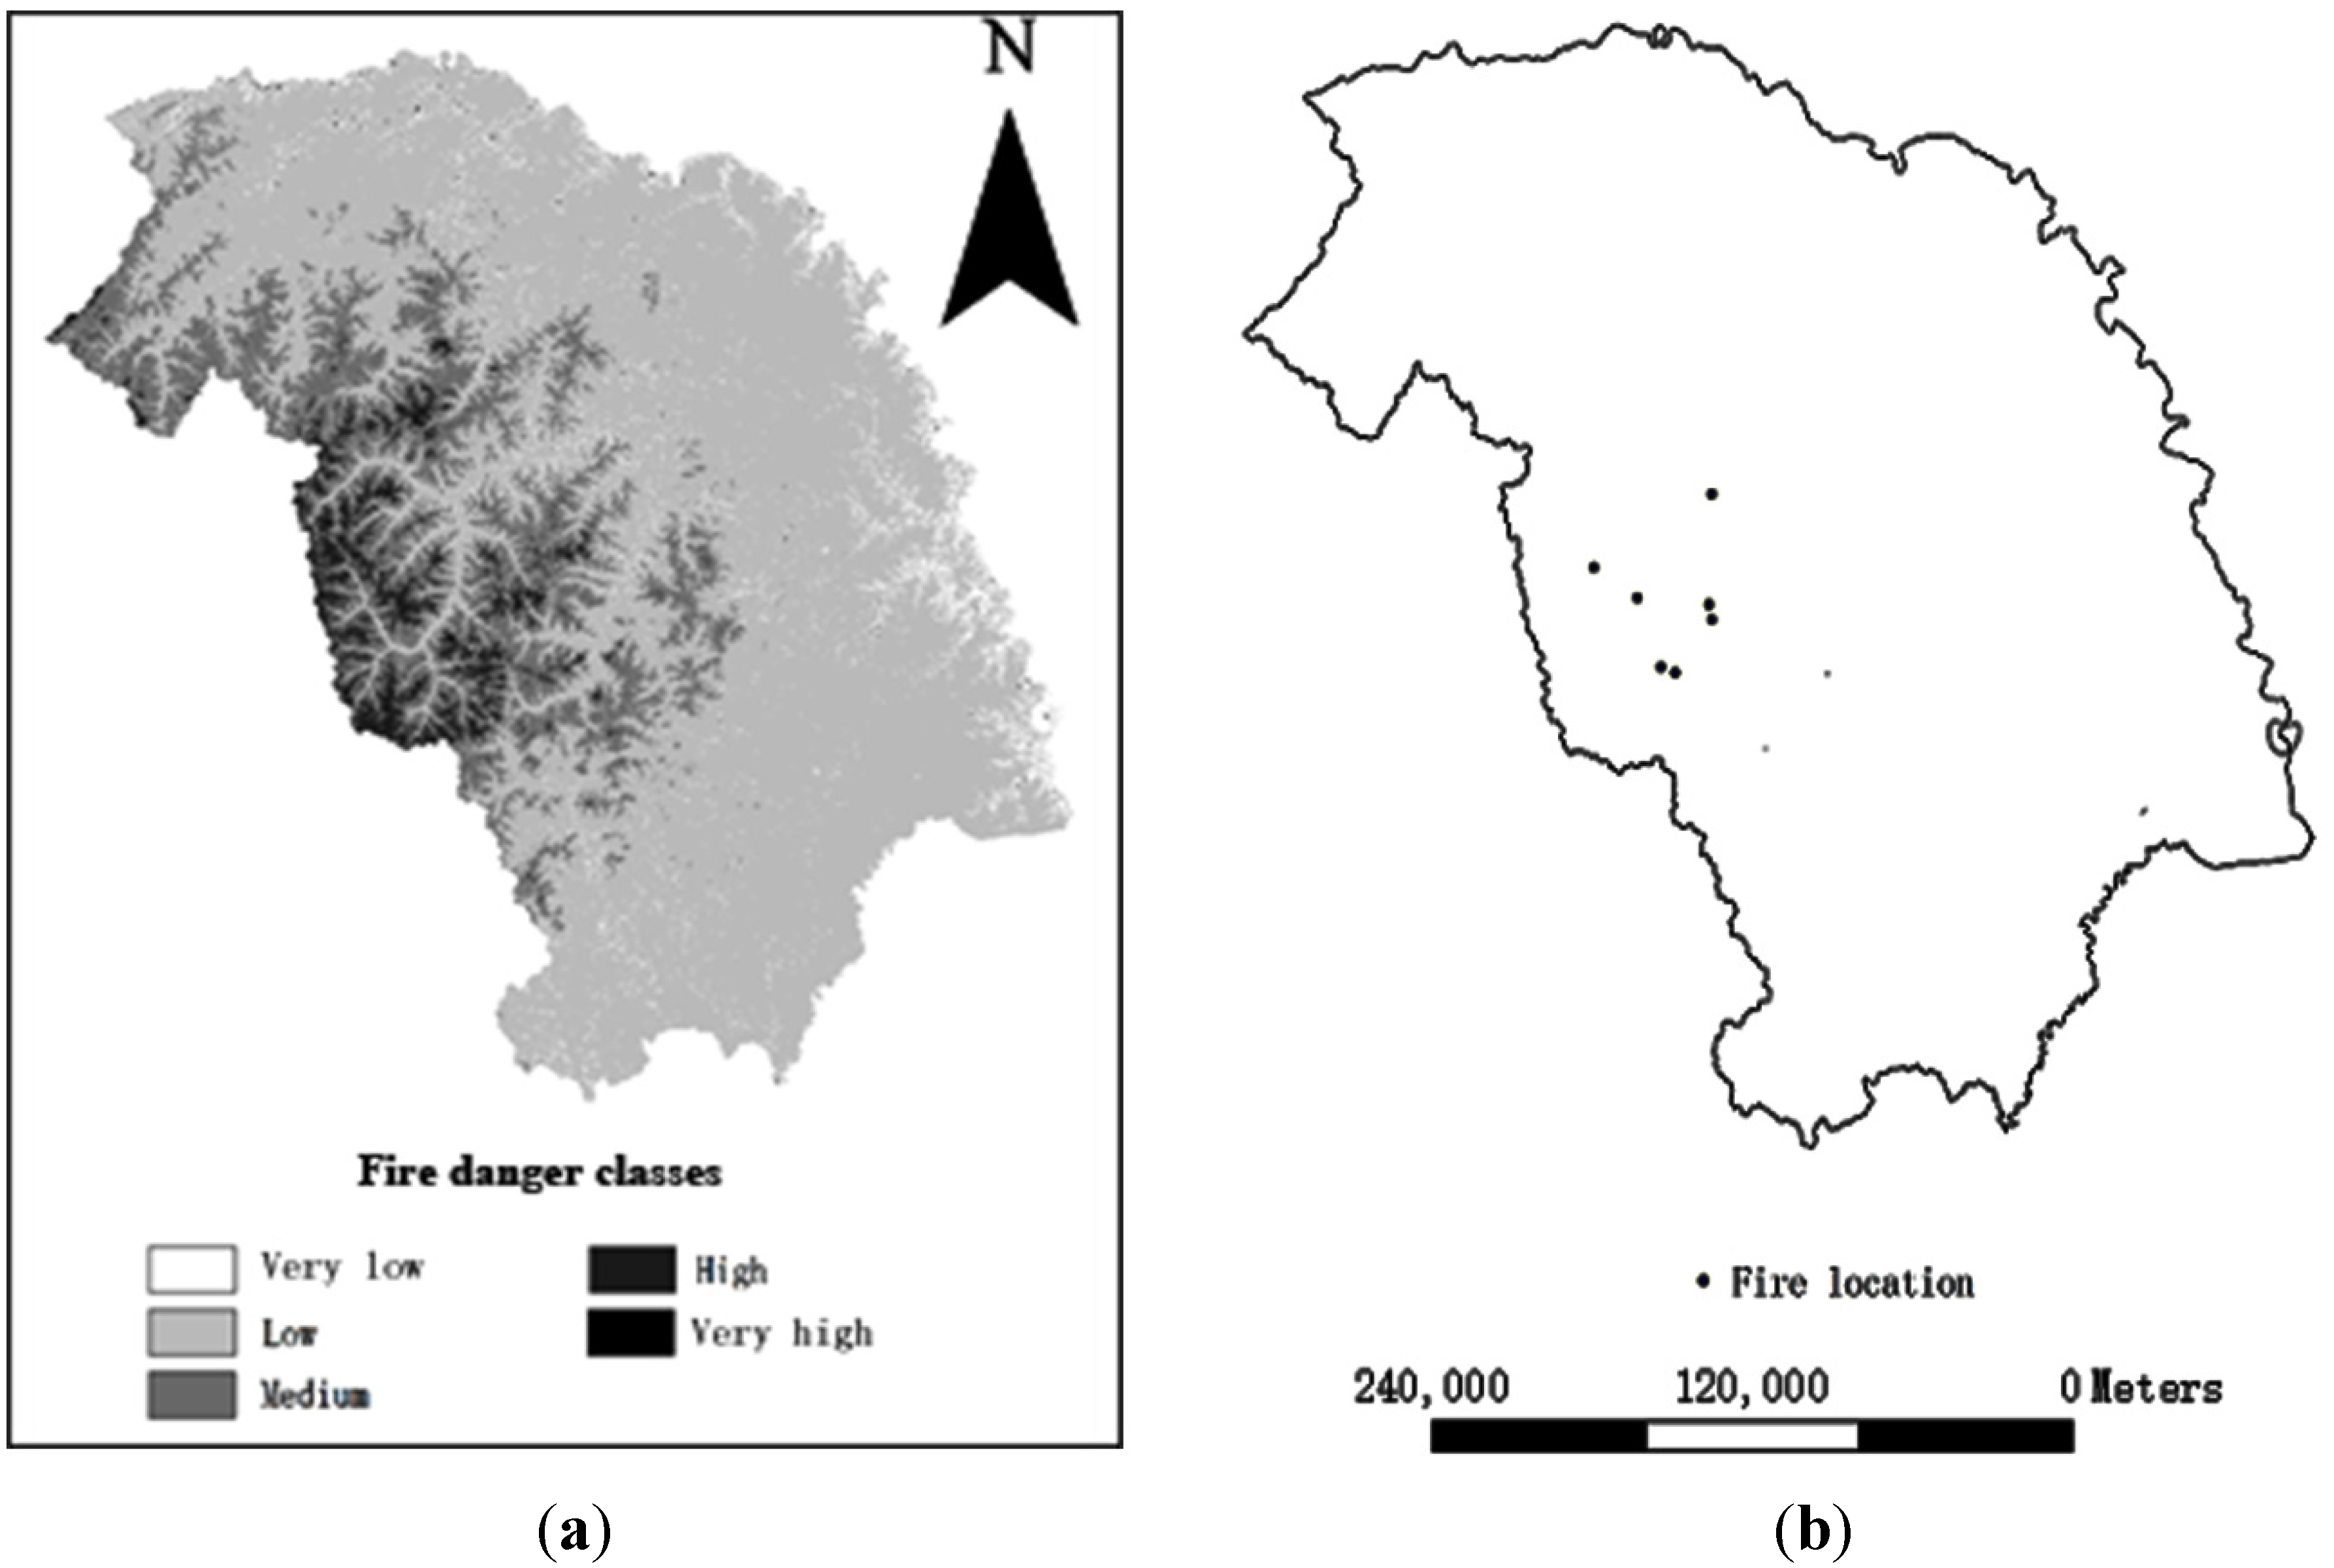
The regularized gain values of number of strikes (LN), rainfall (DR), and lightning current intensity (LCI) were significantly higher than other environmental variables (Figure 2). This suggested that these three variables had the largest contribution to the prediction model. The gain values of other variables were low, and they were as follows, in descending order: maximum temperature (DMT), average relative humidity (DAH), aspect (ASP), fuel type (FT), average wind speed (DAWS), altitude (ALT), and slope (SLO).
The AUC values of rainfall (DR), lightning current intensity (LCI) and number of strikes (LN) were significantly higher than other variables when including only each variable in model training data (Figure 3). When the three variables (DR, LCI and LN) were excluded, the AUC values in model training clearly decreased compared to those when including all the variables. This suggests that the prediction accuracy improves significantly when the three variables are included in the model training. As to other environmental variables, the AUC values decreased when excluded compared to including all variables, but the AUC values markedly declined when only including those values. This indicates that these variables did not contribute to the model prediction accuracy in a significant fashion.
The importance ordering of the environment variables obtained by jack-knifes of regularized training gain is roughly consistent with that derived from the AUC values method. Number of strikes (LN), lightning current intensity (LCI) and rainfall (DR) were the top three in importance sorting by both methods. It was suggested that the three variables were primary factors impacting forest lightning fire occurrence. Average wind speed (DAWS), altitude (ALT) and slope (SLO) ranked last in order of importance, indicating that these variables had little effect lightning fire occurrence.
Figure 2. The relative contribution of environment variables to the model according to a jack-knife of regularized training gain (codes for the variables are as given in Table 1).
Forests 06 01422 g002
Figure 3. The relative contribution of environment variables to the model according to the AUC value method (AUC is the area under the curve of the sensitivity vs. 1—Specificity plot; codes for the variables are as given in Table 1).
Forests 06 01422 g003

3.3. Model Fit

Prediction of lightning fire occurrence can be conducted after a lightning strike. After the lightning location system detects lightning data, all the environment variable data are input into the Maxent software in the form of raster layers, and the software will automatically calculate the fire probability value of each grid cell and output the results in the form of raster layers. The probability values, ranging from 0 to 1, represent the risk of lightning fire occurrence, which was divided into five classes in the study: very low (0–0.2), low (0.2–0.4), moderate (0.4–0.6), high (0.6–0.8), and very high (0.8–1). Lightning data is dynamic and changes every day, and therefore the fire danger rating map is also updated dynamically with lightning data.
Observation on a day with many fires was compared with the modeled probability of fire occurrences on that day to examine the fit of the model. Figure 4 shows the modeled fire occurrence on September 26, 2010 and how they were in agreement with those observed. In locations where actual fire occurred, the value of fire danger classes is relatively high. Otherwise, the value of fire danger classes is relatively low. The western region has a relative higher fire danger compared with the other area. Seven fires occurred in that day and all fires occurred in the locations of high or very high fire danger classes.
Figure 4. Comparison between the modelled fire danger rating and observed fire occurrence on September 26, 2010. The predicted model performed well in terms of accuracy relative to a random model (AUC = 0.5), with a mean AUC and maximum kappa values of 0.866 and 0.782 respectively. The Maxent model is adequate for predicting lightning fire occurrence in this region.
Forests 06 01422 g004

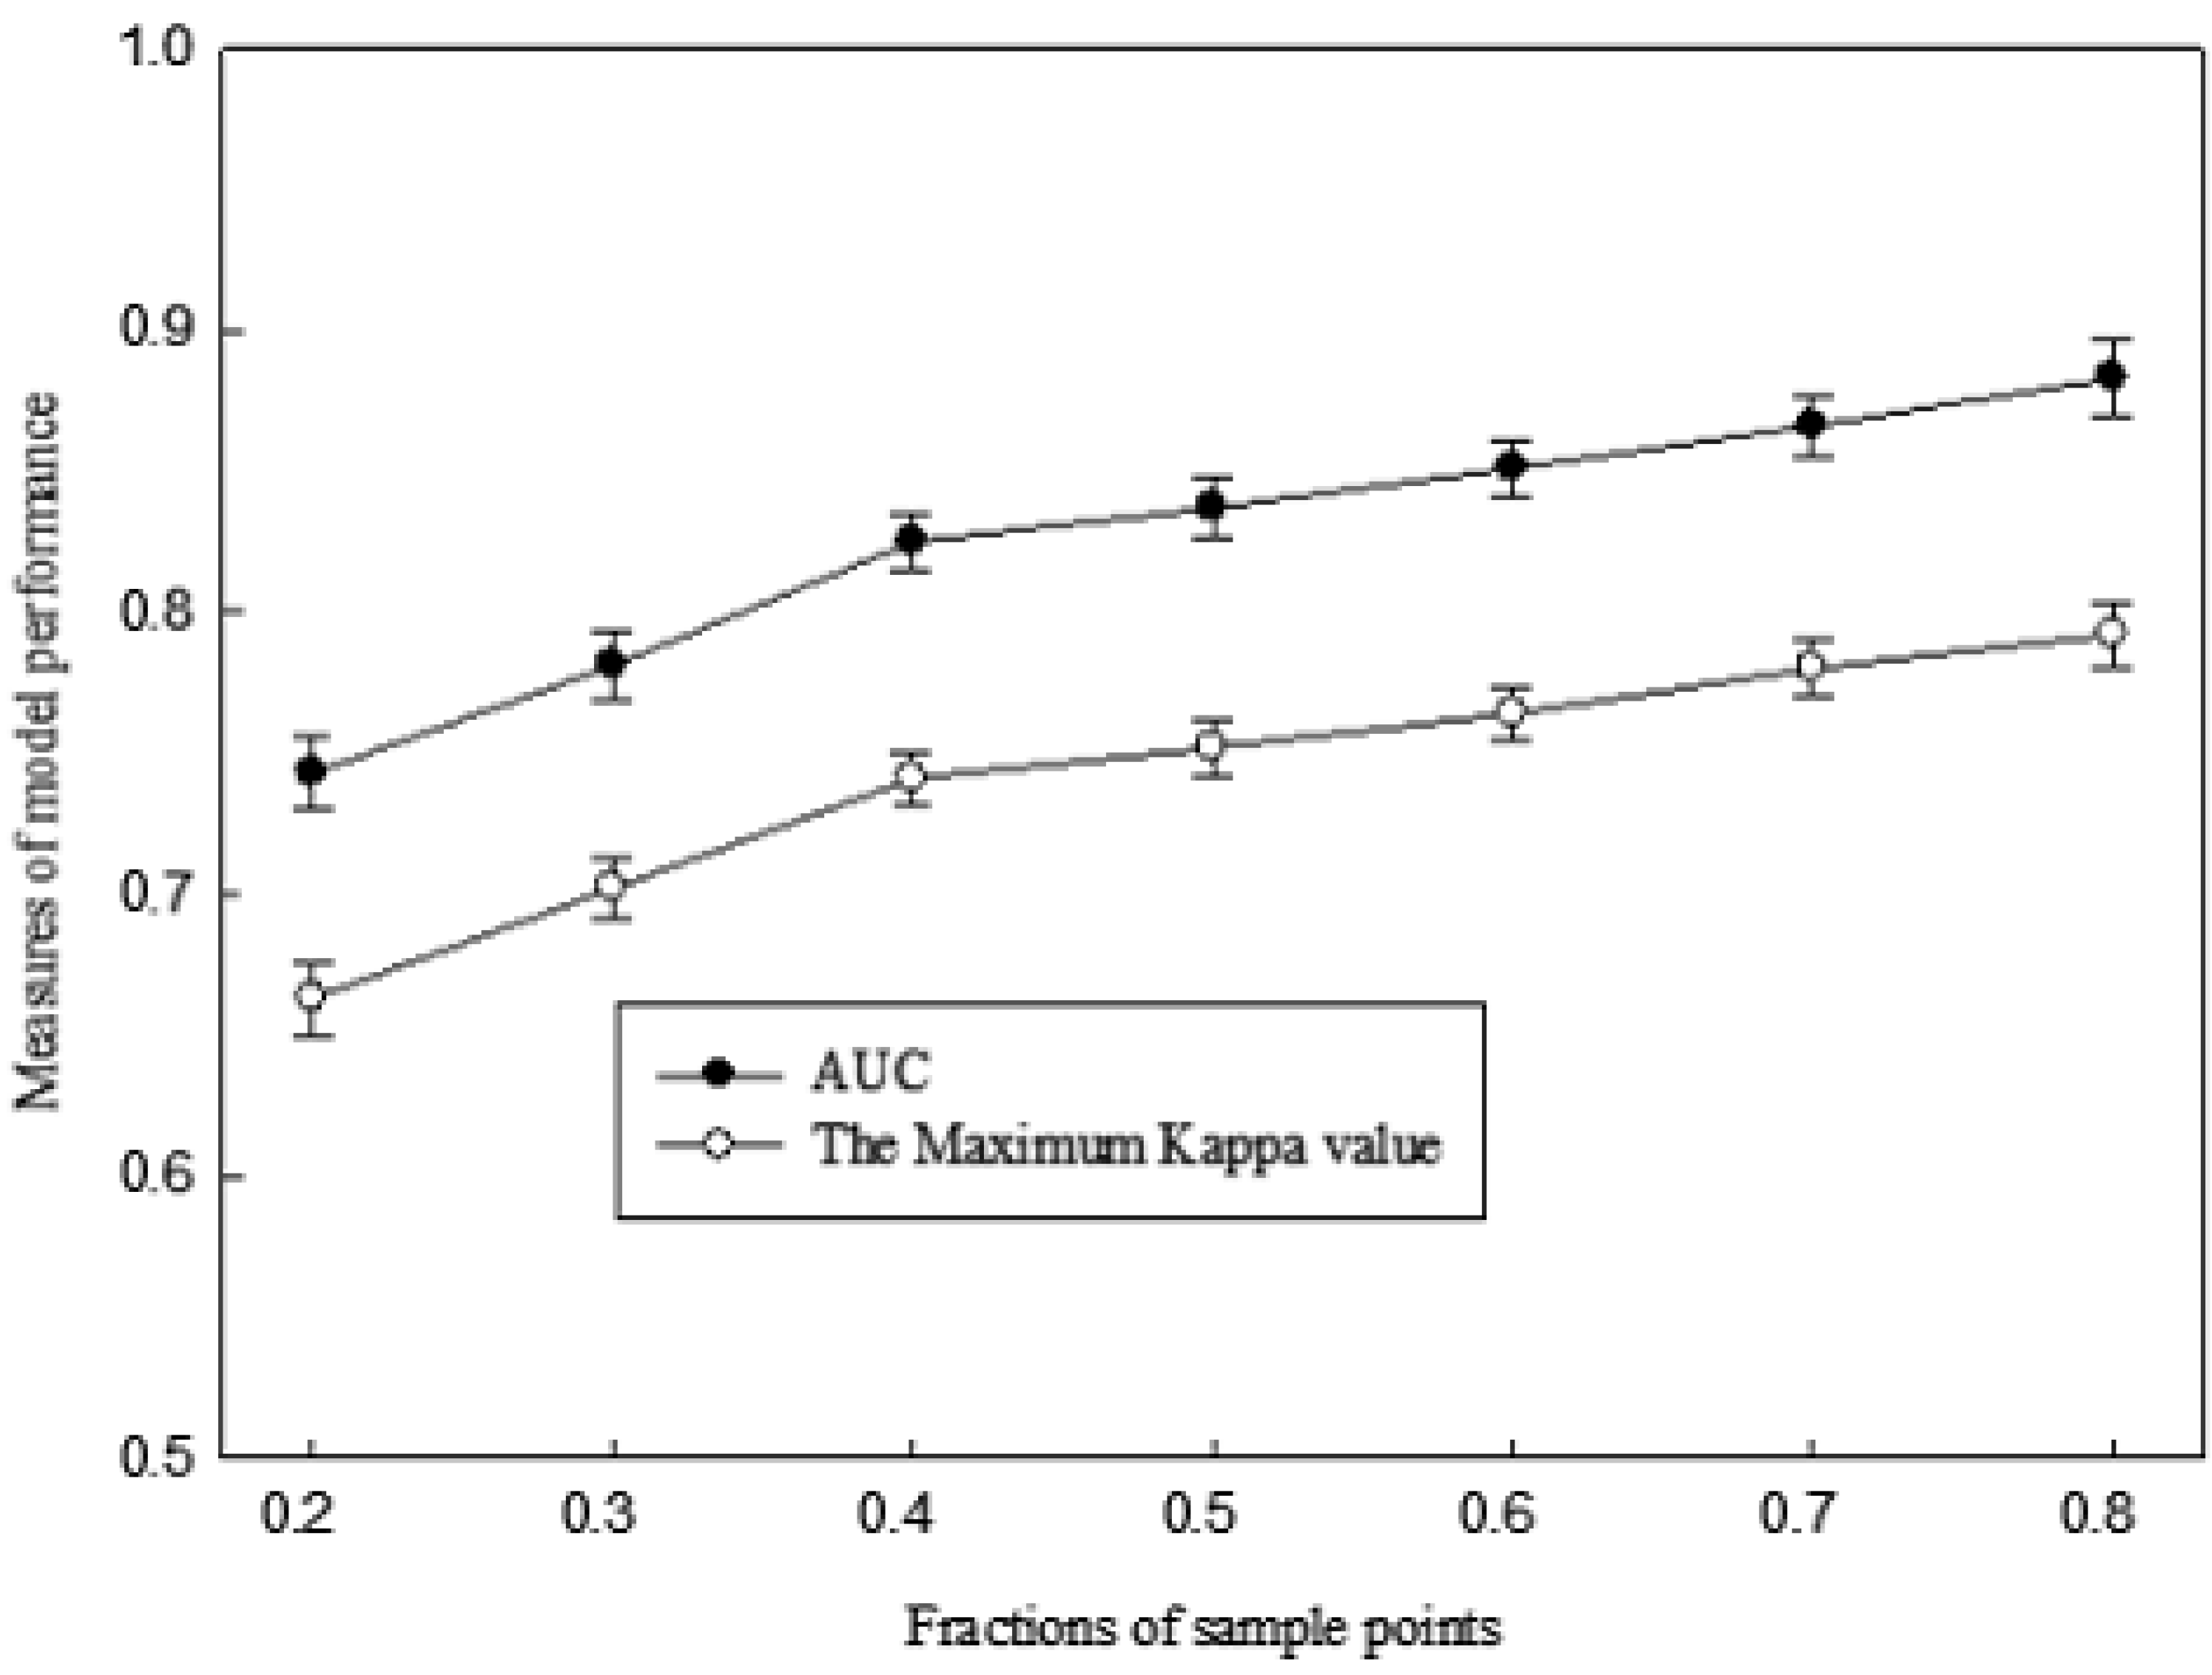
3.4. Effect of Sample Size on Model Predictions

When different proportions of data were selected for model training, the maximum kappa value and the AUC values of the model varied accordingly. With an increase in the proportion of training data, the maximum kappa and AUC values presented an increasing trend (Figure 5). Model performance in Maxent relative to that of the full data set is still acceptable, or at least informative, when 4/10 of the total observations were used for model training in this study region. However, the models experienced substantial loss of prediction accuracy when 3/10 of the available observations were used. For more than 4/10 of the total observations in the study, all AUC values and the maximum kappa values were more than 0.75, with average values of 0.859 and 0.772, respectively, indicating that the predicted models had a higher prediction accuracy in the range of the training data.
Figure 5. The area under the curve (AUC, mean ± SD) and the maximum kappa value for 10 iterations of the Maxent model as a function of increasing fraction of sample points for the Daxinganling region in China (AUC is the area under the curve of the sensitivity vs. 1—specificity plot).
Forests 06 01422 g005

4. Discussion

4.1. Factors Influencing Performance of the Predicted Model

According to the AUC and kappa statistics used for evaluation, the Maxent model developed in this study was found to be suitable for predicting lightning-caused fire occurrence in Daxinganling region of China. The AUC and the maximum kappa values were on average 0.866 and 0.782, respectively, for the validation sample, depending on the size of the data set analyzed. The values of the prediction accuracy obtained were less than those obtained in some studies on the occurrence of lightning-caused fires in other regions [1,28].This is primarily due to the factors discussed below. First of all, the key to the Maxent model application is the choice of characteristic function. The characteristic function represents the way environment variables respond to forest lightning fire occurrence. This study chose the result as the characteristic function for the Maxent software based on the relationship between species distribution and environment variables. The relationship between lightning fire occurrence and environment variables is very complex, which is very difficult to express with the characteristic function. Therefore, exploring new characteristic functions more applicable to lightning fire occurrence may improve the prediction accuracy of the model. Secondly, the interpolation of meteorological data between weather stations may have introduced a source of potential variability. There were only 10 meteorological stations used in the study area, and therefore the interpolation accuracy was inevitably affected by the limited number of weather stations. Improving estimation of the spatial distribution of precipitation is a likely key to improving lightning fire occurrence prediction. Spatial interpolation of precipitation data might be improved by increasing the density of weather stations, or by assimilating ground- or satellite-based radar reflectivity data. Finally, the sample size may be another important factor influencing the prediction accuracy. Our results suggested that the prediction accuracy increased with an increase in the proportion of training sample data (Figure 5). Since the lightning location system was constructed in 2005, our study was limited to the historical lightning fire data during the 2005-2010 periods. With the increase of historical sample data, the prediction accuracy of the model will be improved.

4.2. Environmental Determinants of Lightning Fire Occurrence

The contribution of environment variables in the model suggested that rainfall was one of the strongest determinants in lightning fire occurrence (Figure 2). Rainfall can increase dead fuel moisture content, which is one of the best variables to explain the incidence of lightning-induced fire [30]. The occurrence of dry thunderstorms is one of the most important variables in the probability of lightning induced ignition. It was reported that dry thunderstorms (defined as thunderstorms without significant concurrent rainfall) were common and an important contributor to fire ignition [3,5]. A lightning fire is more likely to be observed when precipitation on the day of a lightning strike is null or negligible, possibly because greater precipitation extinguished fires prior to discovery [38,39].
It was demonstrated that occurrence of lightning fires was largely influenced by the number of lightning strikes but not lightning discharges (Figure 2 and Figure 3). Lightning is more likely to cause ignition due to a greater likelihood of a long continuum current [30,31,40]. Shindo and Uman [41] studied 90 cloud-to-ground discharges and found that only 1 of 19 single-stroke discharges was followed by a long-continuing current, whereas 21 discharges of the remaining 71 multiple-stroke discharges contained a long continuum current. These results supported our findings that increased probability of multiple-stroke discharges leaded to an increased probability of ignition.
The topographic variables (altitude, slope and aspect) had less effect on the occurrence of lightning fires (Figure 2 and Figure 3). Similar results were found in other studies [41]. It is reported that fires occurring on terrain facing suntraps were more likely to spread due to higher solar incidence and comparatively drier fuel [42]. It was found that lightning-induced fires mainly occurred on steeper slopes [43,44]. This may be related to the spatial scale of environmental variables data in the study. Because of the spatial precision of the lightning location system, the spatial resolution of the raster data in this study was limited to 1 km, which therefore ignored terrain differences within the scale of 1 km.

4.3. Practical Insights for Fire Management

The models developed in this study can be very useful for local forest fire management agencies to improve their forest fires prevention actions. The outputs of this model can be considered robust and are good indicators for spatially explicit assessment of lightning fire occurrence, and hence it is a useful tool for forest fire prevention planning and coordination of regional efforts in the Daxinganling region. The previous wet/dry conditions before a lightning strike, in terms of whether the forest floor was drying, had a significant influence on the probability of a lightning strike. The probability of an ignition will decrease if rain occurred during previous days. Therefore, considering precipitation during previous days as a dry or wet event is likely crucial to improving lightning fire occurrence prediction. Once actual lightning activity has been observed concurrent with previous precipitation, the map of ignition probability can be created to identify the areas that are sensitive to ignition. Forest fire managers can target configuration of manpower and material resources to improve the efficiency of forest fire management according to the spatial distribution of fire danger ratings. Using the Maxent model, the map of potential fire danger could be prepared for the current operational day as well as for several days in the future using forecasted weather. If the Maxent model is applied to other areas, it would require validation for applicability with local history fire and the environmental data.

5. Conclusions

Based on the historical fire data and the environment variables data influencing forest lightning fire occurrence, it was demonstrated that the habitat distribution model Maxent performed well in modelling lightning fire occurrence in the Daxinganling Mountains area in China. Our results also showed that rainfall and the number and current intensity of lightning were the major determinants of lightning fire occurrence, while the influences of vegetation and geographic variables on lightning fire occurrence were not obvious in this region. The prediction accuracy of the model increased with the sample size. Data with a longer history period can improve the prediction ability of the model, which will help construct a superior predictive model of fire occurrence. The model will be useful for forest managers to improve their fires prevention actions and focus their efforts on endangered sites predicted to have a high possibility of lightning fire occurrence.
Lightning fire is an active ecological factor and acts on forest ecosystem frequently, with a dual nature. On the one hand, fire can burn up forests and do great damage to a forest's structure and function. On the other hand, fire can be regarded a tool and means of forest management. Fire return interval and intensity have played a role in changing plant species composition and affecting succession of forest vegetation in the Daxinganling area. In the north of the study area, the fire return interval is 110~120 a, while the fruition age of Larix-Betula-Pinus forest is 70~150 a, so low or moderate intensity of fire can maintain relatively stability for the forest. However, the fire return interval is 30~40 a at most in the central or south-east area, so it is impossible to fulfill self-renewal for Larix forest, and as a result there is no distribution of Larix forest in this area. Due to high-intensity fire, Larix forest will have a retrogressive succession towards Betula forest. Betula forest will have a progressive succession towards Larix forest due to the interference of low-intensity fire. A Larix forest community can develop better with a certain interval of mild fire interference.

Acknowledgments

We would like to thank Yu Sun for providing the lightning fire data. This study was funded by the Beijing Municipal Science and Technology Project (D0706001000091).

Author Contributions

Feng Chen, Shukui Niu and Yongsheng Du conceptualized the study and analyzed the data. Feng Chen drafted the manuscript. Xiaojuan Tong and Xiaodong Liu reviewed the manuscript and improved English language. Jinlong, Zhao also analyzed the data. All the authors read and approved the final version of the manuscript.

Conflicts of Interest

The authors declare no conflict of interest.

References

  1. Renard, Q.; Pélissier, R.; Ramesh, B.R.; Kodandapani, N. Environmental susceptibility model for predicting forest fire occurrence in the Western Ghats of India. Int. J. Wildland Fire 2012, 21, 368–379. [Google Scholar] [CrossRef]
  2. Shu, L.F.; Wang, M.Y.; Tian, X.R.; Li, Z.Q.; Xiao, Y.J. Fire environment mechanism of lightning fire ccurrence in Daxinganling region, China. Sci. Silv. Sin. 2009, 22, 18–24. [Google Scholar]
  3. Lei, X.L.; Zhou, G.S.; Jia, B.R.; Li, S. Relationships of forest fire with lightning in Daxinganling Mountains, Northeast China. Chin. J. Appl. Ecol. 2012, 23, 15–22. [Google Scholar]
  4. Podur, J.; Martell, D.L.; Csillag, F. Spatial atterns of lightning-caused forest fires in Ontario, 1976–1998. Ecol. Model. 2003, 164, 1–20. [Google Scholar] [CrossRef]
  5. Wotton, B.M.; Martell, D.L. A lightning fire occurrence model for Ontario. Can. J. For. Res. 2005, 35, 1389–1401. [Google Scholar] [CrossRef]
  6. Du, C.Y.; Li, S.; Liu, D.; Li, X.F.; Yu, C.L. Spatiotemporal distribution of lightning-caused forest fires in Daxinganling area. J. Nat. Disaster 2010, 19, 74–78. [Google Scholar]
  7. Vankat, J.L. General patterns of lightning ignitions in Sequoia National Park, California. In Proceedings of the Symposium and Workshop in Wilderness Fires, Missoula, Montana, 15–18 November 1983; Lotan, J.E., Kilgore, B.M., Fischer, W.C., Mutch, R.W., Eds.; USDA Forest Service, Intermountain Forest and Range Experiment Station: Fort Collins, CO, USA, 1983; pp. 408–411. [Google Scholar]
  8. Fuquay, D.M.; Baughman, R.G.; Taylor, A.R.; Hawe, R.G. Characteristics of seven lightning discharges that caused forest fire. J. Geophys. Res. 1967, 72, 6371–6373. [Google Scholar] [CrossRef]
  9. Fuquay, D.M.; Taylor, A.R.; Hawe, R.G.; Schmid, C.W. Lightning discharges that caused forest fires. J. Geophys. Res. 1972, 77, 2156–2158. [Google Scholar] [CrossRef]
  10. Fuquay, D.M.; Baughman, R.G.; Latham, D.J. A Model for Predicting Lightning Fire Ignitions in Wildlands Fuels; USDA Forest Service research Paper INT–217: Ogden, UT, USA, 1979. [Google Scholar]
  11. Krider, E.P.; Noggle, R.C.; Uman, M.A. A gated, wideband magnetic direction finder for lightning return strokes. J. Appl. Meteorol. 1976, 15, 301–306. [Google Scholar]
  12. Kourtz, P.H.; Todd, J.B. Predicting the Daily Occurrence of Lightning Caused Forest Fires; Information Report PI-X-112; Forestry Canada, Petawawa National Forestry Institute: Petawawa, Canada, 1992. [Google Scholar]
  13. Burrows, W.R. Dynamical-statistical models for lightning prediction to 48-hr over Canada and the United States. In Proceedings of the 20th Lightning Detection Conference, Tucson, AZ, USA, 21–23 April 2008.
  14. Miller, A.J. Least squares routines to supplement those of gentleman. J. Roy. Statist. Soc. 1992, 41, 458–478. [Google Scholar]
  15. Andserson, K. A model to predict lightning-caused fire occurrences. Int. J. Wildland Fire 2002, 11, 163–172. [Google Scholar] [CrossRef]
  16. Vilar, L.; Nieto, H.; Martin, M.P. Integration of lightning- and human-caused wildfire occurrence models. Hum. Ecol. Risk Assess 2010, 16, 340–364. [Google Scholar] [CrossRef]
  17. Castedo-Dorado, F.; Rodriguez-Perez, J.R.; Marcos-Menendez, J.L.; Alvarez-Taboada, M.F. Modelling the probability of lightning-induced forest fire occurrence in the province of Leon (NW Spain). For. Syst. 2011, 20, 95–107. [Google Scholar]
  18. Magnussen, S.; Taylor, S.W. Prediction of daily lightning- and human-caused fires in British Columbia. Int. J. Wildland Fire 2012, 21, 342–356. [Google Scholar] [CrossRef]
  19. Krenn, R.; Hergarten, S. Cellular automaton modelling of lightning-induced and manmade forest fires. Nat. Hazards Earth Syst. Sci. 2009, 9, 1743–1748. [Google Scholar] [CrossRef]
  20. Dickson, B.G.; Prather, J.W.; Xu, Y.; Hampton, H.M.; Aumack, E.N.; Sisk, T.D. Mapping the probability of large fire occurrence in northern Arizona, USA. Landsc. Ecol. 2006, 21, 747–761. [Google Scholar] [CrossRef]
  21. Albert-Green, A.; Dean, C.B.; Martell, D.L.; Woolford, D.G. A methodology for investigating trends in changes in the timing of the fire season with applications to lightning-caused forest fires in Alberta and Ontario, Canada. Can. J. For.Res. 2013, 43, 39–45. [Google Scholar] [CrossRef]
  22. Guo, F.T.; Hu, H.Q.; Jin, S.; Ma, Z.H.; Zhang, Y. Relationship between forest lightning fire occurrence and weather factors in Daxinganling Mountains based on negative binomial model and zero-inflated negative binomial models. Chin. J. Plant. Ecol. 2010, 26, 87–92. [Google Scholar]
  23. Deblauwe, V.; Barbier, N.; Couteron, P.; Lejeune, O.; Bogaert, J. The global biogeography of semi-arid periodic vegetation patterns. Glob. Ecol. Biogeogr. 2008, 17, 715–723. [Google Scholar] [CrossRef]
  24. Phillips, S.J.; Anderson, R.P.; Schapire, R.E. Maximum entropy modeling of species geographic distributions. Ecol. Model. 2006, 190, 231–259. [Google Scholar] [CrossRef]
  25. Elith, J.; Phillips, S.J.; Hastie, T.; Dudík, M.; Chee, Y.E.; Yates, C.J. A statistical explanation of Maxent for ecologists. Divers. Distrib. 2011, 17, 43–57. [Google Scholar] [CrossRef]
  26. Chuvieco, E. Wildland Fire Danger Estimation and Mapping: The Role of Remote Sensing Data; World Scientific: River Edge, NJ, USA, 2003. [Google Scholar]
  27. Pyne, S.J.; Andrews, P.L.; Laven, R.D. Introduction to Wildland Fire, 2nd ed.; John Wiley and Sons: New York, USA, 1996. [Google Scholar]
  28. Parisien, M.A.; Moritz, M.A. Environmental controls on the distribution of wildfire at multiple spatial scales. Ecol. Monogr. 2009, 79, 127–154. [Google Scholar] [CrossRef]
  29. Thornton, P.E.; Running, S.W.; White, M.A. Generating surfaces of daily meteorological variables over large regions of complex terrain. J. Hydrol. 1997, 190, 214–251. [Google Scholar] [CrossRef]
  30. Flannigan, M.D.; Wotton, B.M. Lightning-ignited forest fires in northwestern Ontario. Can. J. For. Res. 1991, 21, 277–287. [Google Scholar] [CrossRef]
  31. Williams, E. Lightning and forest fires. In Forest Fires, Behavior and Ecological Effects; Johnson, E.A., Miyanishi, K, Eds.; Academic Press: San Diego, CA, USA, 2001; pp. 375–418. [Google Scholar]
  32. Guisan, A.; Zimmermann, N.E. Predictive habitat distribution models in ecology. Ecol. Model. 2000, 135, 147–186. [Google Scholar] [CrossRef]
  33. Phillips, S.J.; Dudik, M. Modeling of species distributions with Maxent: New extensions and a comprehensive evaluation. Ecography 2008, 31, 161–175. [Google Scholar] [CrossRef]
  34. Phillips, S.J. A Brief Tutorial on Maxent; AT&TLabs-Research: Florham Park, NJ, USA, 2005. [Google Scholar]
  35. Elith, J.; Graham, C.H.; Anderson, R.P.; Dudik, M.; Ferrier, S.; Guisan, A.; Hijmans, R.J.; Huettmann, F.; Leathwick, J.R.; Lehmann, A.; et al. Novel methods improve prediction of species’ distributions from occurrence data. Ecography 2006, 29, 129–151. [Google Scholar] [CrossRef]
  36. Landis, J.R.; Koch, G.C. The measurement of observer agreement for categorical data. Biometrics 1977, 33, 159–174. [Google Scholar] [CrossRef]
  37. Hosmer, D.; Lemeshow, S. Applied Logistic Regression; Wiley-Interscience: New York, NY, USA, 2000; p. 392. [Google Scholar]
  38. Hall, B.L. Precipitation associated with lightning ignited wildfires in Arizona and New Mexico. Int. J. Wildland Fire 2007, 16, 242–254. [Google Scholar]
  39. Rorig, M.L.; Mckay, S.J.; Ferguson, S.A.; Werth, P. Model-generated predictions of dry thunderstorm potential. J. App. Meteorol. Clim. 2007, 46, 605–614. [Google Scholar] [CrossRef]
  40. Larjavaara, M.; Pennanen, J.; Tuomi, T.J. Lightning that ignites forest fires in Finland. Agric. For. Meteorol. 2005, 132, 171–180. [Google Scholar] [CrossRef]
  41. Shindo, T.; Uman, M.A. Continuing current in negative cloud-to-ground lightning. J. Geophys. Res. Atmos. 1989, 94, 5189–5198. [Google Scholar] [CrossRef]
  42. De Vasconcelos, M.J.P.; Silva, S.; Tome, M.; Alvim, M.; Pereira, J.C. Spatial prediction of fire ignition probabilities: Comparing logistic regression and neural networks. Photogramm. Eng. Remote Sens. 2001, 67, 73–81. [Google Scholar]
  43. Conedera, M.; Cesti, G.; Pezzatti, G.B.; Zumbrunnent, T.; Spinedi, F. Lightning-induced fires in the Alpine region: An increasing problem. For. Ecol. Manag. 2006, 234, S68. [Google Scholar]
  44. Wierzchowski, J.; Heathcott, M.; Flannigan, M.D. Lightning and lightning fire, central cordillera, Canada. Int. J. Wildland Fire 2002, 11, 41–51. [Google Scholar] [CrossRef]

