Soil Organic Carbon Storage and Stability in the Aspen-Conifer Ecotone in Montane Forests in Utah, USA

Abstract
:1. Introduction
2. Materials and Methods
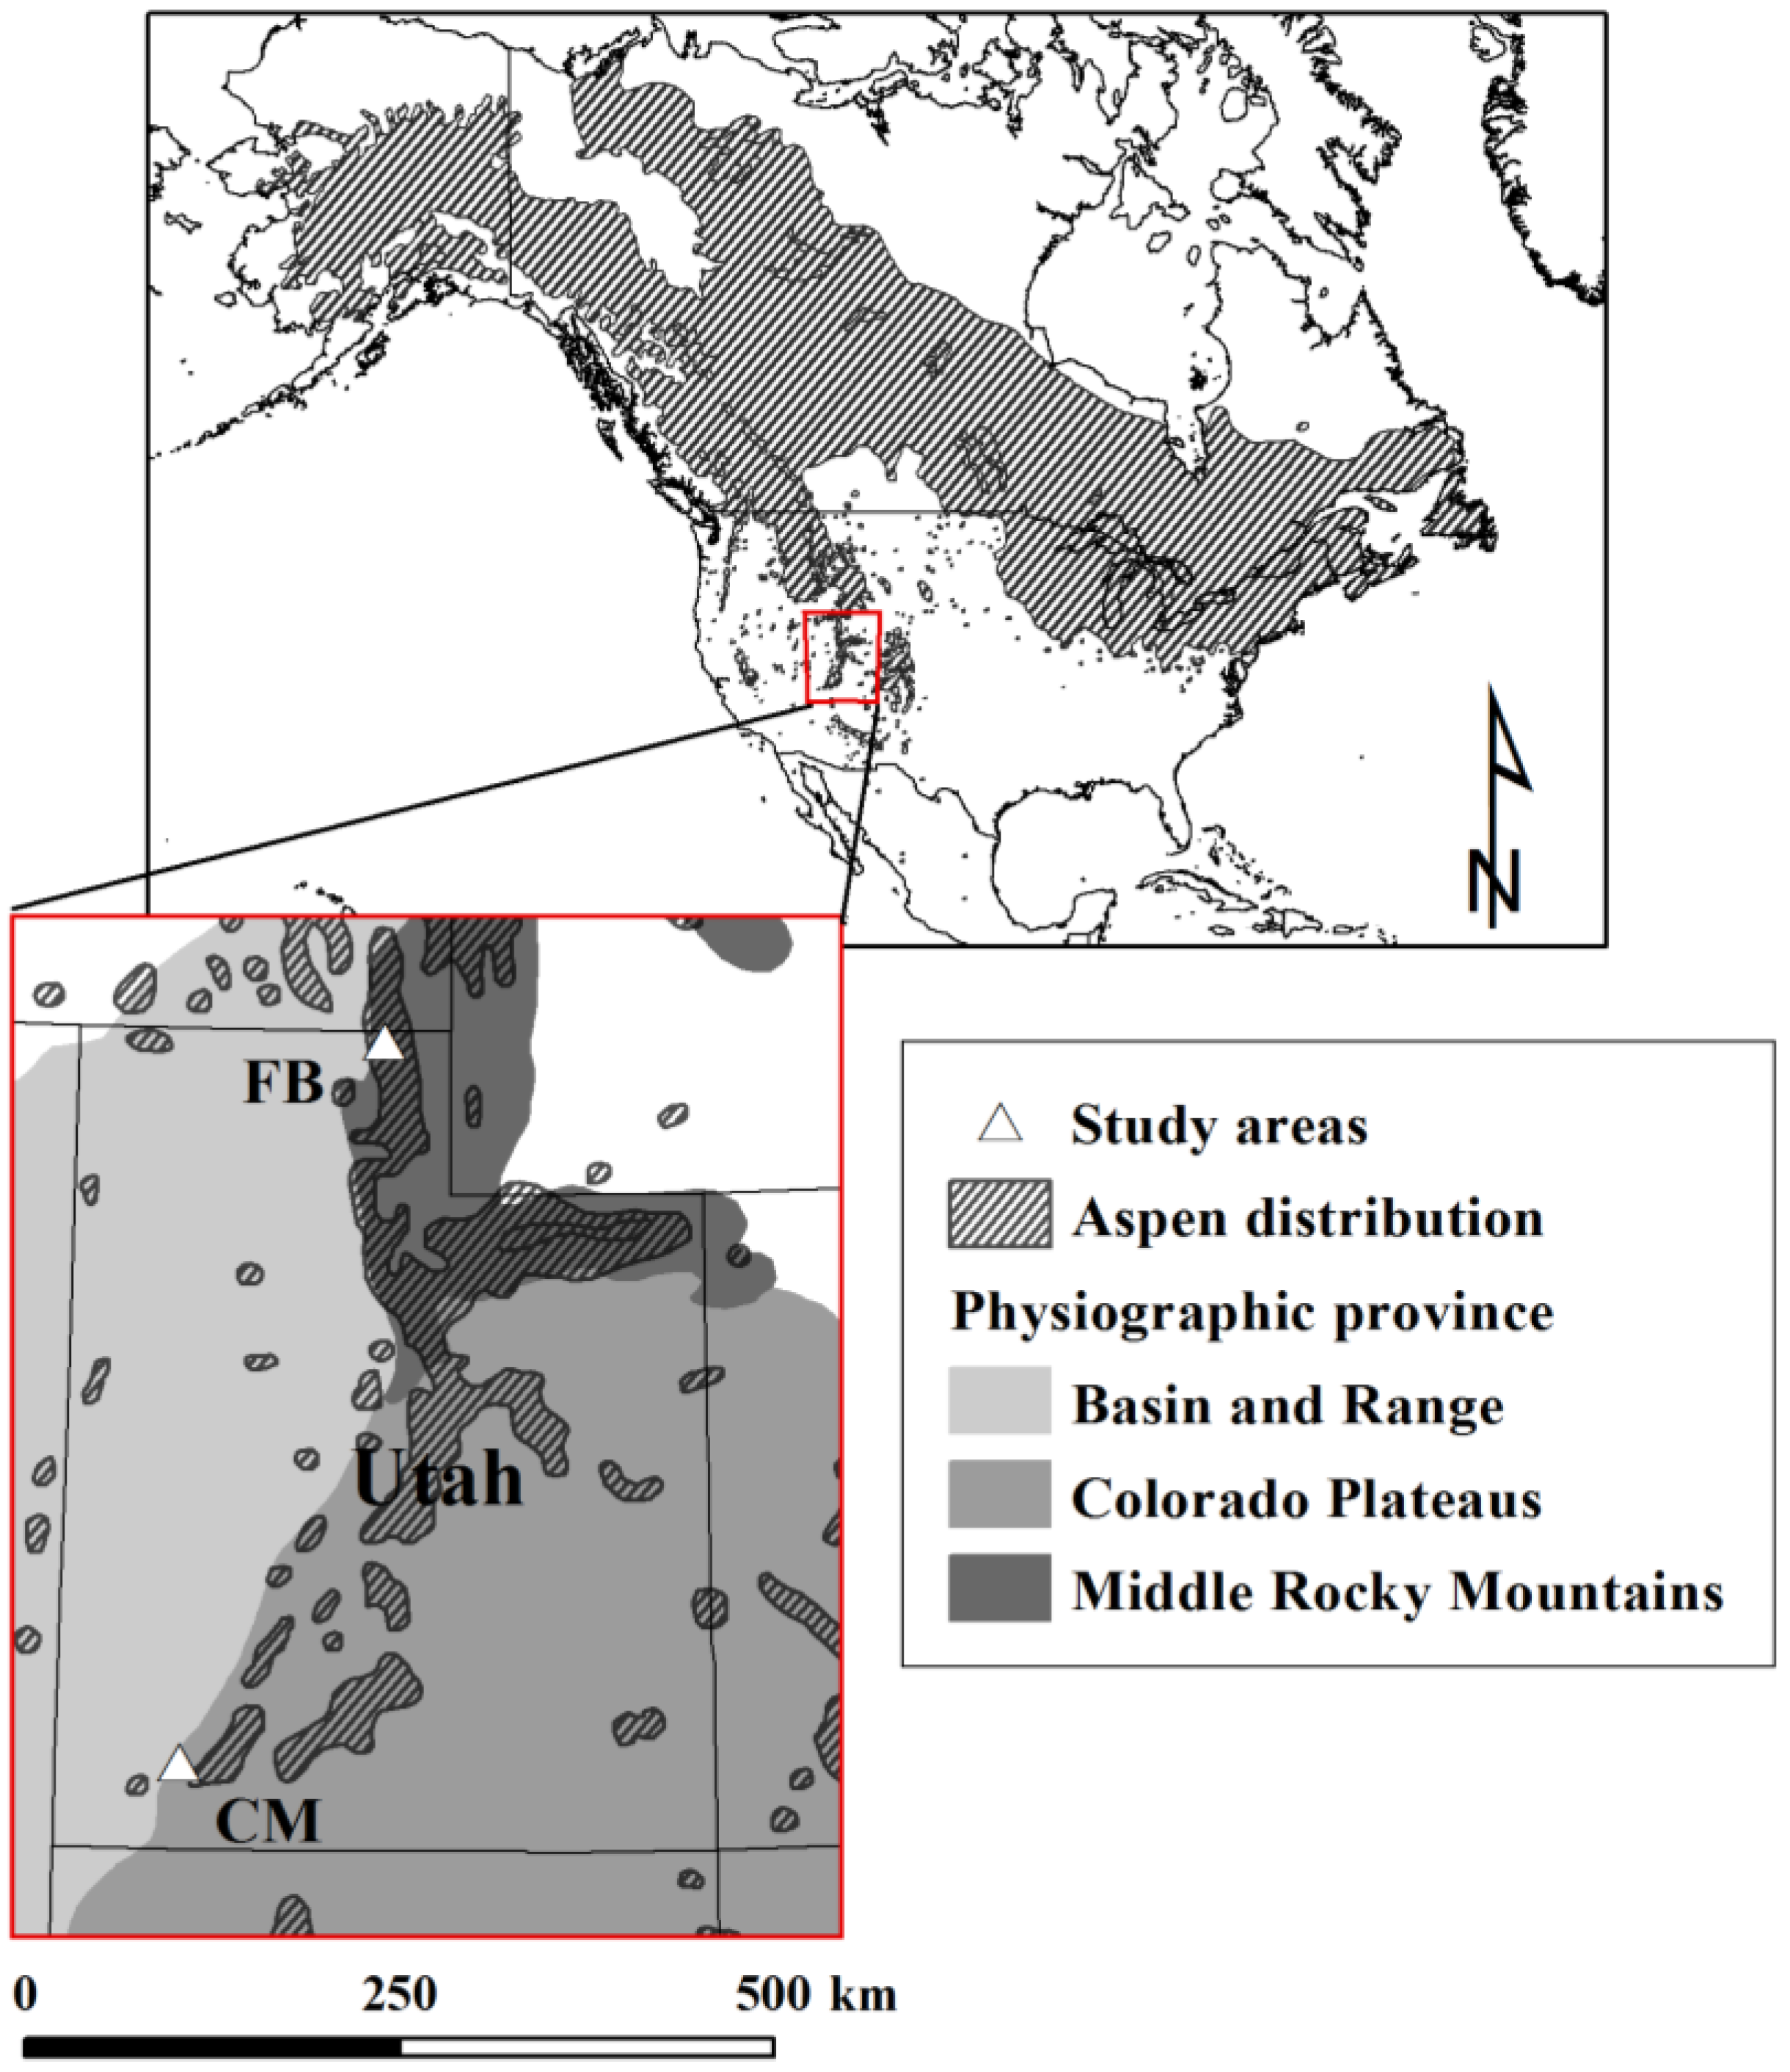
2.1. Study Sites
2.2. Study Design and Field Sampling

| Site | Elevation (m) | Slope (degrees) | Aspect | Parent Material |
|---|---|---|---|---|
| CM 1 | 2552 ± 8 | 14 ± 9 | N | Basalt |
| CM 2 | 2756 ± 12 | 24 ± 12 | N | Basic and intermediate igneous rock |
| CM 57 | 2773 ± 11 | 24 ± 11 | W | n.a. |
| CM 111 | 2685 ± 9 | 46 ± 2 | N | Limestone, sandstone and shale |
| FB 1 | 2098 ± 9 | 10 ± 4 | NE | Quartzite, sandstone and limestone |
| FB 2 | 2196 ± 18 | 15 ± 5 | E | Limestone |
| Site | Plot | Elevation (m) | Slope (degrees) | Aspect | Live Basal Area (m2 ha−1) | Contribution of Aspen to LBA (%) | Live Stem Density (n ha−1) | ||
|---|---|---|---|---|---|---|---|---|---|
| Aspen | Conifer | Aspen | Conifer | ||||||
| CM 5 | CM 5-1 | 2764 | 4 | NE | 28.9 | 6.1 | 82.5 | 1,055.6 | 223.9 |
| CM 5 | CM 5-2 | 2766 | 8 | NE | 0.0 | 67.0 | 0.0 | 0.0 | 2,499.4 |
| CM 5 | CM 5-3 | 2746 | 8 | NE | 35.5 | 17.5 | 66.9 | 649.2 | 519.4 |
| CM 5 | CM 5-4 | 2759 | 9 | NE | 21.4 | 0.3 | 98.4 | 710.0 | 41.8 |
| CM 8 | CM 8-1 | 2651 | 19 | NW | 43.0 | 0.0 | 100.0 | 1,353.0 | 0.0 |
| CM 8 | CM 8-2 | 2656 | 16 | N | 8.8 | 50.1 | 15.0 | 241.1 | 551.2 |
| CM 8 | CM 8-3 | 2704 | 23 | NW | 56.9 | 37.3 | 60.4 | 563.5 | 1,390.0 |
| CM 8 | CM 8-4 | 2700 | 26 | NW | 27.6 | 9.7 | 73.9 | 827.5 | 157.6 |
| CM 8 | CM 8-5 | 2685 | 26 | NW | 11.3 | 100.6 | 10.1 | 118.2 | 630.4 |
| CM 15 | CM 15-1 | 2636 | 28 | W | 57.0 | 36.6 | 60.9 | 641.1 | 1,518.5 |
| CM 15 | CM 15-2 | 2638 | 22 | W | 0.0 | 47.4 | 0.0 | 0.0 | 914.2 |
| CM 15 | CM 15-3 | 2688 | 20 | NW | 38.6 | 12.6 | 75.4 | 468.7 | 692.9 |
| CM 15 | CM 15-4 | 2654 | 24 | W | 28.0 | 4.1 | 87.1 | 634.7 | 1,025.2 |
| CM 15 | CM 15-5 | 2636 | 26 | W | 27.0 | 6.7 | 80.0 | 305.9 | 183.5 |
| CM 17 | CM 17-1 | 2725 | 4 | W | 1.4 | 36.7 | 3.6 | 32.0 | 1,439.4 |
| CM 17 | CM 17-2 | 2738 | 4 | NW | 35.3 | 7.9 | 81.8 | 4,286.2 | 287.9 |
| CM 17 | CM 17-3 | 2725 | 7 | W | 21.8 | 1.2 | 94.6 | 1,615.5 | 64.6 |
| CM 17 | CM 17-4 | 2714 | 3 | W | 13.1 | 6.7 | 66.3 | 1,340.6 | 127.7 |
| CM 17 | CM 17-5 | 2710 | 3 | W | 0.9 | 16.6 | 5.3 | 223.4 | 861.8 |
| CM 20 | CM 20-1 | 2883 | 4 | N | 49.9 | 0.0 | 100.0 | 3,262.6 | 0.0 |
| CM 20 | CM 20-2 | 2901 | 3 | N | 26.7 | 15.3 | 63.5 | 408.6 | 367.7 |
| CM 20 | CM 20-3 | 2907 | 4 | N | 27.5 | 46.0 | 37.4 | 383.8 | 639.7 |
| CM 20 | CM 20-4 | 2903 | 4 | NW | 12.4 | 34.1 | 26.6 | 127.9 | 671.7 |
| CM 20 | CM 20-5 | 2895 | 5 | N | 33.4 | 25.6 | 56.6 | 481.1 | 609.4 |
2.3. Laboratory Analyses
2.4. Statistical Analyses
3. Results and Discussion

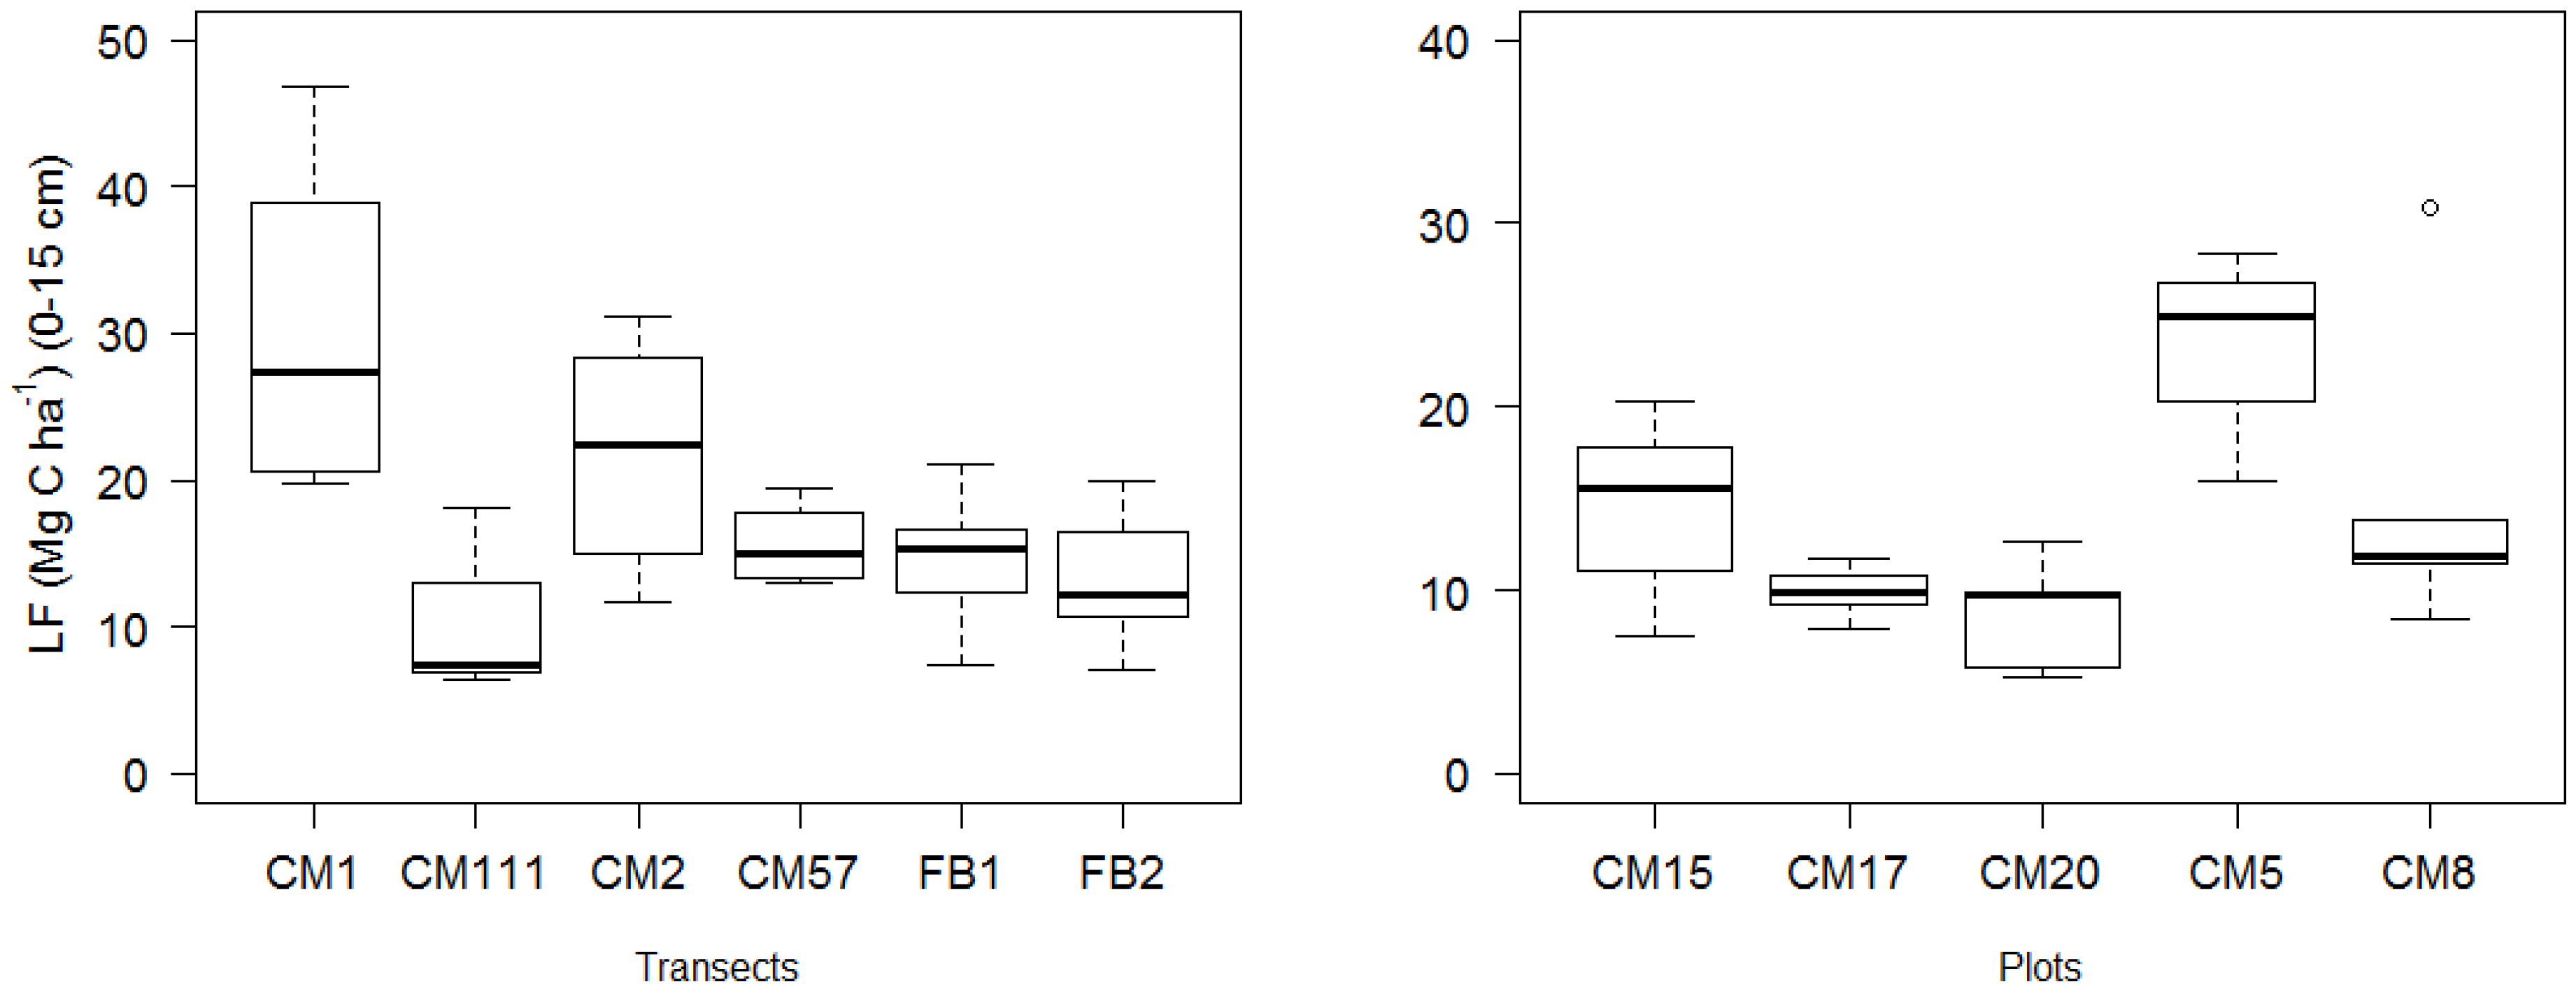
| Bulk Density (g cm−3) | TOC (mg C g−1) (0–5 cm) | TOC (mg C g−1) (5–10 cm) | SOC (Mg C ha−1) (0–15 cm) | MoM (Mg C ha−1) (0–15 cm) | MA > 53 μm (Mg C ha−1) (0–15 cm) | LF (Mg C ha−1) (0–15 cm) | MoM (% SOC) | MA > 53 μm (% SOC) | |
|---|---|---|---|---|---|---|---|---|---|
| Aspen | 0.85 ± 0.15 | 67.1 ± 23.4 | 49.9 ± 22.0 | 51.8 ± 22.6 | 31.2 ± 15.1 a | 3.2 ± 1.9 | 17.5 ± 11.5 | 59.0 ± 14.7 | 6.8 ± 3.6 |
| Mixed | 0.83 ± 0.15 | 69.7 ± 18.0 | 49.1 ± 16.2 | 47.4 ± 10.0 | 25.7 ± 8.8 ab | 3.2 ± 1.6 | 18.5 ± 5.9 | 53.5 ± 11.0 | 7.5 ± 3.7 |
| Conifer | 0.82 ± 0.13 | 78.3 ± 21.8 | 44.4 ± 18.1 | 40.9 ± 13.3 | 22.8 ± 9.0 b | 3.0 ± 1.8 | 15.1 ± 6.9 | 55.6 ± 12.0 | 6.7 ± 2.9 |
| P Vegetation | 0.842 | 0.264 | 0.674 | 0.274 | 0.035 | 0.544 | 0.200 | ||
| P Silt + Clay | 0.009 | 0.102 | 0.583 | 0.255 | 0.718 | 0.050 | |||
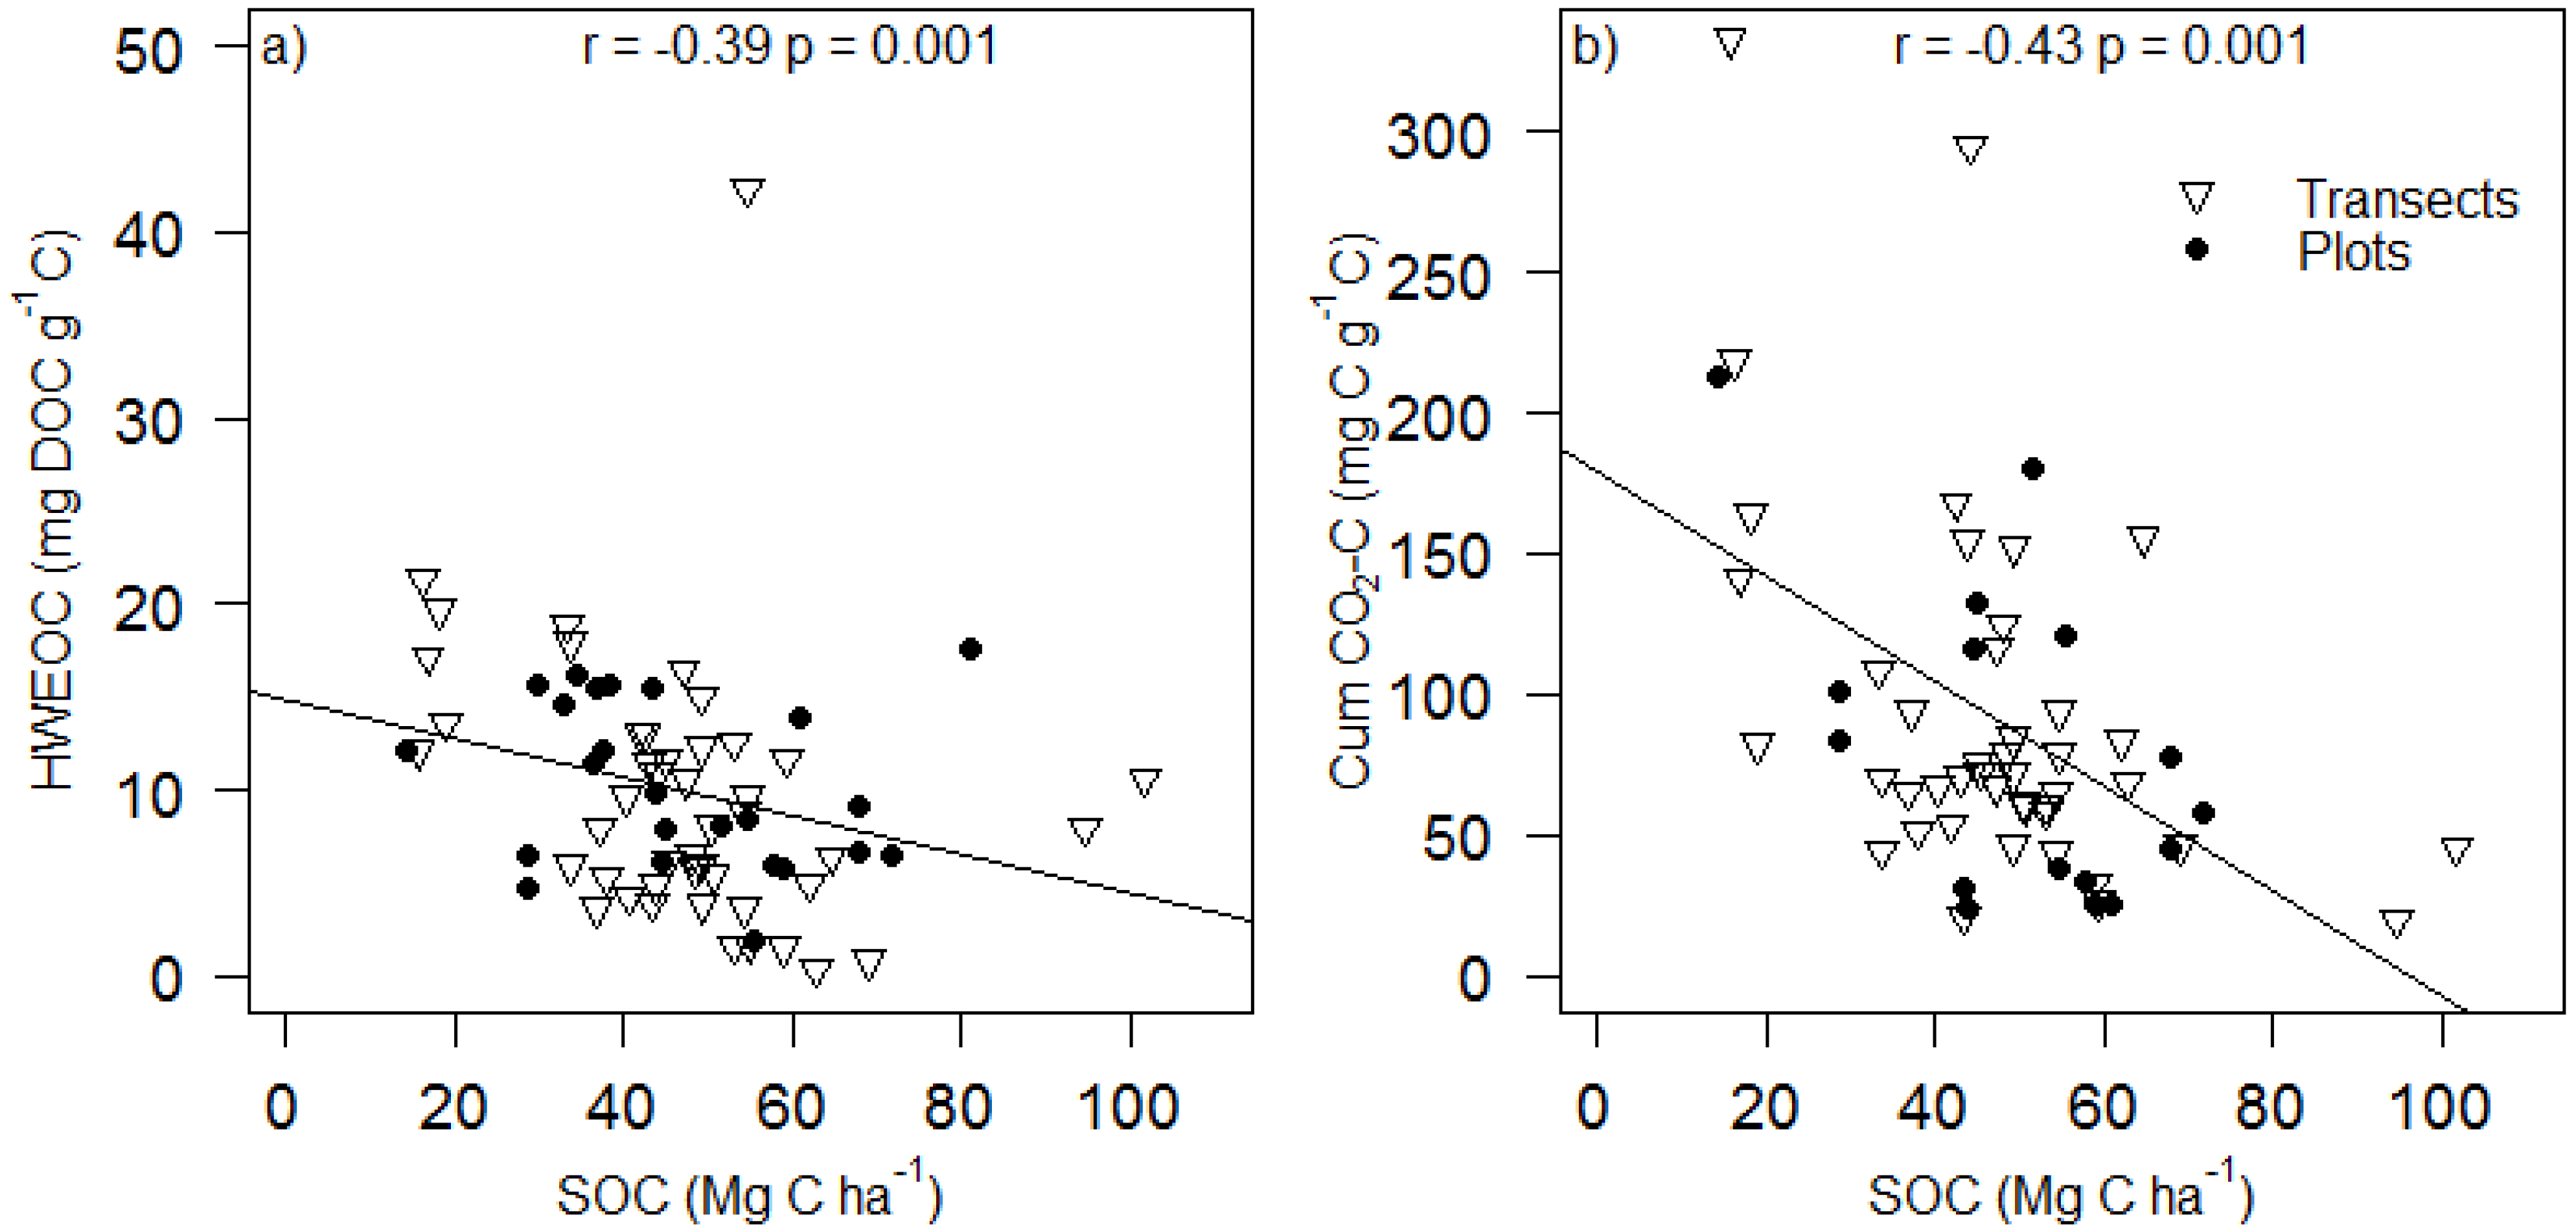
| LF (% SOC) | Cum. CO2-C (mg C g soil−1) | Cum. CO2-C (mg C g C−1) | HWEOC (mg DOC g soil−1) | HWEOC (mg DOC g C−1) | SUVA (abs × 100 mg C−1) | Clay (%) | Silt (%) | Sand (%) | |
| Aspen | 34.2 ± 13.3 | 5.1 ± 3.0 | 86.2 ± 61.8 | 0.6 ± 0.4 | 9.4 ± 6.3 | 2.7 ± 0.4 | 23.2 ± 7.7 | 35.9 ± 13.6 | 40.9 ± 19.3 |
| Mixed | 39.9 ± 11.4 | 7.4 ± 5.8 | 109.3 ± 87.4 | 0.6 ± 0.4 | 8.9 ± 4.6 | 2.7 ± 0.3 | 22.6 ± 10.0 | 40.0 ± 14.3 | 37.6 ± 20.1 |
| Conifer | 36.9 ± 10.5 | 6.2 ± 2.0 | 81.5 ± 27.3 | 0.9 ± 1.1 | 11.3 ± 10.6 | 2.8 ± 0.8 | 25.0 ± 8.7 | 42.8 ± 13.5 | 32.2 ± 19.7 |
| P Vegetation | 0.160 | 0.228 | 0.530 | 0.398 | 0.640 | 0.625 | 0.162 | 0.691 | 0.376 |
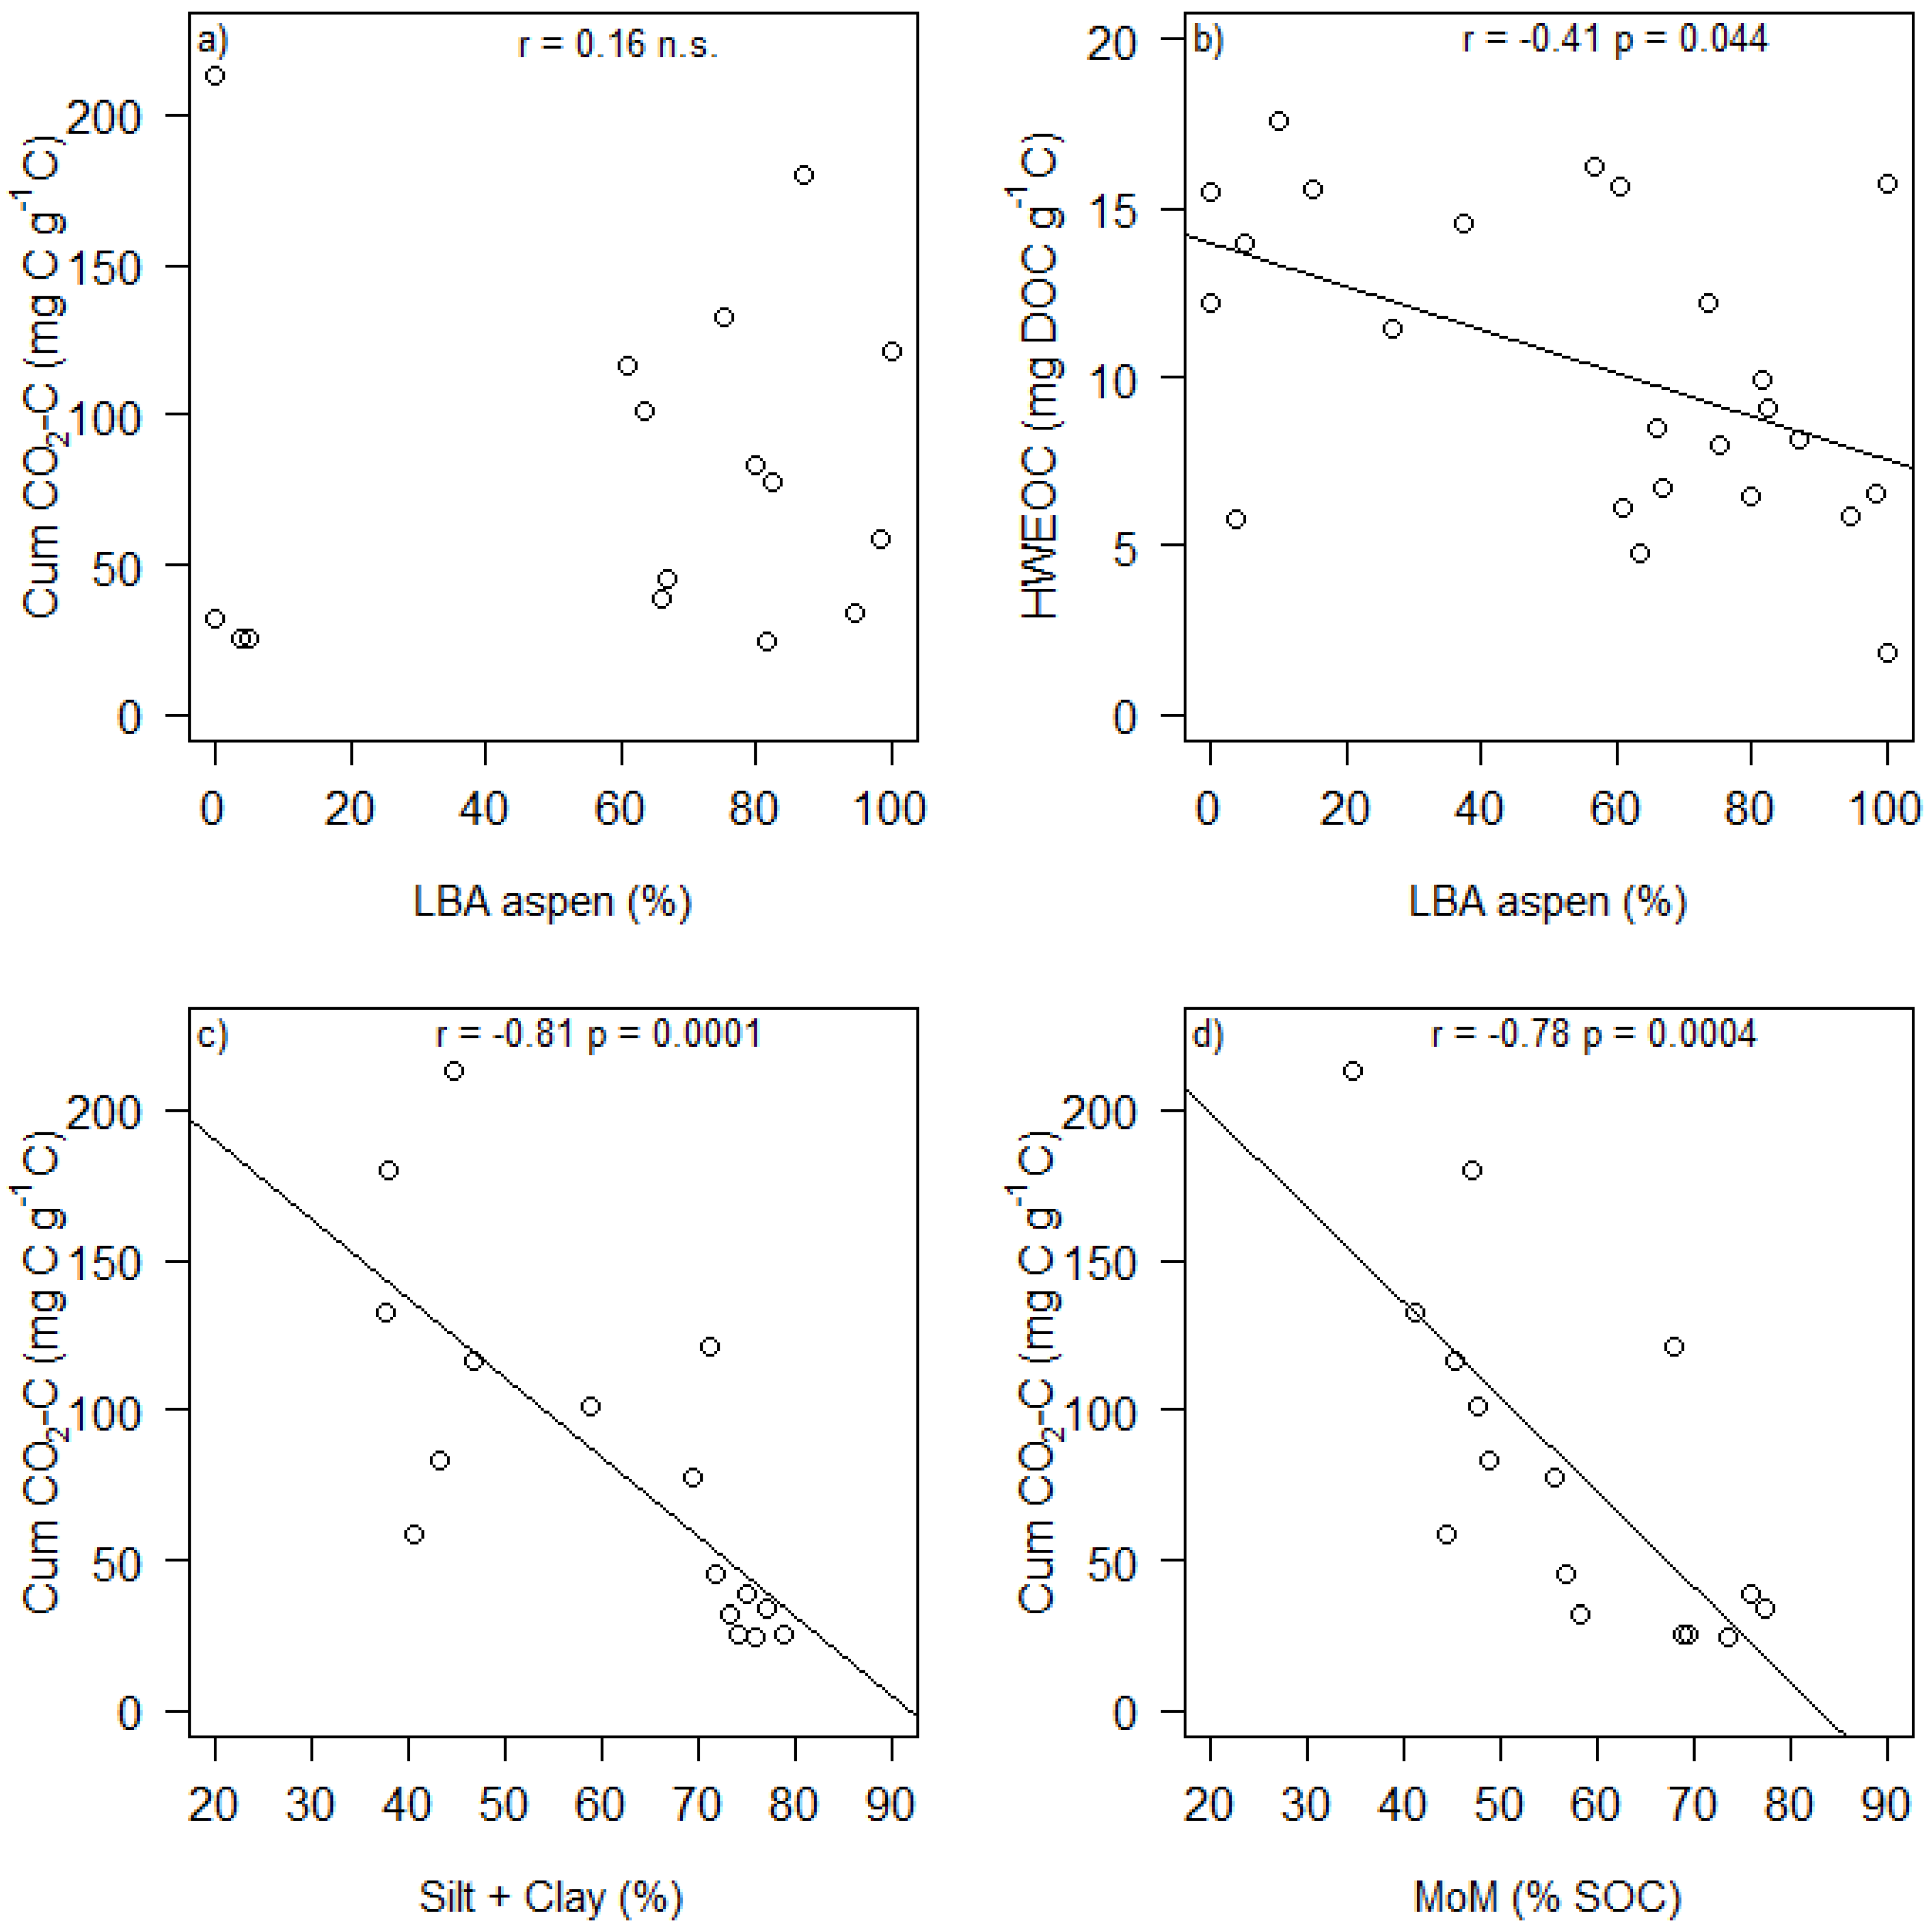
| P Silt + Clay | 0.190 | 0.209 | 0.045 | 0.364 | 0.120 | 0.488 |
| Response Variable | Intercept | t-Value | p | Aspen LBA (%) | t-Value | p | Silt + Clay (%) | t-Value | p |
|---|---|---|---|---|---|---|---|---|---|
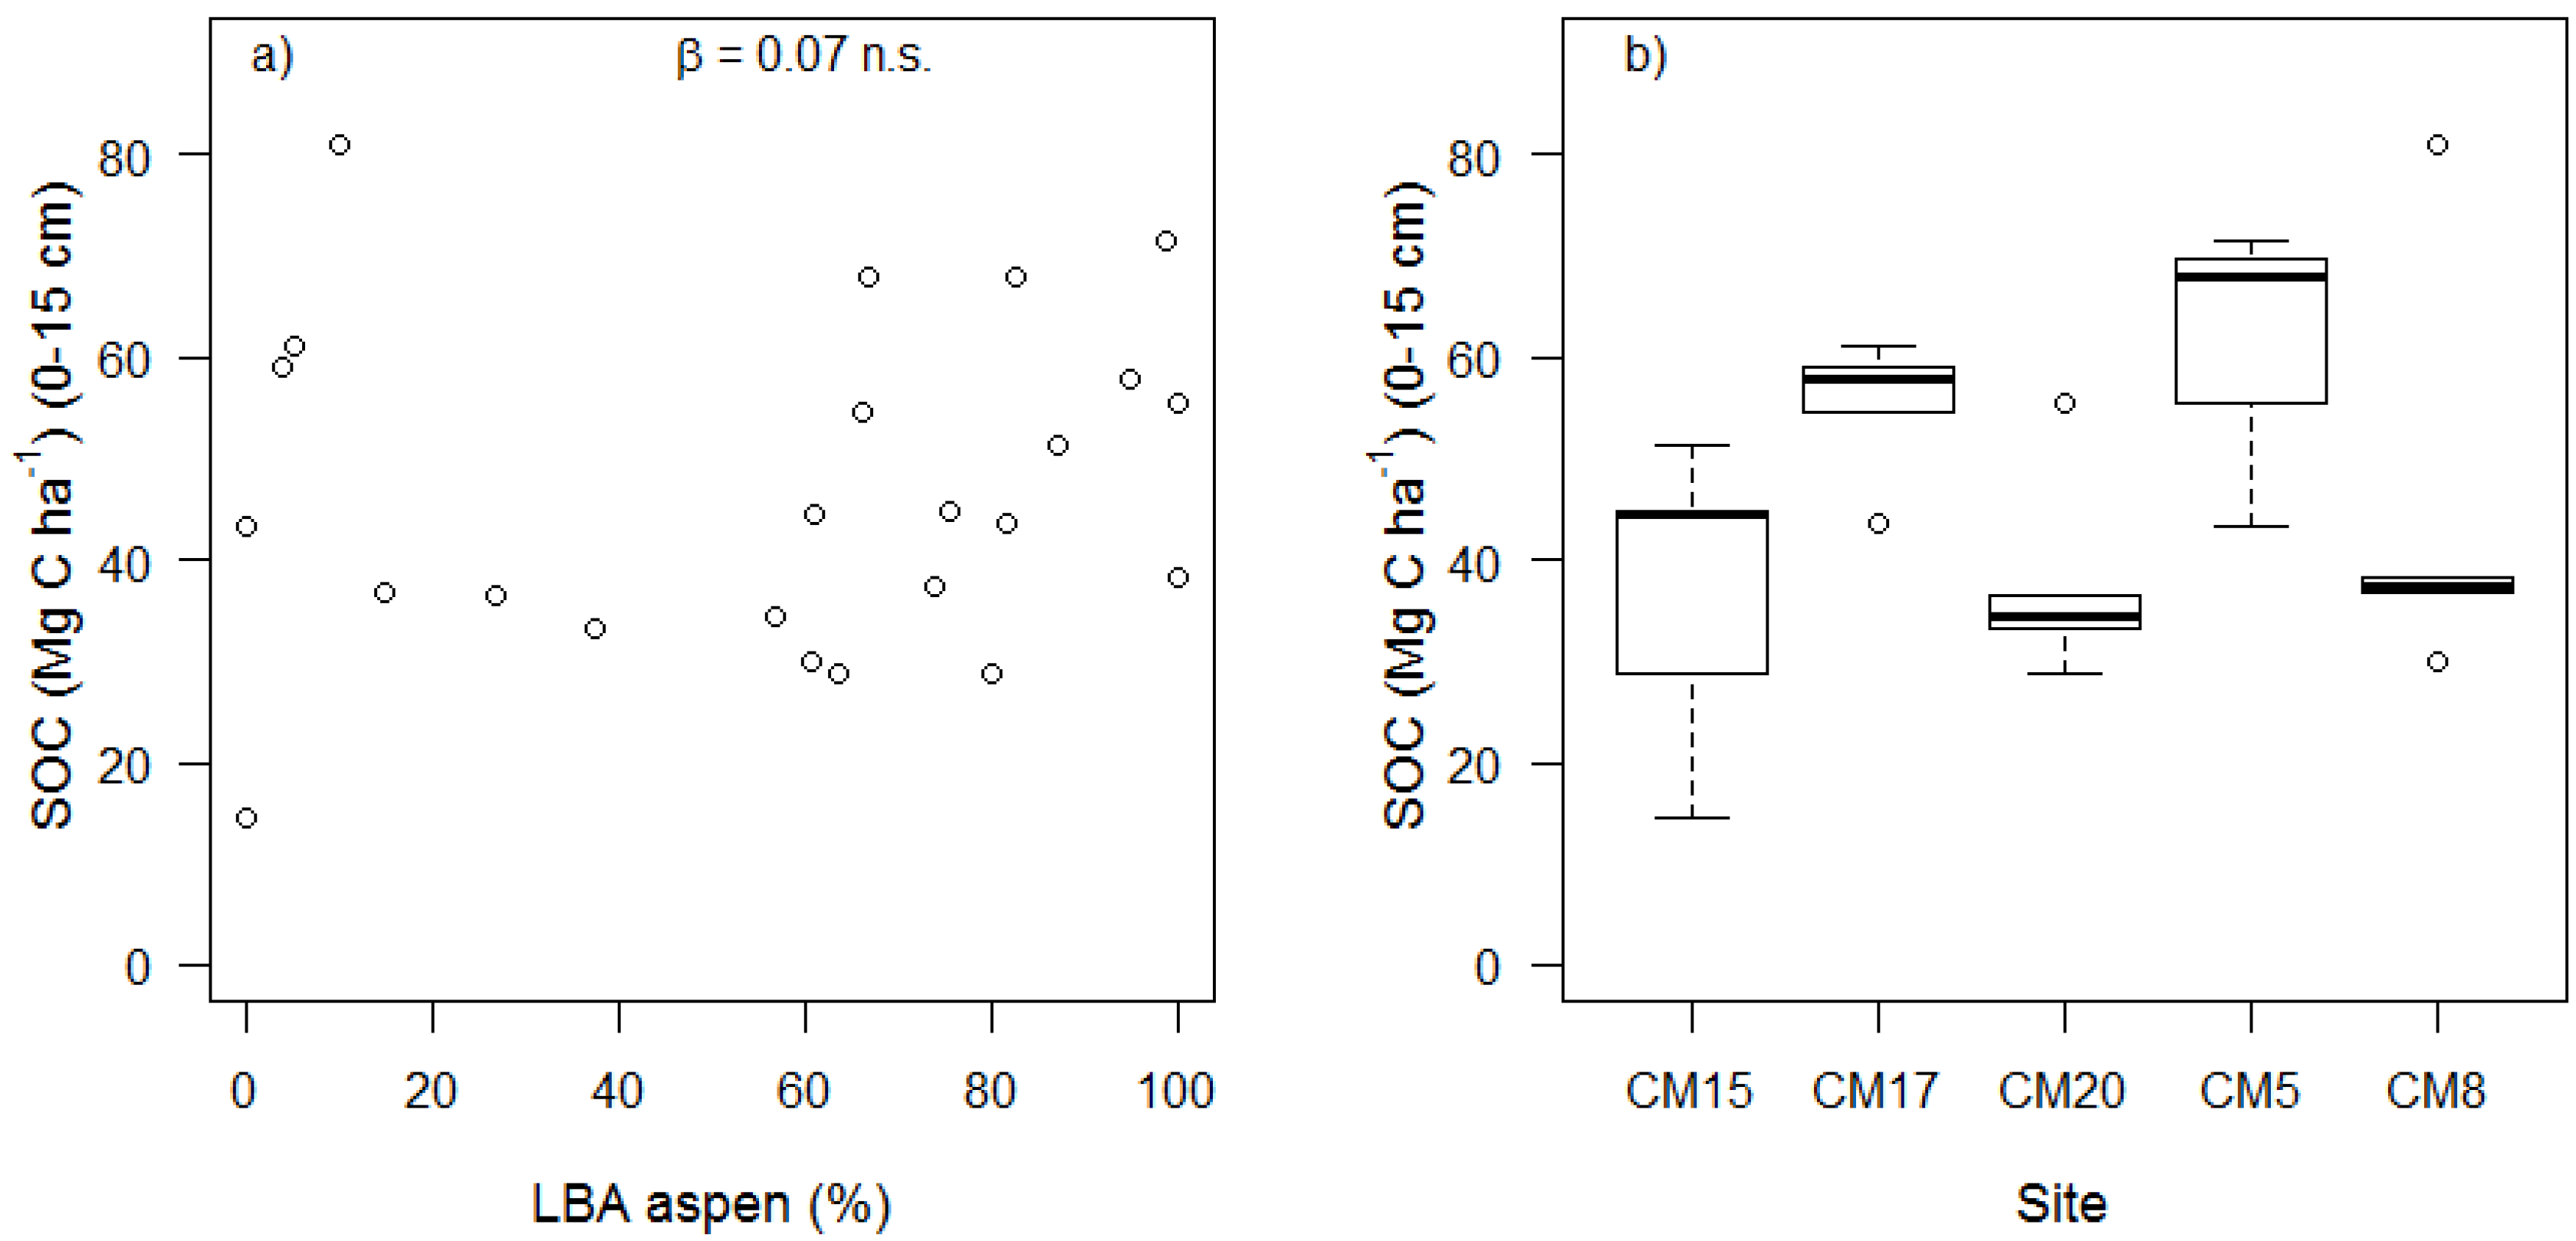
| SOC (Mg C ha−1) | 33.06 ± 20.55 | 1.61 | 0.143 | 0.07 ± 0.09 | 0.79 | 0.438 | 0.17 ± 0.31 | 0.55 | 0.598 |
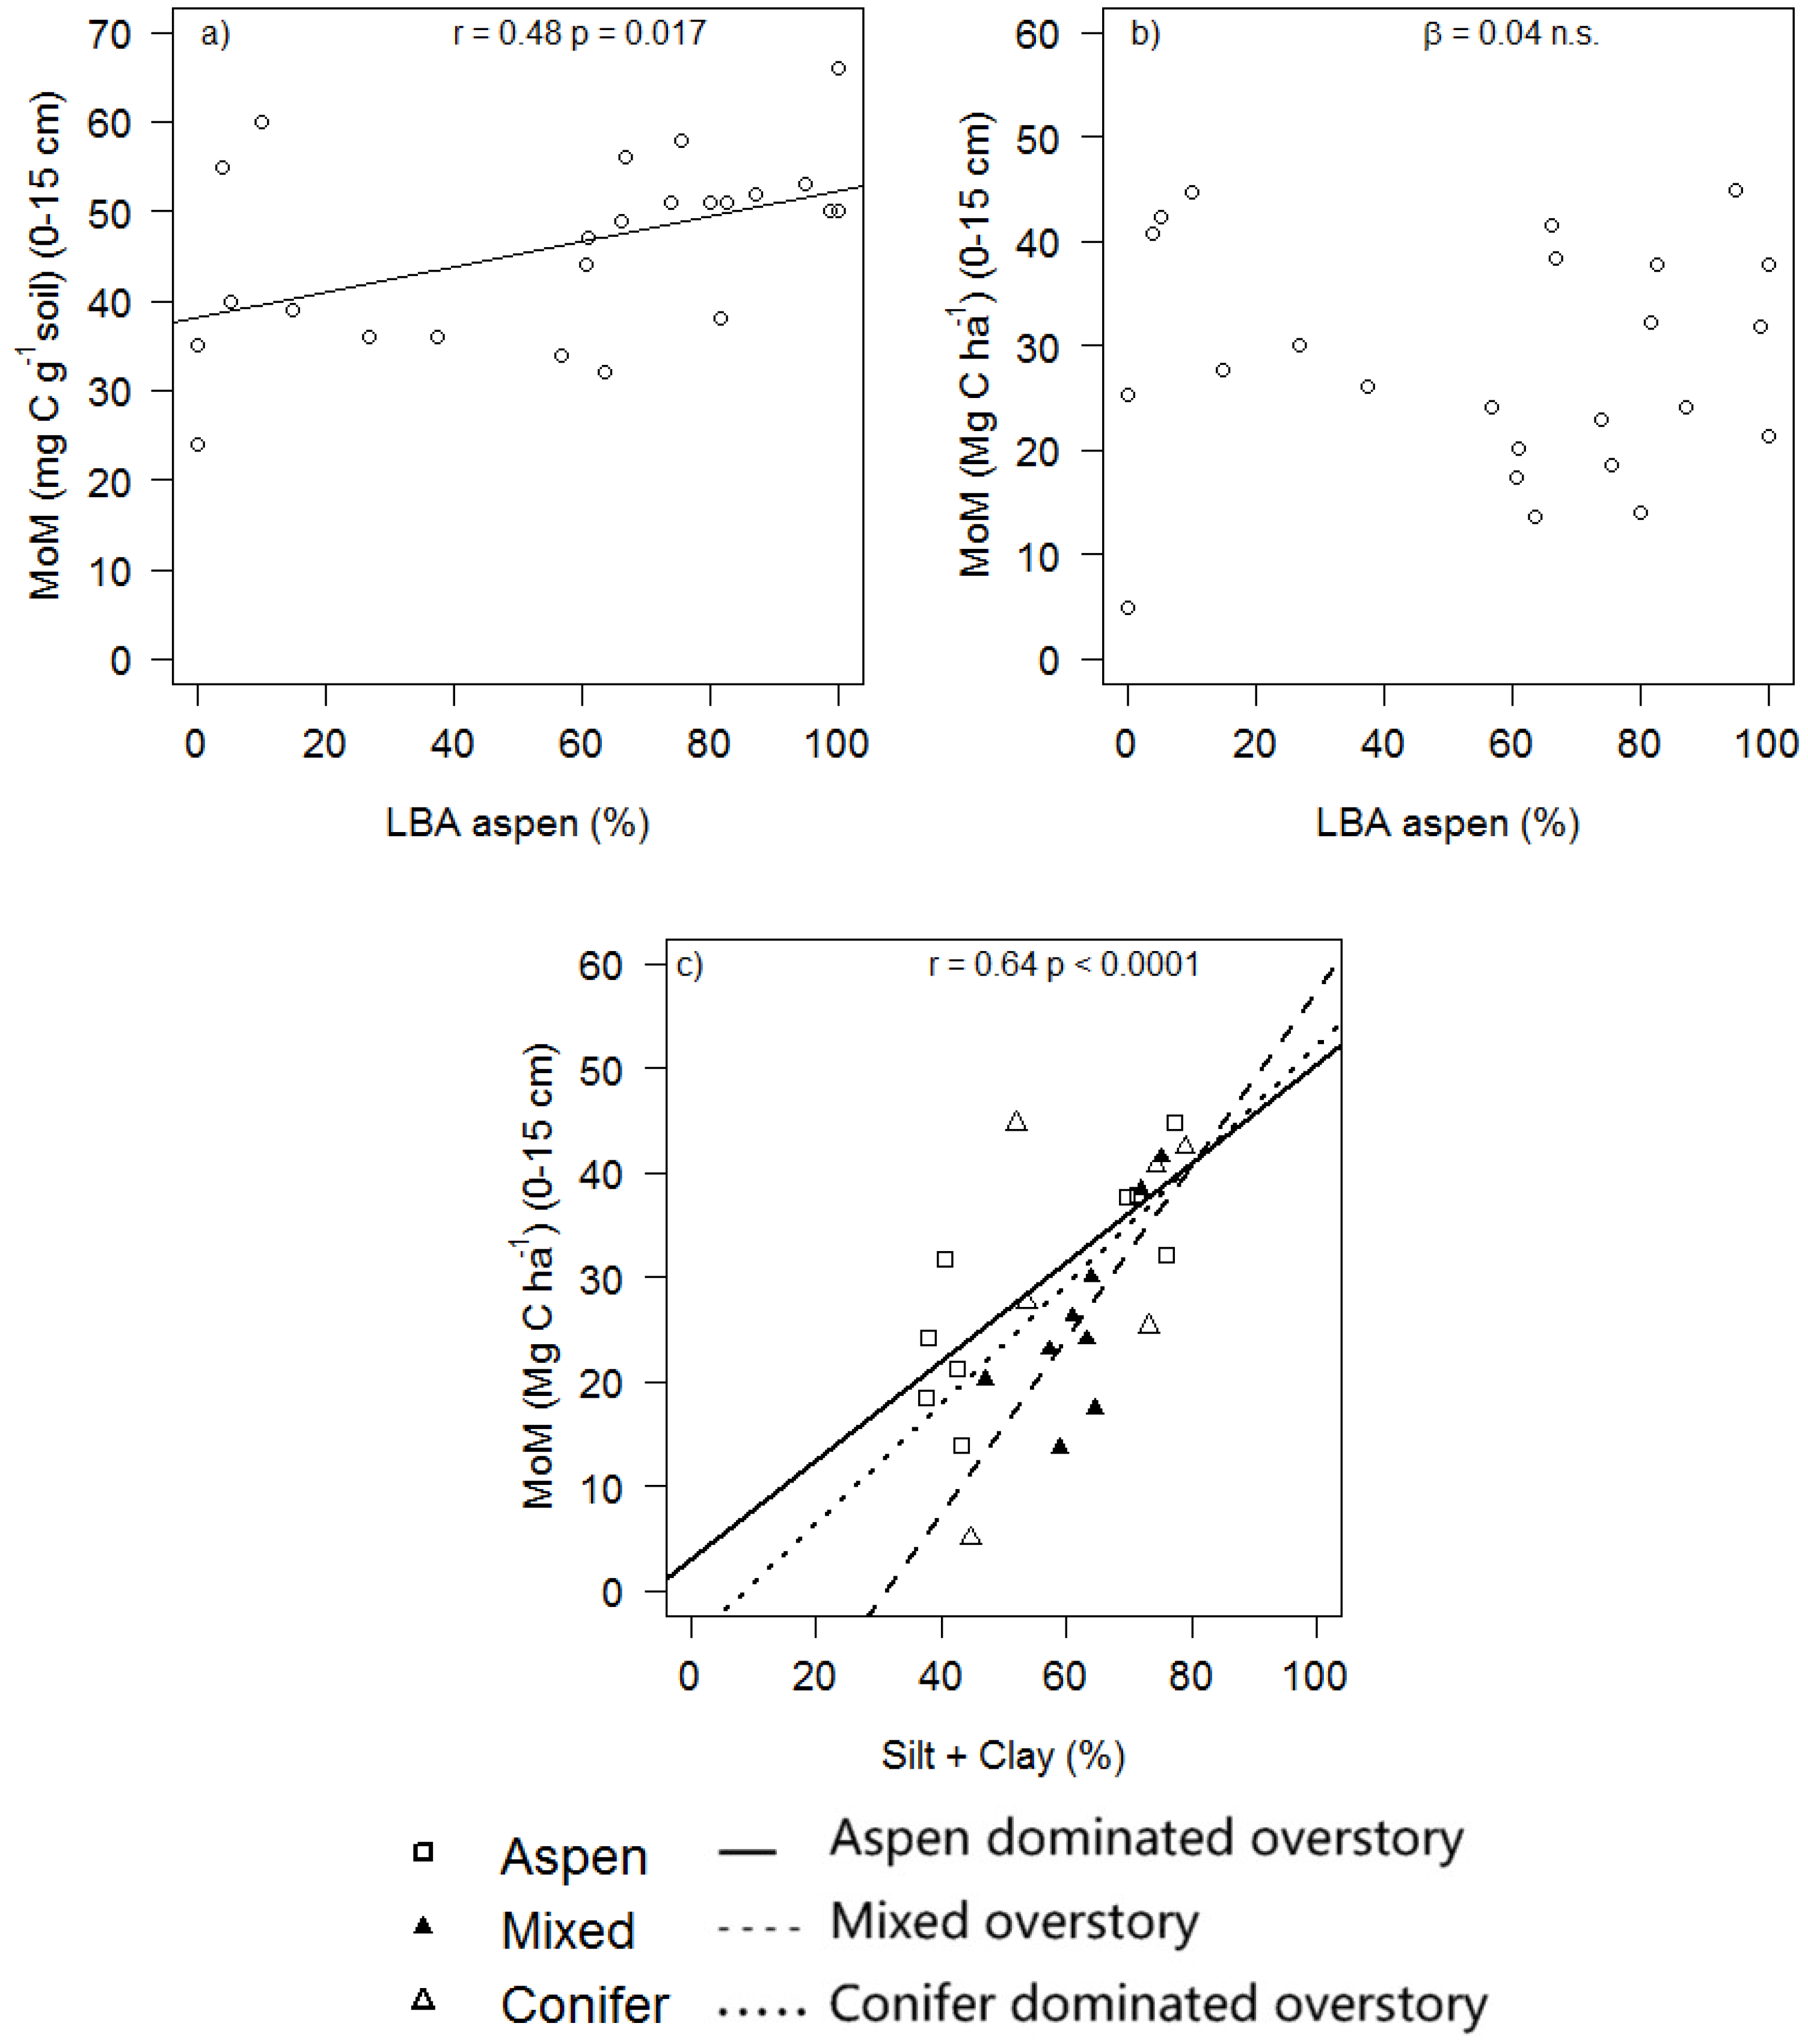
| MoM (Mg C ha−1) | −4.45 ± 9.36 | −0.48 | 0.639 | 0.04 ± 0.05 | 0.71 | 0.489 | 0.51 ± 0.14 | 3.81 | 0.001 |
| LF (Mg C ha−1) 1 | −0.28 ± 0.08 | −3.25 | 0.005 | 4.43 × 10⁻⁴ ± 3.18 × 10⁻⁴ | 1.39 | 0.181 | −6.18 × 10⁻⁴ ± 1.25 × 10⁻³ | −0.49 | 0.628 |
| MoM (%) | 28.79 ± 13.23 | 2.18 | 0.048 | 3.59 × 10⁻³ ± 0.05 | 0.07 | 0.946 | 0.52 ± 0.20 | 2.66 | 0.019 |
| LF (%) | 43.09 ± 10.96 | 3.93 | 0.001 | −0.01 ± 0.04 | −0.31 | 0.757 | −0.20 ± 0.16 | −1.23 | 0.235 |
| Cum. CO2-C (mg C g soil−1) 2 | 1.24 ± 0.86 | 1.44 | 0.177 | 3.32 × 10⁻³ ± 2.96 × 10⁻³ | 1.12 | 0.287 | −3.96 × 10⁻³ ± 0.01 | −0.33 | 0.744 |
| Cum. CO2-C (mg C g C−1) 2 | 4.84 ± 0.78 | 6.20 | <0.0001 | 1.38 × 10⁻³ ± 2.53 × 10⁻³ | 0.55 | 0.598 | −0.01 ± 0.01 | −1.08 | 0.301 |
| HWEOC (mg DOC g soil−1) | 0.52 ± 0.25 | 2.14 | 0.048 | −1.98 × 10⁻³ ± 9.14 × 10⁻⁴ | −2.17 | 0.044 | 1.04 × 10⁻³ ± 3.62 × 10⁻³ | 0.29 | 0.778 |
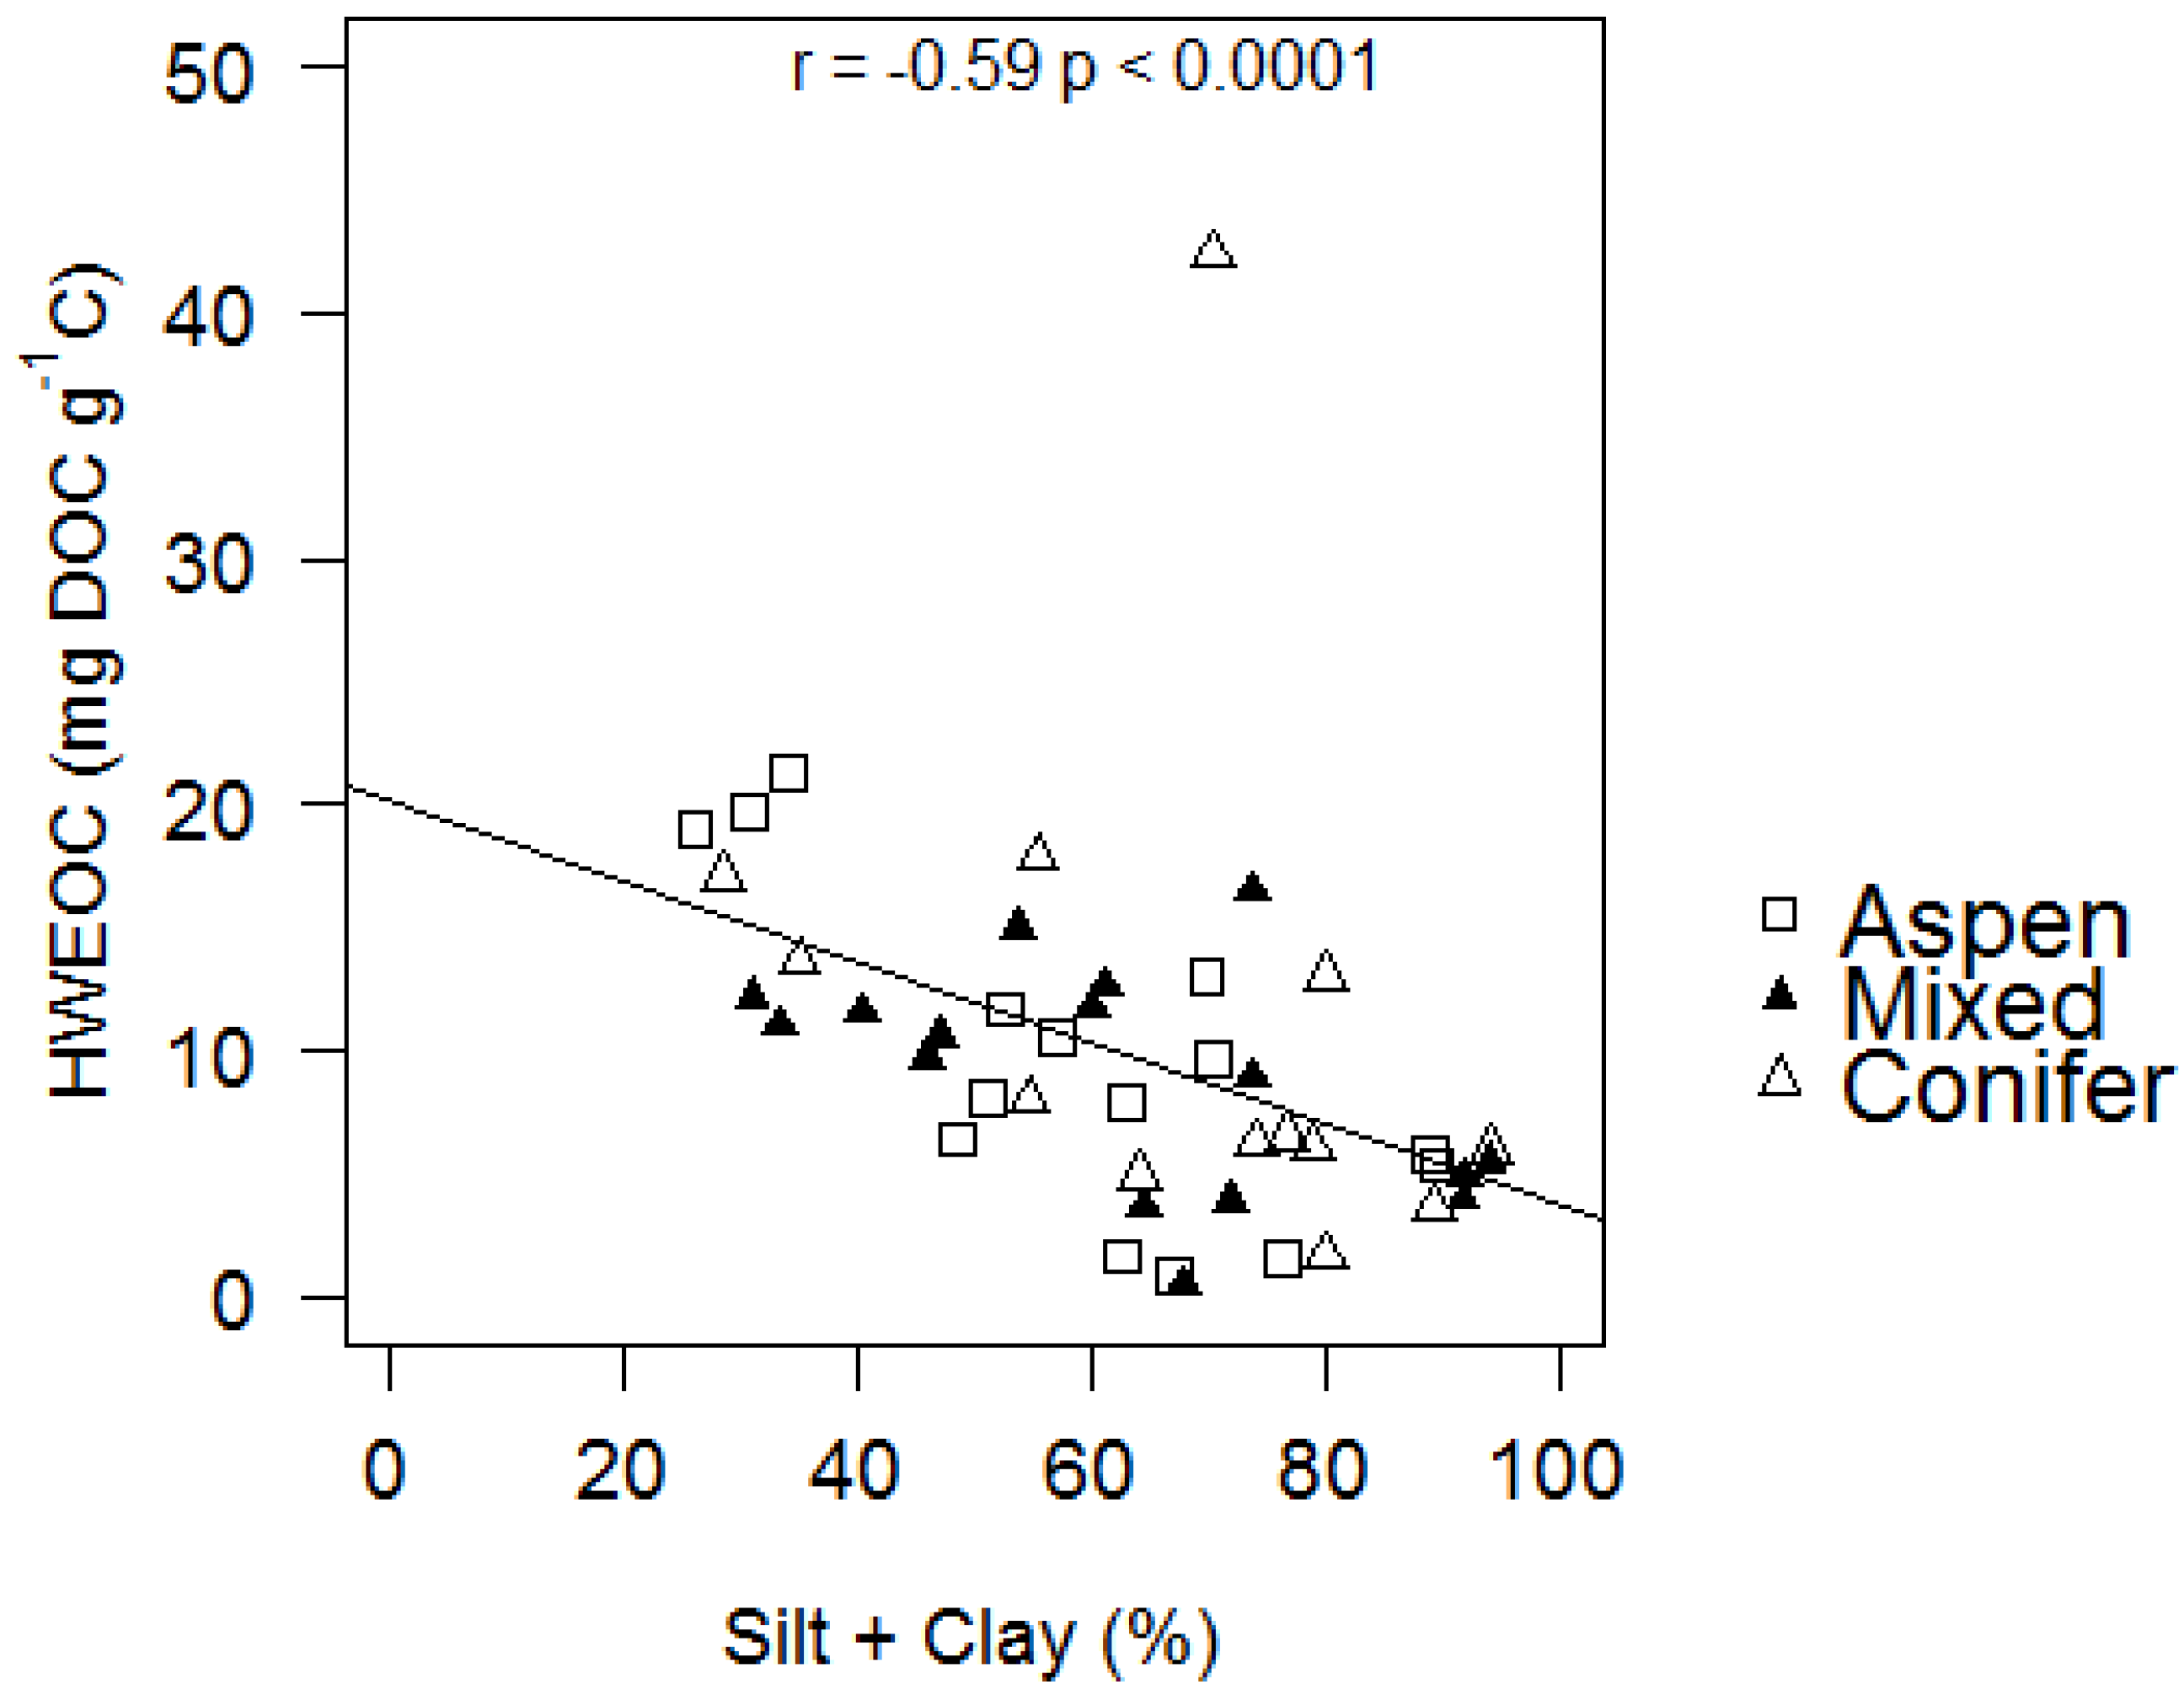
| HWEOC (mg DOC g C−1) | 16.66 ± 5.09 | 3.28 | 0.006 | −0.06 ± 0.02 | −3.13 | 0.006 | −0.05 ± 0.08 | −0.60 | 0.560 |
| SUVA (abs × 100 mg C−1) 2 | 0.78 ± 0.52 | 1.50 | 0.161 | 2.48 × 10⁻⁴ ± 2.05 × 10⁻³ | −0.12 | 0.906 | 0.03 ± 0.01 | 4.01 | 0.002 |
| Clay (%) | 22.68 ± 3.52 | 6.45 | <0.001 | −0.01 ± 0.03 | −0.42 | 0.681 | |||
| Silt (%) | 40.57 ± 4.31 | 9.41 | <0.0001 | −0.05 ± 0.03 | −1.48 | 0.157 | |||
| Sand (%) | 36.74 ± 6.25 | 5.88 | 0.001 | 0.06 ± 0.05 | 1.27 | 0.220 |

4. Conclusions
Abbreviations
| CM | Cedar Mountain |
| DBH | diameter at breast height |
| FB | Franklin Basin |
| HWEOC | hot water extractable organic carbon |
| IC | inorganic carbon |
| LBA | live basal area |
| LME | linear mixed effects |
| LF | light fraction |
| MA > 53 μm | mineral-associated soil organic carbon in the sand fraction |
| MoM | mineral-associated soil organic carbon in the silt and clay fraction |
| SD | standard deviation |
| SOC | soil organic carbon |
| SUVA | specific ultra violet absorbance at 254 nm |
| TOC | total organic carbon |
| TC | total carbon |
Acknowledgments
Author contributions
Conflicts of Interest
References
- Dixon, R.K.; Brown, S.; Houghton, R.A.; Solomon, A.M.; Trexler, M.C.; Wisniewski, J. Carbon pools and flux of global forest ecosystems. Science 1994, 263, 185–190. [Google Scholar]
- Post, W.M.; Emanuel, W.R.; Zinke, P.J.; Stangenberger, A.G. Soil carbon pools and world life zones. Nature 1982, 298, 156–159. [Google Scholar] [CrossRef]
- Jobbagy, E.G.; Jackson, R.B. The vertical distribution of soil organic carbon and its relation to climate and vegetation. Ecol. Appl. 2000, 10, 423–436. [Google Scholar] [CrossRef]
- Barger, N.N.; Archer, S.R.; Campbell, J.L.; Huang, C.Y.; Morton, J.A.; Knapp, A.K. Woody plant proliferation in North American drylands: A synthesis of impacts on ecosystem carbon balance. J. Geophys. Res. 2011, 116, G00K07:1–G00K07:17. [Google Scholar]
- Lal, R. Forest soils and carbon sequestration. For. Ecol. Manage. 2005, 220, 242–258. [Google Scholar] [CrossRef]
- Jandl, R.; Lindner, M.; Vesterdal, L.; Bauwens, B.; Baritz, R.; Hagedorn, F.; Johnson, D.W.; Minkkinen, K.; Byrne, K.A. How strongly can forest management influence soil carbon sequestration? Geoderma 2007, 137, 253–268. [Google Scholar] [CrossRef]
- Díaz-Pinés, E.; Rubio, A.; van Miegroet, H.; Montes, F.; Benito, M. Does tree species composition control soil organic carbon pools in Mediterranean mountain forests? For. Ecol. Manag. 2011, 262, 1895–1904. [Google Scholar] [CrossRef]
- Russell, A.E.; Cambardella, C.A.; Ewel, J.J.; Parkin, T.B. Species, rotation, and life-form diversity effects on soil carbon in experimental tropical ecosystems. Ecol. Appl. 2004, 14, 47–60. [Google Scholar] [CrossRef]
- Shutou, K.; Nakane, K. Change in soil carbon cycling for stand development of Japanese cedar (Cryptomeria Japonica) plantations following clear-cutting. Ecol. Res. 2004, 19, 233–244. [Google Scholar] [CrossRef]
- Vesterdal, L.; Schmidt, I.K.; Callesen, I.; Nilsson, L.O.; Gundersen, P. Carbon and nitrogen in forest floor and mineral soil under six common European tree species. For. Ecol. Manag. 2008, 255, 35–48. [Google Scholar] [CrossRef]
- Schmidt, M.W.I.; Torn, M.S.; Abiven, S.; Dittmar, T.; Guggenberger, G.; Janssens, I.A.; Kleber, M.; Kogel-Knabner, I.; Lehmann, J.; Manning, D.A.C.; et al. Persistence of soil organic matter as an ecosystem property. Nature 2011, 478, 49–56. [Google Scholar] [CrossRef]
- Six, J.; Conant, R.T.; Paul, E.A.; Paustian, K. Stabilization mechanisms of soil organic matter: Implications for C-saturation of soils. Plant Soil 2002, 241, 155–176. [Google Scholar] [CrossRef]
- Baldock, J.A.; Skjemstad, J.O. Role of the soil matrix and minerals in protecting natural organic materials against biological attack. Org. Geochem. 2000, 31, 697–710. [Google Scholar] [CrossRef]
- Von Luetzow, M.; Koegel-Knabner, I.; Ekschmitt, K.; Matzner, E.; Guggenberger, G.; Marschner, B.; Flessa, H. Stabilization of organic matter in temperate soils: Mechanisms and their relevance under different soil conditions—A review. Eur. J. Soil Sci. 2006, 57, 426–445. [Google Scholar]
- Laganière, J.; Paré, D.; Bergeron, Y.; Chen, H.Y.H.; Brassard, B.W.; Cavard, X. Stability of soil carbon stocks varies with forest composition in the Canadian boreal biome. Ecosystems 2013, 16, 852–865. [Google Scholar] [CrossRef]
- Peet, R.K. Forests of the Rocky Mountains. In North American Terrestrial Vegetation; Barbour, M.G., Billings, W.D., Eds.; Cambridge University Press: Cambridge, UK, 1988; pp. 63–102. [Google Scholar]
- Kurzel, B.P.; Veblen, T.T.; Kulakowski, D. A typology of stand structure and dynamics of Quaking aspen in northwestern Colorado. For. Ecol. Manage. 2007, 252, 176–190. [Google Scholar] [CrossRef]
- Long, J.N.; Mock, K. Changing perspectives on regeneration ecology and genetic diversity in western quaking aspen: Implications for silviculture. Can. J. For. Res. 2012, 42, 2011–2021. [Google Scholar] [CrossRef]
- Bartos, D.L.; Campbell, R.B., Jr. Decline of quaking aspen in the interior west-examples from Utah. Rangelands 1998, 20, 17–24. [Google Scholar]
- Hessl, A. Aspen, elk, and fire: The effects of human institutions on ecosystem processes. Bioscience 2002, 52, 1011–1022. [Google Scholar] [CrossRef]
- White, C.A.; Olmsted, C.E.; Kay, C.E. Aspen, elk, and fire in the Rocky Mountain national parks of North America. Wildl. Soc. Bull. 1998, 26, 449–462. [Google Scholar]
- Hanna, P.; Kulakowski, D. The influences of climate on aspen dieback. For. Ecol. Manag. 2012, 274, 91–98. [Google Scholar] [CrossRef]
- Morelli, T.L.; Carr, S.C. A Review of the Potential Effects of Climate Change on Quaking Aspen (Populus tremuloides) in the Western United States and a New Tool for Surveying Sudden Aspen Decline; General Technical Report (PSW-GTR-235); Pacific southwest research station, USDA Forest Service: Albany, CA, USA, 2011.
- LaMalfa, E.M.; Ryle, R. Differential snowpack accumulation and water dynamics in aspen and conifer communities: Implications for water yield and ecosystem function. Ecosystems 2008, 11, 569–581. [Google Scholar] [CrossRef]
- Olsen, H.R.; van Miegroet, H. Factors affecting carbon dioxide release from forest and rangeland soils in northern Utah. Soil Sci. Soc. Am. J. 2010, 74, 282–291. [Google Scholar] [CrossRef]
- Woldeselassie, M.; Van Miegroet, H.; Gruselle, M.C.; Hambly, N. Storage and stability of soil organic carbon in aspen and conifer forest soils of northern Utah. Soil Sci. Soc. Am. J. 2012, 76, 2230–2240. [Google Scholar] [CrossRef]
- Ayres, E.; Steltzer, H.; Berg, S.; Wallenstein, M.D.; Simmons, B.L.; Wall, D.H. Tree species traits influence soil physical, chemical, and biological properties in high elevation forests. PLoS ONE 2009, 4, e5964. [Google Scholar]
- Stump, L.M.; Binkley, D. Relationships between litter quality and nitrogen availability in Rocky-Mountain forests. Can. J. For. Res. 1993, 23, 492–502. [Google Scholar] [CrossRef]
- Calder, W.J.; Horn, K.J.; St Clair, S.B. Conifer expansion reduces the competitive ability and herbivore defense of aspen by modifying light environment and soil chemistry. Tree Physiol. 2011, 31, 582–591. [Google Scholar] [CrossRef]
- Laganière, J.; Angers, D.A.; Pare, D.; Bergeron, Y.; Chen, H.Y.H. Black spruce soils accumulate more uncomplexed organic matter than aspen soils. Soil Sci. Soc. Am. J. 2011, 75, 1125–1132. [Google Scholar] [CrossRef]
- Rogers, P.C.; Leffler, A.J.; Ryel, R.J. Landscape assessment of a stable aspen community in southern Utah, USA. For. Ecol. Manage 2010, 259, 487–495. [Google Scholar] [CrossRef]
- Natural Resources Conservation Service. Snow Telemetry (SNOTEL) precipitation and air temperature data for Webster Flat, Kolob, Tony Grove Lake (Utah) and Franklin Basin (Idaho) (1981–2010). Available online: http://www.wcc.nrcs.usda.gov/snow/ (accessed on 8 February 2013).
- Evans, D.M. A Spatiotemporal Analysis of Aspen Decline in Southern Utah’s Cedar Mountain, Using Remote Sensing and Geographic Information Systems. Master’s Thesis, Utah State University, Logan, UT, USA, 2010. [Google Scholar]
- Tshireletso, K.; Malechek, J.C.; Bartos, D.L. Basal area growth for aspen suckers under simulated browsing on cedar mountain, southern Utah, western United States of America. Botsw. J. Agric. Appl. Sci. 2010, 6, 71–76. [Google Scholar]
- McNab, H.W.; Aver, P.E. Ecological Subregions of the United States: Section Descriptions; Administrative Publication; WO-WSA-5; USDA Forest Service: Washington, DC, USA, 1994.
- Mittank, C.M. Exploring a Stable Aspen Niche within Aspen-Conifer Forests of Utah. Master’s Thesis, Utah State University, Logan, UT, USA, 2012. [Google Scholar]
- Kusbach, A. Terrestrial Ecosystem Classification in the Rocky Mountains, Northern Utah. Ph.D. Thesis, Utah State University, Logan, UT, USA, 2010. [Google Scholar]
- Berger, T.W.; Inselsbacher, E.; Zechmeister-Boltenstern, S. Carbon dioxide emissions of soils under pure and mixed stands of beech and spruce, affected by decomposing foliage litter mixtures. Soil Biol. Biochem. 2010, 42, 986–997. [Google Scholar] [CrossRef]
- Rhoades, C.C. Single-tree influences on soil properties in agroforestry: Lessons from natural forest and savanna ecosystems. Agrofor. Syst. 1996, 35, 71–94. [Google Scholar] [CrossRef]
- Gee, G.W.; Bauder, J.W. Particle-Size analysis. In Methods of Soil Analysis. Part 1. Physical and Mineralogical Methods Agronomy Monograph No. 9, 2nd ed.; Klute, A., Ed.; American Society of Agronomy/Soil Science Society of America: Madison, WI, USA, 1986; pp. 383–411. [Google Scholar]
- Von Luetzow, M.; Koegel-Knabner, I.; Ekschmitt, K.; Flessa, H.; Guggenberger, G.; Matzner, E.; Marschner, B. SOM fractionation methods: Relevance to functional pools and to stabilization mechanisms. Soil Biol. Biochem. 2007, 39, 2183–2207. [Google Scholar] [CrossRef]
- Christensen, B.T. Physical fractionation of soil and organic matter in primary particle size and density separates. In Advances in Soil Science; Stewart, B.A., Ed.; Springer New York: New York, NY, USA, 1992; Volume 20, pp. 1–90. [Google Scholar]
- Kaiser, M.; Ellerbrock, R.H.; Sommer, M. Separation of coarse organic particles from bulk surface soil samples by electrostatic attraction. Soil Sci. Soc. Am. J. 2009, 73, 2118–2130. [Google Scholar] [CrossRef]
- Boutton, T.W.; Archer, S.R.; Midwood, A.J.; Zitzer, S.F.; Bol, R. delta C-13 values of soil organic carbon and their use in documenting vegetation change in a subtropical savanna ecosystem. Geoderma 1998, 82, 5–41. [Google Scholar] [CrossRef]
- Paul, E.A.; Morris, S.J.; Bohm, S. The determination of soil C pool sizes and turnover rates: Biophysical fractionation and tracers. In Assessment Methods for Soil Carbon; Lal, R., Kimble, J.M., Follett, R.F., Stewart, B.A., Eds.; Lewis Publishers: Boca Raton, FL, USA, 2001; pp. 193–206. [Google Scholar]
- Bu, X.L.; Wang, L.M.; Ma, W.B.; Yu, X.N.; McDowell, W.H.; Ruan, H.H. Spectroscopic characterization of hot-water extractable organic matter from soils under four different vegetation types along an elevation gradient in the Wuyi Mountains. Geoderma 2010, 159, 139–146. [Google Scholar] [CrossRef]
- Ghani, A.; Dexter, M.; Perrott, K.W. Hot-water extractable carbon in soils: A sensitive measurement for determining impacts of fertilisation, grazing and cultivation. Soil Biol. Biochem. 2003, 35, 1231–1243. [Google Scholar] [CrossRef]
- Kalbitz, K.; Schmerwitz, J.; Schwesig, D.; Matzner, E. Biodegradation of soil-derived dissolved organic matter as related to its properties. Geoderma 2003, 113, 273–291. [Google Scholar] [CrossRef]
- Harrell, F.E., Jr.; Dupont, C. Hmisc: Harrell. Miscellaneous, R package version 3.10-1.1; Available online: http://CRAN.R-project.org/package=Hmisc (accessed on 20 December 2013).
- Kuznetsova, A.; Brockhoff, P.B.; Christensen, R.H.B. lmerTest: Tests for random and fixed effects for linear mixed effect models (lmer objects of lme4 package), R package version 2.0-0; Available online: http://CRAN.R-project.org/package=lmerTest (accessed on 1 September 2013).
- Kalbitz, K; Schwesig, D.; Rethemeyer, J.; Matzner, E. Stabilization of dissolved organic matter by sorption to the mineral soil. Soil Biol. Biochem. 2005, 37, 1319–1331. [Google Scholar] [CrossRef]
- Baldock, J.A. Interactions of organic materials and microorganisms with minerals in the stabilization of soil structure. In Interactions between Soil Particles and Microorganisms: Impact on the Terrestrial Ecosystem; Huang, P.M., Bollag, J.M., Senesi, N., Eds.; John Wiley & Sons, Ltd: Chichester, West Sussex, UK, 2002; pp. 85–131. [Google Scholar]
- Homann, P.S.; Sollins, P.; Chappell, H.N.; Stangenberger, A.G. Soil organic carbon in mountainous, forested region: Relation to site characteristics. Soil Sci. Soc. Am. J. 1995, 59, 1468–1475. [Google Scholar] [CrossRef]
- Amelung, W.; Zech, W.; Zhang, X.; Follett, R.F.; Tiessen, H.; Knoz, E.; Flach, K.W. Carbon, nitrogen and sulfur pools in particle-size fractions as influenced by climate. Soil Sci. Soc. Am. J. 1998, 62, 172–181. [Google Scholar] [CrossRef]
- Callessen, I.; Liski, J.; Raulund-Rasmussen, K.; Olsson, M.T.; Tau-Strands, L.; Vesterdal, L.; Westman, C.J. Soil carbon stores in Nordic well-drained forest soils-relationships with climate and texture class. Glob. Chang. Biol. 2003, 9, 358–370. [Google Scholar] [CrossRef]
- Gonzalez, I.G.; Corbi, J.M.G.; Cancio, A.F.; Ballesta, R.J.; Cascon, M.R.G. Soil carbon stocks and soil solution chemistry in Quercus Ilex stands in mainland Spain. Eur. J. For. Res. 2012, 131, 1653–1667. [Google Scholar] [CrossRef]
- Vesterdal, L.; Clarke, N.; Sigurdsson, B.D.; Gundersen, P. Do tree species influence soil carbon stocks in temperate and boreal forests? For. Ecol. Manag. 2013, 309, 4–18. [Google Scholar]
- Boča, A.; van Miegroet, H.; Gruselle, M.C. Forest overstory effect on soil organic carbon storage: A meta-analysis, proceedings of the North American forests soils conference. Soil Sci. Soc. Am. J. 2014, in press. [Google Scholar]
- Wang, Q.K.; Wang, S.L.; Zhong, M.C. Ecosystem carbon storage and soil organic carbon stability in pure and mixed stands of Cunninghamia lanceolata and Michelia macclurei. Plant Soil 2013, 370, 295–304. [Google Scholar] [CrossRef]
- Kasel, S.; Singh, S.; Sanders, G.J.; Bennett, L.T. Species-specific effects of native trees on soil organic carbon in biodiverse plantings across north-central Victoria, Australia. Geoderma 2011, 161, 95–106. [Google Scholar] [CrossRef]
- Kleber, M.; Sollins, P.; Sutton, R. A conceptual model of organo-mineral interactions in soils: Self-assembly of organic molecular fragments into zonal structures on mineral surfaces. Biogeochemistry 2007, 85, 9–24. [Google Scholar] [CrossRef]
- Chotte, J.L.; Ladd, J.N.; Amato, M. Sites of microbial assimilation, and turnover of soluble and particulate 14C-labelled substrates decomposing in a clay soil. Soil Biol. Biochem. 1998, 30, 205–218. [Google Scholar] [CrossRef]
- Rumpel, C.; Kogel-Knabner, I.; Bruhn, F. Vertical distribution, age, and chemical composition of organic, carbon in two forest soils of different pedogenesis. Org. Geochem. 2002, 33, 1131–1142. [Google Scholar] [CrossRef]
- Rovira, P.; Jorba, M.; Romanya, J. Active and passive organic matter fractions in Mediterranean forest soils. Biol. Fertil. Soils 2010, 46, 355–369. [Google Scholar] [CrossRef]
- Hancock, J.E.; Loya, W.M.; Giardina, C.P.; Li, L.; Chiang, V.L.; Pregitzer, K.S. Plant growth, biomass partitioning and soil carbon formation in response to altered lignin biosynthesis in Populus tremuloides. New Phytol. 2007, 173, 732–742. [Google Scholar] [CrossRef]
- Shepperd, W.D.; Smith, F.W. The role of near-surface lateral roots in the life-cycle of aspen in the central Rocky Mountains. For. Ecol. Manag. 1993, 61, 157–170. [Google Scholar] [CrossRef]
- Steele, S.J.; Gower, S.T.; Vogel, J.G.; Norman, J.M. Root mass, net primary production and turnover in aspen, jack pine and black spruce forests in Saskatchewan and Manitoba, Canada. Tree Physiol. 1997, 17, 577–587. [Google Scholar] [CrossRef]
- Bauhus, J.; Messier, C. Soil exploitation strategies of fine roots in different tree species of the southern boreal forest of eastern Canada. Can. J. For. Res. 1999, 29, 260–273. [Google Scholar]
- Hudler, A.; Department of Wildland Resources Utah State University, Logan, UT, USA. Personal Communication, 2014.
© 2014 by the authors; licensee MDPI, Basel, Switzerland. This article is an open access article distributed under the terms and conditions of the Creative Commons Attribution license (http://creativecommons.org/licenses/by/3.0/).
Share and Cite
Dobarco, M.R.; Van Miegroet, H. Soil Organic Carbon Storage and Stability in the Aspen-Conifer Ecotone in Montane Forests in Utah, USA. Forests 2014, 5, 666-688. https://doi.org/10.3390/f5040666
Dobarco MR, Van Miegroet H. Soil Organic Carbon Storage and Stability in the Aspen-Conifer Ecotone in Montane Forests in Utah, USA. Forests. 2014; 5(4):666-688. https://doi.org/10.3390/f5040666
Chicago/Turabian StyleDobarco, Mercedes Román, and Helga Van Miegroet. 2014. "Soil Organic Carbon Storage and Stability in the Aspen-Conifer Ecotone in Montane Forests in Utah, USA" Forests 5, no. 4: 666-688. https://doi.org/10.3390/f5040666
APA StyleDobarco, M. R., & Van Miegroet, H. (2014). Soil Organic Carbon Storage and Stability in the Aspen-Conifer Ecotone in Montane Forests in Utah, USA. Forests, 5(4), 666-688. https://doi.org/10.3390/f5040666