Article

Oribatid Mite Community Decline Two Years after Low-Intensity Burning in the Southern Cascade Range of California, USA

1
Department of Biological Sciences, Humboldt State University, Arcata, CA 95521, USA
2
Department of Plant and Soil Science, The University of Vermont, Burlington, VT 05405, USA
3
Forest Service, Pacific Southwest Research Station, P.O. Box 245, Berkeley, CA 94701, USA
*
Author to whom correspondence should be addressed.
Forests 2012, 3(4), 959-985; https://doi.org/10.3390/f3040959
Submission received: 30 July 2012 / Revised: 8 August 2012 / Accepted: 17 October 2012 / Published: 24 October 2012
(This article belongs to the Special Issue Long-Term Effects of Fire on Forest Soils)

Abstract

:
To assess effects of low-intensity fire, we combined two silvicultural prescriptions with prescribed fire in the California Cascade Range. In the first treatment, two 100-ha stands were thinned to reduce density while retaining old-growth structural characteristics, yielding residual stands with high structural diversity (HSD). Two other 100-ha plots were thinned to minimize old growth structure, producing even-aged stands of low structural diversity (LSD), and one 50-ha split-plot from each treatment was burned. In addition, two 50 ha old-growth Research Natural Areas (RNA) were selected as untreated reference plots, one of which was also burned. Fire treatments profoundly altered mite assemblages in the short term, and forest structure modification likely exacerbated that response. Sampling conducted two years following treatment confirmed a continuing decline in oribatid mite abundance. Oribatid species richness and assemblage heterogeneity also declined, and community dominance patterns were disrupted. Oribatid responses to fire were either more intense or began earlier in the LSD treatments, suggesting that removal of old-growth structure exacerbated mite responses to fire. Prostigmatids recovered quickly, but their populations nonetheless diminished significantly in burned split-plots. Mite assemblage responses to prescribed fire were continuing nearly two years later, with no clear evidence of recovery.

1. Introduction

Hyperdiverse assemblages of soil microarthropods, particularly mites in the suborder Oribatei (Arachnida: Acari), dominate forest soil fauna [1,2,3,4]. They exhibit a wide range of responses to disturbance and are well-suited for assessment of low-intensity fire effects upon forest soils, litter, and humus [5,6]. Soil mites indirectly regulate litter decomposition and nutrient mineralization rates in forest soils [7,8,9,10], and litter decomposition often slows when soil microarthropods are excluded [11,12]. Forest management activities often modify soil and litter habitats [13,14,15], and these habitat changes often have significant effects on soil microarthropod assemblages. For example, clear-cutting affected populations and assemblage structure of litter microarthropods at Coweeta Hydrologic Laboratory for nearly a decade, with concomitant effects upon litter decomposition and soil nutrient dynamics [16,17,18]. Global climate change is expected to exert differential effects on decomposition rates by soil invertebrates, with forests in the Pacific Northwestern USA among those most likely to suffer negative consequences for the ecosystem services of soil arthropods [12].
Fire affects soil microarthropods both directly and indirectly. While most studies of fire effects on forest soil fauna performed prior to 1998 and 1999, when our data were gathered, focus upon catastrophic wild fires [19,20], there is considerable interest in the application of prescribed fire for forest management. Unlike wildfires, prescribed fires are usually low-intensity and patchy, with mosaic effects ranging from completely unaffected forest floor to areas with substantial consumption of litter [15]. Prescribed fire is used for fuel management, to manipulate stand composition, to maintain (or restore) historical landscape patterns and forest structure, and to restore the ecological processes of fire [21,22]. Information regarding the effects of prescribed fire on soil microarthropod assemblages has begun to appear but is incomplete for dry, western montane forests, especially in east-side pine, a key forest type in the Pacific Northwest.
Prescribed fire is an increasingly important management tool in the northwestern United States, where periodic natural fire played an important historic role in ponderosa pine forests of the Cascade Range, which receive most of their precipitation as winter snow [23]. Moisture-retaining litter and humus layers are often thin, sometimes a centimeter or less on steep slopes [24]. Mahala mat (Ceanothus prostratus) is a common understorey shrub at these elevations [23], and since it often survives fire, it may serve as an important fire refugium for mites in the absence of deep organic matter layers. Stands are relatively open to insolation, wind penetration, and moisture loss, especially when forest structure is maintained by natural fire regimes. Summers are typically hot and dry. Before fire suppression, frequent seasonal fires limited the accumulation of woody debris, cleared the understorey of small trees, and created forest openings [23]. These habitat characteristics favor a soil fauna that is relatively tolerant of variation in habitat condition, particularly desiccation and low intensity fire frequency. Until recently, the microarthropod fauna of southern Cascade Range soils was poorly known [6], and much more work is needed to fully characterize that assemblage and its response to disturbance.
We previously reported that fire prescriptions applied at Blacks Mountain Experimental Forest (BMEF) in October 1997 reduced mite abundance and modified community structure, even after eight months of recovery [6]. Total mite abundance declined, but the Oribatei were especially responsive indicators of fire effects. Prostigmatid mites recovered more quickly. By June 1998 their abundance in burned split-plots was only slightly lower than in unburned split-plots, and they accounted for a greater proportion of total mite abundance following low intensity fire. This suggested that prostigmatid populations were the most resilient of the mite suborders to fire. This corroborated results from a similar investigation at Wine Spring, North Carolina [5].
We also reported profound disturbance of oribatid mite community organization following prescribed fire [6]. For example, mean oribatid species richness declined significantly, although smaller sample sizes in the burned units might have contributed to apparent species richness decline. Nonetheless, there were significant reductions in oribatid diversity and increases in assemblage evenness, with concomitant declines in dominance, especially among the species most abundant in unburned split-plots.
Finally, our preliminary results suggested that prescribed fire effects were synergized by forest structure modification [6]. Alterations of oribatid community organization were not uniform throughout the test plots, but were greatest in plots where tree age and canopy structure were experimentally altered. Old-growth stands and manipulated stands retaining old-growth characteristics (i.e., high structural diversity) appeared somewhat buffered against oribatid community disturbance, while low structural diversity stands appeared more susceptible to disruption of oribatid assemblages. For example, oribatid abundance and species richness declined the most in burned split-plots from which old-growth characteristics were removed. Our results mirrored those of Paquin and Coderre [20], who noted increased severity of fire effects on soil macroarthropod populations following deforestation, and also Peck and Niwa [25], who observed long-term alteration of oribatid assemblage organization in thinned forest stands similar to those in this study. The number of oribatid species affected by prescribed fire was greatest in the low structural diversity plots, intermediate in the high structural diversity plots, and least in the Research Natural Areas that retained old-growth trees and complex forest structure.
Our initial observations derived from a rather large data set (200 samples containing 148,505 mites), but those data nonetheless comprised a single temporal snapshot [6]. Our initial analysis was unable to determine the direction of mite responses at the time of sampling. Although it was clear that oribatid and mesostigmatid mite abundance declined in the burned split-plots, it was not clear whether they were recovering at the time of sampling or whether they continued on a declining trajectory. Likewise, although prostigmatid mite populations appeared to have recovered, we were unable to determine whether they were stable or remained in flux, or indeed whether they were perhaps beginning a delayed decline.
In this paper we report evaluations of our earlier observations in light of additional data from samples collected in October 1998 (twelve months after application of prescribed fire) and in June 1999 (twenty months after prescribed fire). We surmised that the additional samples would shed light on both the duration and direction of forest soil mite responses to prescribed, low intensity fire.

2. Experimental Section

2.1. Site Description

Our methods were previously described in detail [6], so we will summarize them here. BMEF is on the Lassen National Forest near Susanville, CA, USA (elevation 1700–2100 m) with geologic, topographic, and climate conditions typical of the southern Cascade Range. It was the site of an interdisciplinary study of low intensity fire ecology [26]. It is dominated by Pinus ponderosa and Jeffrey pine (P. jeffreyi), with white fir (Abies concolor) and incense cedar (Libocedrus decurrens) at higher elevations (Society of American Foresters forest cover type 231 [27]). Old-growth remnants occur in Research Natural Areas (RNAs) representing relatively undisturbed late successional forest, although fire exclusion was a by-product of RNA management before 1997 [24]. All the test plots were located within a single management unit at BMEF and were ecologically similar except as regards the silvicultural management and fire prescriptions described below.

2.2. Treatments

Although there were twelve treatment units and four RNA reference plots involved in this study, we report results from a subset of four treatment units and two RNAs chosen for logistical reasons because they constituted the only remaining old-growth stands in the area. Treatment units were 100 ha and RNAs were 50 ha in size. Two replicated treatment plots were selectively logged in 1996 to reduce stand density while maintaining old growth characteristics, e.g., multiple canopy layers, an abundance of large snags, many large old trees, and many small canopy gaps and forest floor openings. These were designated high structural diversity (HSD) treatments. The other two replicated plots were logged to minimize old growth characteristics, creating low structural diversity (LSD) stands of intermediate size with a single-layered, evenly spaced, continuous canopy. One half of each treatment plot (50 ha split-plot) received low intensity, managed fire during October 1997. The RNAs were not thinned, in order to preserve their old-growth stand structures, but one received a similar low-intensity prescribed fire prescription. The RNAs are not true controls because they were not selected at random, but are intended to serve as old-growth reference stands.

2.3. Soil Microarthropod Sampling
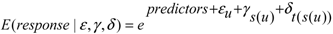
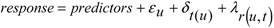
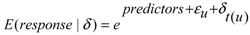
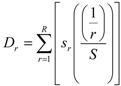
Soil arthropod sampling began in June 1998, following snowmelt and approximately eight months after prescribed burning. Samples were taken for this analysis in June and October (access to treatment plots was difficult during winter). Tree-centered transects were established to the east and west of selected ponderosa pine trees within a limited diameter class , and four 30.5 cm. diameter litter samples were taken at 1 meter intervals east and west of the tree boles along these transects. All surface litter was collected down to the level of bare mineral soil, then samples were refrigerated and transported to a laboratory for Berlese extraction of litter arthropods October samples were collected along parallel transects immediately to the south of the June transects so that the samples did not overlap. June and October samples represented seasonal extremes at this site, i.e., moist, cool early summer conditions and warm, dry late summer conditions. Adult oribatid specimens were identified to species where possible, otherwise to morphospecies, and vouchers were deposited in the collection of the Museum of Natural History at the University of Georgie, Athens, GA, USA.

2.4. Data Analyses

Mean abundance of mite suborders was compared among split-plot pairs, which were also compared to the reference RNA plots. Mixed effects models were used to account for fixed and random effects using either General Linear Models for continuous responses or over-dispersed Poisson GLMs for count responses [6,28]. Regression models were fitted using the R lme (Linear Mixed-Effects Models) and R glmmPQL Linear (Generalized Mixed-Effects Models) statistical computing packages (R 2.1.0) [29,30,31].
Species populations in each plot were regarded as separate [1] because inter-plot distances likely exceeded the dispersal capabilities of oribatids during the time between prescribed fire and sampling, much of which was spent under snow. However, samples from parallel transects taken in October were not compared to June samples because of the increased probability that they were drawn from the same populations. We used similar models to compare oribatid species richness. Oribatid assemblage heterogeneity was assessed using Brillouin diversity indices and the a parameter of the log series model of species abundance [32,33]. Species richness across treatments was also interpolated and compared with rarefaction [34]. Total oribatid species richness was estimated with the first-order jack-knife estimator [35].
Oribatid assemblage dominance was assessed directly, by comparing the mean proportions of oribatid abundance accounted for by the five most numerically dominant taxa, and with multiple sample dominance-rank coefficients for each taxon [6]. Oribatid assemblage evenness was assessed with Camargo’s evenness coefficient, which is relatively unaffected by rare species [36]. We used nonparametric Wilcoxon signed rank tests for assessing changes in assemblage proportional dominance and for comparing mean dominance-rank coefficients in the unburned and burned split-plots.
Average linkage cluster analysis with the Morisita similarity coefficient classified oribatid assemblage similarity between and within prescribed fire treatments [33]. Multivariate indicator species analyses were used to detect species affinities using 10,000 randomized Monte Carlo trials to estimate p-values for indicator species coefficients (Dufrêne and Legendre [37]. Multi-response permutation procedures (MRPP) were also used to evaluate assemblage similarities between unburned and burned split-plots and RNA’s [38].
Ecological gradients were described with nonmetric multi-dimensional scaling (NMS) ordination of oribatid species counts using Sorensen ecological distances. Principle components rotation was used to align the most prominent ecological gradients with the first ordination axis. Indicator species analysis and MRPP were performed with PC ORD [39]. All other analyses were coded with the R data analysis language [30,40,41].

3. Results and Discussion

The low-intensity prescribed fires achieved the fire management objectives in burned split-plots, patchily and partially consuming leaf litter and woody debris without causing mature tree mortality. Reduced litter volume correlated with lower microarthropod abundance in the burned split-plots [6].

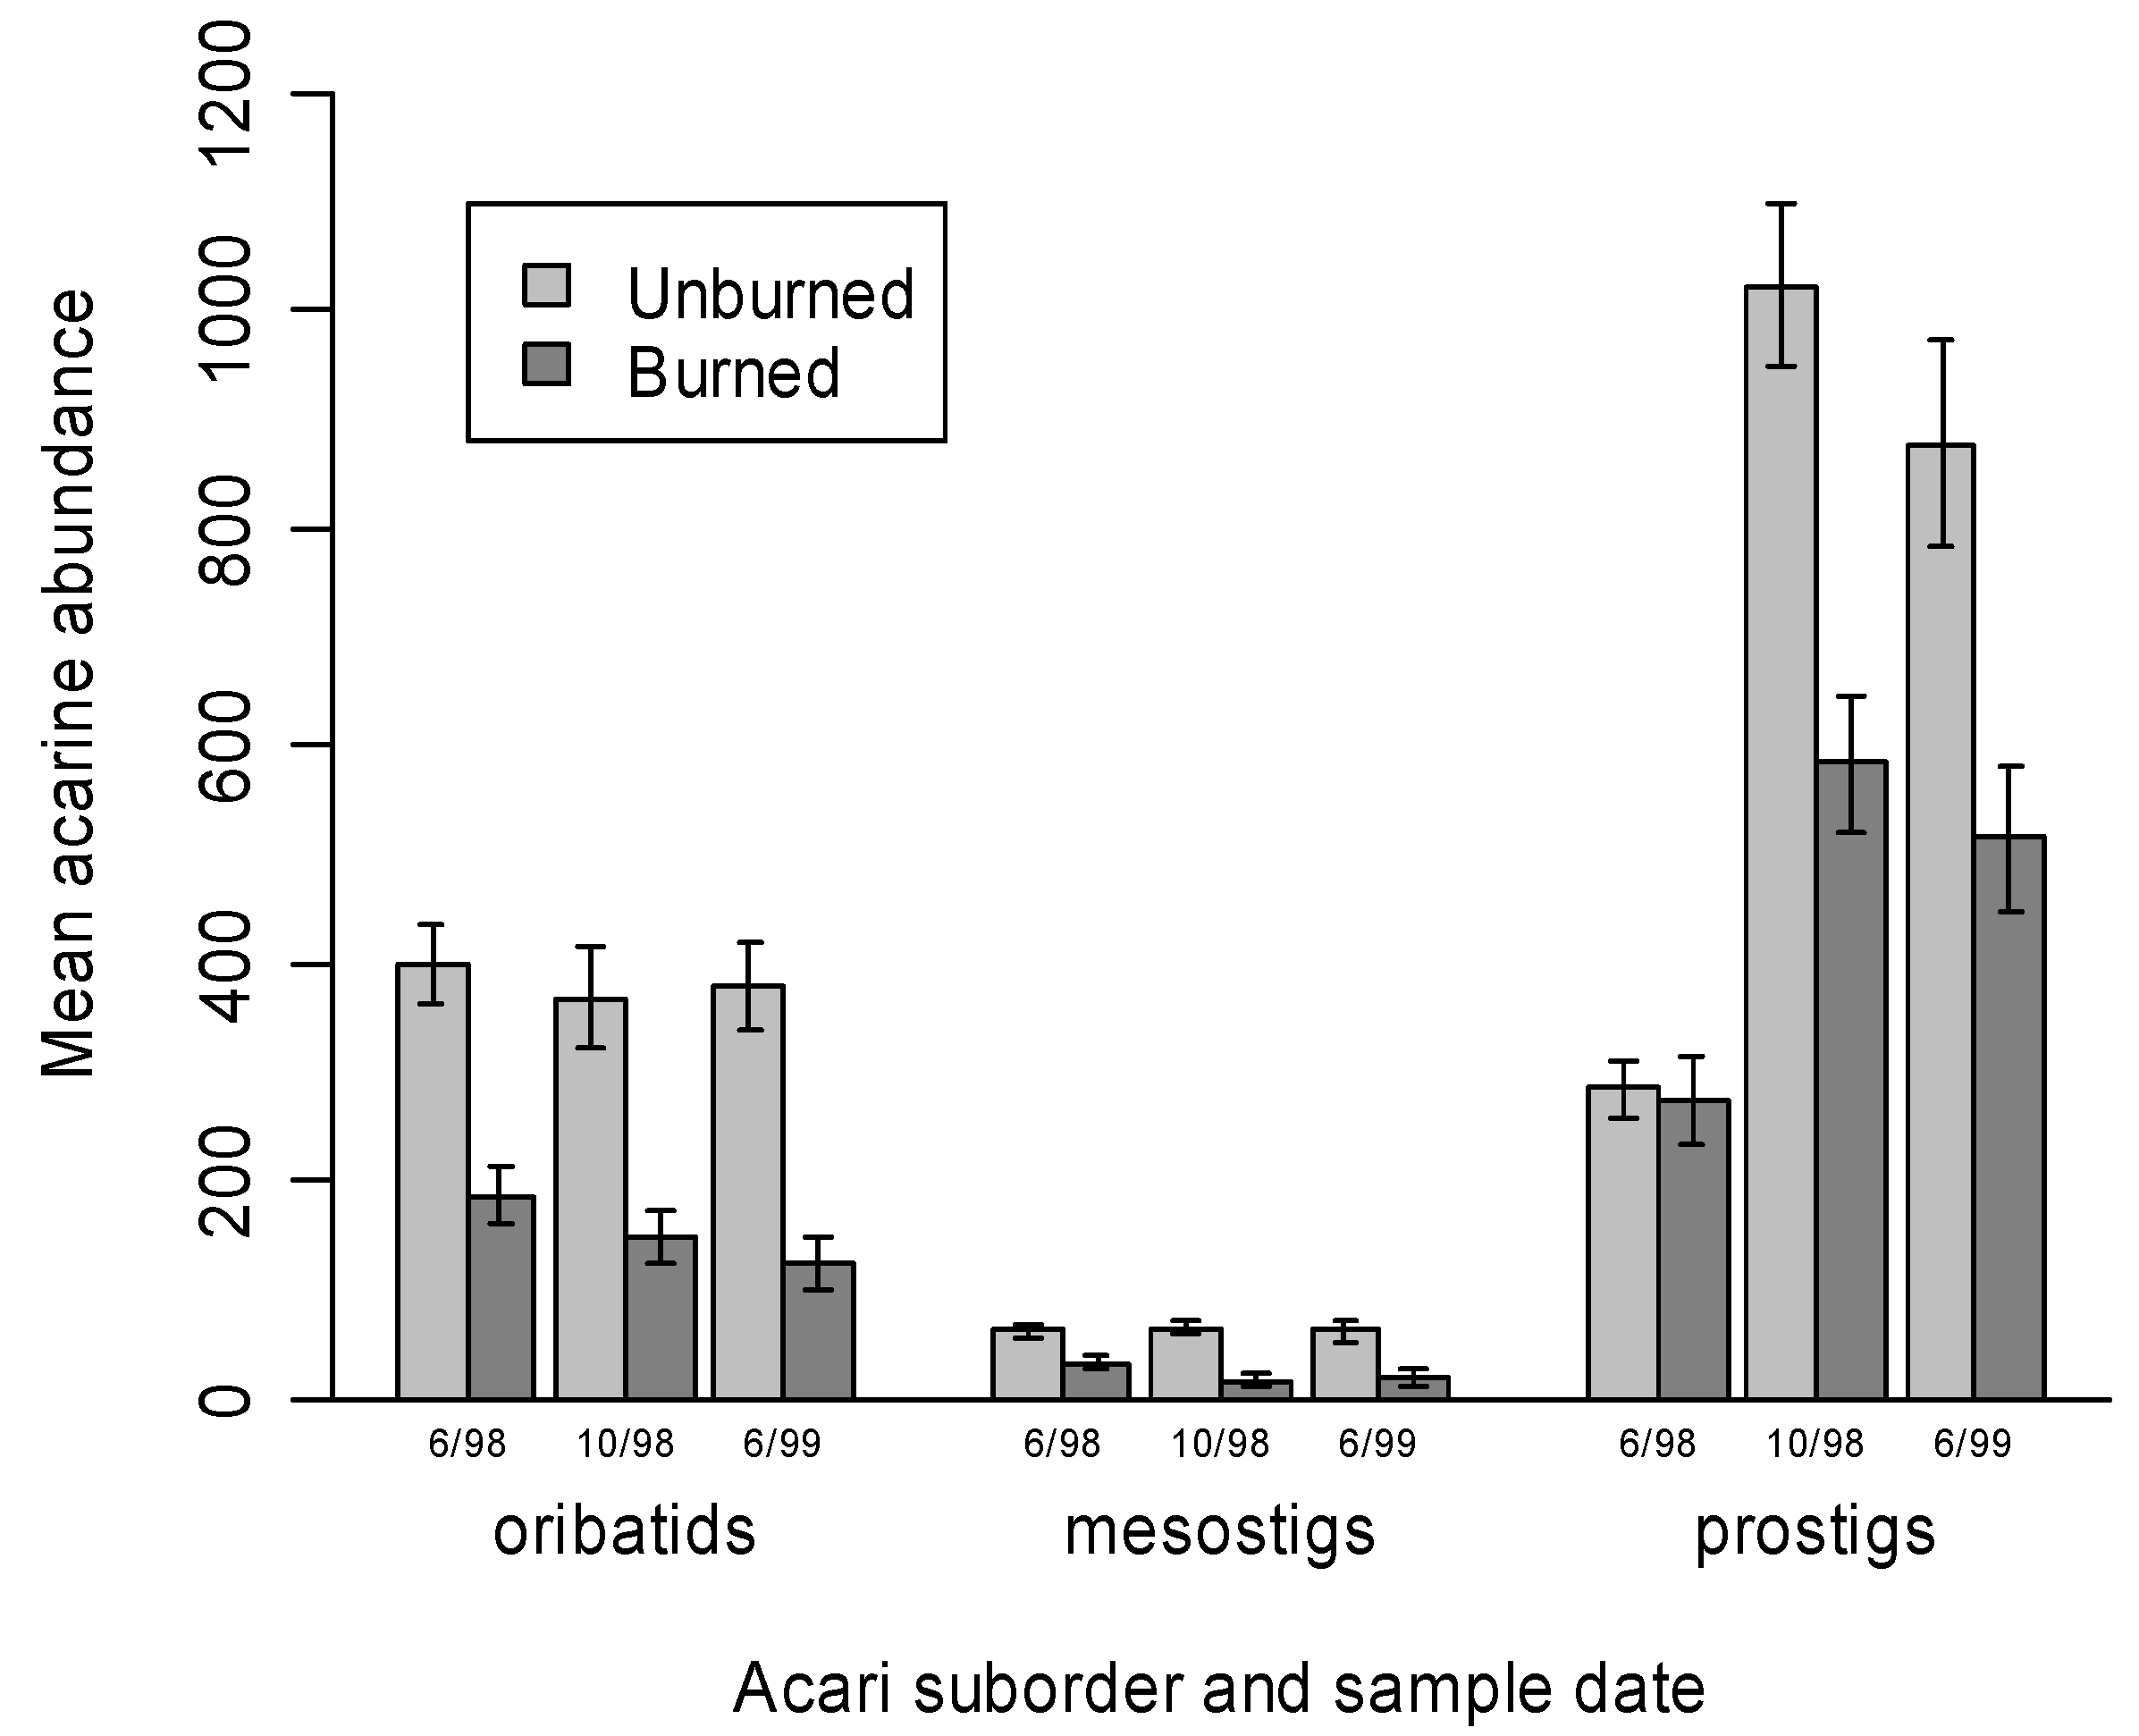
3.1. Mite Suborder Responses

There were 578,255 mites sampled during the three sampling intervals, of which 60 percent were prostigmatid mites (mostly Tydeidae), 27 percent were oribatid mites, eight percent were astigmatids including hypopi (assumed incidental, and not included in any subsequent analyses), and four percent were mesostigmatids. However, the proportion of the mite fauna accounted for by prostigmatids increased substantially after June 1998, when prostigmatids composed only 38 percent of the total mite soil fauna sampled (Figure 1). By October 1998 they accounted for 69 percent of mites, and by June 1999, 68 percent. Conversely, the oribatids composed 39 percent of the mite fauna in June 1998, but declined to 22 percent and 24 percent in October 1998 and June 1999, respectively.
Furthermore, in June 1998 prostigmatid abundance did not differ in the unburned and burned split-plots, but it was significantly lower in the burned split-plots during both later samples (Figure 1). However, the actual abundance of prostigmatid mites in the burned split-plots during October 1998 was greater than in the unburned split-plots during June 1998 (p < 0.001).
Figure 1. Mean abundance per sample of mite suborders Oribatei, Mesostigmata, and Prostigmata ± SE in burned and unburned split-plots during each of the three sampling periods (June 1998, October 1998, and June 1999).
Forests 03 00959 g001
Although oribatids composed less of the total mite abundance during the later two sampling periods than during June 1998, mean oribatid abundance and fire response were surprisingly stable throughout the monitoring period (Figure 1). Oribatid abundance was approximately the same in the unburned split-plots during each sample period but declined stepwise at each consecutive sampling interval in the burned split-plots (p = 0.057 in June 1998, p = 0.02 in October 1998, and p = 0.052 in June 1999).
Mesostigmatid mite abundance also declined in the burned split-plots during each sampling period (p = 0.08 in June 1998, p = 0.006 in October 1998, and p = 0.2 in June 1999). They were also quite significantly less abundant in the burned split-plots during June 1999 than during June 1998 (p = 0.01).

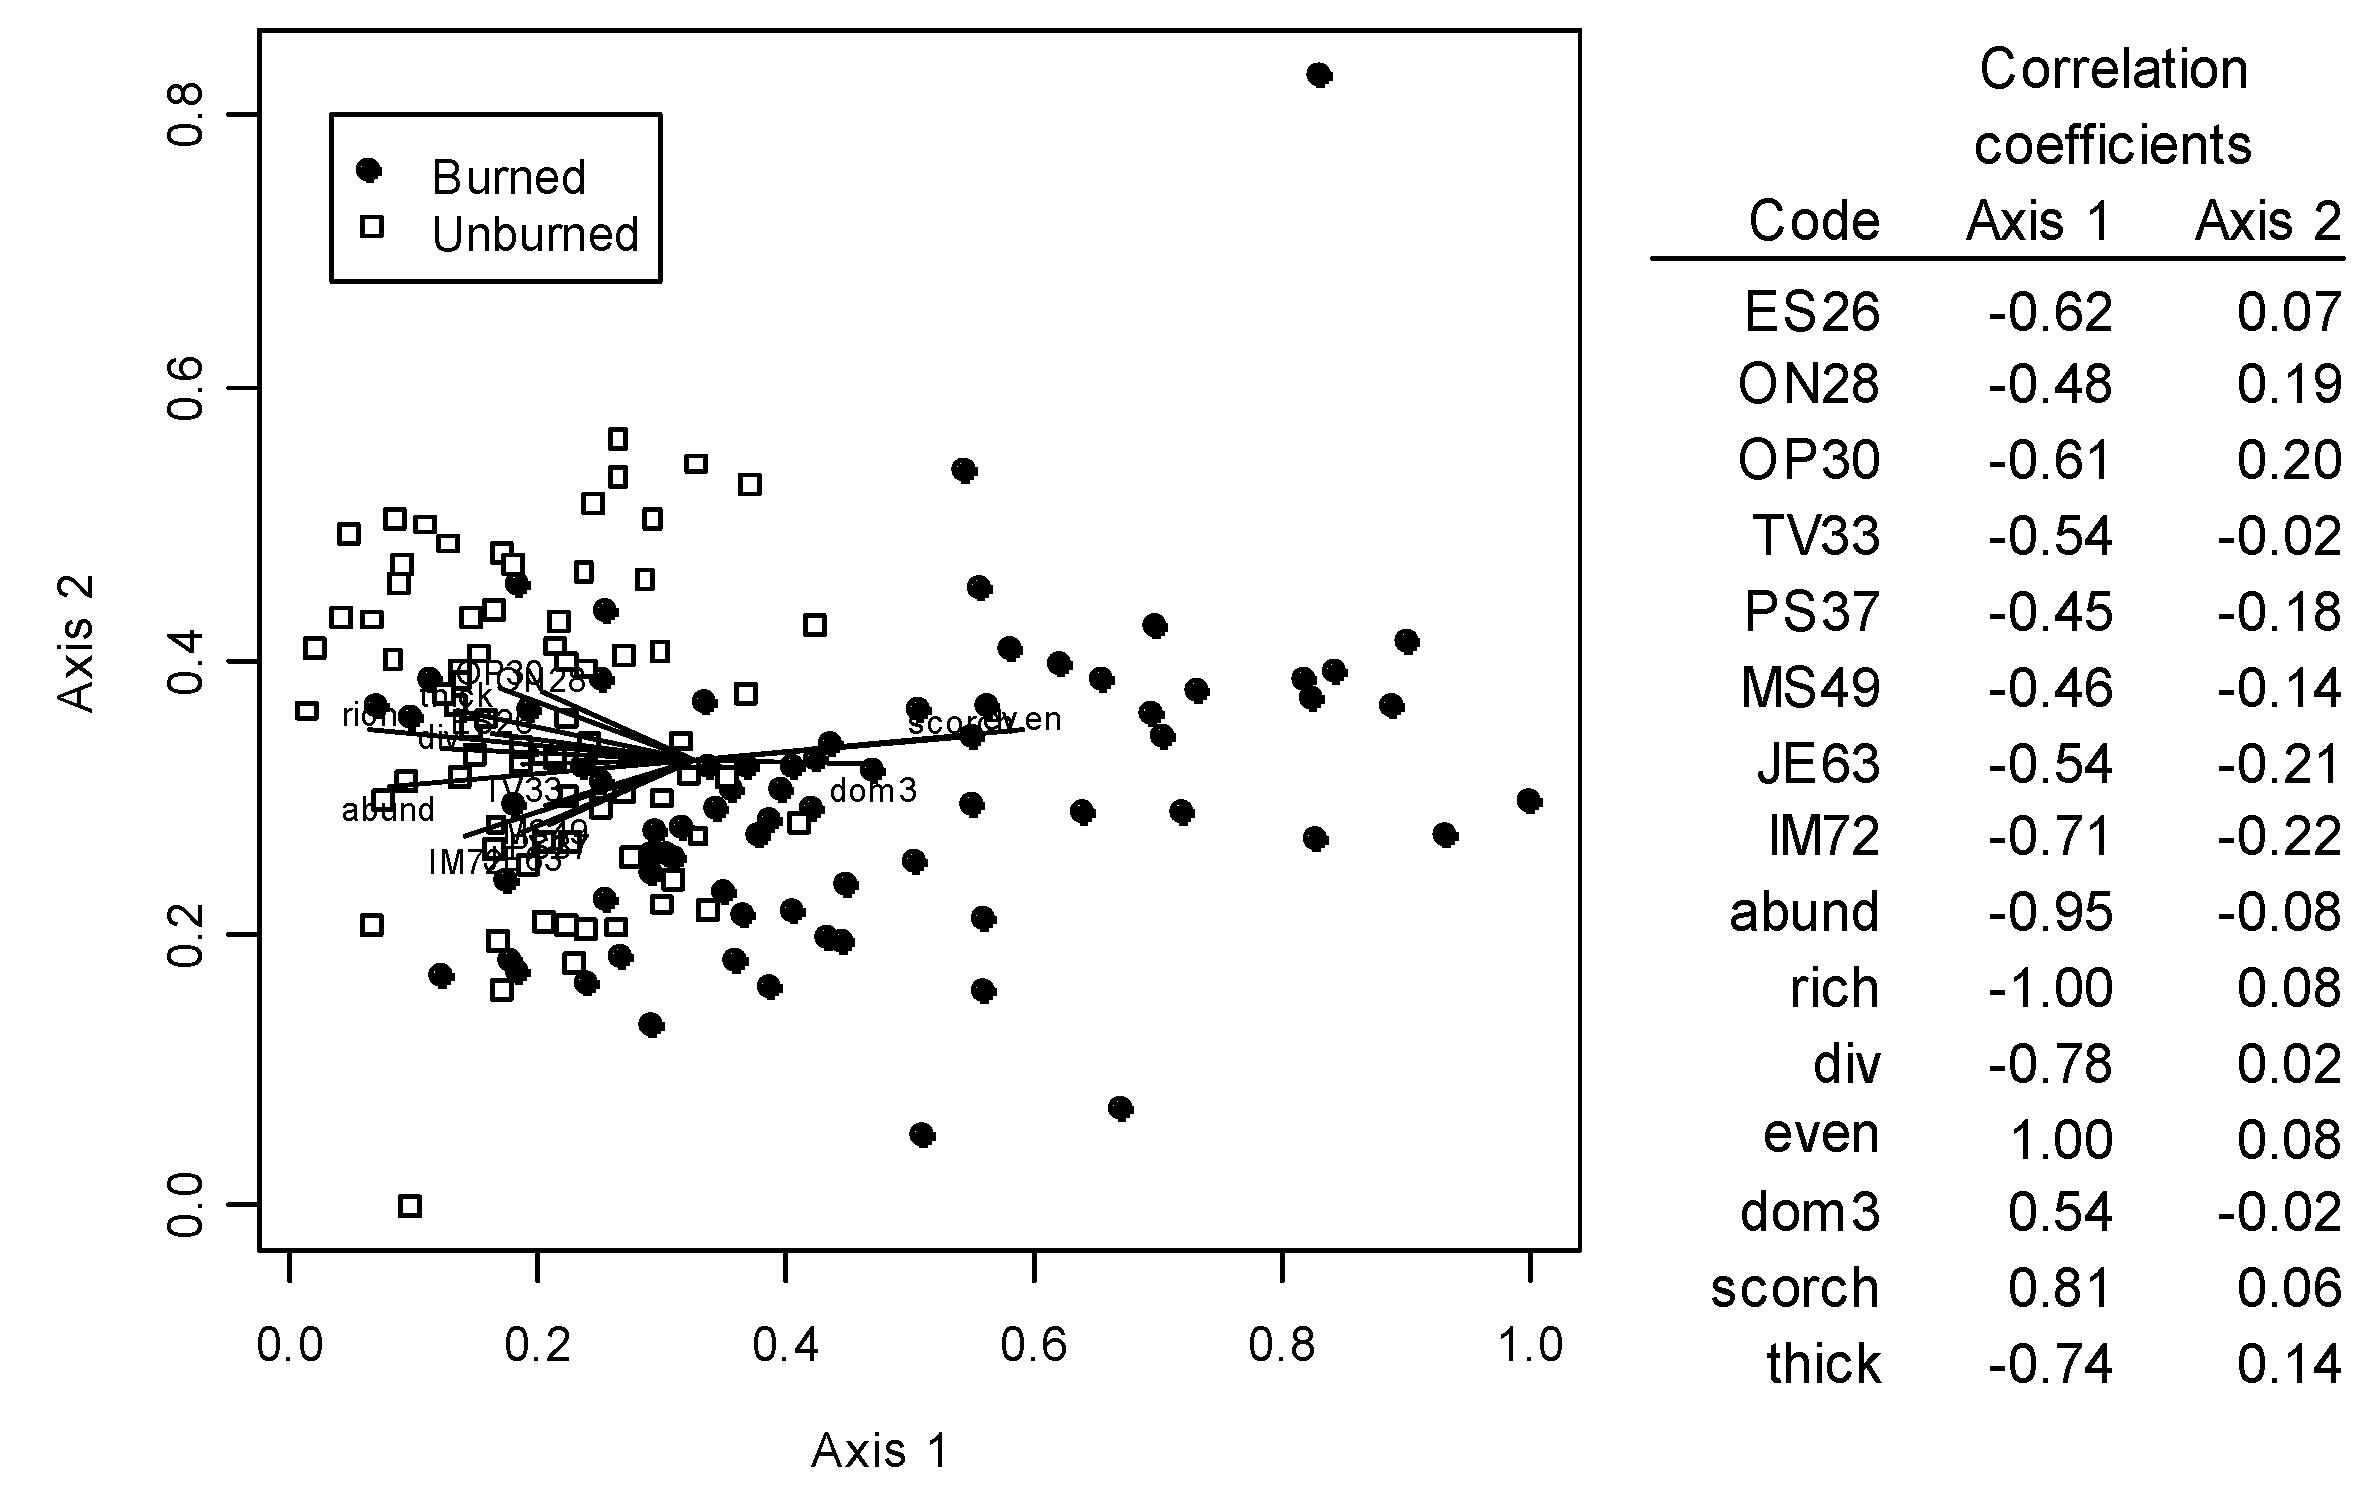
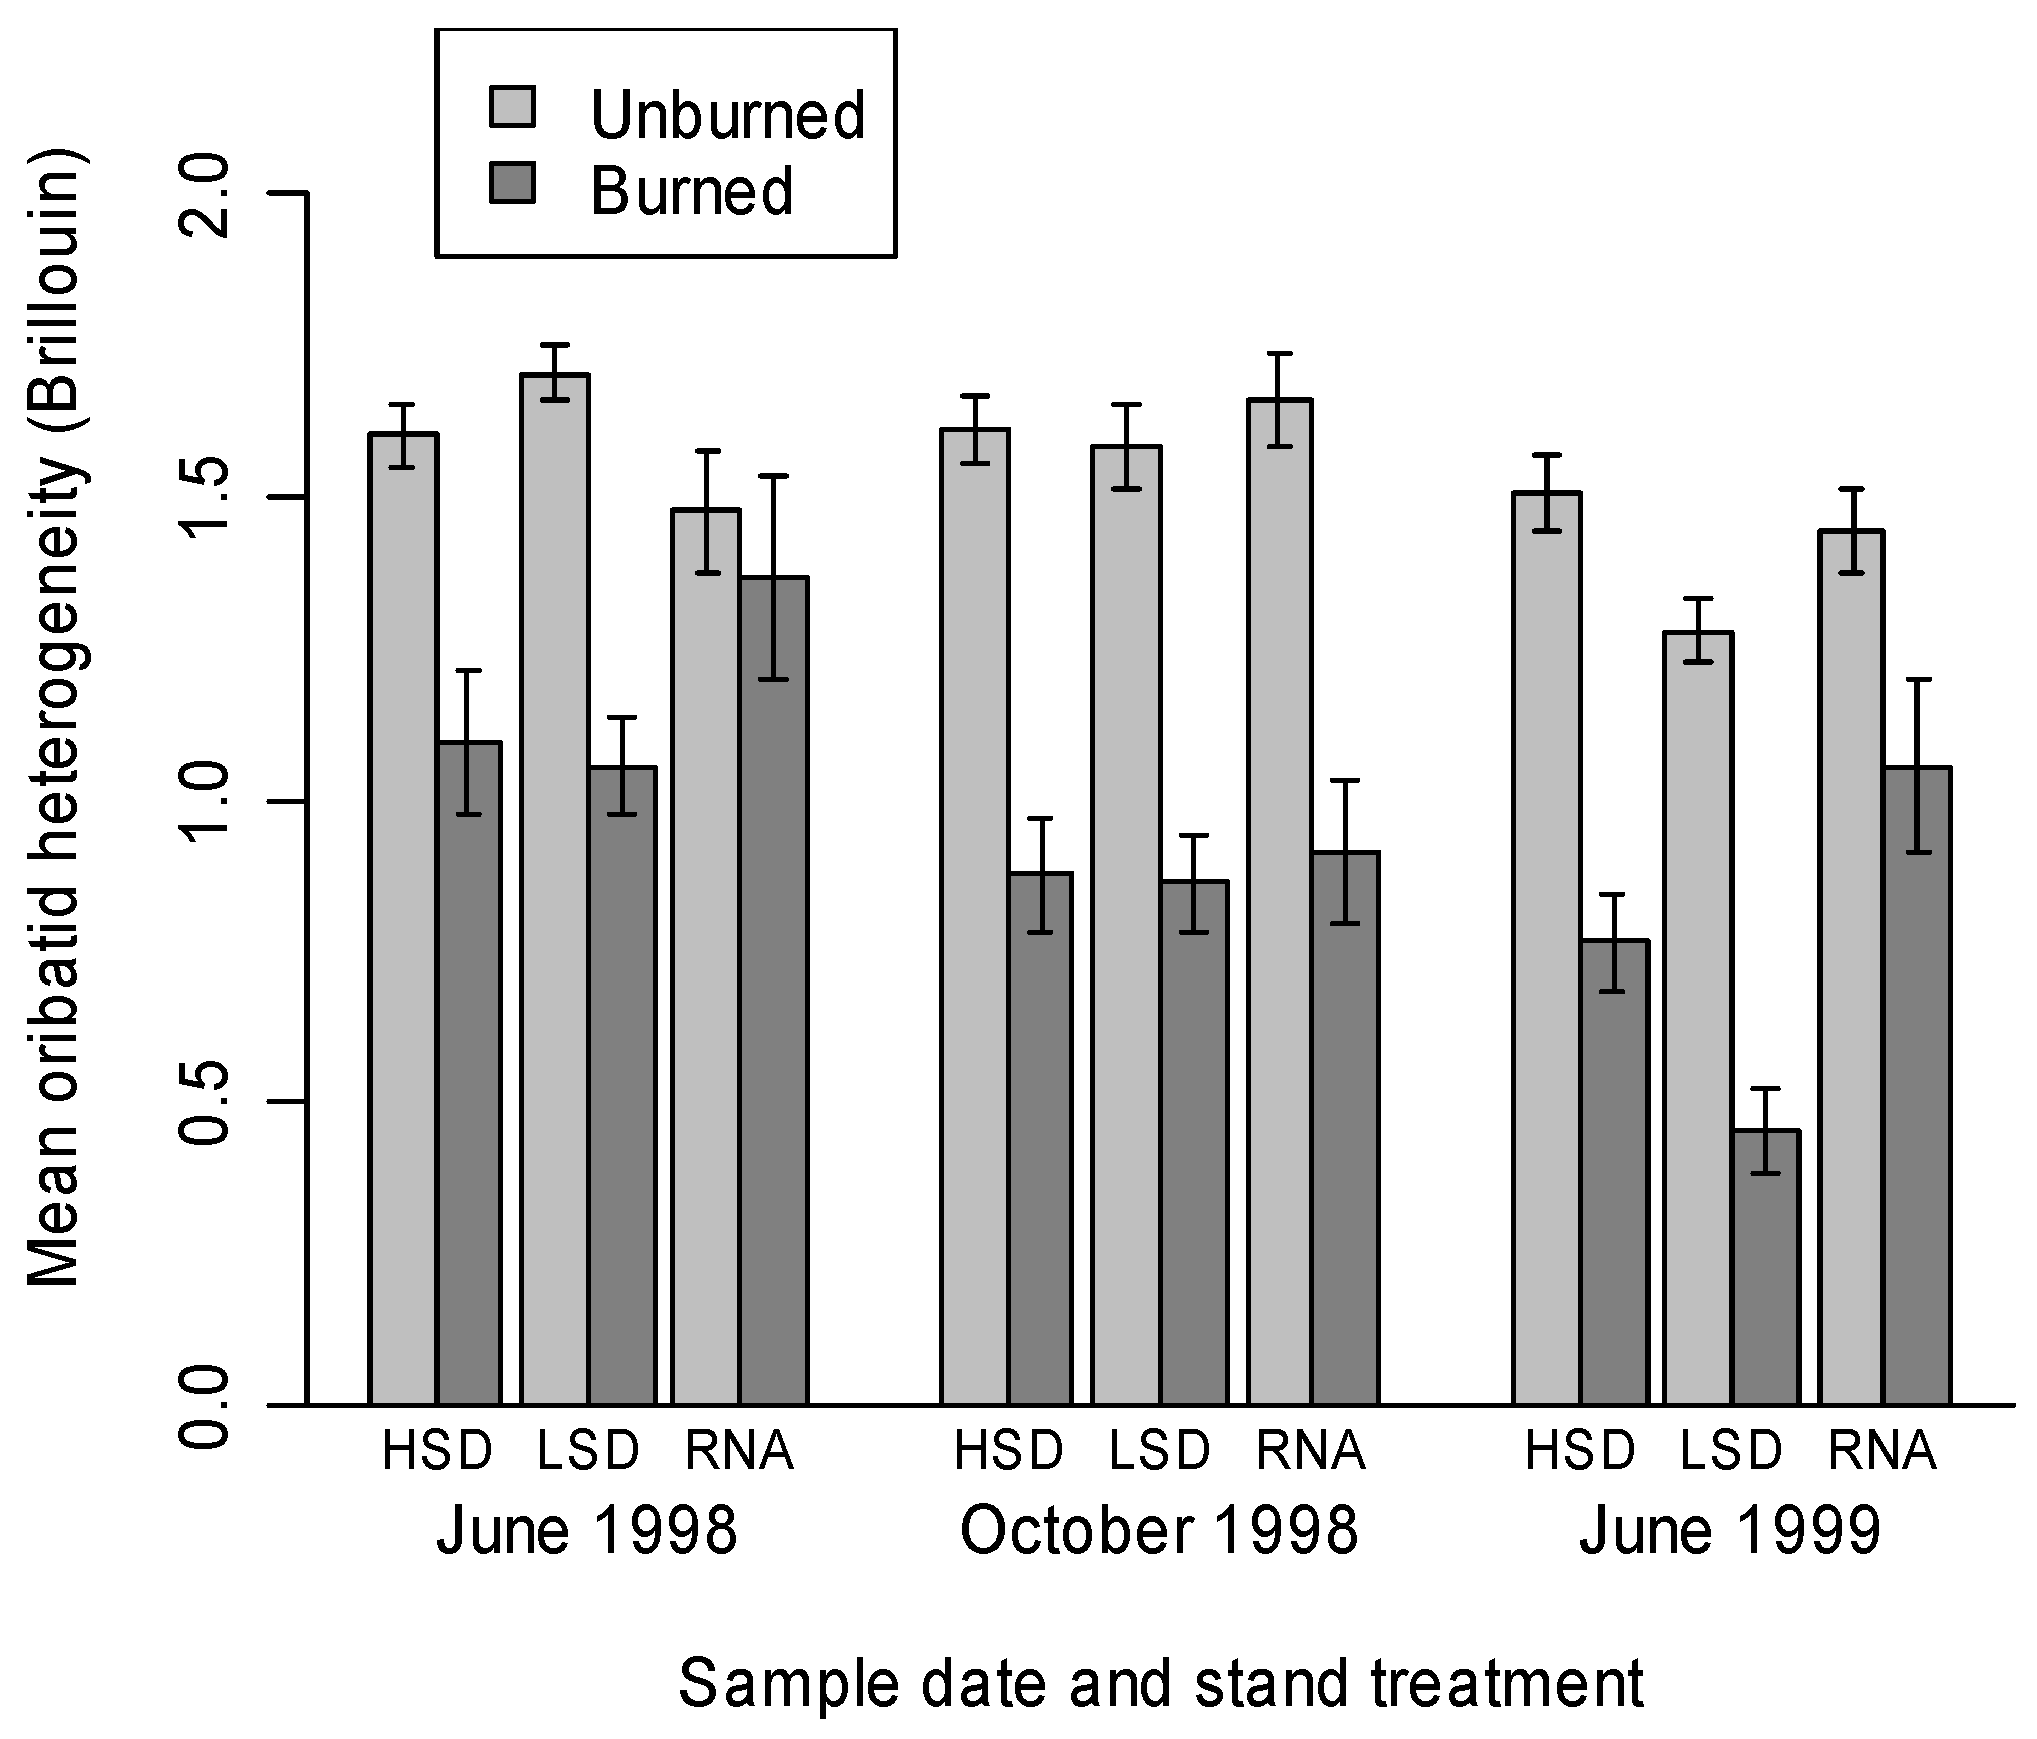
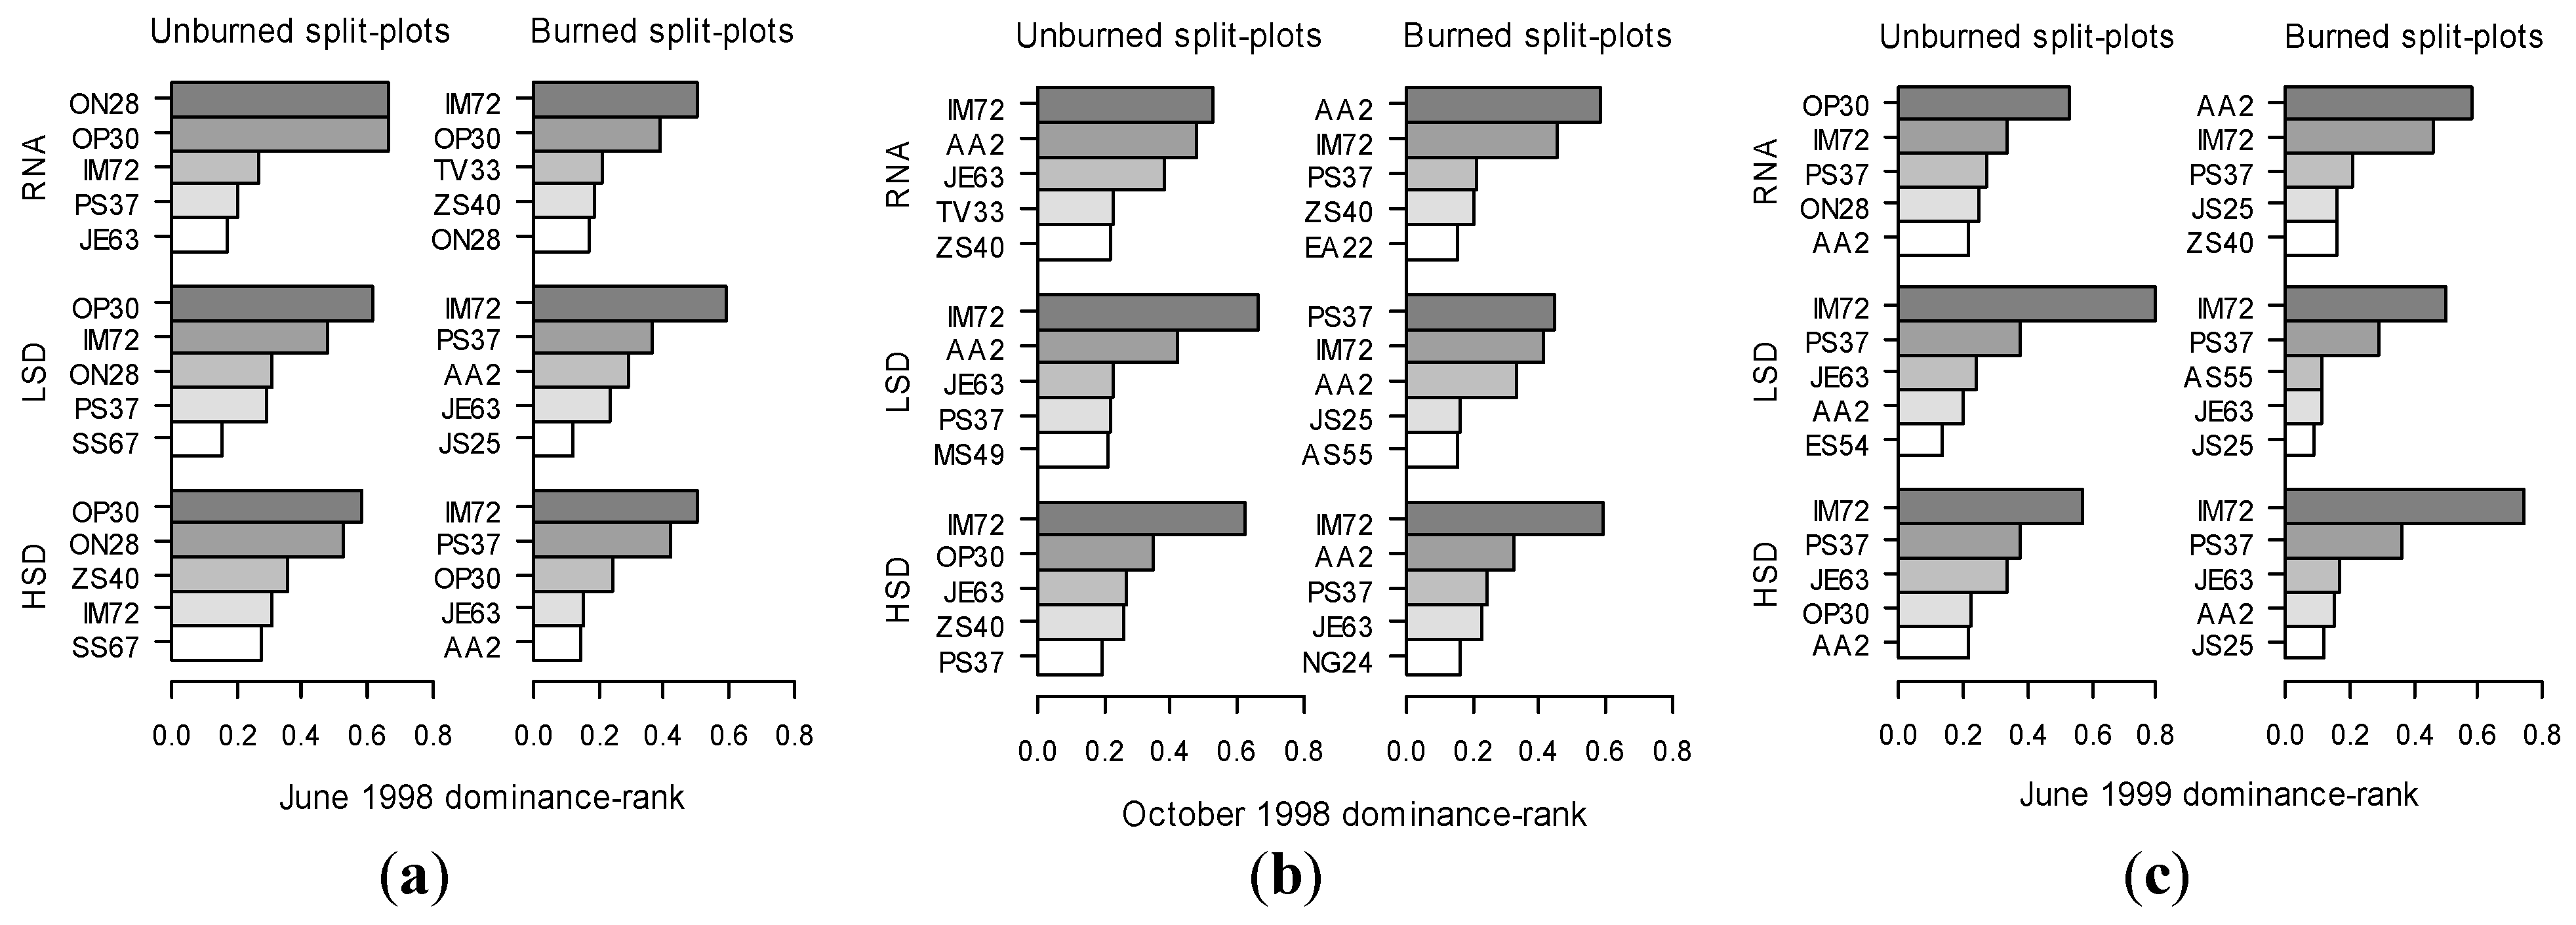
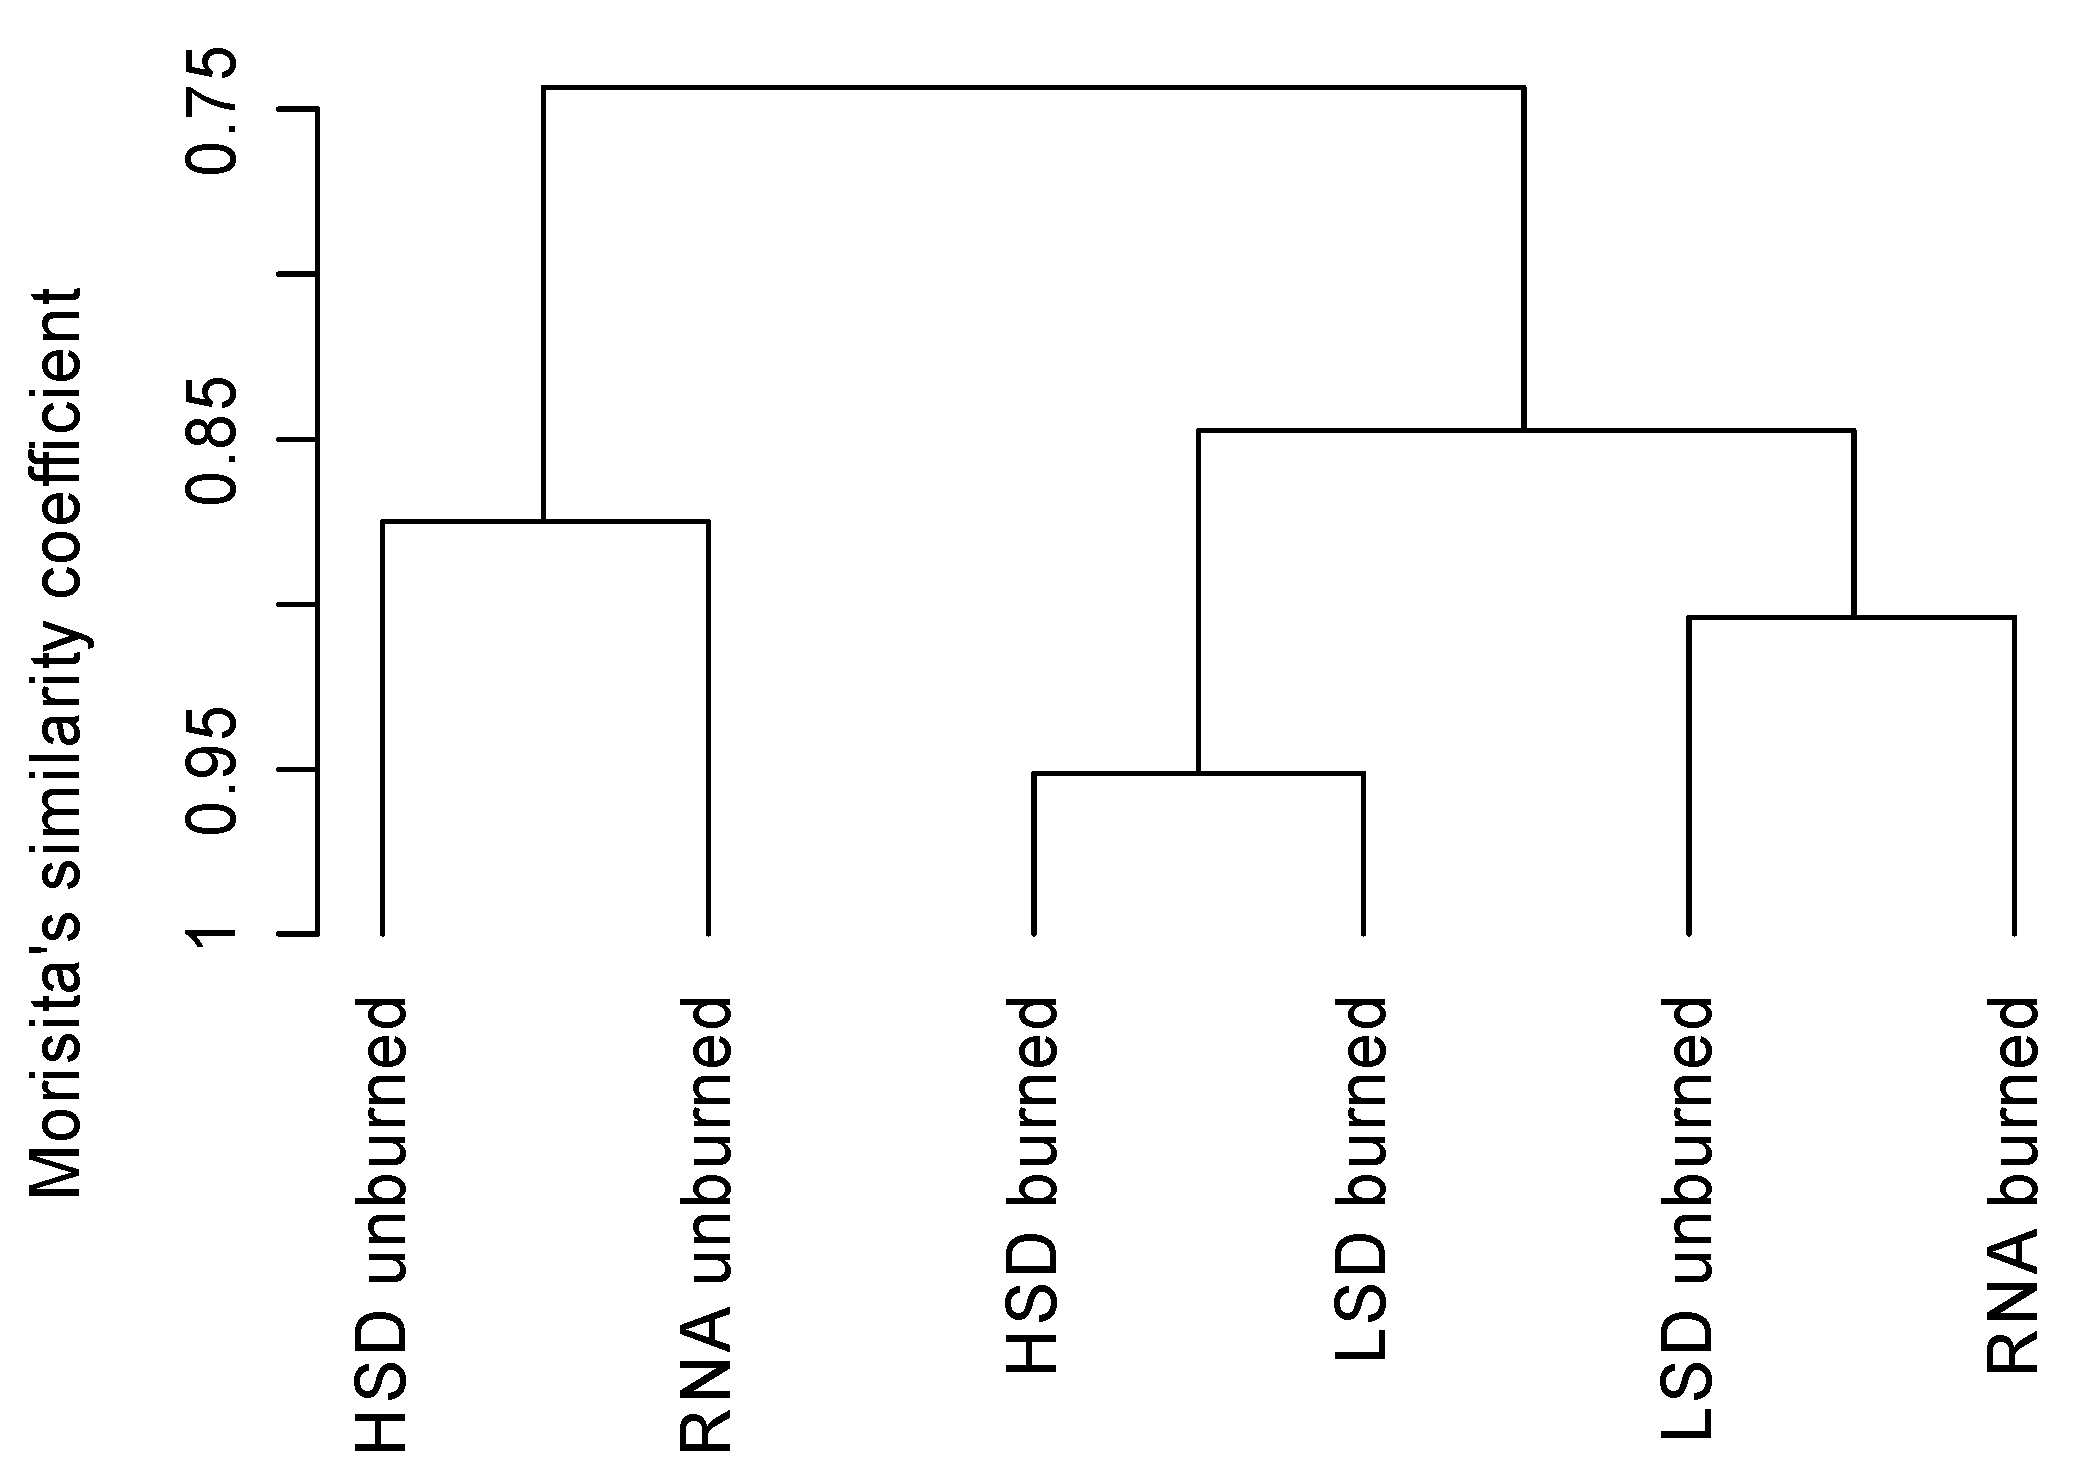
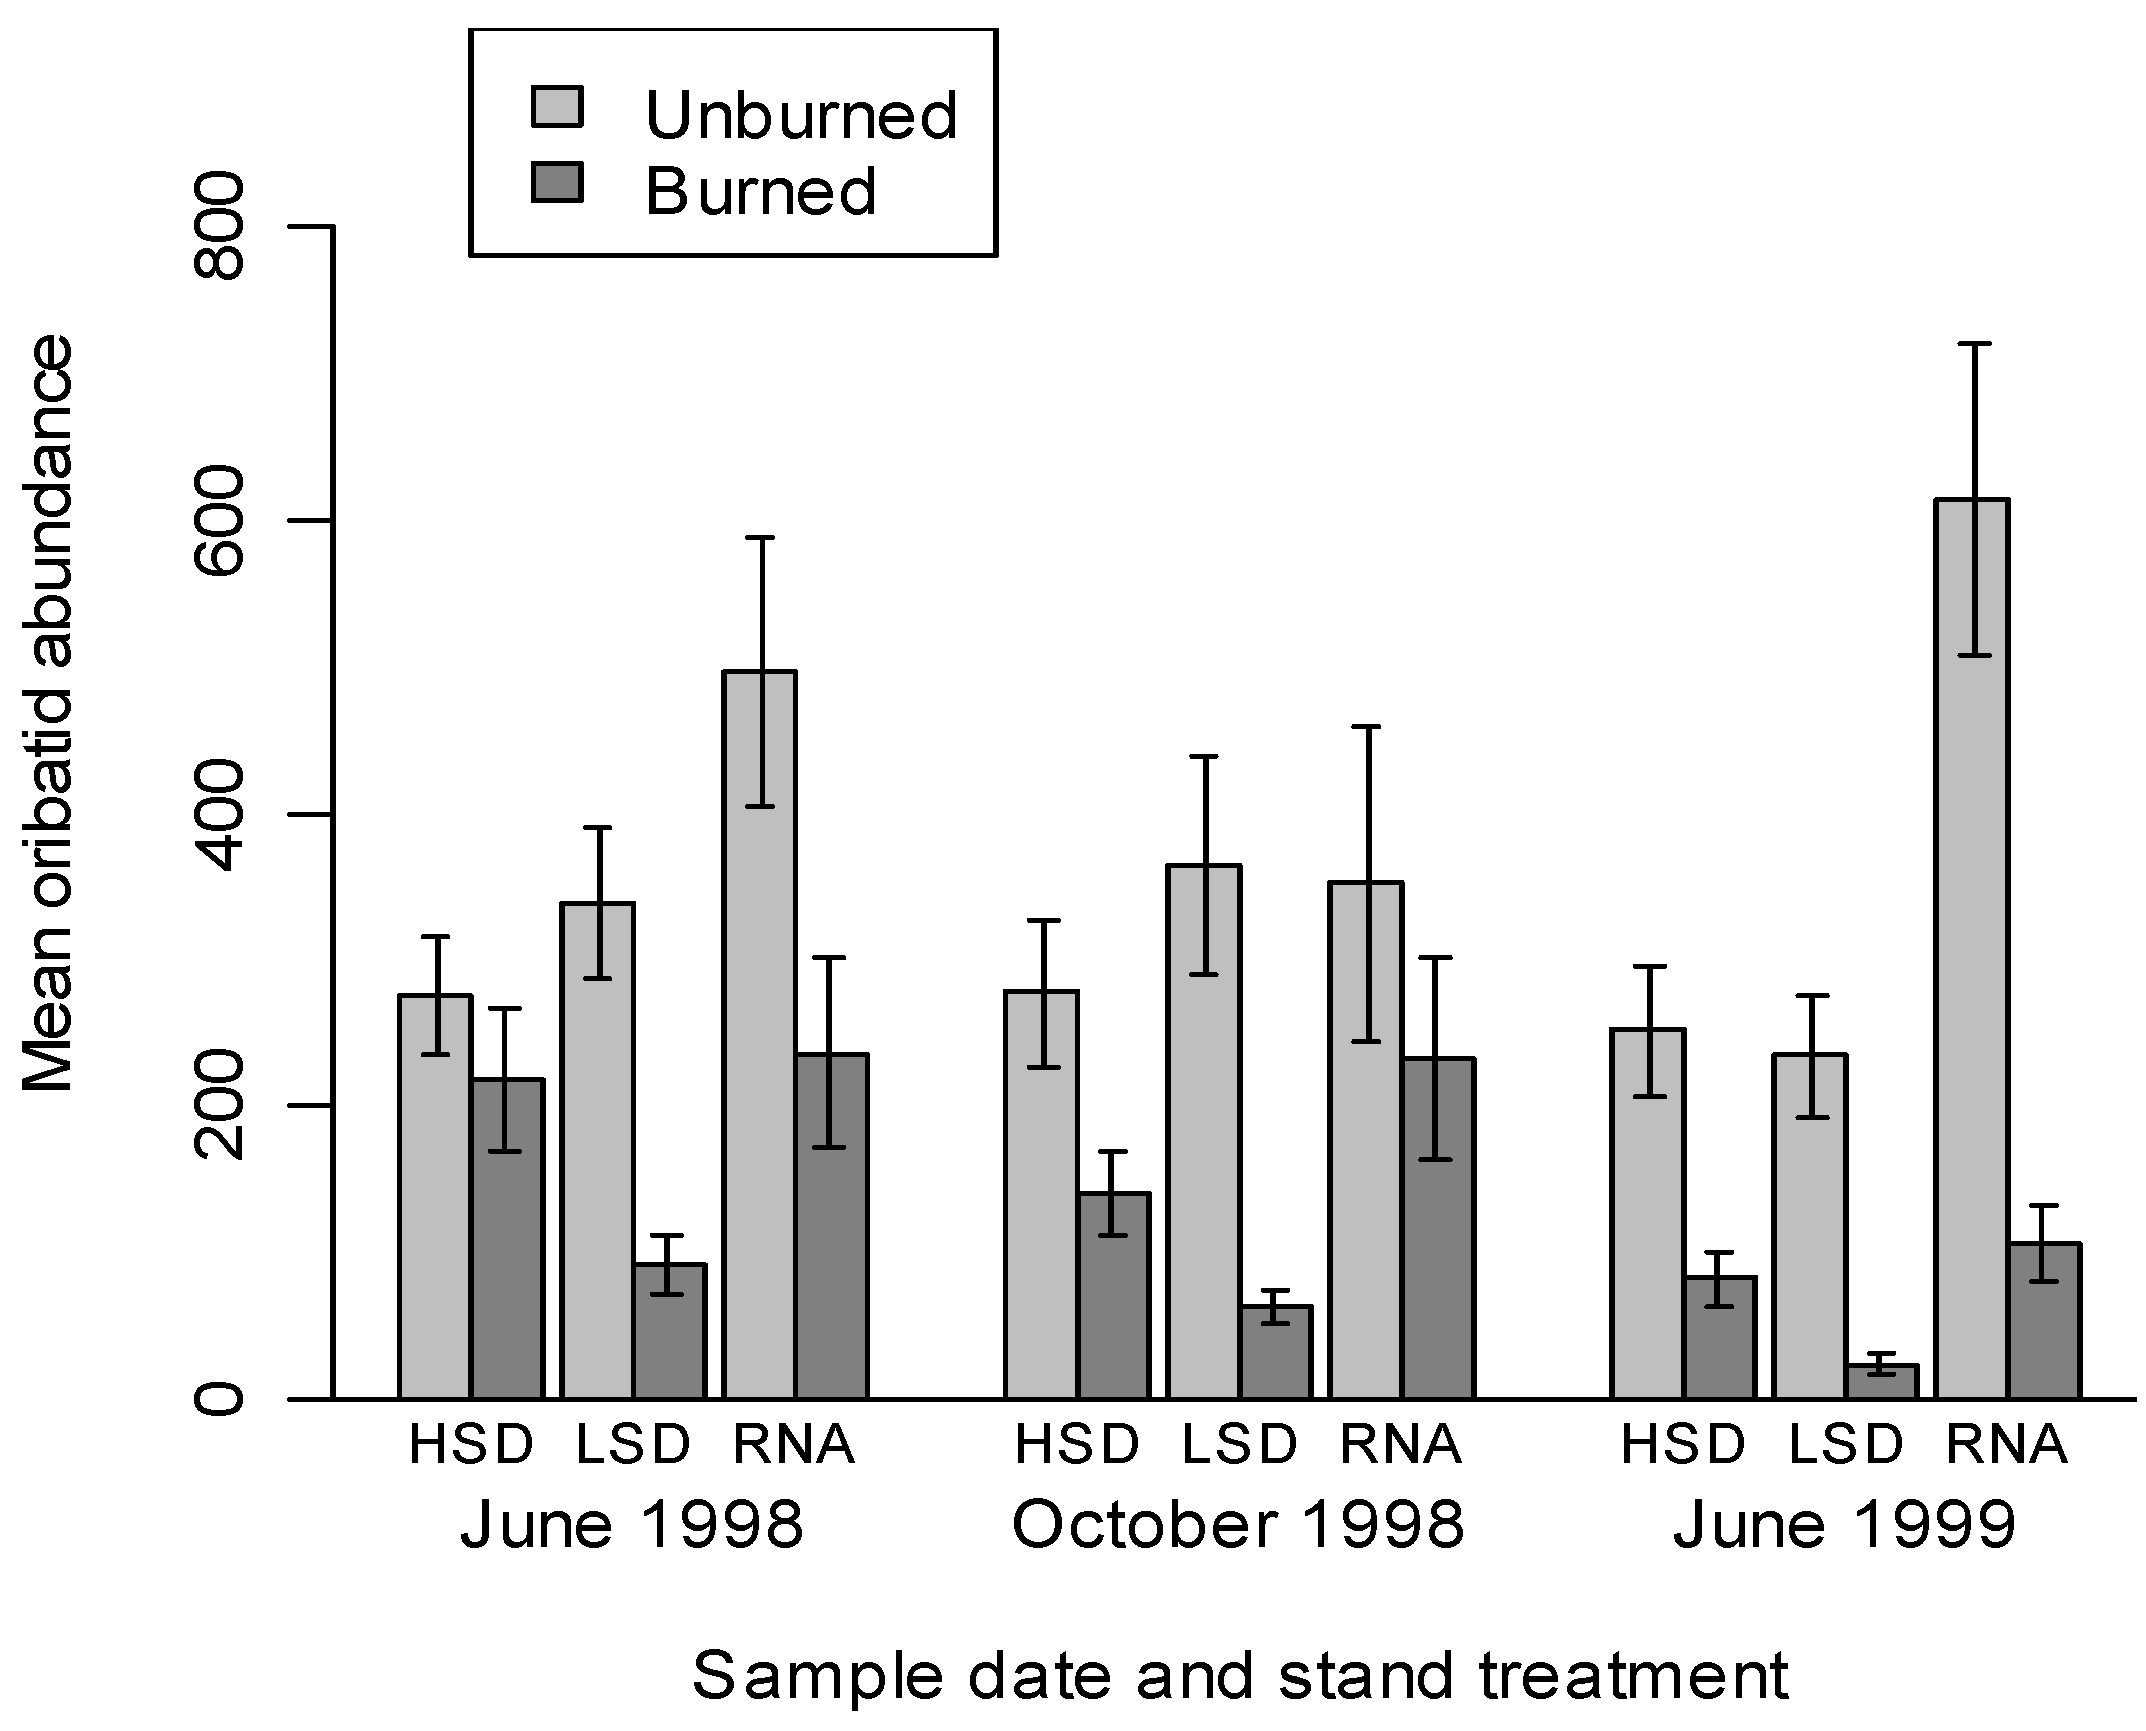
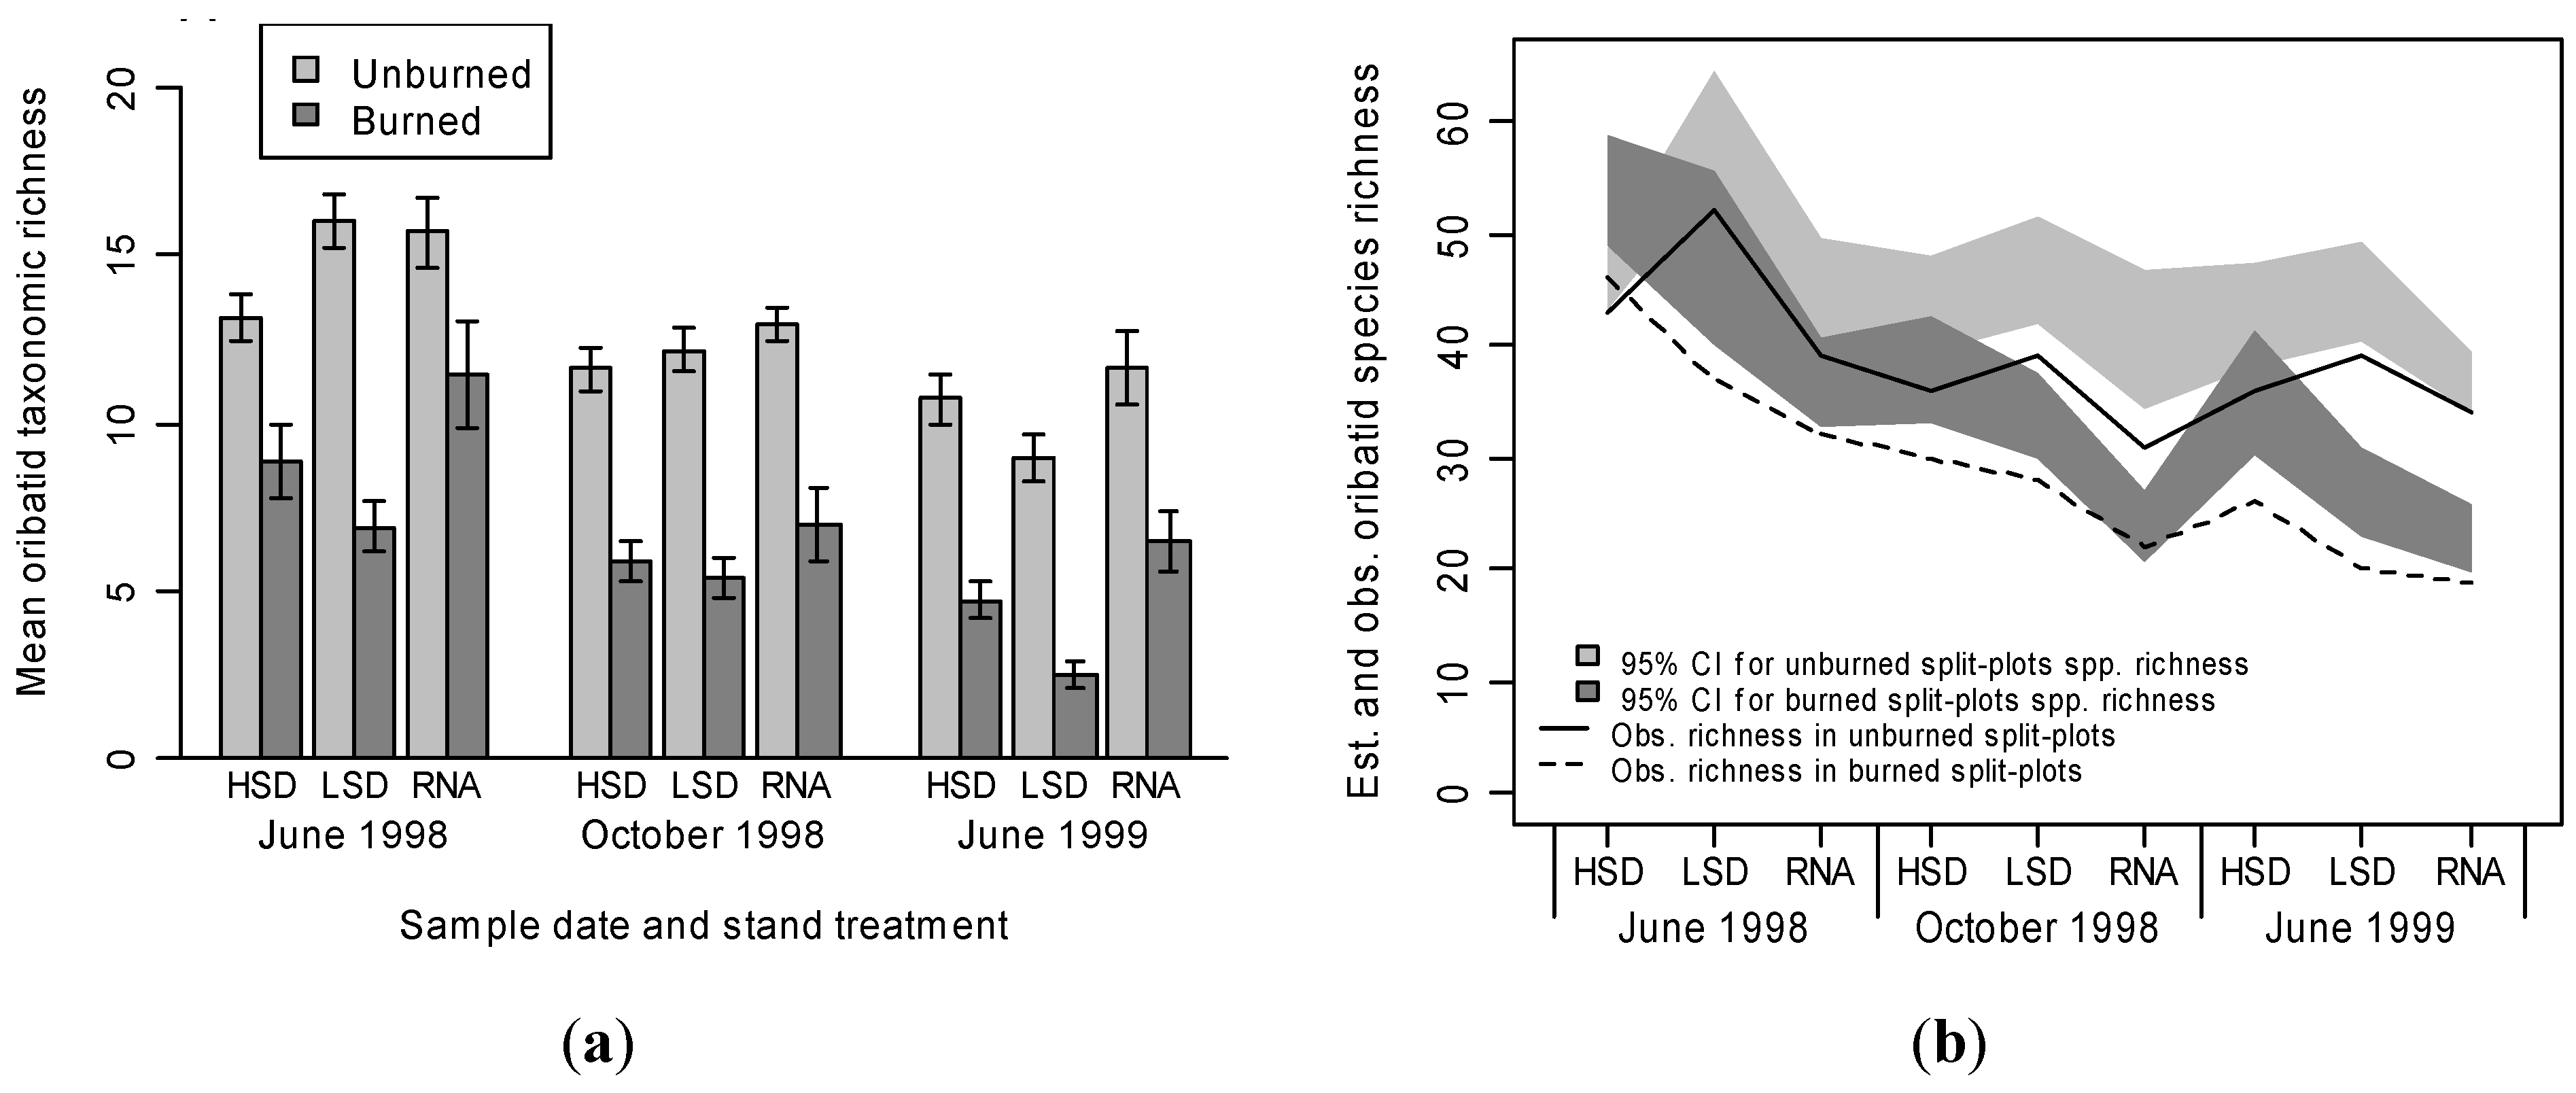
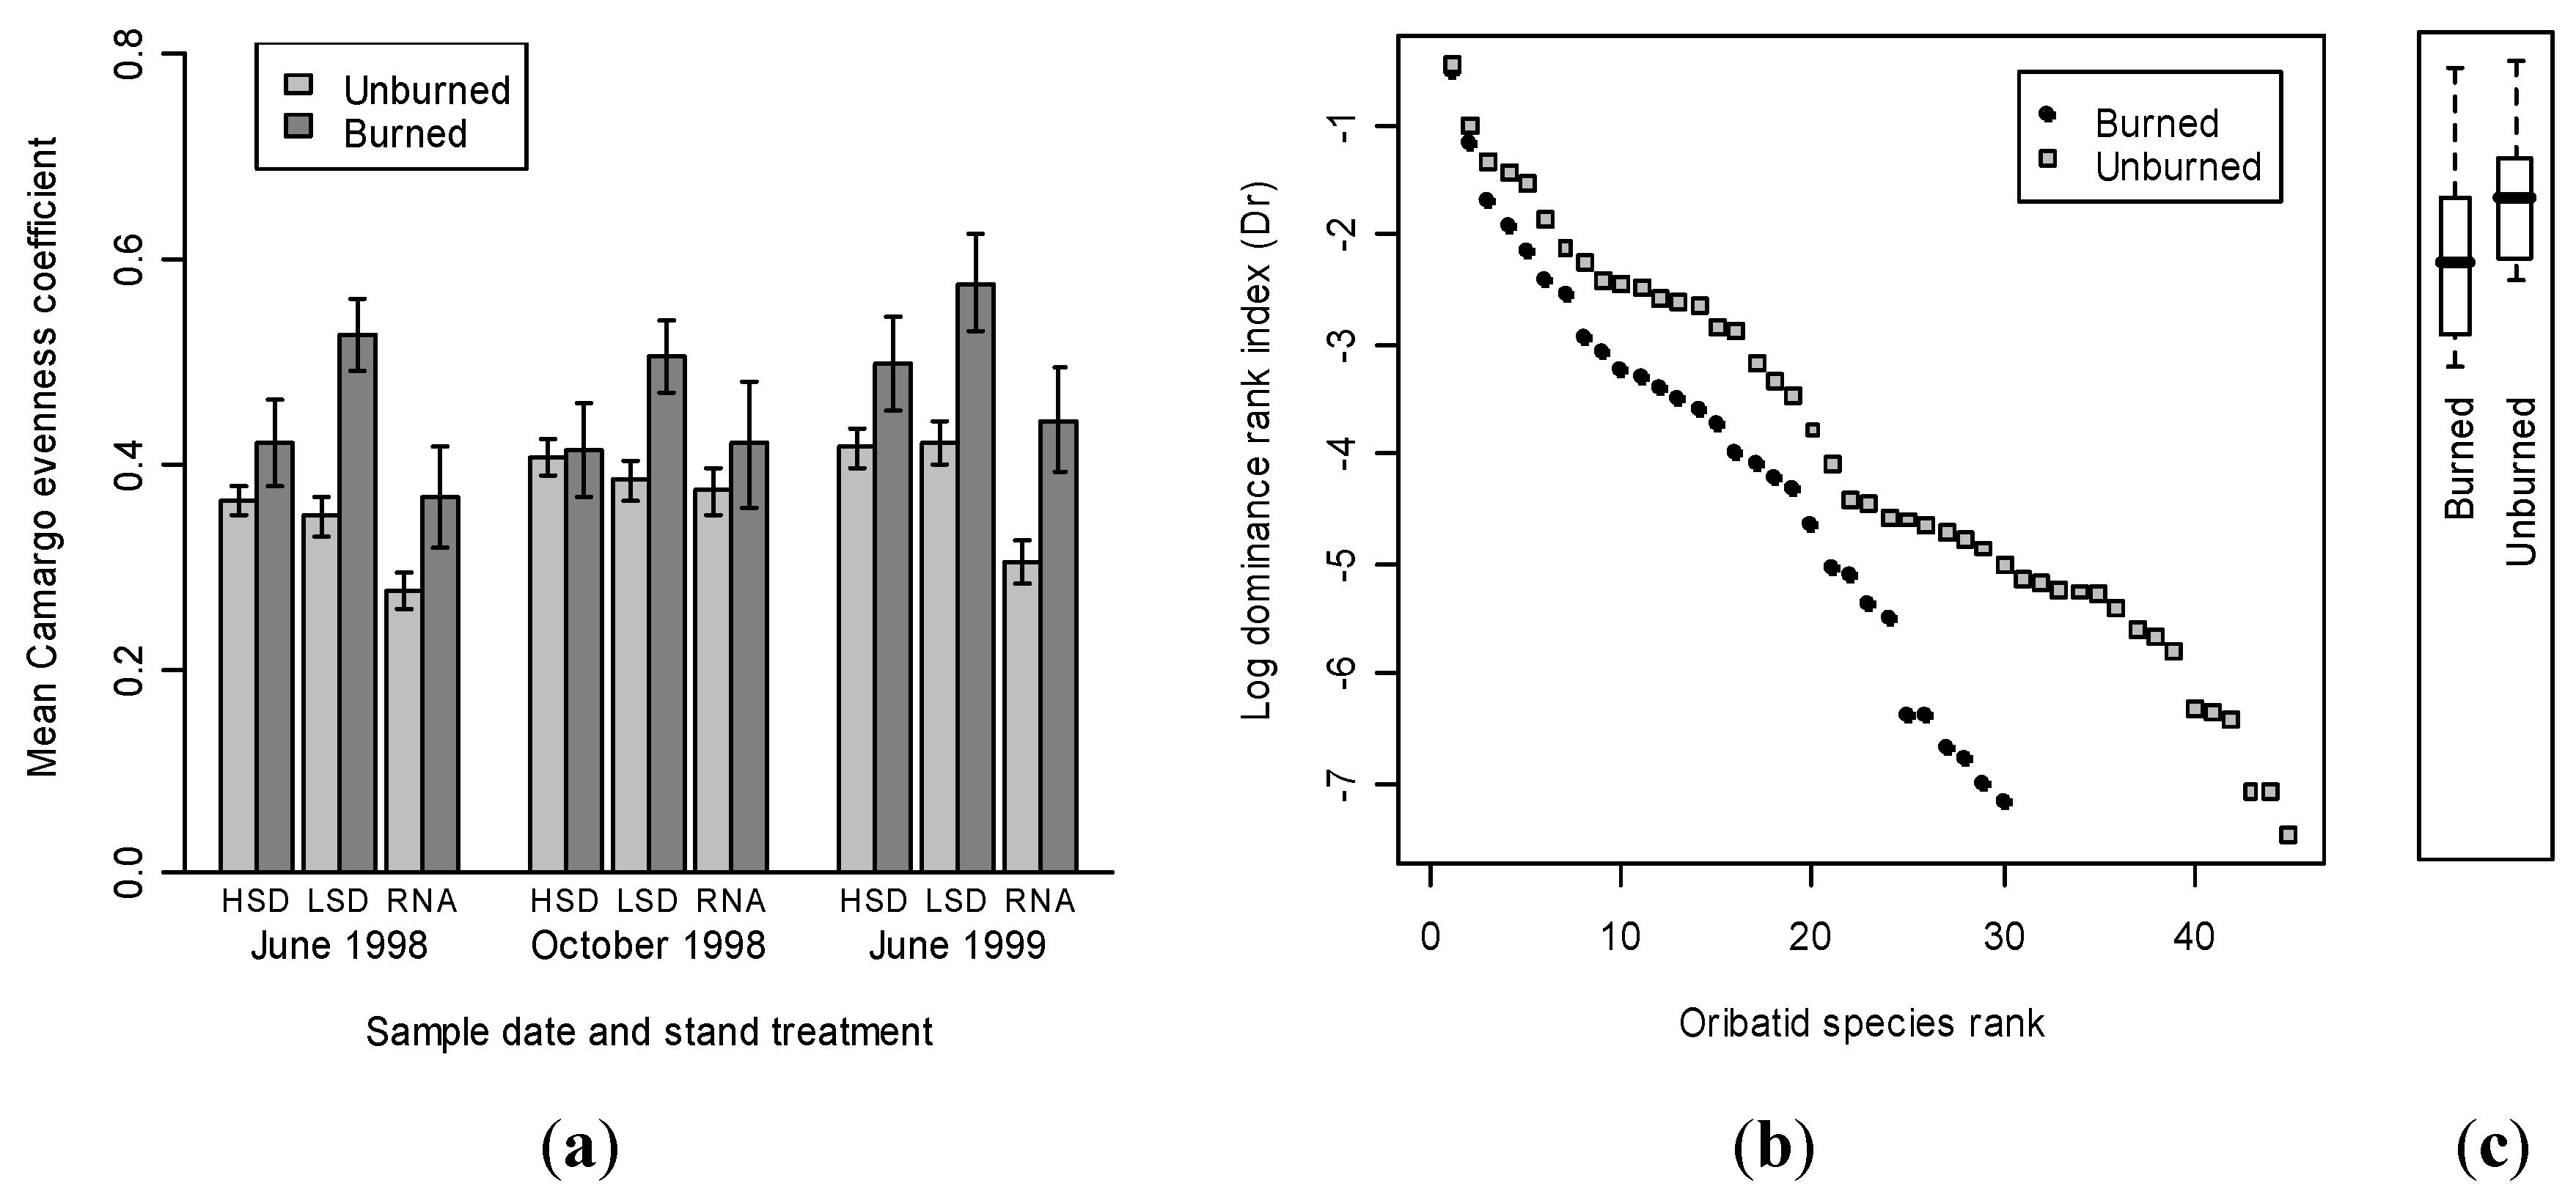
3.2. Oribatid Assemblage Responses

Seventy-two oribatid species were identified in the 600 samples. Sixty of those also occurred in the 200 samples from June 1998, so collecting 400 additional samples and determining over 135,000 additional specimens added only 12 additional taxa to the June 1998 species list, a noteworthy result. Most specimens were identified to species or morphospecies within determined genera (Table 1).
Table 1. Oribatid species and morphospecies collected during June 1998, October 1998, and June 1999 in 600 sifted litter samples. Taxa are listed in descending order of abundance (N). Species codes correspond to codes in Figure 2 and Figure 7. Treatment and Fire status refer to the stand structure treatments, RNAs, and burn groups for which each oribatid taxon was a significant indicator species. Observed indicator values (percent perfect indication) are listed in the IV1 and IV2 columns, where IV1 is the indicator value for the stand structure in the previous column and IV2 is the indicator value for the unburned or burned split-plots, with harvest treatments pooled. P-values from Monte Carlo simulations are summarized with asterisks: p < 0.05 *, p < 0.01 **, p < 0.001 ***, and p ≥ 0.05 ns.
TaxonCodeNTreatmentIV1Fire statusIV2
immature oribatidsIM7226,472LSD25.7 **unburned65.4 ***
Oppia parviauresOP3023,976RNA40.6 ***unburned58.5 ***
Aphelacarus acarinusAA215,777-ns-ns
Oppiella novaON2815,725RNA42.8 ***unburned49.7 ***
Propelops sp. aPS379,885allnsunburnedns
Jacotella enopluraJE637,035RNA27.8 ***unburned58.0 ***
Tectocepheus velatusTV336,227RNA27.9 ***unburned49.4 ***
Zachvatkinibates sp.ZS405,888HSD24.5 ***unburned35.2 ***
Suctobelbella sp. aSS673,941HSD21.5 ***unburned38.2 ***
Maculobates sp. aMS492,701LSD15.6 *unburned43.4 ***
Epidamaeus sp. aES262,175RNA30.2 ***unburned64.7 ***
Eueremaeus alvordensisEA221,826RNA16.9 **burned26.9 *
Quadroppia sp. aQS271,816RNA55.1 ***unburned41.7 ***
Joshuella sp. nr striataJS251,617RNA17.0 **burned25.3 **
Nortonella gildersleeveaeNG241,318-ns-ns
Pilogalumna sp.PS431,027HSD13.1 *unburned36.1 ***
Eobrachychthonius latiorEL11978LSD18.6 ***unburned18.3 ***
Ametroproctus sp.AS55813LSD14.0 **unburnedns
Eueremaeus stiktosES54718LSD30.2 ***unburned27.7 ***
Oribatella dentaticuspisOD59601LSD27.1 ***unburned23.4 ***
Oribatula tibialisOT62432RNA14.7 ***burned7.0 *
Microppia minusMM64400RNA7.3 *unburned7.3 *
Ceratozetes cuspidatusCC41385LSD6.9 *unburned11.2 **
Scheloribates sp. bSS51290-ns-ns
Liochthonius brevisLB20273LSD11.8 **unburned7.5 **
Galumna sp.GS66256HSD4.8 *-ns
Cultoribula vtouriCV39253HSD9.8 **unburned19.1 ***
Scheloribates sp. aSS38226RNA12.3 ***-ns
Brachychthonius sp. aBS8201-ns-6.3 *
Gymnodamaeus sp.GS50182HSD14.4 ***unburned18.4 ***
Ramusella maniferaRM36179LSD5.7 **unburned6.7 **
Verachthonius sp. aVS5174LSD8.2 **unburned7.3 **
Maculobates sp. bMS69167LSD10.3 **unburned8.6 **
Cosmochthonius lanatusCL77163HSD9.8 **-ns
Oribatella sp. aOS58123RNA5.4 *unburned5.6 **
Scapheremaeus sp.SS73120LSD5.7 **burned3.0 **
Brachychthonius bimaculatusBB7118RNA12.9 ***unburned6.3 *
Eremaeus sp.ES6882LSD8.7 ***unburned6.7 **
Scheloribates sp. dSS7575-ns-ns
Scheloribates sp. cSS7061-ns-ns
Quadroppia sp. cQS4659-ns-ns
Verachthonius sp. bVS657RNA4.5 *unburned3.7 **
Camisia horridaCH6148-ns-ns
Sellnickochthonius rostratusSR934-nsunburned5.1 **
Passalozetes striatusPS6033LSD4.2 *-ns
Carabodes sp.CS8431LSD2.7 *-ns
Zygoribatula sp. aZS7129-ns-ns
Paraleius sp.PS4529-nsunburned4.4 **
Fosseremus quadripertitusFQ2329HSD2.5 *-ns
Microppia sp. aMS3118-ns-ns
Quadroppia sp. bQS5215-ns-ns
Charassobatidae sp.C5711LSD3.2 *-ns
Autogneta longilamellataAL4411-ns-ns
Xylobates robustiorXR538-ns-ns
Sellnickochthonius immaculatusSS488HSD3.4 **-ns
Senoribula sp.SS876RNA3.1 *-ns
Tectocepheus sp. bT816HSD3.5 **-ns
Licnodamaeus sp.L705-ns-ns
Poecilochthonius italicusPI124-ns-ns
Oppiod sp. bOS883RNA3.4 **-ns
Ramusella clavipectinataRC823-ns-ns
Allosuctobelba sp.A653-ns-ns
Kalyptrazetes sp.KS563-ns-ns
Epidamaeus sp. bES862-ns-ns
Banksinoma sp.BS852-ns-ns
Sellnickochthonius sp. bSS182-ns-ns
Beklemisheria galeodulaBG12-ns-ns
Metrioppia sp.MS831-ns-ns
Multioppia sp.M791-ns-ns
Pirnodus sp.PS781-ns-ns
Parisuctobelba sp.PS741-ns-ns
Nanhermannia dorsalisND211-ns-ns
Mesotritia sp.ME101-ns-ns
Several oribatids were significant indicator species, either for specific treatment combinations or for classifying split-plots as either unburned or burned (Table 1). For example, there were 34 species with significantly greater abundance and faithfulness of occurrence in unburned plots, among which Epidamaeus sp. a, O. parviaures, J. enoplura, O. nova, Propelops sp. a, and T. velatus were the strongest indicators. Immature oribatids were also indicative of unburned units. Conversely, there were only three oribatid species with significant indicator values for burned split-plots, and only one of these, Joshuella sp. nr. striata, was likely a useful indicator species when considered across all sample dates. This was in contrast with our previous report in which A. acarinus was a very strong indicator species for burned split-plots [6]. Reexamination of the June 1998 samples confirmed that A. acarinus yielded significant indicator species values in burned units during that sample interval, but did not do so in our analysis of the October 1998 samples and produced significant indicator values for unburned units during June 1999.
MRPP procedures confirmed that sample date and stand structure treatment significantly influenced oribatid assemblages; however, low intensity fire appeared to overshadow both temporal and stand treatment effects. In several such comparisons analyzing the unburned and burned split-plots separately, sample date or stand treatment effects disappeared in the burned split-plots. It was apparent, nevertheless, that oribatid assemblages were fundamentally heterogeneous across every parameter tested. Although prescribed fire was undoubtedly a primary causal factor, some component of variation was also contributed by other undefined parameters. Camann et al. [6] showed that, at least within the June 1998 data, oribatid community structure was also heterogeneous among the replicate unburned split-plot treatments.
Fifty oribatid species met the frequency criteria for inclusion in NMS ordinations, i.e., occurrence in at least 10 percent of transects sampled. The optimal NMS solution accounted for 74 percent of the variance in the unreduced data space (Figure 2). The first NMS axis expressed 60 percent of that variation and was strongly correlated with several estimates of fire intensity and oribatid community structure. For example, virtually all oribatid species were ordered within the region of ordination space dominated by unburned split-plots. The numbers of scorched samples per transect increased along the first axis and the mean litter depth decreased. Litter was significantly thinner in the burned split-plots, although litter consumption down to mineral soil was not common [6]. Several oribatid mite species with strong positive correlations with the first NMS axis, e.g., O. nova, O. parviaures, T. velatus, and J. enoplura, were among the most numerically dominant oribatids in the unburned split-plots but experienced striking loss of dominance following prescribed fire. Total oribatid abundance, species richness, and assemblage diversity were inversely correlated with the first NMS axis, while assemblage evenness and the proportion of the assemblage accounted for by the three top ranked taxa increased.
Oribatid abundance declined after prescribed fire in every treatment (Figure 3), although p values for the effect were entirely consistent except in the RNAs (p = 0.02, p = 0.22, and p < 0.001 for June 1998, October 1998, and June 1999 samples, respectively). This likely reflected interaction between low numbers of replicates at the plot level and multiple levels of random effects nesting within models for the HSD and LSD plots. The only source of random effects in the RNAs was transect selection. Nonetheless, it was clear that oribatid abundance continued to decline in the burned split-plots, and especially in the harvested plots, for at least the two years after burning. In many instances the most numerically abundant species suffered disproportionate decline (Table 2).
Figure 2. NMS ordination of oribatid mite assemblages from 90 east–west transects in burned and unburned split-plots. The first NMS axis summarizes most of the fire related alterations in assemblage structure. Vectors overlaid upon the joint-plot represent the major oribatid species abundance and assemblage structure gradients, and two habitat quality correlates of low intensity fire. Oribatid species codes are explained in Table 1; abund is total oribatid mite abundance; rich = oribatid species richness; div is oribatid assemblage heterogeneity, estimated with Brillouin diversity coefficients; even is the Camargo coefficient of oribatid assemblage evenness; dom3 is the proportional abundance of the three most abundant oribatid taxa; scorch is the proportion of eight samples on each transect that exhibited physical evidence of scorching; and thick is the mean litter thickness from which oribatid samples were obtained.
Forests 03 00959 g002
Figure 3. Mean abundance of oribatid mites ± 1.0 SE in burned and unburned split-plots from high structural diversity treatment stands (HSD), low structural diversity treatment stands (LSD), and Research Natural Area reference stands (RNA) during each of the three sampling periods (June 1998, October 1998, and June 1999).
Forests 03 00959 g003
Table 2. The effects of prescribed fire on the most numerically dominant oribatid species (and immatures) in each of the stand structural treatments, with the three sample dates pooled. Number of samples (n) was: (1) HSD unburned split-plots, n = 120; (2) HSD burned split-plots, n = 120; (3) LSD unburned split-plots, n = 120; (4) LSD burned split-plots, n = 120; (5) RNA unburned plot, n = 60; (6) RNA burned plot, n = 60. Mean values represent the mean abundance per sample ± SE. Proportion refers to the proportional abundance of each species in the total sample for each structural treatment in the pooled unburned and burned split-plots. Percent change following prescribed fire is relative to the pooled samples for each treatment.
TreatmentSpeciesUnburned split-plot abundanceBurned split-plot abundance% change
MeanProportionMeanProportion
HSDSuctobelbella sp. a16.6 ± 4.30.0681.4 ± 0.70.011−91.3
O. nova30.6 ± 5.50.1243.8 ± 1.40.029−87.3
Zachvatkinibates sp.20.9 ± 3.50.0854.7 ± 3.40.037−77.2
T. velatus18.8 ± 4.90.0765.2 ± 1.80.040−72.2
O. parviaures53.1 ± 8.80.21617.5 ± 7.80.136−66.7
J. enoplura16.5 ± 2.80.0678.9 ± 1.60.069−45.6
LSDO. nova29.1 ± 8.90.1191.1 ± 0.60.024−96.0
O. parviaures48.5 ± 9.20.1994.1 ± 2.50.085−91.5
Immature oribatids69.9 ± 7.30.28615.1 ± 2.50.316−78.3
A. acarinus51.7 ± 23.80.21311.8 ± 2.90.248−76.9
T. velatus10.4 ± 2.10.0432.4 ± 0.80.051−76.7
J. enoplura14.0 ± 2.40.0573.4 ± 1.00.072−75.3
Propelops sp. a20.7 ± 3.50.0859.7 ± 1.60.201−52.8
RNASuctobelbella sp. a15.7 ± 5.70.0310.5 ± 0.30.003−96.9
Quadroppia sp. a18.1 ± 4.90.0391.9 ± 1.10.012−89.1
O. parviaures136.6 ± 29.00.29514.2 ± 10.30.148−81.7
O. nova117.2 ± 38.20.25321.1 ± 12.20.129−81.4
T. velatus25.3 ± 6.70.0556.7 ± 1.50.041−72.3
J. enoplura25.6 ± 4.80.0557.8 ± 2.20.047−68.6
Propelops sp. a20.2 ± 3.40.0448.2 ± 2.10.050−58.2
Immature oribatids53.5 ± 9.60.11629.9 ± 4.60.184−42.1
Oribatid taxonomic richness also declined in every burned split-plot (p < 0.05 for only in the RNAs, Figure 4a). We used rarefaction analysis with 95 percent confidence intervals to determine whether reductions in mean species richness were attributable to sample size reduction alone. In June 1998 the interpolated species richness in the pooled samples from unburned split-plots (56 species, n = 34,517 specimens) was indistinguishable at 95 percent CI from pooled samples in burned split-plots (51 species, n = 17,103 specimens, with 53 species expected). However, when the June 1998 LSD split-plots were compared independently of the other treatments, interpolation of the samples from unburned units yielded significantly greater numbers of species than the observed richness in the burned split-plots (46 and 37 species respectively, for n = 3656 specimens). Rarefaction likewise provided support for diminished oribatid species richness in the burned split-plots during October 1998 and June 1999. By June 1999 only 30 oribatid species were observed among 6332 specimens in the burned split-plots, with 39 species expected in the unburned splits at that sample size. Observed richness in the unburned treatments was 45 species for 31,699 individuals. The first-order jack-knife estimate of total oribatid species richness (± 95 percent CI) was 83 ± 6 species, which even our prodigious sampling effort did not succeed in fully describing (another noteworthy result). Both observed oribatid species richness and the extrapolated estimated total richness declined throughout the sampling interval in both burned and unburned split-plots (Figure 4B).
Figure 4. (a) Mean oribatid mite assemblage species richness ± SE in burned and unburned split-plots from high structural diversity treatment stands (HSD), low structural diversity treatment stands (LSD), and Research Natural Area reference stands (RNA) during each of the three sampling periods (June 1998, October 1998, and June 1999); (b) First-order jack-knife estimates of total oribatid mite species richness in each of the three stand structures during the three sampling intervals. The light gray shaded region represents the 95 percent confidence interval for the extrapolated estimate of actual species richness in the unburned split-plots, the solid line is the observed species richness from the unburned split-plot samples, the darker gray shaded region is the 95 percent confidence interval for the extrapolated actual species richness in the burned split-plots, and the dotted line is the observed species richness from the burned split-plot samples. Despite the large number of samples and specimens processed, observed species richness falls slightly below the estimated richness 95 percent CI in nearly every instance.
Forests 03 00959 g004
Oribatid assemblage heterogeneity also declined, with the lowest diversity always occurring in the LSD split-plots (Figure 5). The burned RNAs appeared partially buffered against diversity loss immediately after the prescribed burn, responding only moderately or not at all during June 1998 (p = 0.6), responding strongly by October 1998 (p < 0.001) and perhaps showing slight recovery or an early season effect in June 1999 (p = 0.02). Assemblage heterogeneity remained suppressed in burned split-plots from both of the timber removal treatments (LSD and HSD) throughout the sampling period. Comparison of mean species richness decline (Figure 4a) and mean heterogeneity loss (Figure 5) suggested that diminished richness was a major component of diversity decline, but that assemblage evenness/dominance change was also likely.
Figure 5. Mean oribatid mite assemblage heterogeneity (Brillouin index) ± SE in burned and unburned split-plots from high structural diversity treatment stands (HSD), low structural diversity treatment stands (LSD), and Research Natural Area reference stands (RNA) during each of the three sampling periods (June 1998, October 1998, and June 1999).
Forests 03 00959 g005
Mean oribatid assemblage evenness generally increased slightly in the burned split-plots, but this increase was significant only in the burned RNA plot sampled during June 1999 (p = 0.02; Figure 6a). Increased evenness implies decreased dominance, but this was not always observed. Camargo evenness coefficients reflected evenness increase across the whole oribatid assemblage, and when viewed from this perspective, dominance—expressed as the dominance-rank coefficient (Dr)—did tend to decrease within the oribatid assemblage, most strongly in the lower ranks (Figure 6b). The higher ranks were also affected, with the mean log Dr for the top 10 most dominant species decreasing from 0.23 ± 0.05 in the unburned split-plots to 0.16 ± 0.05 in the burned (p = 0.002, Wilcoxon signed rank test; Figure 6c). Furthermore, when assessing assemblage dominance one must distinguish between dominance structure, as indicated by rank-dominance diagrams and metrics such as the proportion of abundance accounted for by the top-ranked taxa, and species rank occupancy within the overall assemblage dominance structure. Rank occupancy change might, in many instances, be a more sensitive indicator of community response to perturbation, especially after sufficient time has passed to allow relatively tolerant taxa to supplant susceptible species in higher ranks.
Figure 6. (a) Mean oribatid mite species assemblage evenness (Camargo index) ± SE, in unburned and burned split-plots from high structural diversity treatment plots, low structural diversity treatment plots, and the RNAs during each of the three sampling periods (June 1998, October 1998, and June 1999); (b) Dominance-rank curves for the pooled burned and unburned split-plots and RNAs. Each point represents the species rank ordered log(Dr) for a specific oribatid taxon; (c) Box and whisker plots for the top 10 ranked taxa in the burned and unburned groups shown in (b) representing the positions of the median log(Dr10), the second and third quartiles of the log(Dr10) distribution, and the full range of observed log(Dr10).
Forests 03 00959 g006
There were numerous instances of dominance rank exchange. In most plots, the dominant oribatid species, both in terms of proportional abundance and dominance rank index Dr, lost rank in the burned units (Figure 7). For example, many oribatid assemblages in the unburned split-plots included O. nova and O. parviaures among the top five ranked species, but both species were always demoted after prescribed fire. Such dominance exchanges were usually long-lasting, i.e., they had not yet returned to the rank occupancies typical of unburned units by June 1999. Oppia parviaures was the top-ranked species in unburned split-plots from all three treatments in June 1998, but lost dominance rank in the burned HSD and LSD units. In the burned RNA plot it remained the most dominant species, but the top rank was occupied by the previously third-ranked immatures. In October, when organic litter was drier, O. parviaures was the most abundant species in the unburned HSD split-plots, but was absent from the top five ranks in the burned splits. This seasonal effect on oribatid organization was reflected in the assemblage heterogeneity results as well. During the moister, early-season June 1999 sampling, O. parviaures was again the most dominant oribatid species in the unburned RNA, but was displaced by A. acarinus in the burned plot. Oppia parviaures was the third most dominant species in the unburned HSD split-plots (in the fourth rank) but had dropped below the top five ranks in the burned split-plots. Dominance of O. nova declined similarly in all burned split-plots. On the other hand, A. acarinus and immature oribatids more frequently occupied higher ranks in burned units than in unburned units.
Figure 7. (a–c) Dominance rank coefficients (Dr) for the top five ranked oribatid species (and immature oribatids in some instances) in assemblages from each forest structural condition during each sample interval. Refer to Table 1 for an explanation of the species codes.
Forests 03 00959 g007
When we summarized assemblage dominance as the mean proportion of assemblage abundance accounted for by the five top ranked species, dominance increased slightly in the burned LSD split-plots during June 1998 (from 0.85 ± 0.01 to 0.91 ± 0.03, p < 0.001; Wilcoxon signed rank test). Proportional dominance change in the top five ranks was greatest in October 1998, when all three treatments experienced increased dominance of the five most abundant species in the burned split-plots. In the RNA, proportional dominance increased from 0.86 ± 0.02 to 0.92 ± 0.05 (p < 0.001; Wilcoxon signed rank test). In the HSD split-plots it increased from 0.87 ± 0.01 to 0.95 ± 0.03 (p < 0.001; Wilcoxon signed rank test), and in the LSD split-plots it increased from 0.88 ± 0.04 to 0.90 ± 0.04 (p < 0.001; Wilcoxon signed rank test). Only the HSD split-plots exhibited change in the mean proportional dominance of the top five ranks in June 1999, increasing slightly from 0.90 ± 0.01 to 0.93 ± 0.04 (p < 0.001; Wilcoxon signed rank test).
Oribatid assemblage classification with Morisita similarity coefficients (CH) revealed that the burned HSD and LSD split-plots were most similar to one another (CH = 0.95, Figure 8). These clustered (CH = 0.847) with the burned RNA plot and the unburned LSD split-plots (CH = 0.903). The unburned HSD split-plots and RNA clustered together (CH = 0.875). This latter cluster was distinct from the cluster containing the burned units and the unburned LSD split-plots (CH = 0.744).
These results reinforced our earlier conclusion that prescribed fire profoundly altered mite assemblage structure at BMEF [6]. The mite assemblage changes that we saw in June 1998 were relatively long-lasting, and there was little evidence of recovery by June 1999, twenty months after the fire. Indeed, our data suggested that oribatid abundance, species richness, and assemblage heterogeneity continued to decline in the burned units. Prostigmatid mite abundance continued to increase in both the burned and unburned plots, but was nonetheless substantially diminished in the burned plots.
Figure 8. Dendrogram of Morisita similarity coefficients (CH) for pooled oribatid species assemblages from all three sampling intervals.
Forests 03 00959 g008
Significant decline in oribatid mite abundance was initially most apparent in the LSD treatments in June 1998 and October 1998, suggesting that removal of old-growth forest characteristics predisposed soil microarthropod communities to decline when challenged by further disturbance. Oribatid species richness and assemblage heterogeneity similarly declined first in the burned LSD split-plots. The tree removal treatments themselves apparently had only minor effects upon oribatid community organization however, since most assemblage attributes varied little between treatments in the unburned split-plots (Figure 4, Figure 5, Figure 6). The slight decline in total oribatid abundance from June 1998 to June 1999 was likely attributable to disproportionate decline in the burned split-plots and perhaps to reduced precipitation overall (regional precipitation was considerably higher during April-June 1998 than during the corresponding months of 1999).
Tree removal and stand structure alteration were synergistic with low intensity fire. Although we had no direct data regarding physical conditions within the treated stands, it was likely that structural modifications facilitated sun and wind penetration, altered litter and woody debris input to the forest floor, and increased the susceptibility of mite assemblages to other disturbance. This effect was most pronounced in the LSD plots where forest structure was most severely simplified. Thus it appeared that forest structural complexity at least partially ameliorated forest floor microarthropod response to low intensity fire and perhaps to other disturbance as well. This assumption was bolstered by the similarity classification, which suggested that structural reduction achieved disturbance effects qualitatively similar to those produced by low intensity fire. The unburned LSD split-plot assemblages were most similar to the burned RNA communities, possibly because structural complexity in the reference stand buffered fire effects to an extent commensurate with the unburned LSD split-plot. To the extent that protection was available, the greatest protection from low intensity fire disturbance was retention of stand structure to ameliorate the effects of post-fire habitat alteration.
Nonetheless, by June 1999 oribatid assemblages in the burned subunits from all three forest structural treatments were profoundly affected. Oribatid abundance, species richness, and community heterogeneity all diminished, excepting heterogeneity in the RNA plots during June 1999. However, it was unclear whether that last result was an early sign of oribatid recovery, even in the relatively less disturbed RNA plot, because both oribatid species richness and abundance remained significantly lower than in the unburned RNA, and assemblage dominance relationships remained altered as well.

4. Conclusions.

Although mite assemblages contribute to ecosystem functions in forest soils, disruption of community organization is not necessarily a reliable indicator of functional disruption. Mite communities are understood to be important in detritus processing and regulation of microbial decomposers, but they likely have a great deal of functional redundancy [42]. Undoubtedly that redundancy protects forest soils from loss of function, but at present we have little fine-grained information about the ecological roles individual mite species fulfill, about thresholds for ecosystem disruption at the mite assemblage level, or about the contributions of taxon-specific resiliency within mite communities. Nonetheless, we found significant taxonomic diversity within an assemblage (the oribatids) in which most member taxa share considerable functional similarity, at least superficially [6]. Having established that prescribed fire unambiguously alters the trajectories of mite assemblages, we believe the possibility—and the mechanisms—of ecological consequences should be pursued. Our study necessarily compared fire treatments with controls that have experienced a century of fire exclusion, which is a highly artificial kind of control. It would be interesting to compare responses to prescribed fire treatments with natural fire regimes, where fire is also a primary (and rapid) decomposer of litter. Such comparisons are extremely difficult because of widespread fire exclusion, but they will be facilitated as fire/fire surrogate studies yield further information about responses over much longer timeframes [43]. In addition, comparisons with mite communities in places that have continued to experience functional fire regimes, such as the Sierra San Pedro Mártir, Baja California, Mexico, should be made, since they are reported to have much more heterogeneous coarse woody debris and canopy characteristics [44].
Although microarthropod responses to fire are undoubtedly proportional to fire intensity and the degree to which forest soil and litter habitats are modified by burning [45], we found significant oribatid community response even to low-intensity fire well below stand damage thresholds. Litter was only partially consumed in the burned split-plots and fire coverage was patchy, producing a mosaic ranging from areas untouched by fire to areas where litter thickness was significantly reduced. Oribatid assemblages in adjacent unburned plots were unaffected however, suggesting that at larger scales, fire patchiness might facilitate recovery of soil mites by maintaining local assemblages in unburned refugia. Heterogeneity of fire intensity and coverage, particularly with extensive patches of unburned forest floor, thus seems a desirable objective when using prescribed fire.
Broadly speaking, oribatid populations recruit quite slowly, which makes them useful as bioindicators of forest soil disturbance because they cannot recover too quickly for detection by periodic monitoring. We therefore anticipated that oribatid abundance might decline in June 1998 because of direct mortality in the burned split-plots. The most striking assemblage-level effects of low-intensity fire were delayed, however, manifesting themselves most strongly the following October and in June 1999. This outcome suggested that although direct, heat-induced mortality undoubtedly occurred, the indirect effects of prescribed fire ultimately appear to have influenced oribatid assemblage structure to a greater extent, unless the continued decline simply reflects the loss of immature stages of oribatids that have failed to recruit in the time since the burns. Habitat alteration, changing resource availability and quality, and modified interspecific relationships were all possible indirect mechanisms of mite assemblage responses. Examples of the latter included the numerous consistent dominance rank exchanges that we observed, such as the frequent demotion of O. parviaures and O. nova in burned split-plots, and concomitant rank promotions of A. acarinus and other apparently tolerant species. Dominance rank exchanges might have altered interspecific interactions, such as exploitative competition among species with similar resource requirements, if demoted species suffered reduced access to resources commandeered by promoted species. In the October samples, indirect habitat effects might have exacerbated seasonal variation in habitat quality.
Unfortunately, most such dominance rank exchanges were complex and not easily understood. At the very least, they were likely confounded by seasonal variation in environmental conditions and oribatid phenologies, and perhaps were also affected by tree removal treatments to a greater extent than other attributes of oribatid assemblage structure. For example, A. acarinus occurred within the top three ranks in all but the unburned HSD split-plots in October 1998, and although it usually ranked higher in the burned split-plots than in the unburned, its ubiquitous occurrence probably reflected tolerance for xeric conditions. Burned split-plots were probably drier, on average, than unburned split-plots [6], especially in the relatively more open LSD units, and dry conditions certainly prevailed during October 1998, near the end of the dry summer season.
Both classification analysis of community similarity coefficients and ordination supported our conclusion that prescribed fire was a strong influence upon oribatid community organization. The first NMS axis was correlated with fire intensity surrogates, e.g. litter thickness and surface scorching, and the distribution of sample transects in species space responded strongly to fire. In the classification analysis, oribatid assemblages from the six treatments separated into two primary similarity clusters in response to prescribed fire. The sole exception was the LSD unburned split-plots, suggesting that although oribatid organization might not have differed significantly in the unburned split-plots, the LSD structural modifications alone affected oribatid community composition similarly to prescribed fire. Both the LSD structural prescriptions and low intensity fire likely caused greater exposure of litter habitats, e.g., by removal of canopy structure and heterogeneity in the first instance, or by partial consumption of low vegetation and the superficial layer of litter and debris following prescribed fire. Both treatments probably reduced litter input to the forest floor and altered litter quality, either directly through burning of recent litter contributions or indirectly by tree removal. Sun, wind, and heat exposure might also have affected other aspects of forest floor habitat and resource quality in the unburned LSD split-plots and in the burned split-plots, e.g., by alteration of fungal and microbial communities.
Our analyses of mite assemblages from BMEF during October 1998 and June 1999 confirmed that the profound alterations of assemblage structure we saw in June 1998 were early components of a more persistent response to the prescribed fire treatment in October 1997. Several aspects of that trajectory were still underway twenty months later, with little evidence for recovery of the previous mite communities. While oribatid mite assemblages in the unburned units remained relatively stable, oribatid community abundance, species composition, and assemblage organization were significantly altered in the burned units, typically by diminished population size and assemblage complexity.
The long-term negative consequences that we found for oribatid communities in the Cascade Range of California are consonant with similar results from recent work in other forest ecosystems, including a European pine/spruce forest [46] and South Korean pine ecosystems [47,48]. Prostigmatid mites, on the other hand, recruited rapidly in both the unburned and the burned units in our study, although once again with significantly depressed populations in the burned units after prescribed fire. The patchiness of the stands and of the burn itself may have contributed to the rapid recruitment of prostigmatid mites, as such heterogeneity can moderate microclimatic conditions on the forest floor [49]. The evidence in the published literature regarding the effects of habitat and fire intensity patchiness on oribatid survival is not entirely consistent, however. Oribatids were shown to have greater tolerance for elevated temperatures than other microarthropods in a laboratory study [50], yet in field studies they have been shown to suffer higher burn-related mortality [51] as well as long term perturbations even four or five years following prescribed fire or simulated drought [52,53]. The functional consequences of these disruptions are hard to predict, but the ecosystem contributions of mite assemblages in forest soils are important enough to warrant further investigation. Future investigations should also attempt to incorporate assessments of sites with a functional fire regime, since neither infrequent stand-replacing fires nor prescribed fire adequately models the effect of frequent low-intensity fires on key habitat characteristics.

Appendix

Appendix A: Expanded description of Methods

A1. Study Site

This research was conducted as one component of an interdisciplinary management study that examined the effects of different silviculture prescriptions and low intensity fire. Study plots were established at Blacks Mountain Experimental Forest (BMEF), Lassen National Forest, near Redding, CA (elevation 1700–2100 m). The climate was typical of the southern Cascade Range with short, dry summers and cold, moderately wet winters. Most precipitation at BMEF falls as snow, with mean annual precipitation of 46.2 cm measured from 1935–1953 [54]. Soils in the study plots were primarily shallow stony loams over bedrock lava. Forests were dominated by Pinus ponderosa with some P. jeffreyi, especially at lower elevations, and had increasing numbers of white fir (Abies concolor) and incense-cedar (Libocedrus [=Calocedrus] decurrens) at higher elevations (Society of American Foresters forest cover type 231, [27]). This forest type occurs widely in the montane western U.S., from central Mexico to southern British Columbia [27,55]. Most old growth forest was removed from the study plots during the 1930s and 1940s, but remnants remained in four Research Natural Areas (RNAs) [24]. The RNAs were undisturbed late successional stands that experienced fire exclusion as one component of management until 1997. The depths of litter deposited on the forest floor ranged from zero, i.e., bare mineral soil without litter accumulation, to an average of 8 cm [56], but were highly variable depending upon silvicultural treatment intensity due to stand manipulations, and canopy and understory plant composition. Forest floor litter is a heterogeneous environment for soil organisms, with clear resource partitioning by soil fauna [57], and ordinarily that heterogeneity should be accounted for in sampling. We lacked sufficient resources to stratify and sample the different layers independently, but the litter layers at our sample sites, which were under the drip-line of trees of a standard size, were shallow enough (and consistently so) that litter heterogeneity did not likely confound our results. Furthermore, we measured litter depth and incorporated it into our analysis. Recently harvested plots showed some evidence of mixing the O horizon with underlying mineral soil.

A2. Treatments

We used a split-plot design with twelve treatment plots of at least 100 ha each and four roughly 50 ha RNA reference plots for the multidisciplinary study that this report contributes to (Table A). Treatment plots were aggregated into three blocks containing four plots each. Two plots in each block were selectively logged to reduce stand density while retaining high structural diversity (HSD) characteristics of old growth stands, such as multiple canopy layers, an abundance of large snags, many large old trees, and many small canopy gaps and forest floor openings. The other two plots in each block were selectively logged to minimize old growth characteristics, creating low structural diversity (LSD) stands of intermediate age with single-layered, evenly spaced, continuous canopy retaining few snags. One half of each treatment plot (i.e., each split-plot) was subjected during the following autumn to low intensity fire. The RNAs were not logged, but two were burned using similar fire prescriptions.
In summary, the complete study design incorporated six unburned HSD split-plots, six burned HSD split-plots, six unburned LSD split-plots, six burned LSD split-plots, two unburned RNA plots, and two burned RNA plots (Table A). All treatments were randomly assigned except the RNAs, which were constrained by the management history of BMEF. The RNAs served as undisturbed reference stands rather than true controls since they could not be randomly assigned. Harvesting per se was not intended to be a uniform process, but was designed to create uniform residual stands, so harvest methods, timing, and order of operations were not necessarily uniform. Burned split-plots were treated with low intensity fire one year after harvest and arthropod sampling began after snowmelt eight months later.
The logistics of applying the full treatment regime prevented completing all treatments in a single year, so treatments were distributed across multiple blocks. The first block comprising four treatment plots was selectively harvested in 1996, and its split-plots and one RNA plot were burned in 1997. A second RNA plot was left unburned to serve as an untreated reference. The data described herein were obtained from that first treatment block.
Table A. A summary of the complete treatment history for this interdisciplinary study at Blacks Mountain Experimental Forest. Treatment plots were numbered and RNAs were assigned letters. Plots whose samples provided the data included in this report are shaded.
BlockPlotStructureHarvest yearFire year
138HSD19961997
39LSD19961997
41HSD19961997
43LSD19961997
242HSD19971999
44LSD19971999
47HSD19971999
45LSD19971999
348HSD19982000
40LSD19982000
49HSD19982000
46LSD19982000
NARNA AOld growthNot harvestedNot burned
RNA BOld growthNot harvested1999
RNA COld growthNot harvested1997
RNA DOld growthNot harvestedNot burned

A3. Soil Arthropod Sampling

One hectare study plots were randomly delineated within each treatment split-plot and RNA. Five ponderosa pines in size class 25–36 cm DBH were randomly chosen within each of the resulting 28 study plots. A permanent 8.0 m east-west transect was centered upon each tree, and four litter samples were collected at 1.0 m intervals, beginning at the base of each tree and continuing to the approximate east and west tree crown drip lines. We used tree-centered transects because soil fauna tend to be clustered in the litter layers above tree roots where nutrients are most abundant [58]. East and west transect samples were pooled for each tree so that four composite samples were obtained for each transect on each sampling date.
Samples included all loose soil and litter down to hard mineral soil, enclosed by a 30.5 cm cylinder. Early samples included cores of mineral soil as well, but we abandoned that effort when repeated samples yielded few arthropod specimens. Litter thickness was measured and all loose material within the sampling cylinder was collected and sieved through 0.64 cm mesh to remove coarse debris. A visual presence/absence assessment of litter incineration was recorded for each sample. Sieved samples were stored over ice for up to three days, and then transported to Placerville, CA for Berlese/Tullgren extraction of arthropods into 70 percent ethanol. Acari were sorted to suborder, and Oribatei were determined to the lowest practical taxon, usually to species or morphospecies, in the entomology laboratory at Humboldt State University in Arcata, CA. Voucher specimens were placed into the Museum of Natural History at the University of Georgia by K. L. Lamoncha.
Litter and arthropod samples were obtained during June, August, and October 1998 and 1999; the August samples were taken along parallel transects immediately north of the June sample transect, and October samples to the south, so that no sample quadrats overlapped.

A4. Data Analysis

Mean sample abundance of acarine suborders from burned and unburned split-plots was compared within and among stand structure treatments and with the RNA reference plots. Similar comparisons were performed for each individual oribatid taxon we sampled to assess the significance of prescribed fire effects on individual populations. Mixed models were used to account for fixed and random effects using either General Linear Models for continuous responses or over-dispersed Poisson Generalized Linear Models [28] for counts. The minimum Akaike Information Criterion (AIC) was used to select appropriate models from each set of candidates. The GLM for each modeled response was:
Forests 03 00959 i001
where the best predictors were usually treatments (stand structural diversity and fire status), litter thickness, and fire status × litter thickness; ε was the random effect due to plot (u = {1, 2, 3, 4}); γ was the random effect attributable to subplots nested within each plot, i.e., split-plots (s = {1, 2}); δ was the random effect from transects nested within split-plots (t = {1, 2,…,25}); and λr was the residual error (r = {1, 2, 3, 4}; pooled composites per transect). All random effects and residual errors were assumed to be independent and normally distributed.
The expected specimen count response for each treatment unit was an over-dispersed Poisson model:
Forests 03 00959 i002
using the same predictors as Equation 1 and defining the random effects ε, γ, and δ as above. The corresponding models for the RNAs were:
Forests 03 00959 i003
Forests 03 00959 i004
respectively. Mixed effects regressions were fit using the lme (Linear Mixed-Effects Models) and glmmPQL (Generalized Linear Mixed-Effects Models) statistical computing functions in [29,30,31]. Mixed effects GLM was also used to examine relationships between oribatid species abundance and litter thickness, and between litter thickness and fire coverage/penetration within each burned treatment stand.
Mean species richness of oribatid mites was compared for each treatment plot with and without low intensity fire. Taxonomic richness was compared among split-plots using over-dispersed Poisson GLMs as reported above. We used rarefaction to determine whether observed differences in species richness were attributable to differing sample sizes. Oribatid assemblage heterogeneity was assessed using Brillouin indices [32,33]. Oribatid assemblage dominance and evenness were assessed both directly, i.e., by nonparametric comparisons of the mean proportions of oribatid abundance accounted for by the five most numerically dominant taxa, and by linear mixed effects models using Camargo’s evenness index as the response, which is relatively unaffected by taxonomic rarity [36]. We used Kruskal–Wallis rank sum tests and pair-wise Wilcoxon rank sum tests with Bonferonni multi-test corrections for non-parametric comparisons.
We used species-area curves, first order jackknife estimates of total species richness [35], and abundance-based coverage estimates (ACE) [59] of total richness to evaluate sampling sufficiency and to estimate the number of oribatid taxa in each sampled assemblage. Both species-area curves and ACE estimates were based upon 500 random subsamples from the oribatid abundance data at each possible subsample size. ACE estimates were generated with EstimateS [59]. Average linkage cluster analysis with Morisita similarity coefficients were used to classify oribatid assemblage similarities between and within silvicultural and fire treatments [33].
We also looked for changes in assemblage dominance rank structure, assessing differences in assemblage rank proportion and species rank occupancy using multiple sample dominance-rank coefficients for each taxon, which integrate species dominance across multiple samples without taxon rank inflation when a few samples have atypically high population abundance:
Forests 03 00959 i005
where Dr is the dominance-rank index, R is the maximum rank attainable (i.e., the total number of taxa in the samples), S is the number of samples, and sr is the number of samples in which each species had rank r. The coefficient varies from 0 to 1, with Dr = 1 the expected outcome for a species top ranked in every sample, and Dr = 0 is the theoretical coefficient for species absent from all samples.
Ecological gradients and sample relationships in species space were ordinated using nonmetric multi-dimensional scaling (NMS) of oribatid abundance, with Sorensen (Bray–Curtis) ecological distances and with species scores obtained by weighted averaging [60]. Principle components rotation was used to align the most prominent ecological gradients with the first ordination axis in order to facilitate interpretation of the ordination diagrams. Multivariate indicator species analysis [37] was used to detect taxonomic structure in the pre- and post-burn split-plots, with 10,000 randomized Monte Carlo trials of the indicator species analyses for assessing the probabilities of Type I errors when comparing indicator values (IV) for each oribatid taxon. Multiple response permutation procedures (MRPP) with rank transformed Sorensen distances [38] were used to evaluate within group assemblage heterogeneity and to relate observed assemblages to fire coverage/penetration within each burned split-plot [39,61].

Acknowledgments

We thank R.A. Norton (Syracuse University of New York, NY, USA), who assisted with taxonomic determinations; S.R. Mori (USDA Forest Service, Berkley, CA, USA) who provided statistical guidance and review; C.R. Carvalho and D.R. Welty (USDA Forest Service, Placerville, CA, USA) who extracted, curated, and sorted hundreds of thousands of microarthropods from litter samples; W.W. Oliver and G.O. Fiddler, who designed and supervised silvicultural treatments; and P. Weatherspoon, who supervised prescribed fire treatments. A. Moldenke (Oregon State University, Corvallis, OR, USA), Christopher J. Fettig (USDA Forest Service, PSW Research Station, Davis, CA, USA), and D. Coleman and D. Crossley (University of Georgia, Athen, GA, USA) provided helpful statistical and technical reviews of an earlier draft. The authors especially acknowledge the invaluable assistance of Sylvia R. Mori, USDA Forest Service, PSW Research Station, who participated in the research design and provided the GLMs We gratefully acknowledge funding from the United States Department of Interior, Bureau of Land Management, and USDA Forest Service Regions 5 and 6 in support of the Northwest Forest Plan.

Conflict of Interest

The authors declare no conflict of interest.

References

  1. Anderson, J.M. The Organization of soil animal communities. Ecol. Bull. 1977, 25, 15–23. [Google Scholar]
  2. Behan-Pelletier, V.M.; Bissett, B. Oribatida of Canadian peatlands. Mem. Entomol. Soc. Can. 1994, 169, 73–88. [Google Scholar] [CrossRef]
  3. Hansen, R.A.; Coleman, D.C. Litter complexity and composition are determinants of the diversity and species composition of oribatid mites (Acari: Oribatida) in litterbags. Appl. Soil Ecol. 1998, 9, 17–23. [Google Scholar] [CrossRef]
  4. Lamoncha, K.L.; Crossley, D.A., Jr. Oribatid mite diversity along an elevation gradient in a southeastern Appalachian forest. Pedobiologia 1998, 42, 43–55. [Google Scholar]
  5. Crossley, D.A., Jr.; Hansen, R.A.; Lamoncha, K.L. Response of forest floor microarthropods to a forest regeneration burn at Wine Spring watershed (Southern Appalachians). In Proceedings of First Biennial North American Forest Ecology Workshop, Raleigh, NC, USA; 1999. [Google Scholar]
  6. Camann, M.A.; Gillette, N.E.; Lamoncha, K.L.; Mori, S.R. Response of forest soil Acari to prescribed fire following stand structure manipulation in the Southern Cascade range. Can. J. For. Res. 2008, 38, 956–968. [Google Scholar] [CrossRef]
  7. Crossley, D.A., Jr. Oribatid mites and nutrient cycling. In Proceedings of Symposium on the Oribatei—Eastern Branch Meeting of the Entomological Society of America, Philadelphia, PA, USA, 2 October 1975; Syracuse State University: New York, NY, USA, 1977; pp. 71–85. [Google Scholar]
  8. Mitchell, M.J. Energetics of oribatid mites (Acari: Cryptostigmata) in an aspen woodland soil. Pedobiologia 1979, 19, 89–98. [Google Scholar]
  9. Swift, M.J.; Heal, O.W.; Anderson, J.M. Decomposition in Terrestrial Ecosystems; University of California Press: Berkeley, CA, USA, 1979. [Google Scholar]
  10. Seastedt, T.R. The role of microarthropods in decomposition and mineralization processes. Annu. Rev. Entomol. 1984, 29, 25–46. [Google Scholar] [CrossRef]
  11. Harding, D.J.L. Faunal participation in the breakdown of cellophane inserts in the forest floor. In Progress in Soil Biology; North-Holland Publisher Co.: Amsterdam, The Netherlands, 1967; pp. 162–170. [Google Scholar]
  12. Wall, D.H.; Bradford, M.A.; St. John, M.G.; Trofymow, J.A.; Behan-Pelletier, V.; Bignell, D.E.; Dangerfield, J.M.; Parton, W.J.; Josef Rusek, J.; Voigt, W.; et al. Global decomposition experiment shows soil animal impacts on decomposition are climate-dependent. Glob. Chang. Biol. 2008, 14, 2661–2677. [Google Scholar]
  13. Knoepp, J.D.; Swank, W.T. Site preparation burning to improve southern Appalachian pine-hardwood stands: Nitrogen responses in soil, soil water, and streams. Can. J. For. Res. 1993, 23, 2263–2270. [Google Scholar] [CrossRef]
  14. Dress, W.J.; Boerner, R.E.J. Patterns of microarthropod abundance in oak-hickory forest ecosystems in relation to prescribed fire and landscape position. Pedobiologia 2004, 48, 1–8. [Google Scholar] [CrossRef]
  15. Knapp, E.E.; Keeley, J.E.; Ballenger, E.A.; Brennan, T.J. Fuel reduction and coarse woody debris dynamics with early season and late season prescribed fire in a Sierra Nevada mixed conifer forest. For. Ecol. Manag. 2005, 208, 383–397. [Google Scholar] [CrossRef]
  16. Abbott, D.T.; Seastedt, T.R.; Crossley, D.A., Jr. Abundance, distribution, and effects of clearcutting on Cryptostigmata in thesouthern Appalachians. Environ. Entomol. 1980, 9, 618–623. [Google Scholar]
  17. Seastedt, T.R.; Crossley, D.A., Jr. Microarthropod response following cable logging and clear-cutting in the southern Appalachians. Ecology 1981, 62, 126–135. [Google Scholar] [CrossRef]
  18. Blair, J.M.; Crossley, D.A., Jr. Litter decomposition, nitrogen dynamics, and litter microarthropods in a southern Appalachian hardwood forest 8 years following clearcutting. J. Appl. Ecol. 1988, 25, 683–698. [Google Scholar] [CrossRef]
  19. Sgardelis, S.P.; Margaris, N.S. Effects of fire on soil microarthropods of a phryganic ecosystem. Pedobiologia 1993, 37, 83–94. [Google Scholar]
  20. Paquin, P.; Coderre, D. Deforestation and fire impact on edaphic insect larvae and other macroarthropods. Environ. Entomol. 1997, 26, 21–30. [Google Scholar]
  21. Agee, J.K. Fire Ecology of Pacific Northwestern Forests; Island Press: Washington, DC, USA, 1993. [Google Scholar]
  22. Arno, S.F.; Fiedler, C.E. Mimicking Nature’s Fire: Restoring Fire-Prone Forests in the West; Island Press: Washington, DC, USA, 2005. [Google Scholar]
  23. Skinner, C.N.; Taylor, A.H. Southern Cascades bioregion. In Fire in California’s Ecosystems; Sugihara, N.G., van Wagtendonk, J.W., Fites-Kaufman, J., Shaffer, K.E., Those, A.E., Eds.; University of California Press: Berkeley, CA, USA, 2006; pp. 195–224. [Google Scholar]
  24. Oliver, W.W. Ecological Research at Blacks Mountain Experimental Forest in Northeastern California; USDA Forest Service General Technical Report PSW-GTR-179; USDA Forest Service Pacific Southwest Research Station: Berkeley, CA, USA, 2000. [Google Scholar]
  25. Peck, R.W.; Niwa, C.G. Longer-term effects of selective thinning on microarthropod communities in a late-successional coniferous forest. Environ. Entomol. 2005, 34, 646–655. [Google Scholar] [CrossRef]
  26. Oliver, W.W.; Powers, R.F. Blacks Mountain, California: Interdisciplinary field research in ponderosa pine. J. For. 1998, 96, 4–9. [Google Scholar]
  27. Barrett, J.W.; McDonald, P.M.; Ronco, F., Jr.; Ryker, R.A. Interior ponderosa pine. In Forest Cover Types of the United States and Canada; Eyre, F.H., Ed.; Society of American Foresters: Washington, DC, USA, 1980; pp. 114–115. [Google Scholar]
  28. McCulloch, C.E.; Searle, S.R. Generalized, Linear, and Mixed Models; John Wiley & Sons, Inc.: New York, NY, USA, 2001. [Google Scholar]
  29. The R Development Core Team. Available online: http://www.r-project.org/ (accessed on 17 October 2012).
  30. Ihaka, R.; Gentleman, R. R: A Language for data analysis and graphics. J. Comp. Graph. Stat. 1996, 5, 299–314. [Google Scholar]
  31. Venables, W.N.; Ripley, B.D. Modern Applied Statistics with S; Springer-Verlag: New York, NY, USA, 2002. [Google Scholar]
  32. Magurran, A.E. Ecological Diversity and Its Measurement; Princeton University Press: Princeton, NJ, USA, 1988. [Google Scholar]
  33. Krebs, C.J. Ecological Methodology, 2nd ed; Benjamin/Cummings: Menlo Park, CA, USA, 1999. [Google Scholar]
  34. Gotelli, N.J.; Colwell, R.K. Quantifying biodiversity: Procedures and pitfalls in the measurement and comparison of species richness. Ecol. Lett. 2001, 4, 397–391. [Google Scholar] [CrossRef]
  35. Palmer, M.W. The estimation of species richness by extrapolation. Ecology 1990, 71, 1195–1199. [Google Scholar] [CrossRef]
  36. Camargo, J.A. On measuring species evenness and other associated parameters of community structure. Oikos 1995, 74, 538–542. [Google Scholar] [CrossRef]
  37. Dufrêne, M.; Legendre, P. Species assemblages and indicator species: The need for a flexible asymmetrical approach. Ecol. Monogr. 1997, 67, 345–366. [Google Scholar]
  38. Zimmerman, G.M.; Goetz, H.; Mielke, P.W. Use of an improved statistical method for group comparisons to study effects of prairie fire. Ecology 1985, 66, 606–611. [Google Scholar] [CrossRef]
  39. McCune, B.; Mefford, M.J. Multivariate Analysis of Ecological Data, version 4.0; MjM Software: Gleneden Beach, OR, USA, 1999. [Google Scholar]
  40. Oksanen, J.; Kindt, R.; O’Hara, B. Community Ecology Package, version 1.6-9. Available online: http://www.r-project.org. (accessed on 17 October 2012).
  41. Venables, W.N.; Ripley, B.D. Package MASS. Available online: http://www.r-project.org. (accessed on 17 October 2012).
  42. Cole, L.; Bradford, M.A.; Shaw, P.J.A.; Bardgett, R.D. The abundance, richness and functional role of soil meso- and macrofauna in temperate grassland—A case study. Appl. Soil Ecol. 2006, 33, 186–198. [Google Scholar]
  43. Apigian, K.O.; Dahlsten, D.L.; Stephens, S.L. Fire and fire surrogate treatment effects on leaf litter arthropods in a western Sierra Nevada mixed-conifer forest. For. Ecol. Manag. 2006, 221, 110–122. [Google Scholar] [CrossRef]
  44. Stephens, S.L.; Fry, D.L.; Franco-Vizcaino, E.; Collins, B.M.; Moghaddas, J.M. Coarse woody debris and canopy cover in an old-growth Jeffrey pine-mixed conifer forest from the Sierra San Pedro Mártir, Mexico. For. Ecol. Manag. 2007, 240, 87–95. [Google Scholar] [CrossRef]
  45. Ferrenberg, S.M.; Schwilk, D.W.; Knapp, E.E.; Groth, E.; Keeley, J.E. Fire decreases arthropod abundance but increases diversity: Early and late season prescribed fire effects in a Sierra Nevada mixed-conifer forest. Fire Ecol. 2006, 2, 79–102. [Google Scholar] [CrossRef]
  46. Malmström, A.; Persson, T.; Ahlström, K.; Gongalsky, K.B.; Bengtsson, J. Dynamics of soil meso- and macrofauna during a 5-year period after clear-cut burning in a boreal forest. Appl. Soil Ecol. 2009, 43, 61–74. [Google Scholar] [CrossRef]
  47. Kim, J.W.; Jung, C. Abundance of soil microarthropods associated with forest fire severity in Samcheok, Korea. J. Asia-Pac. Entomol. 2008, 11, 77–81. [Google Scholar]
  48. Jung, C.; Kim, J.W.; Marquardt, T.; Kaczmarek, S. Species richness of soil gamasid mites (Acari: Mesostigmata) in fire-damaged mountain sites. J. Asia-Pac. Entomol. 2010, 13, 233–237. [Google Scholar]
  49. Marra, J.L.; Edmonds, R.L. Soil arthropod responses to different patch types in a mixed-conifer forest of the Sierra Nevada. For. Sci. 2005, 51, 255–265. [Google Scholar]
  50. Malmström, A. Temperature tolerance in soil microarthropods: Simulation of forest-fire heating in the laboratory. Pedobiologia 2008, 51, 419–426. [Google Scholar]
  51. Gongalsky, K.B.; Malmström, A.; Zaitsev, A.S.; Shakhab, S.V.; Bengtsson, J.; Persson, T. Do burned areas recover from inside? An experiment with soil fauna in a heterogeneous landscape. Appl. Soil Ecol. 2012, 59, 73–86. [Google Scholar] [CrossRef]
  52. Lindberg, N.; Bengtsson, J. Population responses of oribatid mites and collembolans after drought. Appl. Soil Ecol. 2005, 28, 163–175. [Google Scholar] [CrossRef]
  53. Berch, S.M.; Battigelli, J.P.; Hope, G.D. Responses of soil mesofauna communities and oribatid mite species to stie preparation treatments in high-elevation cutblocks in southern British Columbia. Pedobiologia 2007, 51, 23–32. [Google Scholar] [CrossRef]
  54. Hallin, W.E. The Application of Unit-Area Control in the Management of Ponderosa-Jeffrey Pine at Blacks Mountain Experimental Forest; USDA Technical Bulletin 1191; USDA: Washington, DC, USA, 1959. [Google Scholar]
  55. Oliver, W.W.; Ryker, R.A. Pinus ponderosa Dougl. ex Laws. In Silvics of North America, Volume 1, Conifers; Agricultural Handbook 654; Burns, R.M., Honkala, B.H., Eds.; USDA Forest Service: Washington, DC, USA, 1990; pp. 413–424. [Google Scholar]
  56. Alexander, E.B. Ecological Unit Inventory, Blacks Mountain Experimental Forest; Report on file at Redding Silviculture Laboratory; Pacific SW Research Station, USDA Forest Service: Redding, CA, USA, 1993. [Google Scholar]
  57. Anderson, J.M. Inter- and intra-habitat relationships between woodland Cryptostigmata species diversity and the diversity of soil and litter microhabitats. Oecologia 1978, 32, 341–348. [Google Scholar] [CrossRef]
  58. Walter, D.W.; Proctor, H.C. Mites: Ecology, Evolution, and Behavior; University of New South Wales Press: Sydney, Australia, 2004. [Google Scholar]
  59. Colwell, R.K. EstimateS, version 7.5; Statistical Estimation of Species Richness and Shared Species from Samples; University of Connecticut: Storrs, CT, USA. Available online: http://purl.oclc.org/estimates (accessed on 17 October 2012).
  60. Minchin, P.R. An evaluation of relative robustness of techniques for ecological ordinations. Vegetatio 1987, 71, 145–156. [Google Scholar]
  61. McCune, B.; Grace, J.B. Analysis of Ecological Communities; MjM Software: Gleneden Beach, OR, USA, 2002. [Google Scholar]

