Long-Term Survival of Saplings during the Transformation to Continuous Cover

1
Forest Research, Alice Holt Lodge, Farnham, Surrey, GU10 4LH, England, UK
2
School of GeoSciences (IERM), Edinburgh University, Crew Building, West Mains Road, Edinburgh, Scotland EH9 3JU, Scotland, UK
*
Author to whom correspondence should be addressed.
Forests 2012, 3(3), 787-798; https://doi.org/10.3390/f3030787
Submission received: 27 June 2012
/
Revised: 22 August 2012
/
Accepted: 23 August 2012
/
Published: 7 September 2012
Abstract
:The Glentress Trial Area is an extensive research area in southern Scotland of 117 ha where a long-term trial of the transformation of even-aged plantations to continuous cover has been in progress since 1952. During the assessment of permanent sample plots in 1990 information on the species and spatial position of saplings (trees taller than 1.3 m with a diameter at breast height of <7 cm) was recorded. This provided a unique opportunity to investigate the long-term survival of saplings during the transformation process when the Trial Area was reassessed in 2009. The main finding was that 37% of saplings survived the 19-year period and the majority developed into trees (≥7 cm diameter at breast height). There was considerable variation between species, the lowest survival of saplings was European larch (Larix decidua Mill.) (13%) and the highest European beech (Fagus sylvatica L.) (55%); however differences between species were not significant. There were, however, significant differences between the six management areas with three with high sapling survival (55% to 61%) but others much lower (27% to 32%). If this result is confirmed by other studies, covering a broader range of sites, management guidance that assumes 90% survival will need to be revised.
1. Introduction
In Great Britain recent policy has encouraged the use of “continuous cover” and “low impact” approaches to forest management in wind-firm conifer plantations [1,2,3]. This represents a significant change of direction for silviculture, as until recently the dominant system was patch clearfelling followed by restocking [4]. One of the advantages of restocking in patch clearfells is that it concentrates regeneration efforts so that vegetation management, fencing and the application of pesticides can be used to maximize survival and growth of the planted trees. Research and practice have shown that if trees survive until the end of the second growing season the probability of survival is high [5]. For example, in forests managed by the Forestry Commission restocked areas must have at least 2500 stems per hectare five years after planting to be considered established [6]. After this there is an assumption, justified on the basis of practice over many decades, that survival will generally be high until self-thinning commences or silvicultural operations remove trees.
The use of continuous cover changes the focus of regeneration effort. One of the main changes is that natural regeneration is often the default option [7]. This has the effect of removing the tight control associated with restocking and the forest manager must try to balance a complex set of factors in an attempt to achieve success. The main factors involved in natural regeneration can be divided into five groups: seed supply; seedbed conditions; ground flora; animal impacts and stand conditions. However, once a tree has become established there is a subtle change in the balance between these factors with the former three, which are largely related to seed and the substrate, becoming less important for survival and the latter two becoming prominent [8,9]. There is also an additional factor to consider as young trees can become damaged or killed during harvesting [10,11]. In general, the terms “seedling” and “sapling” are used to describe young trees, with seedlings being the smaller trees that are not yet established. A standard definition of a sapling is “a usually young tree larger than a seedling but smaller than a pole—note size varies by region” [12]. For example, Marquis [13] regards saplings as between 1.3 and 15 cm diameter at 1.3 m above ground level; whereas in Britain a sapling is taller than 1.3 m but also has a diameter at breast height (DBH) of <7 cm and a seedling is defined as being any tree less that 1.3 m tall [14].
In Britain the recommended method of collecting stand level data for even-aged stands being transformed to continuous cover requires the number of saplings to be counted for each species in fixed area plots [14]. The guidance also suggests adequate sapling densities and distributions at different stages of the transformation process. Data are also collected on the presence of seedlings but the logic of placing emphasis on the saplings is that there is a much higher chance of them surviving to maturity. The question of “how high is high?” has often been asked and until now there has been an assumption that 90% of saplings will develop into trees [15]. A unique opportunity arose in the Glentress Trial Area [16] to examine the long-term survival and development of saplings in an upland coniferous forest under active transformation to continuous cover. The objectives of this study were to:
- 1. Investigate the survival of saplings in the Glentress Trial Area between 1990 and 2009.
- 2. Examine the differences in sapling survival between species and management areas.
2. Material and Methods
The Glentress Trial Area is an extensive research area of 117 ha where a long-term trial of the transformation of even-aged plantations to continuous cover has been in progress since 1952 [16]. The Trial Area is divided into six management areas (A–F) and the main species are Sitka spruce (Picea sitchensis (Bong.) Carr.) (43% of trees), Norway spruce (Picea abies (L.) Karst.) (25%), Japanese larch (Larix kaempferi (Lamb.) Carr.) (13%) and Douglas-fir (Pseudotsuga menziesii (Mirb.) Franco) (6%). The main method of transformation has been small coupe felling, with sizes in the range of 0.05 ha to 0.2 ha, followed by replanting. In the early phase of the transformation the objective was to plant Norway spruce, European silver fir (Abies alba L.) and European beech (Fagus sylvatica L.) as described by Anderson [17,18]. More recently both natural regeneration and planting have been used. However, a significant factor affecting the survival of young trees throughout the history of the Trial has been the impact of animals. Early on sheep in the area caused many problems and in later times the number of deer (roe deer; Capreolus capreolus L.) has increased. Deer control in the Trial Area is difficult as the area has high recreational use due to it being one of the most popular mountain biking destinations in Britain.
During its history the Trial Area has been periodically assessed in an attempt to track the structural changes that have resulted from the transformation. In the early part of its history this was done using the Check method [19] in which all trees of 12.5 cm DBH and above were assessed. However, for the assessment in 1990 a network of permanent sample plots (40 m × 10 m) were established using a stratified random design. This resulted in the establishment of 240 permanent sample plots distributed throughout six management areas (historically called “Blocks”, these are described in more detail in [16]). Each of the plots was divided into four subplots that measured 10 m × 10 m. In 1990 a wide range of assessments took place on the trees, saplings, seedlings and vegetation, which are described in detail in [16]. The main focus of this study is the number of saplings, which was recorded in 1990 for each species in each subplot. In addition, a sketch plan was drawn by the assessor of each sub-plot showing the location of saplings and young trees. One assessor carried out all the work but unfortunately he did not follow a consistent approach to drawing the sketch plans, hence they vary in quality of how the spatial location of saplings was recorded. For example, in plot 12 of management area D the location of individual and groups of saplings was recorded accurately (Figure 1). In contrast, in plot 7 of management area E the data showed that saplings were present but the location of them was not recorded.
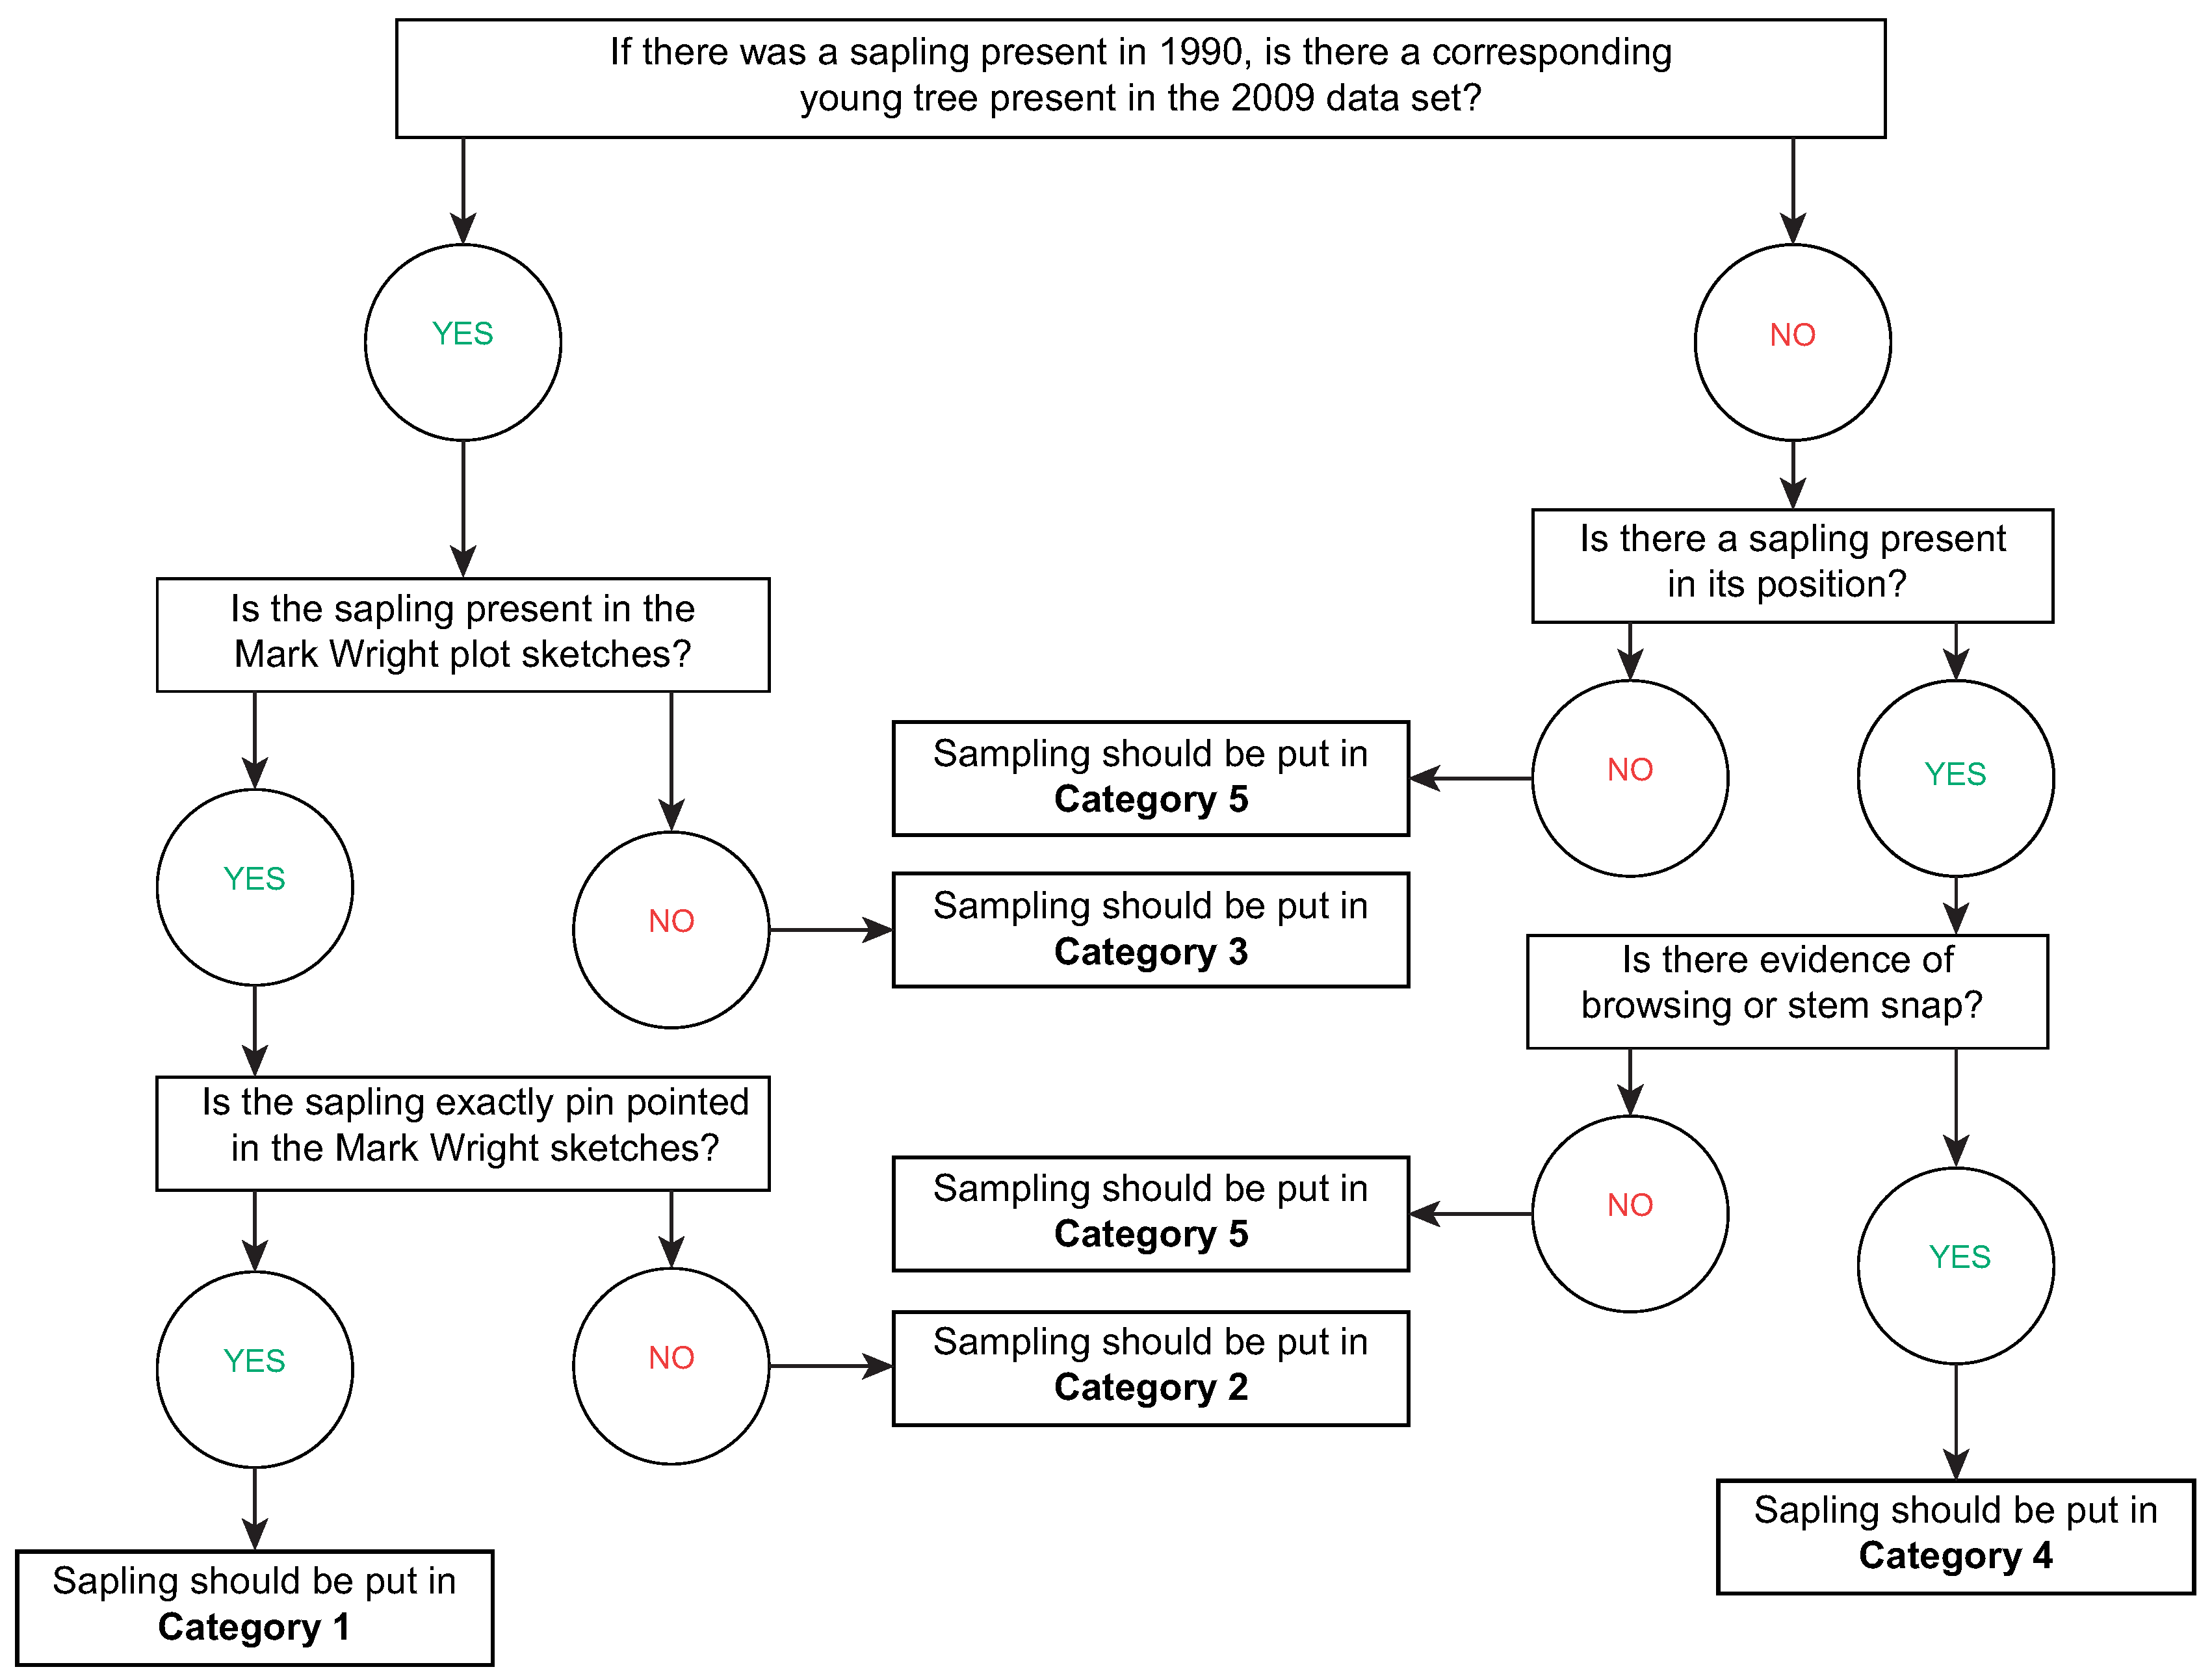
The permanent sample plots were reassessed in Autumn 2009 and this provided an opportunity to trace the development of the saplings that were recorded in 1990. During the assessment it was only possible to relocate 210 of the original 240 plots. To take account of the different ways in which the location of saplings had been recorded in 1990 five categories were defined. To ensure that these categories were defined in a repeatable, objective way during fieldwork a decision tree was designed and this is shown in Figure 2. The five categories were defined as follows:
- Category 1: a tree was present in 2009 and the sketch shows its exact location as a sapling in1990.
- Category 2: a tree was present in 2009 and the sketch shows its approximate location in 1990.
- Category 3: a tree was present in 2009 but the only evidence for it as a sapling in 1990 was inthe data. Field checks on the age of the tree in 2009 indicate it was likely to be asapling in 1990.
- Category 4: a sapling was present in 2009 and the sketch shows its exact location as a sapling in1990; reasons to explain the lack of development, such as browsing or stem snap, were observed.
- Category 5: the exact location of a sapling was recorded in 1990 but it was not present in 2009, or a sapling is present in 2009 but there is no sign of damage to the stem and it is too small to be the original sapling present in 1990.
Figure 1.
Plot sketches for subplots in management areas D and E.
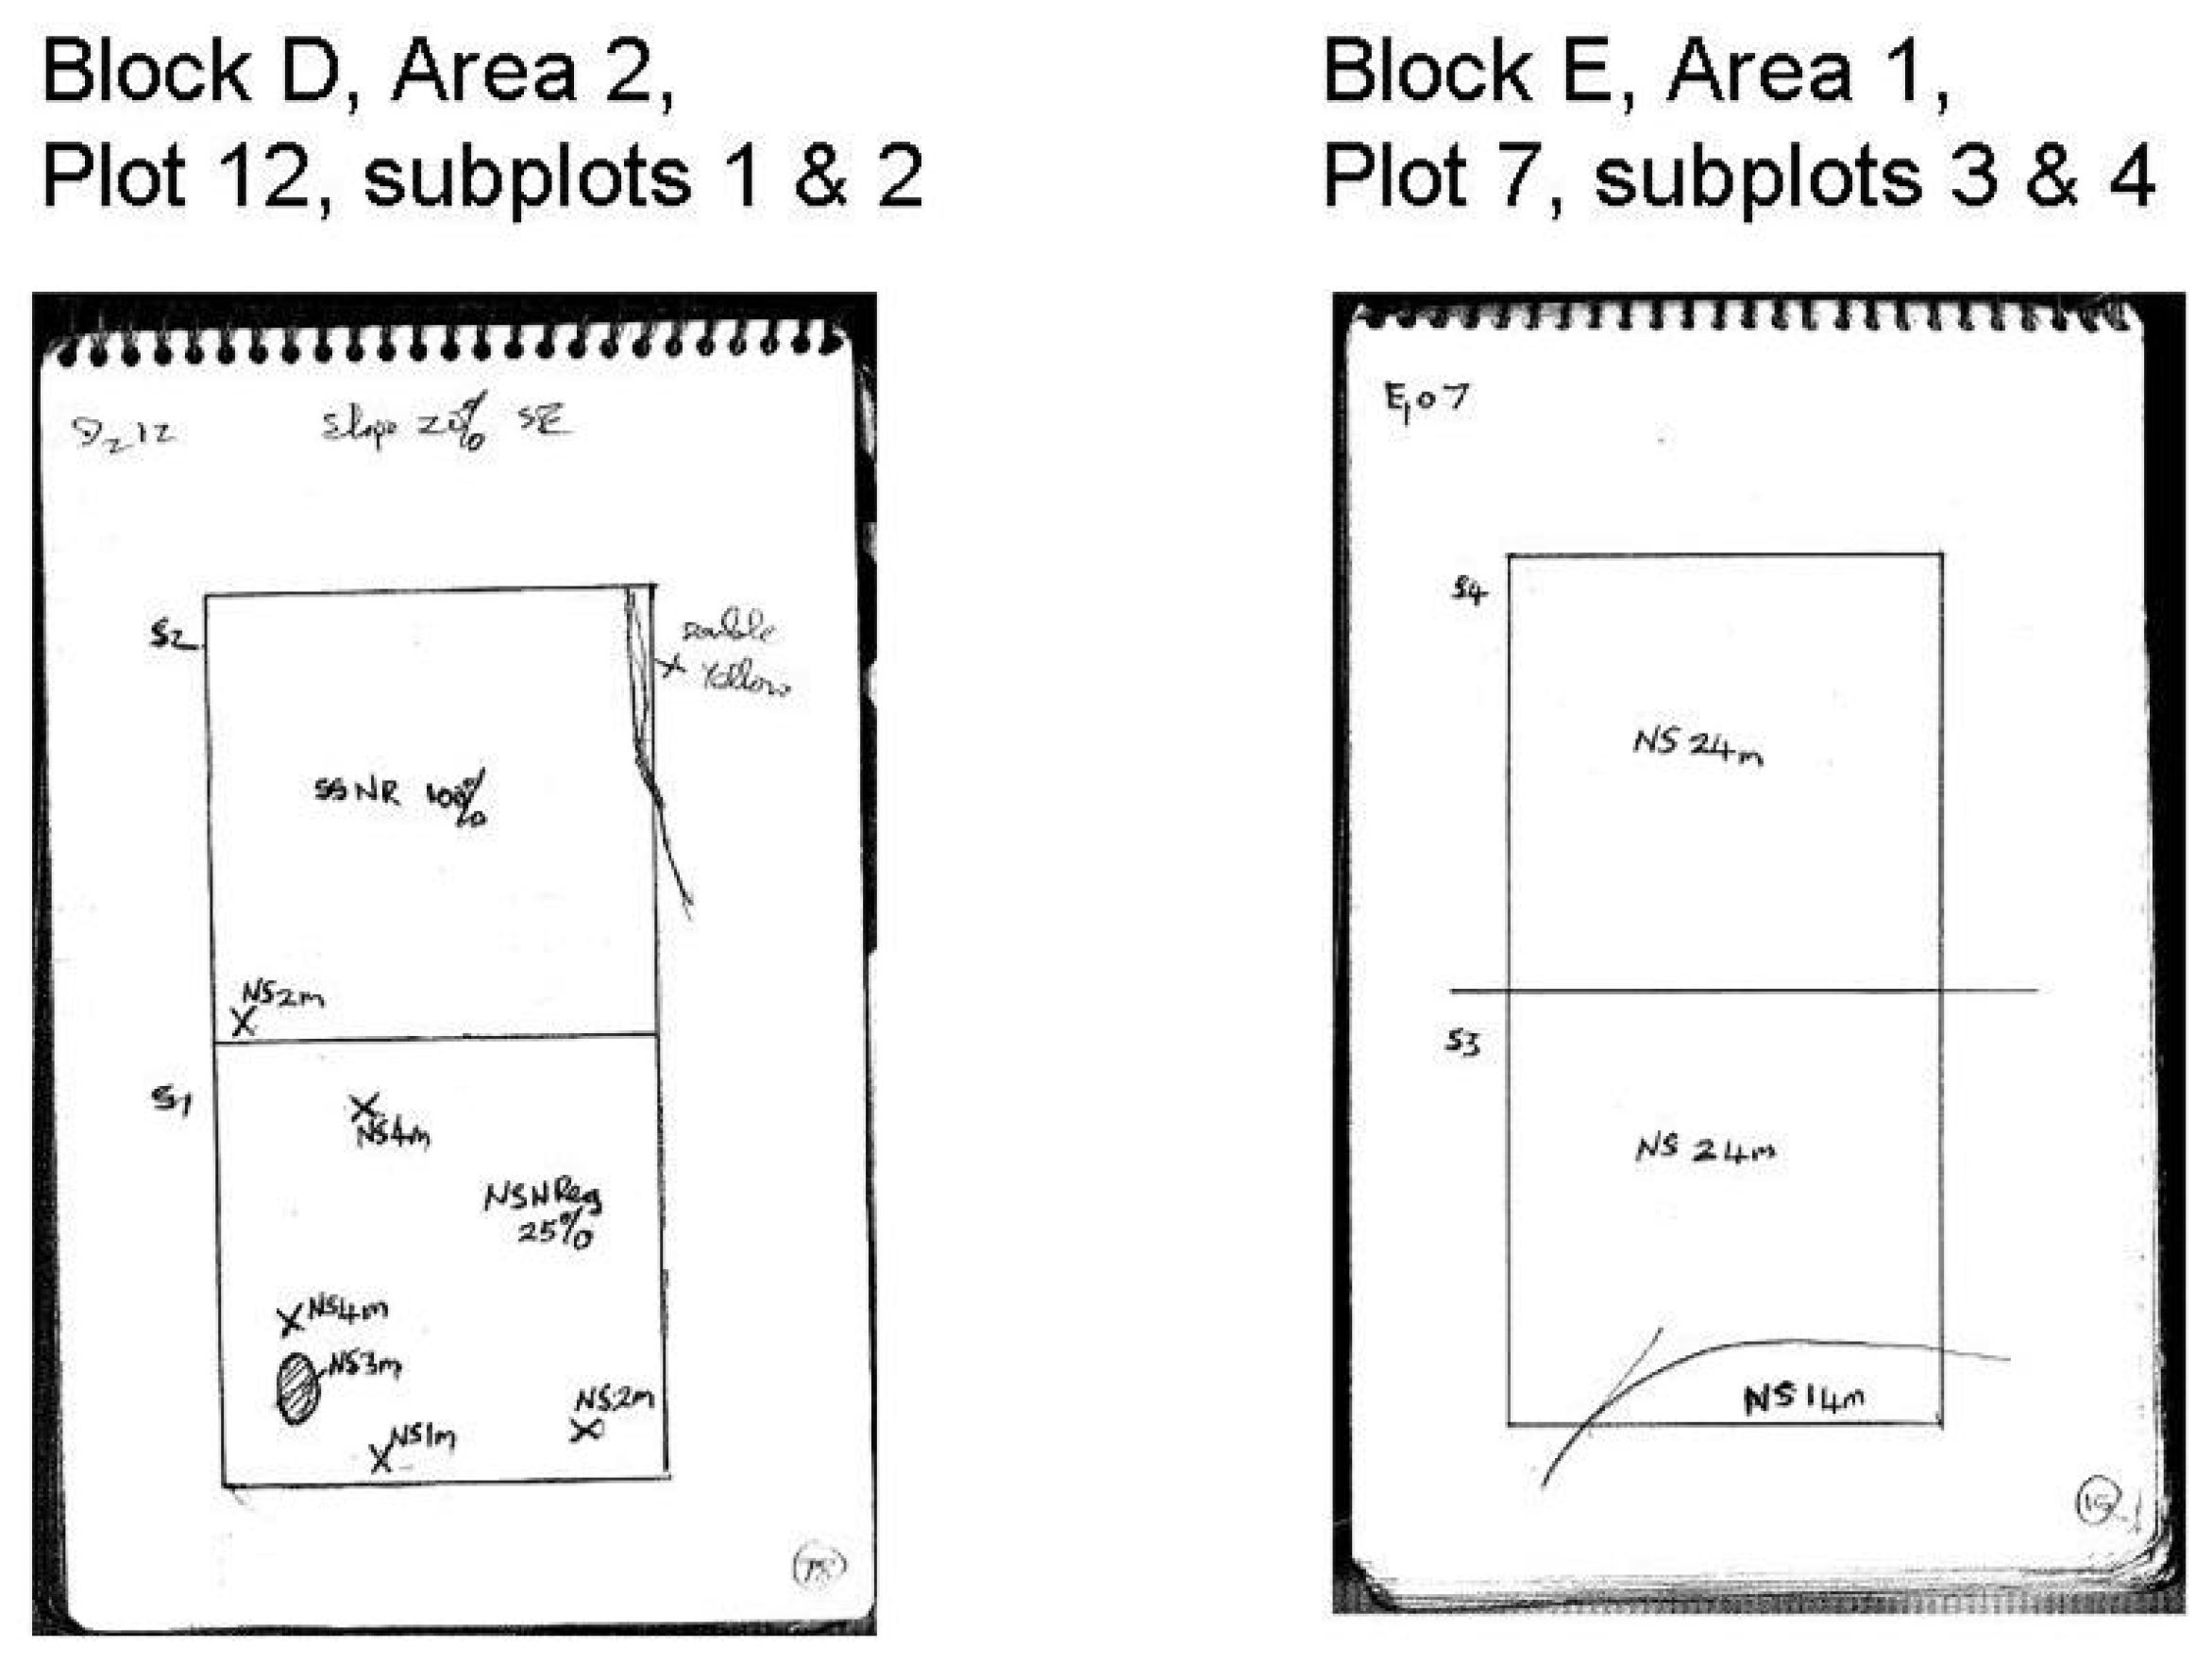
Figure 2.
The decision tree used to assign saplings to categories.

The number of 1990 saplings that survived until 2009 was expressed as a percentage of those present in 1990 according to species and management area. In addition, the equivalent annual mortality proportion (m) was calculated for each species using the formula:
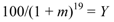
where Y = the percentage of 1990 saplings that survived to 2009.
The data were analyzed using a generalized linear model (GLM) with a binomial distribution and a logit link function in version 10 of Genstat [20]. Two analyses were carried out, the first had the proportion of saplings in categories 1 to 4 as the response variable, and the second had the proportion of saplings in categories 1 and 2. In both analyses the explanatory variables were management area and species. The dispersion parameter was estimated as the data were over-dispersed.
In an attempt to interpret the results of the study in terms of existing guidance of the stocking of saplings the time taken for a sapling to develop into a tree (>7 cm DBH) was estimated. This was hampered by a dearth of data on the development of saplings under continuous cover management in Britain and therefore it was necessary to use information on the initial growth of trees in even-aged plantations. For each species a representative growth rate was assumed based on the most recent National Inventory of Woodland and Trees [21]. The yield tables of Edwards and Christie [22] were used to estimate the time taken for trees to achieve 7 cm DBH. Where the first entry in the yield table was >7 cm, a linear relationship was assumed between age and DBH, and the time to achieve 7 cm DBH was estimated by interpolation. This value is the time period it would take for a tree to achieve 7 cm DBH after planting in even-aged plantations. It was then assumed that the same time period would also apply for a sapling to achieve 7 cm DBH under CCF conditions. The effects of different initial saplings densities and annual mortalities were then investigated for these time periods.
3. Results
The 1990 assessment recorded 3155 saplings in the Trial Area and the majority (88%) of these were recorded in a defined area in the sketch plans for the assessment plots (Table 1). Only a small number (2%) had the exact location recorded and a minority (10%) had no spatial information recorded (Table 1). The main change between 1990 and 2009 was that 62.7% of the saplings could not be relocated and were assumed to have died. Most of the remaining saplings had developed into a tree but a small number (16) had not reached the point at which they could be classed as a tree, i.e., 7 cm DBH.

| Category | Number in 1990 (%) | Number in 2009 (%) |
|---|---|---|
| 1 | 73 (2) | 28 (<1) |
| 2 | 2770 (88) | 1031 (33) |
| 3 | 312 (10) | 99 (3) |
| 4 | - | 16 (<1) |
| 5 | - | 1981 (63) |
| Totals | 3155 | 3155 |
Fitted models using species and management area explained much of the variation in survival of saplings in categories 1–2 and 1–4 (both p < 0.001). Checks on the residual variation confirmed the adequacy of the model fitting process. Results were so similar for the analysis of saplings in Categories 1–4 and 1–2 that Table 2, Table 3, Table 4 only show the results from the former.
| Species | Number Present in 1990 | % Alive in 2009 | Equivalent Annual Mortality [m] (%) |
|---|---|---|---|
| European beech | 31 | 54.8 | 3.2 |
| Douglas-fir | 112 | 34.8 | 5.7 |
| European larch | 45 | 13.3 | 11.2 |
| Japanese larch | 100 | 49.0 | 3.8 |
| Lodgepole pine | 104 | 35.6 | 5.6 |
| Norway spruce | 1120 | 37.6 | 5.3 |
| Other broadleaves + | 20 | 20.0 | 8.8 |
| Other conifers + | 76 | 35.6 | 5.6 |
| Sitka spruce | 1318 | 38.2 | 5.2 |
| Sycamore | 72 | 26.4 | 7.3 |
| Total | 2998 * | ||
| Trial Area | 37.3 | 5.3 |
* 157 saplings classified as “mixed conifer” in the 1990 assessment were excluded from this total but not the mean % survival; + The “other conifers” group consisted of Corsican pine (Pinus nigra subsp. laricio (Poir.) Maire), Lodgepole pine (Pinus contorta Douglas ex Loudon), Grand fir (Abies grandis (Douglas ex D. Don) Lindl.), Noble fir (Abies procera Rehd.), European Silver fir (Abies alba Mill.), Western hemlock (Tsuga heterophylla (Raf.) Sarg.), Western red cedar (Thuja plicata Donn ex D. Don) and Scots pine (Pinus sylvestris L.). The “other broadleaves” group contained Elder (Sambucus nigra L.), Silver birch (Betula pendula Roth), Rowan (Sorbus aucuparia L.), Sessile Oak (Quercus petraea (Matt.) Lieb.) and Whitebeam (Sorbus aria (L.) Crantz).
| Factor | DF | Deviance | Mean Deviance | Deviance Ratio | Probability (Approx. F) |
|---|---|---|---|---|---|
| Management Area | 5 | 265.5 | 53.09 | 13.70 | <0.001 |
| Species | 10 | 57.9 | 5.79 | 1.49 | 0.184 |
| Residual | 34 | 131.8 | 3.88 | ||
| Total | 49 | 455.1 | 9.29 |
Dispersion parameter was 3.88.
The range in the survival of different species was wide (Table 2) with the lowest being European larch (Larix decidua Mill.) (13.3%; annual mortality 11.2%) and the highest beech (54.8%; annual mortality 3.2%). However, the majority of saplings were Norway spruce and Sitka spruce and the survival of these species was similar, 37.6% and 38.2% respectively; close to the overall percentage survival of the Trial Area of 37.3%. The analysis confirmed that there was no significant difference between the survival of different species between 1990 and 2009 (Table 3). In addition, using the seedling light requirement classification in [23] there was little difference between light demanding species (the larches and lodgepole pine; 36.9%), intermediate (Douglas-fir and Sitka spruce; 37.9%) and the shade tolerants (Norway spruce, sycamore (Acer pseudoplatanus L.) and beech; 37.3%).
The survival of saplings in different management areas formed two distinct groups (Table 4). Survival was high and between 54.9% and 61.3% in management areas A, B and D but in management areas C, E and F it was much lower and in the range 26.5% to 32%. Management area C had the most saplings present in 1990 and 92% were Sitka spruce and Norway spruce. Analysis confirmed that management area had a significant effect on survival (p < 0.001) (Table 3).
Table 4.
The number of saplings in each management area during 1990 and the percentage alive in 2009 for categories 1–4.
| Management Area | Number in 1990 | % Alive in 2009 |
|---|---|---|
| A | 398 | 55.0 |
| B | 162 | 54.9 |
| C | 1288 | 26.9 |
| D | 416 | 61.3 |
| E | 438 | 26.5 |
| F | 453 | 32.0 |
| Total | 3155 | |
| Trial Area | 37.1 |
The time taken for saplings to develop into trees was in the range of 10–17 years for conifers and 20–25 years for oak and beech (Table 5). As the Trial Area is predominantly an upland conifer forest the values of 10 years and 15 years were both used to examine the effects of different initial saplings densities and annual mortalities on the density remaining at the end of the period (Table 6). This shows that an initial density of 2000 saplings per hectare can result in between 725 and 1489 saplings depending on the time taken to achieve 7 cm DBH and the annual rate of mortality.
Table 5.
Estimated time for species to achieve 7 cm diameter at breast height (DBH) under continuous cover management in Britain.
| Species | General Yield Class 1 | Years to Achieve 7 cm DBH-Even-Aged 2 | Years to Achieve 7 cm DBH-CCF 3 |
|---|---|---|---|
| Douglas-fir | 14 | 11 | 11 |
| European larch | 8 | 12 | 12 |
| Japanese larch | 10 | 10 | 10 |
| Lodgepole pine | 8 | 15 | 15 |
| Norway spruce | 12 | 17 | 17 |
| Sitka spruce | 14 | 13 | 13 |
| Oak | 6 | 20 | 20 |
| European beech | 6 | 25 | 25 |
1 As defined by Edwards and Christie [22]; 2 From Edwards and Christie [22], assuming a linear relationship between age and DBH for the period up to the first yield table entry; 3 Estimated time from becoming a sapling to achieving 7 cm DBH; i.e., assuming that the gains of starting as a sapling are equal to any reduction in growth caused by the canopy.
Table 6.
Effects of different rates of annual mortality on initial densities of saplings and development into trees over 10 and 15 years.
| Initial Density of Saplings per Hectare | Annual Mortality (%) * | Residual Density of Trees after 10 Years | Residual Density of Trees after 15 Years |
|---|---|---|---|
| 1000 | 3 | 744 | 642 |
| 5 | 614 | 481 | |
| 7 | 508 | 362 | |
| 2000 | 3 | 1489 | 1284 |
| 5 | 1228 | 962 | |
| 7 | 1016 | 725 | |
| 3000 | 3 | 2233 | 1927 |
| 5 | 1841 | 1443 | |
| 7 | 1525 | 1087 |
* The annual mortality proportion (m) is this figure divided by 100.
4. Discussion
Knowledge and understanding of the development and mortality of saplings is important when using continuous cover management as they have a profound effect on the dynamics and future composition of the forest, particularly where there is more than one species [24,25]. When transforming even-aged stands to continuous cover management two quite different scenarios operate. In the first, something akin to a uniform shelterwood [26], dense uniform seedling regeneration is established and then the overstorey is removed in a single or series of operations. A good example of guidance for forest managers on the density and species composition of saplings for this scenario has been developed by Marquis [13]. This gives guidance on the relationship between the size and species composition of seedling and sapling regeneration, deer density and food availability, and the likelihood of successful regeneration; it was based on a number of studies [27,28]. In the second, a slower more gradual process of regeneration will result in a forest with a structure similar to that produced by an irregular shelterwood or selection system [26]; this is the aim at Glentress [16].
In fully developed selection systems, forest managers seek to ensure certain levels of “ingrowth”, which is defined as a number of trees or basal area that develops to a minimum size within a set period of time [29]. The criterion at which trees are classed as ingrowth can be as low as a DBH of 5.5 cm [30] or as high as a DBH of 16 cm [31,32,33]. However, in terms of guidance to forest managers, one problem with this approach is that it gives no information on the earlier stages from seedling to sapling and from a sapling to tree. This is particularly important when transforming even-aged stands to an irregular structure when mammal impacts can be significant, such as in Britain. A recent survey to find guidance in a range of different countries on the number of saplings considered to be sufficient did not locate much relevant information that could be used to inform practice in Britain [15]. However, a number of studies of sapling development and mortality have been published [8,34,35,36,37] and it is clear from these that the survival of a sapling is related to its size and rate of growth, the shade tolerance of the species, site and the impacts of mammals. Models of sapling growth have also been developed [38,39] but an important concern with any regeneration model is availability of data [40].
Present guidance in Britain [14,41] is that when transforming to continuous cover and the production of timber is an objective of management a density of 2000 saplings per hectare with an even distribution is required. When using the uniform shelterwood system this density should be achieved 10–15 years after the seeding felling. When using an irregular shelterwood or selection system this density should be achieved on 10% of the area after 10–15 years, with the area increasing thereafter depending on the nature of the site and species being managed. These figures were derived based on the assumption that 90% of the saplings would survive [15]. The main finding of this study is that this assumption is ambitious at least for some sites as at Glentress only 37% of saplings developed into trees during the 19-year period of the study.
The range of survival between different species was wide (34.8%) but was not significant. However, it should be noted that the lowest and highest surviving species had lower sample sizes than the majority of the tree species. Neither were there any differences apparent between groups of species of different shade tolerance. The effect of management area across the Trial Area was found to have a significant influence on sapling survival. There are a large number of factors that could explain this effect but unfortunately with the dearth of historical records available for the area it is impossible to explain these results [16]. However, the results can be considered in the context of guidance that a minimum density of 2000 saplings per hectare is required during transformation to CCF [14]. The mean annual mortality of the species was 5.3% (Table 2) and if this rate of mortality is applied over a 10 or 15 year transformation period then the resulting sapling densities will be 1228 per hectare or 962 per hectare respectively (Table 6). This prompts the question: “is this density sufficient to ensure the production of quality timber?” [42]. As shown in Table 6 the effects of longer transformation periods and higher annual mortalities are to reduce this figure much further.
Only a small number of other studies have been located that present results from similar sapling developmental stages. A notable exception to this is the study of Kobe and Coates [34] who examined the influence of growth and shade tolerance of the saplings of eight tree species in northwestern British Columbia. Their results show that for saplings growing well (4 mm annual diameter increment at 10 cm above ground) the three year probability of mortality varied between 0% and 4%. However, for saplings growing poorly (1 mm annual diameter increment) the three-year probability of mortality varied between 0% and 70%. These results show a wider variation than the present study but little information is given on the possible effects of mammal impacts or harvesting damage, both of which could have been important at Glentress.
The information above suggests that guidance on the minimum density of saplings may need to be revised. However, it should be noted that these results come from only one site and variation between sites would be expected to be high. However, the site covered a large area and in many respects is a typical upland coniferous forest. The main ways in which it is different to surrounding forest areas is the high level of public access for mountain biking and the problems this causes for deer control. The Trial Area is consequently likely to have higher mortality rates of saplings compared with other areas. Perhaps the best way forward is for forest managers to apply the monitoring procedure described by Kerr et al. [14] and develop guidelines based on local factors.
5. Conclusions
- 1. A large number of factors contribute to the mortality of a sapling. This study has shown that previous assumptions in Britain of high survival rates were not confirmed at the Glentress Trial Area. If this is confirmed by data from a broader range of sites, present guidance to forest managers may need to be revised.
- 2. The location of a sapling can have a significant effect on the survival of a sapling. More workis required to better understand the complex factors that have produced this result.
- 3. Information on the link between stocking densities of saplings and a range of objectives offorest management, particularly timber production, is lacking in the context of continuouscover management. Because of this any future revised guidance should take account of theprecautionary principle—if you are aiming to produce timber it is much better to have moresaplings as these can always be thinned to produce the species composition and spatial arrangement required.
Acknowledgments
The authors would like to thank Douglas Malcolm and Mark Wright who collected the 1989/90 data and Andy Peace who advised on the statistical analysis. The work at Glentress Trial Area has been funded by the Forestry Commission and the Scottish Forestry Trust and we are grateful for this support. Helpful comments on drafts of the paper were received from Tim Randle and Helen McKay.
Conflict of Interest
The authors declare no conflict of interest.
References
- Forestry Commission, The UK Forestry Standard, 2nd ed; Forestry Commission: London, UK, 2006; p. 74.
- UKWAS. United Kingdom Woodland Assurance Standard; UKWAS: Edinburgh, UK, 2006, 2nd ed. p. 56. Available online: http://www.ukwas.org.uk (accessed on 12 March 2012).
- Forestry Commission, Woodlands for Wales: The Welsh Assembly Government’s Strategy for Woodlands and Trees; Forestry Commission: Aberstywyth, UK, 2009; p. 62.
- Mason, W.L. Changes in the management of British forests between 1945 and 2000 and possible future trends. Ibis 2007, 149, 41–52. [Google Scholar] [CrossRef]
- Jinks, R.; Kerr, G. Establishment and early growth of different types of Corsican pine (Pinus nigra var. maritima) on four sites in Thetford Forest. Forestry 1999, 72, 293–304. [Google Scholar]
- Forestry Commission, Plant Density: Right First Time (Version 2.1). In Forestry Commission Operational Guidance Booklet 4; Forestry Commission: Edinburgh, UK, 2011.
- Kerr, G. Managing Continuous Cover Forests. In Forestry Commission Operational Guidance Booklet 7; Forestry Commission: Edinburgh, UK, 2008; p. 64. [Google Scholar]
- Lundqvist, L.; Fridman, E. Influence of local stand basal area on density and growth of regeneration in uneven-aged Picea abies stands. Scand. J. For. Res. 1996, 11, 364–369. [Google Scholar] [CrossRef]
- Saska, T.; Valkonen, S. Dynamics of seedling establishment and survival in uneven-aged boreal foress. For. Ecol. Manag. 2011, 261, 1409–1414. [Google Scholar]
- Granhaus, A.; Fjeld, D. Spatial distribution of injuries to Norway spruce advance growth after selection harvesting. Can. J. For. Res. 2001, 31, 1903–1913. [Google Scholar]
- Stokes, V.; Kerr, G.; Ireland, D. Seedling height and the impact of harvesting operations on advance regeneration of conifer species in upland Britain. Forestry 2009, 82, 185–198. [Google Scholar] [CrossRef]
- Helms, J. The Dictionary of Forestry; CABI International: Oxford, UK, 1998. [Google Scholar]
- Marquis, D.A. Quantitative Silviculture for Hardwood Forests of the Alleghenies; General Technical Report NE 183; USDA Department of Agriculture Forest Service, Northeastern Forest Experiment Station: Radnor, PA, USA, 1994. [Google Scholar]
- Kerr, G.; Mason, B.; Boswell, R.; Pommerening, A. Monitoring the Transformation to Continuous Cover Management. In Forestry Commission Information Note 45; Forestry Commission: Edinburgh, UK, 2002. [Google Scholar]
- Hale, S.; Kerr, G. Factors to consider when defining acceptable stocking levels for conifer regeneration in continuous cover forestry. Q. J. For. 2009, 103, 111–119. [Google Scholar]
- Kerr, G.; Morgan, G.; Blyth, J.; Stokes, V. Transformation from even-aged plantations to an irregular forest: The world’s longest running trial area at Glentress, Scotland. Forestry 2010, 83, 329–344. [Google Scholar] [CrossRef]
- Anderson, M.L. High Elevation Experimental Area: Glentress Forest; Glentress archive, Forest Research, Alice Holt Lodge: Surrey, UK, 1955; available as supplementary material to reference 16. [Google Scholar]
- Anderson, M.L. Norway spruce-silver fir-beech mixed selection forest: Is it possible to reproduce this in Scotland? Scott. For. 1960, 14, 87–93. [Google Scholar]
- Knuchel, H. Planning and Control in the Managed Forest; Oliver and Boyd: Edinburgh, UK, 1953. [Google Scholar]
- Genstat 5 Committee, Genstat 5: Release 3 Reference Manual; Clarendon Press: Oxford, UK, 1993.
- Forestry Commission, National Inventory of Woodland and Trees: Scotland; Forestry Commission: Edinburgh, UK, 2001.
- Edwards, P.N.; Christie, J.M. Yield Models for Forest Management. In Forestry Commission Booklet 48; Forestry Commission: Edinburgh, UK, 1981. [Google Scholar]
- Mason, B.; Kerr, G.; Simpson, J. What is Continuous Cover Forestry? In Forestry Commission Information Note 29; Forestry Commission: Edinburgh, UK, 1999. [Google Scholar]
- Harcombe, P.A.; Marks, P.L. Tree diameter distributions and replacement processes in southeast Texas forests. For. Sci. 1978, 24, 53–166. [Google Scholar]
- Lorimer, C.G. Survival and growth of understorey trees in oak forests of the Hudson Highlands, New York. Can. J. For. Res. 1981, 11, 689–695. [Google Scholar] [CrossRef]
- Matthews, J.D. Silvicultural Systems; Clarendon Press: Oxford, UK, 1991. [Google Scholar]
- Marquis, D.A. Effect of Advance Seedling Size and Vigor on Survival after Clearcutting; Research Paper NE 498; USDA Department of Agriculture Forest Service, Northeastern Forest Experiment Station: Radnor, PA, USA, 1982. [Google Scholar]
- Sander, I.L.; Johnson, P.S.; Watt, R.F. A Guide for Evaluating the Adequacy of Oak Advance Growth; General Technical Report NE-23; USDA Department of Agriculture Forest Service, North Central Forest Experiment Station: St. Paul, MN, USA, 1976. [Google Scholar]
- Shifley, S.R.; Ek, A.R.; Burk, T.E. A generalized methodology for estimating forest ingrowth at multiple threshold diameters. For. Sci. 1993, 39, 776–798. [Google Scholar]
- FBVA-Forstliche Bundesversuchsanstalt, Instruktionen fur die Feldarbeit der Osterr Forstinventur; Forstliche Bundesversuchsanstalt: Wien, Austria, 1994; p. 194.
- Schütz, J.-Ph. Le Régime du Jardinage; Document autographique du cours de sylviculture III, chaire de sylviculture: Zürich, Switzerland, 1989. [Google Scholar]
- Schütz, J.-Ph. Sylviculture 2: La Gestion des Forêts. Irrégulières et Mélangées; Presses Polytechniques et Universitaires Romandes: Lausanne, Switzerland, 1997. [Google Scholar]
- Poore, A.; Kerr, G. Continuous cover silviculture at the stourhead (Western) estate, Wiltshire, UK. Q. J. For. 2009, 103, 23–30. [Google Scholar]
- Kobe, R.K.; Coates, K.D. Models of sapling mortality as a function of growth to characterize interspecific variation in shade tolerance of eight tree species of northwestern British Columbia. Can. J. For. Res. 1997, 27, 227–236. [Google Scholar]
- Chrimes, D.; Lundqvist, L.; Atlegrim, O. Picea abies sapling height growth after cutting Vaccinium myrtillus in an uneven-aged forest in northern Sweden. Forestry 2004, 77, 61–66. [Google Scholar] [CrossRef]
- Miura, M.; Yamamoto, S.I. Effects of sprouting and canopy states on the structure and dynamics of a Castanopsis cuspidata var. sieboldii sapling population in an old-growth evergreen Broad-leaved forest. For. Ecol. Manag. 2003; 183, 387–400. [Google Scholar]
- Palmer, S.C.F.; Truscott, A.M. Browsing by deer on naturally regenerated Scots pine (Pinus sylvestris L.) and its effects on sapling growth. For. Ecol. Manag. 2003, 182, 31–47. [Google Scholar]
- Monserud, R.A.; Ek, A.R. Predicting understorey tree height growth in northern hardwood stands. For. Sci. 1977, 23, 391–400. [Google Scholar]
- Golser, M.; Hasenauer, H. Predicting juvenile tree height growth in uneven-aged mixed species stands in Austria. For. Ecol. Manag. 1997, 97, 133–146. [Google Scholar] [CrossRef]
- Hasenauer, H. Sustainable Forest Management: Growth Models for Europe; Springer-Verlag: Berlin, Germany, 2006. [Google Scholar]
- Kerr, G.; Mason, B.; Boswell, R. A sampling system to monitor the transformation from even-aged stands to continuous cover. Forestry 2003, 76, 425–435. [Google Scholar] [CrossRef]
- Brazier, J.D.; Mobbs, I.D. The influence of planting distance on structural wood yields of unthinned Sitka spruce. Forestry 1993, 66, 333–352. [Google Scholar]
© 2012 by the authors; licensee MDPI, Basel, Switzerland. This article is an open-access article distributed under the terms and conditions of the Creative Commons Attribution license (http://creativecommons.org/licenses/by/3.0/).
Share and Cite
MDPI and ACS Style
Kerr, G.; Mackintosh, H. Long-Term Survival of Saplings during the Transformation to Continuous Cover. Forests 2012, 3, 787-798. https://doi.org/10.3390/f3030787
AMA Style
Kerr G, Mackintosh H. Long-Term Survival of Saplings during the Transformation to Continuous Cover. Forests. 2012; 3(3):787-798. https://doi.org/10.3390/f3030787
Chicago/Turabian StyleKerr, Gary, and Hamish Mackintosh. 2012. "Long-Term Survival of Saplings during the Transformation to Continuous Cover" Forests 3, no. 3: 787-798. https://doi.org/10.3390/f3030787