Review

Computer-Aided Diagnosis in Mammography Using Content-Based Image Retrieval Approaches: Current Status and Future Perspectives

Imaging Research Center, Department of Radiology, University of Pittsburgh, 3362 Fifth Avenue, Room 128, Pittsburgh, PA 15213, USA
Algorithms 2009, 2(2), 828-849; https://doi.org/10.3390/a2020828
Submission received: 29 April 2009 / Revised: 28 May 2009 / Accepted: 28 May 2009 / Published: 4 June 2009
(This article belongs to the Special Issue Machine Learning for Medical Imaging)

Abstract

:
As the rapid advance of digital imaging technologies, the content-based image retrieval (CBIR) has became one of the most vivid research areas in computer vision. In the last several years, developing computer-aided detection and/or diagnosis (CAD) schemes that use CBIR to search for the clinically relevant and visually similar medical images (or regions) depicting suspicious lesions has also been attracting research interest. CBIR-based CAD schemes have potential to provide radiologists with “visual aid” and increase their confidence in accepting CAD-cued results in the decision making. The CAD performance and reliability depends on a number of factors including the optimization of lesion segmentation, feature selection, reference database size, computational efficiency, and relationship between the clinical relevance and visual similarity of the CAD results. By presenting and comparing a number of approaches commonly used in previous studies, this article identifies and discusses the optimal approaches in developing CBIR-based CAD schemes and assessing their performance. Although preliminary studies have suggested that using CBIR-based CAD schemes might improve radiologists’ performance and/or increase their confidence in the decision making, this technology is still in the early development stage. Much research work is needed before the CBIR-based CAD schemes can be accepted in the clinical practice.

1. Introduction

In the clinical practice of reading and interpreting medical images, clinicians (i.e., radiologists) often refer to and compare the similar cases with verified diagnostic results in their decision making of detecting and diagnosing suspicious lesions or diseases. However, searching for and identifying the similar reference cases (or images) from the large and diverse clinical databases (either the conventional film/paper based libraries or advanced digital image storage systems) is a quite difficult task. The advance in digital technologies for computing, networking, and database storage has enabled the automated searching for clinically relevant and visually similar medical examinations (cases) to the queried case from the large image databases. There are two types of general approaches in medical image retrieval namely, the text (or semantic) based image retrieval (TBIR) and the content-based image retrieval (CBIR). Currently, the most of available search systems (or tools) developed and implemented in medical informatics and picture archiving and communication systems (PACS) use TBIR schemes that are based on the annotated textual information to select similar or clinically relevant references (cases) [1,2,3,4]. This approach is typically limited to retrieve or select the same type of medical images (i.e., mammograms or CT brain images). However, the relevant clinical information depicted on medical images is locally presented (i.e., breast masses depicted on mammograms and emphysema lesions depicted on lung CT images). In the clinical practice of reading and interpreting medical images, the nature of the queried suspicious regions is often un-determined. Thus, the CBIR is the only available and reliable approach to retrieve the clinically relevant (reference) cases along with the proven pathology and other related clinical information. As a result, developing CBIR schemes has been attracting extensive research interest in the areas of medical informatics and PACS for the last decade [5,6,7,8,9,10]. Despite the fact that CBIR approach is still in its early development stage facing many technical challenges (i.e., region segmentation, semantic gap, and computational efficiency), as the digital medical images are produced in ever increasing quantities and used for diagnosis and therapy, the researchers believe that the advance of CBIR development will play more and more important role in future medical image diagnosis and patient treatment (or management) [11].
In medical imaging areas, developing computer-aided detection and/or diagnosis (CAD) schemes has also been a very active research topic for the last two decades. The CAD schemes have been developed for variety of medical images including but not limited to mammograms (i.e., detecting breast masses and micro-calcification clusters [12]), lung CT images (i.e., detecting lung nodules [13], interstitial lung diseases [14], chronic obstructive pulmonary disease [15], and pulmonary embolism [16]), CT colonography [17], and pathology images (i.e., fluorescent in situ hybridization (FISH) images for diagnosing breast cancer [18] and metaphase chromosome images for detecting leukemia [19]). Among these different types of CAD schemes, CAD of mammograms is the most mature one. The commercialized CAD systems of mammograms have been routinely used in the clinical practice in a large number of medical institutions in USA and other countries to assist radiologists in detecting breast abnormalities (by highlighting or cueing the locations depicting the suspicious micro-calcification clusters and masses) [12]. Previous studies have shown that using CAD improves radiologists’ efficiency in searching for and detecting micro-calcification clusters as well as helps them detect more cancers associated with malignant micro-calcifications [20,21]. However, the majority of CAD-cued false-negative cancers associated with malignant masses (that are overlooked by radiologists in their originally image interpretation) are discarded again by the radiologists as false-positives in the clinical environment [22,23]. Such errors are primarily caused by (1) the relatively low performance of CAD schemes in mass detection (i.e., the higher false-positive rates [24] and cuing the majority of subtle masses only on one view [25]) and (2) the inability to explain the reasoning of the CAD decision-making (the “black-box” type approach). While the clinical benefit of using current commercially available CAD systems is still under debate and test [26,27], researchers have been actively working on developing a new type of CAD schemes using CBIR approaches [28,29,30,31,32,33,34,35,36].
Unlike the conventional CAD schemes that detect and cue the suspicious abnormalities based on a “global” optimization function trained using the completely available image database, the CAD schemes using CBIR approaches apply an adaptive approach to generate each detection and/or diagnostic result based on the selection of different hypotheses or local approximations as the target function for each unknown query (a suspicious testing region) [37]. Specifically, for each initially automatically detected or manually queried suspicious “lesion” depicted on one testing image, the CAD scheme segments the suspicious region and computes the likelihood of this “lesion” being associated with true-positive lesion (i.e., cancer) based on comparison with a set of “similar lesions” that are retrieved and selected by the CBIR algorithm from the available reference databases. Because the status of all selected references (“similar lesions”) have been previously verified, researchers have also proposed to develop the intelligent or interactive CAD schemes that aim to provide radiologists “visual aid” by displaying both CAD-generated detection (or diagnostic) scores and the selected “similar” images on CAD workstations. Preliminary observer performance studies suggested that using this “visual aid” tool could improve radiologists’ performance in classifying between malignant and benign masses [38] as well as increase radiologists’ confidence to accept CAD-cued results (detection scores) in their decision making [39].
Despite of great research interest and the significant progress made in the last several years, developing CAD schemes using CBIR approaches is still in its early stage. Before such a CAD scheme can be routinely accepted and applied in the clinical practice, much research work is still needed. This article takes CAD of breast masses depicted on mammograms as an example to review and discuss several primary issues in developing CAD schemes using CBIR approaches and evaluating their performance and reliability. The discussed development and evaluation concepts should also be applicable to CAD schemes for other types of medical images and diseases.

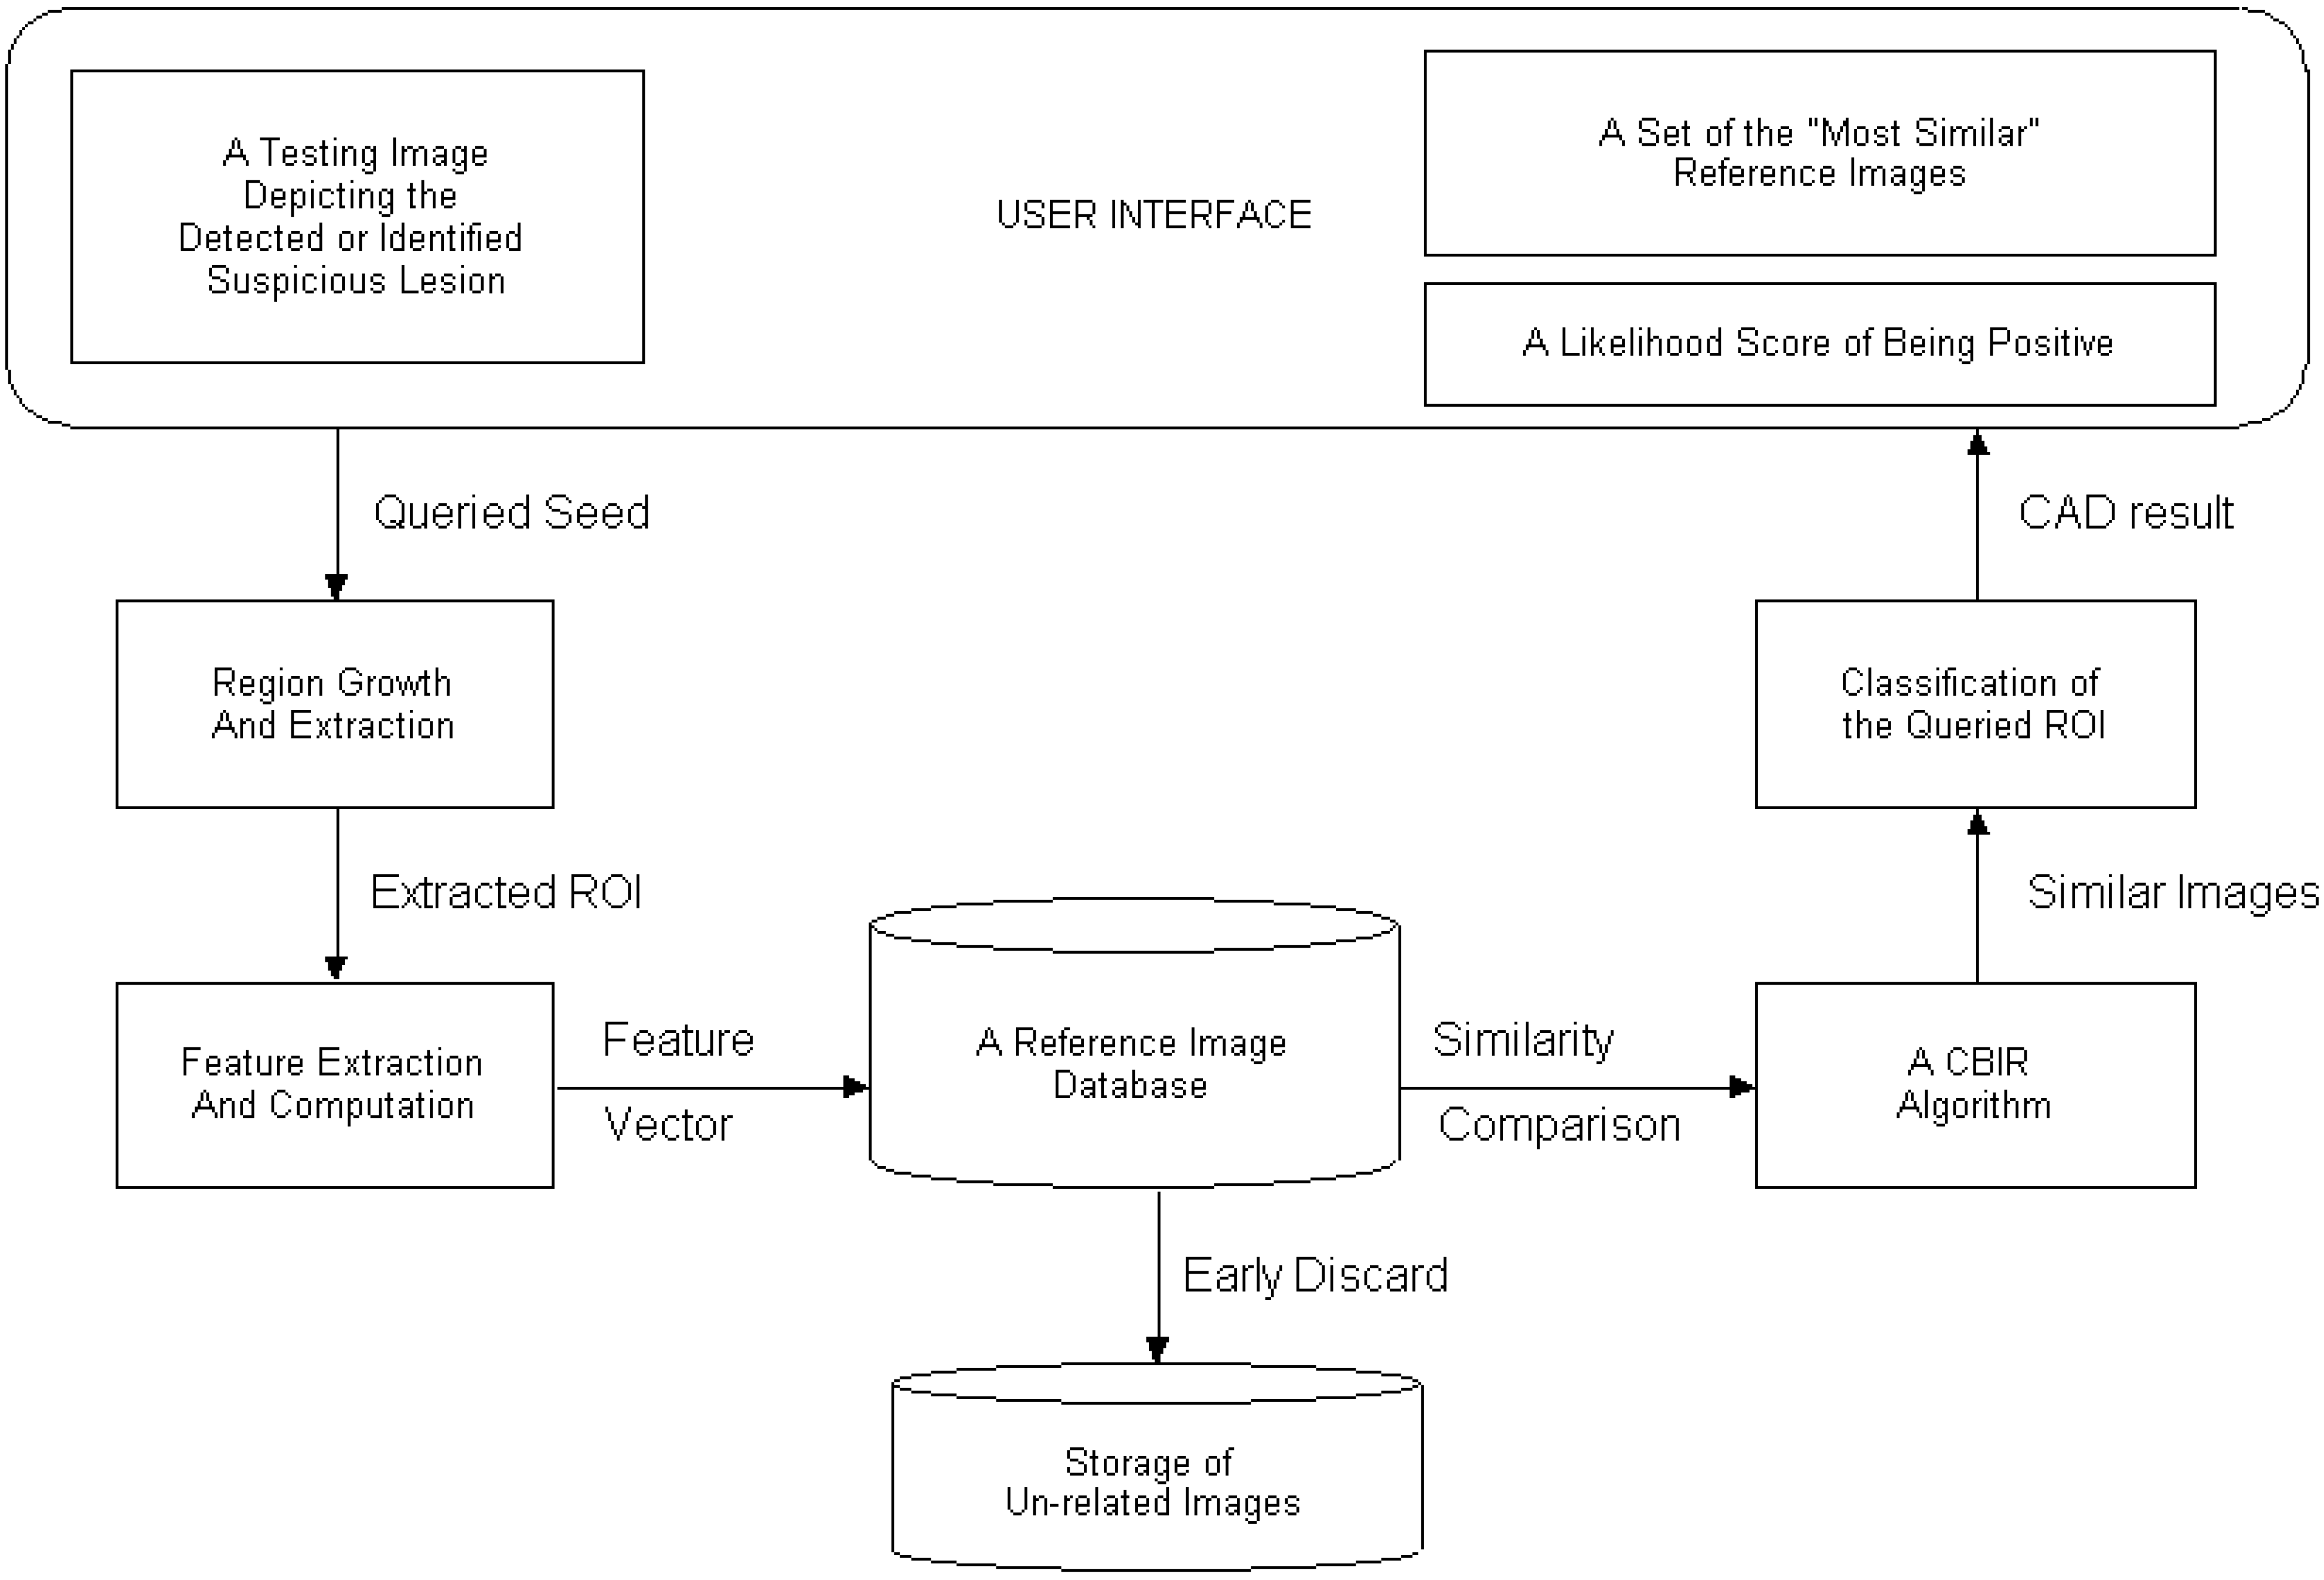
2. Overview of CAD scheme using CBIR approach

Figure 1 illustrates a dataflow diagram of a typical CAD scheme using the CBIR approach. The scheme includes following primary components. First, the scheme either automatically searches for and detects the initial seed of a suspicious region or accepts the queried seed of a suspicious region identified by the human observer (i.e., a radiologist). This step allows the observers to either examine the originally CAD-cued suspicious masses or require (force) CAD to detect and analyze the specific suspicious mass regions that are not initially cued by the CAD scheme. Second, from the detected or queried seed, CAD scheme applies a region growth algorithm to segment the suspicious mass region (defining the boundary contour). The accuracy of suspicious region segmentation determines the accuracy of extracted and computed image features used in CBIR algorithm. Third, the scheme extracts and computes a set of image features from the segmented region and its surrounding background. This step aims to search for and identify effective image features that should reduce the “semantic gap” between computer vision and human vision. Fourth, the scheme may early discard a substantial fraction of images stored in the reference image database. Although the performance and robustness of all CAD schemes heavily depends on the size and diversity of reference databases, the CAD schemes using CBIR approaches use an adaptive and “local” approximation method in which only a small number of references have direct impact on the detection or classification of the specifically queried ROI when using the CBIR algorithm. Thus, early discarding the majority of reference ROIs with relatively lower correlation to the queried ROI is also an important step to improve the computational efficiency of the CAD scheme. Fifth, the scheme applies a CBIR algorithm to compare and retrieve a set of K reference images (or ROIs) that are considered the “most similar” to the queried mass (or ROI). The searching and retrieving result of the CBIR algorithm depends on the effectiveness of the summary index or criterion (i.e., distance metric) to measure the “similarity” level among the selected images. Sixth, based on the similarity levels of the retrieved reference ROIs to the queried ROI and their verified outcomes (i.e., either positive or negative), CAD scheme computes a likelihood (detection or classification) score of the queried ROI being associated with a positive (or malignant) mass.
Figure 1. Illustration of a CAD scheme using the CBIR approach.
Algorithms 02 00828 g001
Unlike the conventional CAD schemes (i.e., the current commercialized CAD) that only highlight the locations of the detected suspicious regions depicted on each image, the CAD schemes using CBIR approaches can typically display CAD-generated detection scores along with a set of similar images or ROIs on the CAD workstation. For example, when applying an interactive CAD scheme to process one image (Figure 2), the CAD scheme automatically detects one suspicious mass region. If the detected region is queried by the observer, the CAD scheme applies all processing steps as shown in Figure 1 to analyze this queried ROI. Finally, the scheme will provide observers two likelihood scores and a set of the “most similar” reference ROIs depicting suspicious masses with verified outcome. Figure 2 shows the location and automatically segmented boundary contour of the queried ROI depicted on the image (mammogram), a set of 12 “similar” ROIs selected by the CBIR algorithm, and two likelihood scores. The detection score of 0.96 indicates that the likelihood of this region representing a true-positive mass region is 96%, while the classification score of 0.74 represents that the likelihood of this region being malignant is 74% (if this is a true-positive mass). The detection score is computed using the similar approach of the conventional CAD schemes (i.e., a globally pre-optimized artificial neural network (ANN) [40]) in the first step of the CAD scheme before the region is queried (Figure 1). The classification score ( P T P ) is typically computed based on the distribution of similarity levels (w) of K reference images (ROIs) selected by the CBIR algorithm using either one of the following two equations:
P T P = i = 1 N w i T P i = 1 N w i T P + j = 1 M w j F P ,   N + M = K   ,
P T P = 1 N i = 1 N w i T P 1 M j = 1 M w j F P ,   N = M = K 2   ,
where N is the number of malignant mass regions (TP) and M is the number of non-cancer regions (FP) including ROIs depicting either benign masses or CAD-cued false-positive regions [41].
Figure 2. Example of applying a CAD scheme using CBIR approach to detect and classify a suspicious breast mass region. A suspicious mass is automatically detected by CAD scheme and queried by the observer (pointed by the arrow). In CAD workstation, the mass region segmentation (boundary contour), 12 CBIR-selected similar ROIs, and both detection and classification scores are displayed. Among the 12 similar ROIs, 8 depict malignant masses (marked by Red frame), 2 depict benign masses (marked by Green frame), and 2 depict CAD-cued false-positive regions (marked by Blue frame).
Algorithms 02 00828 g002
Using the CBIR-based CAD scheme as demonstrated in Figure 1, radiologists can query any suspicious mass regions depicted on the testing images and view both CAD-generated results (the detection score) and CBIR-generated results (a set of similar reference images or ROIs) for each queried ROI. Although the CAD schemes using CBIR approaches provide radiologists “visual aid,” developing this type of CAD scheme is much more difficult. The performance and reliability of this type of CAD schemes depends on a number of factors (or issues) including the optimization of lesion segmentation, feature selection, reference database size, computational efficiency, and relationship between the clinical relevance and visual similarity of the CAD results. The following sections of this article discuss the research progress and remaining challenges in these issues.

3. Region Segmentation

Since in medical images the diseases are typically represented by local-oriented patterns surrounded and/or overlapped by the normal tissues, accurately segmenting the targeted suspicious regions is an important step in CAD development. Studies have shown that in general, the region segmentation error had substantially higher negative impact on (1) the CAD schemes that are used to classify between malignant and benign lesions than those that are applied to detect the presence of the suspicious lesions [42,43], and (2) the CAD schemes using the CBIR approaches than the conventional CAD schemes because the adaptive or “local” based optimization methods used in CBIR algorithm is much more sensitive to the segmentation error than many of the “globally” optimized classifiers (i.e., an artificial neural network) [37]. Therefore, segmentation of images into meaningful and homogenous regions is the first key method for image analysis within CBIR applications [44].
To improve accuracy and reliability of mass region segmentation, a large number of computing algorithms have been proposed, developed, and tested in this area, which include but not limited to multi-layer topographic region growth algorithm [45,46], active contour (snake) modeling [47,48], adaptive region growth [49], a radial gradient index (RGI)-based modeling [50], a dynamic programming-based boundary tracing (DPBT) algorithm [51], and level set algorithm [52]. Due to the diversity of breast masses and overlap of breast tissue in the 2D projected images as well as the limited testing datasets, it is very difficult to compare the performance and robustness of these segmentation methods as well as to find out which one is always superior to the other segmentation algorithms in different image databases [11,53]. The mass region segmentation accuracy determines whether CAD schemes enable to accurately extract and compute useful image features to detect and classify suspicious regions. For example, the spiculation level of mass boundary margin plays an important role in detecting and classifying breast masses [54]. However, since the majority of CAD schemes for detecting breast masses are applied to the sub-sampled images (i.e., sub-sampling the originally digitized image of 50µm × 50µm pixel size by 8 folds in two dimensions to generating the lower spatial resolution image with 400µm × 400µm pixel size), accurately segmenting the spiculated breast mass regions becomes quite difficult. A number of research groups have developed different image processing algorithms to detect spiculated masses and measure the spiculation related features [34,55,56,57]. These studies typically presented or concluded the segmentation results by showing a few examples and did not report or compare the actual accuracy of detecting spiculation levels of the mass regions. Recently, one study developed another algorithm to segment mass regions and detect the region spiculation levels [58]. The unique characteristic of this study is that the researchers applied the algorithm to a publicly available image dataset with the subjective classification results provided by the radiologists and used the receiver operating characteristic (ROC) method to assess the performance of the algorithm in classifying this set of images into two groups of images depicting either spiculated or non-spiculated (circumscribed) mass regions. Although the reported classification performance was relatively lower (with the area under ROC curve = 0.701±0.027), it provided an example and comparison base of how to assess and report the progress in segmenting spiculated masses for the future studies.
Despite of great research efforts, accurately segmenting mass regions remains a technical challenge [53] and its results substantially affects the accuracy of computed image features (i.e., mass region size or volume and boundary margin spiculation level). Hence, due to the lack of a reliable (or robust) algorithm for segmenting masses surrounded and overlapped by complex (e.g., heterogeneously dense) breast tissues using 2D projected mammograms [11], some of previous studies used the semi-automated method with manual correction to segment identified mass regions with fuzzy boundary in an attempt to improve accuracy of computed image features [32,34]. To avoid the issue of mass region segmentation, the other researchers used ROIs with fixed size (i.e., 512 × 512 pixels) and pixel-value distribution based template matching method (i.e., mutual information) in developing CAD schemes [59]. Due to the large variation of mass region sizes, it is extremely difficult to identify a universal fixed ROI size that can optimally compensate the diverse masses depicted on a large image database. One recent study compared the performance difference when applying the CAD schemes using either mutual information or Pearson’s correlation based CBIR algorithms to a set of testing ROIs with either the fixed size (512 × 512 pixels) or adaptively adjusted size based on the actual mass region segmentation results. The study demonstrated that the performance of CAD schemes using both of these two similarity measurement indices achieved significantly higher performance when applying the CAD schemes to the mass size-based ROIs [60]. Therefore, similar to the conventional CAD schemes [53], improving the accuracy of mass region segmentation is also the first important step in developing CAD schemes using CBIR approaches.

4. Feature Selection

By definition, CBIR is the process of retrieving related (or similar) images from the large databases using their image content. Since applying CBIR algorithms to search for similar images (or ROIs) by simply comparing large sets of pixels between a query image and the reference images in the database is not only computationally expensive but is also very sensitive to and often adversely impacted by noise in the image or changes in views of the imaged content [61], many of effective pixel value based similarity measures for template matching or image registration [62] are not suitable to be used in the CAD schemes. In the CAD applications, the image content should be represented by a set of extracted image features that meet following two criteria. First, since a highly performed CAD scheme using CBIR approach should not only achieve the high performance in detecting suspicious masses (measured by the area under ROC curve), but also generates smaller “semantic gap” between human vision (the high-level image scene understanding) and computer vision (the low-level pixel based image analysis) [63]. Thus, the CAD scheme should include at least some of the features that are closely correlate with visual similarity in a multi-feature based CBIR algorithm. Second, because the clinically and visually similar lesions or disease patterns can depict on different sections of the examined organ (the locations of medical images) with different orientations, the selected features should be invariant to the linear shift and rotation of the targeted lesions. For the potentially clinical utility, this criterion is very important. Since when applying CBIR algorithms in the CAD scheme, the requirement in the computational efficiency does not allow scheme spending significant time to optimally align the lesions depicted on the images. As a result, if the selected features or similarity measurement indices do not meet this criterion, CBIR algorithm may generate a quite lower similarity score between two actually similar lesions if they have different orientations and thus discards this similar reference image. Many morphological features computed from the segmented mass regions meet these two criteria. For example, one CBIR algorithm used in the CAD scheme selects a set of the K “most” similar mass regions that all have the similar or comparable size, circularity, and boundary margin spiculation level to the queried mass regions [41].
In selecting effective features used in CBIR schemes for medical images, great research efforts have been focused on identifying and extracting the better features to capture the texture of images and improve correlation to the human visual similarity. Among them, wavelets and Gabor filters have been extensively investigated and compared [64,65] in which study found that Gabor filters performed better and corresponded well to the human vision (in particular for the sensitivity of edge detection) [66]. Other popular texture features derived from the co-occurrence matrices [67] and Fourier transformation [68] have also been tested in developing CBIR schemes. Based on the analysis of medical domain knowledge, one recent study reported that the similarity evaluated based on the combination of four types of image features (color histogram, image texture, Fourier coefficients, and wavelet coefficients) using the feature vector dot product as a distance metric was correlated well with the observed visual similarity [63].
Recently, another study reported that one image feature (namely, the fractal dimension) could be more effectively and efficiently used as an objective index or quantitative measure to assess and control the texture similarity of reference ROIs selected by the CBIR algorithms without reducing CAD performance in detecting and classifying suspicious breast mass regions [69]. Fractal dimension is not only a well known feature to classify between malignant and benign breast masses [70], it is also a well recognized measure of the texture similarity that has relatively higher correlation to the visual similarity [71,72]. Unlike other pixel value based measurement features (or indices) that are computed in the spatial domain, the fractal dimension is the feature computed in the frequency domain. As a result, fractal dimension has two unique advantages to be used in the CBIR algorithms. First, it is invariant to the lesion position shift, rotation, and scale (or size) changes. Second, since similar to many of other morphological features, fractal dimension of all ROIs stored in the reference database can be pre-computed (off-line processing), the increase of computational cost and time by adding fractal dimension to the CBIR algorithm is ignorable. The study showed that adding fractal dimension into a multiply morphological feature based CBIR algorithm could increase CAD performance in detecting and classifying suspicious breast masses indicating that the fractal dimension was not redundant to other features extracted in spatial domain. In addition, using fractal dimension as a prescreening tool in the CBIR algorithm could also increase the textural (or “visual”) similarity of retrieved images as well as the computational efficiency by early discarding the large fraction of unrelated reference images [69] (which will be further discussed in the following section).

5. Reference Databases

It is well known that performance and robustness of the CAD schemes that use machine learning classifiers also depends on the size of training databases and the case difficulty level [73,74]. In general, as the increase of training database size and diversity, the performance and the robustness of the CAD schemes improve when they are tested using the independent testing datasets [75]. CAD schemes using CBIR approaches share two common characteristics. First, they use the “lazy” machine learning methods in that the decision of how to generalize beyond the training data is deferred until a new query (instance) is observed. Second, the new query is classified by comparing to and analyzing a small set of similar instances while ignoring others that are quite different from the query. One advantage of CAD schemes using CBIR approaches is that increasing (or updating) reference databases is relatively easy without repeating the often complicated process to re-generate the “global” optimization function. The new image data collected from the clinical practice may be directly added to the reference database to gradually increase the size and diversity of the reference database at any time. However, CAD schemes using CBIR approaches also have a major disadvantage when using the limited reference databases. Unlike the CAD schemes using “global” optimization based machine learning classifiers (i.e., artificial neural networks and support vector machines) that are relatively robust (insensitive) to the local image noise, the CAD schemes using CBIR approaches are much more sensitive to the local image noise and feature selection [76]. Study has shown that when applying to the same training database and the same independent testing dataset, the CAD scheme using a “global” data-based machine learning classifier achieved substantially higher performance than the CAD scheme using a CBIR approach (i.e., 75.8% versus 65.9% detection sensitivity at 0.3 false-positives per image) [37].
To investigate the relationship between the CAD performance and the selection of the reference databases, a number of studies has been recently conducted and reported. In one study, the researchers assembled a reference database that includes 3153 ROIs depicting either malignant masses (1592) or CAD-cued false-positive regions (1561) and an independent testing dataset involving 400 ROIs depicting 200 masses and 200 false-positive regions. A CAD scheme using a distance-weighted k-nearest neighbor (KNN) algorithm based CBIR approach was applied to retrieve ROIs from the reference database that are considered the “most similar” to each queried ROI of the testing dataset. The area under ROC curve ( A z ) was used as a measurement index to evaluate the CAD performance. The study included two experiments to investigate (1) the relationship between CAD performance and size of reference database and (2) whether randomly adding new cases (ROIs) into the reference database could always improve CAD performance. In the first experiment, the researchers systematically increased the size of reference database from 630 ROIs to 3153 ROIs and then tested the change of CAD performance. In the second experiment, based on the hypothesis that an ROI should be removed if it performs poorly compared to a group of similar ROIs in a large and diverse reference database, the researchers applied a strategy to identify and remove the “poorly effective” references from the database. The experimental results (Table 1) indicated that scheme performance monotonically improved from A z = 0.715 to 0.874 and then plateau happened when the database size reached approximately half of its maximum capacity. By removing 174 identified “poorly effective” ROIs from the reference database (reducing the original 3153 ROIs to 2979 ROIs), CAD performance significantly increases to A z = 0.914 (p < 0.01). The study demonstrated that increasing reference database size and removing “poorly effective” references could significantly improve the CAD scheme performance [77].
Table 1. The change of CAD performance as the increase of reference database size and eliminating a fraction of “poorly effective” reference ROIs (the “optimized” database).
Reference DatabaseOriginally (randomly) Selected Database“Optimized” Database
Number of ROIs63012621591252331532979
Area under ROC Curve0.7150.7940.8740.8750.8720.914
Standard Deviation0.0260.0230.0170.0170.0170.012
The contradictory result was also reported in this research topic. One research group focused on developing new methods to recognize and eliminate superfluous and/or detrimental samples (ROIs) from the reference database to improve searching efficiency [78,79]. The first study reduced size of the reference database from 1820 randomly selected ROIs to 600 ROIs with higher entropy [78]. The second study reported that by applying several intelligent reference ROI searching methods (including genetic algorithm, greedy selection, and a random mutation hill climbing), over 96% to 98% of ROIs stored in the previously optimized and reduced reference database could be further eliminated. The study reported that CAD performance maintained at the same level when using both the initially reduced reference databases with 600 ROIs and the new database including only 10 or 20 intelligently selected ROIs [79]. As a result, some researchers dedicated to build the large and diverse reference databases, while the other researchers suggested that assembling the small databases with intelligently selected cases was the better choice in developing CAD schemes. Besides several incomparable differences including (1) reference databases, (2) CBIR algorithms (multiple morphological features versus one similarity index of mutual information), and (3) overall achieved CAD performance levels ( A z = 0.87 versus A z = 0.76), the reported studies in this research topic [77,79] used different testing methods to test CAD performance changes. For example, one used an independent testing dataset [77], which means that although the reference database size was changed, the testing dataset remains the same; while the other used a leave-one-out testing or ten-fold cross-validation method [79], which means that as the reduction of reference database size, the number of testing ROIs also reduces. Since both testing methods could have potential bias when applying to the limited databases [80], it is clear that this issue needs to be further investigated.
Based on the machine learning concepts [76] and results of previous studies [75,77], one can conclude that in a limited reference database (or a multi-dimensional feature domain) the selected reference ROIs in the database are typically not uniformly distributed. As a result, the CBIR algorithms can retrieve reference ROIs that have very high level of similarity to some queried ROIs but relatively lower level of similarity to the other queried ROIs. All current CAD schemes using CBIR approaches compute the detection or classification score for a queried ROI only based on the relative ratios (scales) of the similarity levels between the selected positive and negative reference ROIs. To test the relationship between CAD performance and the actual similarity level between the queried ROI and the retrieved ROIs, the author and his colleagues recently applied a set of similarity thresholds to systematically remove the queried ROIs whose similarity level to their most “similar” reference ROIs are less than the threshold. The study used a reference database involving 1500 ROIs depicting verified masses and 1500 ROIs depicting CAD-cued false-positive masses but actually negative breast tissue. After normalization of similarity levels (or scores) from 0 to 1, the experimental results based on a pre-optimized KNN algorithm and the leave-one-out validation approach [41] showed that as threshold increase (removing more queried ROIs that have relatively lower similarity scores to the retrieved reference ROIs), the area under ROC curve was monotonically increased from 0.854±0.004 to 0.932±0.016 (Table 2). This preliminary study indicated that using a limited reference database and forcing the CAD scheme to make the decision based on the comparison of a set of reference ROIs that have lower similarity scores was likely to reduce the overall CAD performance. To take full advantages of the CBIR approach in developing CAD schemes, one needs to build a large and diverse reference database in which the selected reference ROIs are more uniformly distributed in the image feature space. Meanwhile, one also needs to make the CAD scheme enable to monitor and report the similarity score (level) between the queried ROI and the retrieved reference ROIs. By taking these two steps, using CAD schemes can minimize the risk of misleading the radiologists and increase their confidence in accepting CAD-cued results, in particular when CAD is used as a “visual aid” tool. Therefore, assessing the reliability of the CAD-generated detection and/or classification scores based on the similarity measurement is important in application of the CBIR-based CAD schemes when the limited database was used. This issue needs to be further investigated.
Table 2. The change of CAD performance as the increase of threshold values on the queried ROIs.
Threshold on Similarity Level00.10.20.30.40.50.60.70.80.9
Area under ROC Curve0.8540.8590.8590.8640.8770.8880.9080.9110.9190.932
Standard Deviation0.0040.0040.0050.0070.0080.0110.0110.0140.0160.016

6. Similarity Searching Methods and Computational Efficiency

Another long-standing challenge in developing CBIR systems is the definition of a suitable distance function to measure the similarity levels between images in an application context which complies with the human perception of similarity. The most common types of queries based on image similarity are k-nearest neighbor and range queries. A k-nearest neighbor query involves searching for the k most similar reference ROIs to the queried ROI. A range query consists of searching for all reference ROIs similar to the queried ROI up to a given degree (or range) [63]. Current CAD schemes using CBIR approaches typically use the k-nearest neighbor type searching method. The CAD schemes force the CBIR algorithms to retrieve the fixed k “most similar” reference ROIs without considering the given degree of similarity level between the queried ROI and each of the retrieved reference ROIs. This can be an issue that reduces the reliability of CAD-generated results including both clinical relevance of detection scores and visual similarity of retrieved reference ROIs.
In the application of multi-feature based k-nearest neighbor (KNN) algorithm, one of the most popular and relatively effective methods to measure the similarity level between two compared ROIs is the Euclidean distance based measurement [33]. In this method, similarity is measured by the difference in feature values, f r ( x ) , between a queried ROI ( y q ) and a reference ROIs ( x i ) in a multi-dimensional (n) feature space.
d ( y q , x i ) = r = 1 n ( f r ( y q ) f r ( x i ) ) 2
The smaller the difference (“distance”), the higher the computed “similarity” level is between the two compared ROIs. Although this approach is easy to implement and relatively robust, the limitation is that the distance between two instances (the queried ROI and the reference ROI) is calculated based on all attributes (the selected features) of the ROIs with equal weights. If the contribution of the selected features is not the same, this equally weighted Euclidean distance based measurement can generate misleading results [76].
To improve the performance and reliability of similarity measurement, a number of other advanced technologies or approaches have been investigated and tested. One type of approaches is using principal component analysis (PCA) [81] or minimum description length (MDL) [82] to reduce the dimensionality of feature space. Recently, one research group compared several supervised distance metric learning methods and investigated their feasibility and advantages when applying to the CBIR algorithms used in CAD scheme of mammograms [83]. In this framework, the feature data is supplemented by side information in the form of pairwise of “similarity” and “dissimilarity” relationship between two compared ROIs. The goal is to learn a distance function that achieves the optimal results in searching for the clinical relevant and feature similar ROIs. The researchers compared three learning methods namely, the global distance metric learning, local distance metric learning, and boosted distance metric learning. The results showed that using a relatively large reference database with 2522 ROIs, all three distance metric learning methods generated higher performance levels than using the Euclidean distance based measurement in classifying between ROIs depicting either malignant masses or benign masses and normal breast tissue with CAD-cued false-positive regions. Among three distance metric learning methods, the boosted distance metric learning method was superior to two other methods.
Although the CBIR algorithms implemented in CAD schemes share many common approaches and requirements of CBIR algorithms used for other applications (i.e., biomedical informatics or PACS), CAD schemes requires much higher computational efficiency. Thus, some of effective techniques commonly used in other types of CBIR approaches (i.e., relevance feedback [81,84]) are not suitable for CAD. To make the system acceptable in the routine clinical practice, the CAD scheme must produce the detection and/or diagnostic results in “real-time” (i.e., less than one or two seconds) after the observer queries a suspicious ROI. As the rapid increase of the size of the clinical medical image databases (i.e., more than 12,000 digital medical images produced per day at the Radiology Department of one University Hospital [11]), developing more efficient searching method is an important and practical issue in developing CAD schemes using CBIR approach. Since CAD generates the detection or classification results for each queried ROI only based on a small number of retrieved “similar” reference ROIs, extensively searching for and comparing all reference ROIs stored in the reference database wastes the majority of processing time and substantially increases the computational cost. Besides the selection of computationally efficient image features, another effective approach to reduce computational cost is to make CBIR algorithm enable to early discard a substantial fraction of un-related (low-correlated) ROIs to the queried ROI before conducting the detailed similarity comparison using a multi-feature based distance metric.
One research group developed and reported a special metric access method (MAM) to search for the similar reference ROIs. The method used a distance function to organize the reference ROIs in a tree-like scheme that allows the use of the triangular inequality property to prune subsets of ROIs that do not need to be compared with the queried ROI. The study demonstrated that using this method CBIR scheme could early discard a large fraction of un-related ROIs and provided fast and more effective retrieval of the similar reference ROIs to the queried ROI [85]. In the CAD schemes, another popular approach is to add a prescreening step using one or two texture or morphological features. For example, using the fractal dimension as a prescreening feature to early discard all reference ROIs in which the difference of their fractal dimension to the queried ROI is larger than the predetermined threshold, one study showed that at least 53% of reference ROIs could be early discarded for all 3000 queried ROIs without reducing the overall CAD performance [69].
As the advance of computing technologies, researchers have also developed more powerful and user-friendly open-source frameworks that enable parallel execution of early discarding un-related reference images and conducting image similarity comparison among several reference databases. For example, a CBIR system has been developed (“Diamond” [86]), which embodies the new software architecture for rapidly scanning large volumes of distributed data and filtering the data with domain-specific software (i.e., CAD schemes). The key concept of the “Diamond” architecture is the concept of early discard: the ability to reject irrelevant data (or reference ROIs) very close to their point of storage, thus creating low data transmission overhead in executing CBIR algorithm for similarity comparison [87]. This system has been applied and tested in a number of CBIR applications including CAD of mammograms [83].

7. Assessment of CAD Performance

The clinical relevance and visual similarity are the two common assessment indices to evaluate performance of CAD schemes using CBIR approaches. The clinical relevance indicates the scheme’s capability of correctly detecting and/or classifying suspicious abnormalities (i.e., breast masses). It is commonly evaluated using either ROC method (i.e., comparing the areas under ROC curves) or FROC method (i.e., comparing detection sensitivity levels under a predetermined CAD operating threshold or a fixed false-positive detection rate). When the CAD provides “visual aid” to the radiologists, assessing the visual similarity level between the queried ROI and the retrieved similar reference ROIs becomes an important issue, which has great impact on radiologists’ confidence of whether to accept or reject CAD-cued results in their decision making [39]. A number of research groups have investigated and applied different methods to assess the improvement of visual similarity using different CBIR approaches.
Since visual similarity is a subjective concept, it often has large inter-observer variability [88]. To minimize the impact of the inter-observer variability, two evaluation methods namely, comparing with average subjective rating results provided by a group of observers (i.e., radiologists) and a two-alternative forced-choice (2AFC) observer preference method, have been reported and applied to assess the visual similarity of CBIR selected similar images in developing CAD schemes. The first method aims to establish a “ground-truth” and then compare the “absolute” difference or correlation of similarity ratings between the CAD schemes and human observers. One research group has conducted a number of studies to search for better psychophysical similarity measure using this method [89]. In the study, a set of ROIs involving 60 pairs of breast masses was selected and five radiologists subjectively rated the similarity scores for these 60 pairs of masses (using normalized 0 to 1 scale). Then, an artificial neural network (ANN) was employed to learn the relationship between radiologists’ average subjective similarity ratings and computer-extracted image features. The study showed that comparing to the commonly used similarity measure based on Euclidean distance, using ANN achieved substantially higher similarity correlation with the radiologists’ subjective rating (r = 0.798 versus r = 0.644). The second visual similarity evaluation method (2AFC) only conducts the relative comparison of whether a new (or modified) searching algorithm achieved improved visual similarity [90]. In a 2AFC observer preference or visual similarity assessment experiment, a panel of observers independently reviews two sets of “similar” reference ROIs that are selected by two CBIR algorithms and simultaneously displayed side-by-side on the image screen. Each observer is forced to make a decision on which set is more visually similar to the queried ROI. Using a statistical data analysis method (i.e., one sample test for a binomial proportion with correction for continuity [91]), the average observer preference results are then used to compute and determine whether the reference ROIs selected by two CBIR algorithms have significant difference in visual similarity levels [34,41].
The researchers have also compared the correlations of subjectively determined similarity ratings obtained by these two assessment methods (the “absolute” similarity rating and the 2AFC based “relative” similarity rating). Using a very limited testing dataset with eight pairs of masses and eight pairs of micro-calcification clusters, the study reported that the similarity rating scores of two assessment methods were highly correlated. The Pearson’s correlation coefficients were 0.94 and 0.98 for rating similarity levels of masses and micro-calcification clusters, respectively [92]. This preliminary comparison result is very encouraging if it can be validated in future studies with large and/or different testing datasets. In theory, the “absolute” rating with “ground-truth” is a more reliable choice. However, building “ground-truth” is a very difficult and time-consuming task. Its reliability can also be severely affected by the inter-reader variability. Therefore, the 2AFC method is a more practical and easy implemented approach to assess and compare the potential improvement of “visual similarity” achieved by the CAD schemes using different CBIR approaches.

8. Summary

Both CAD and CBIR have been important research topics in the medical imaging areas for the last decade. Recently, combining CAD and CBIR technology has also been attracting much research interest. CAD schemes using CBIR approaches have been investigated and developed for detecting abnormalities depicted on mammograms, lung CT images, and many other types of radiographic and pathological medical images. In CAD of mammograms, current commercialized CAD schemes achieved very high performance on detecting micro-calcification clusters but relatively lower performance on mass detection (including the lower specificity and cuing majority of subtle masses only on one view). In order to improve CAD performance and increase radiologists’ confidence in accepting CAD-cued results, the CAD schemes using CBIR approaches may allow radiologists to query any suspicious mass region (whether initially cued or not cued by the CAD scheme) and provide radiologists both detection/classification scores and a set of similar reference ROIs depicting suspicious masses with verified outcome. Preliminary studies have showed that such “visual aid” approach in CAD applications could be helpful to radiologists in interpreting mammograms. However, developing CAD schemes using CBIR approaches faces a number of technical challenges (or issues) including the accurate region segmentation, selection of features that are effective on both target classification and correlation with visual similarity, assembly of an optimal reference database, and improvement of computational efficiency. Despite of the substantial progress made in developing CBIR algorithms used in medical informatics or PACS as well as the CAD schemes using CBIR approaches in recent years, many of these technical challenges remain. Comparing to the much matured TBIR (text-based image retrieval) searching method, CBIR is still in the early development stage. Therefore, to develop highly performed and clinically acceptable CAD schemes using CBIR approaches, much more research work is needed.

Acknowledgement

Author’s current research work in developing CAD schemes using CBIR approaches is supported in part by the research grants from the National Center for Research Resources (1 UL1 RR024153) and from the National Cancer Institute, National Institutes of Health, USA (CA77850 and CA101733) to the University of Pittsburgh.

References

  1. Love, H.J.; Antipow, I.; Hersh, W.; Smith, C.A.; Mailhot, M. Automated semantic indexing of imaging reports to support retrieval of medical images in the multimedia electronic medical record. Meth Inform Med 1999, 38, 303–307. [Google Scholar]
  2. El-Kwae, E.; Xu, H.; Kabuka, M.R. Content-based retrieval in picture archiving and communication systems. J Digit Imaging 2000, 13, 70–81. [Google Scholar] [CrossRef]
  3. Ogiela, M.R.; Tadeusiewicz, R. Semantic-oriented syntactic algorithms for content recognition and understanding of images in medical database. In Proceedings of the second International Conference on Multimedia and Exposition, IEEE Computer Society, Tokyo, Japan, 2001; pp. 621–624.
  4. Hersh, W.; Mailhot, M.; Arnott-Smith, C.; Lowe, H. Selective automated indexing of findings and diagnoses in radiology reports. J Biomed Informatics 2001, 34, 262–273. [Google Scholar] [CrossRef] [PubMed]
  5. Tagare, H.D.; Jaffe, C.; Duncan, J. Medical image databases: a content-based retrieval approach. J. Am. Med. Informatics Assoc. 1997, 4, 184–198. [Google Scholar] [CrossRef]
  6. Lehmann, T.M.; Guld, M.O.; Deselaers, T.; Keysers, D.; Schubert, H.; Spitzer, K.; Ney, H.; Wein, B.B. Automatic categorization of medical images for content-based retrieval and data mining. Comput Med Imaging Graph 2005, 29, 143–155. [Google Scholar] [CrossRef] [PubMed]
  7. Long, L.R.; Antani, S.K.; Thoma, G.R. Image informatics at a national research center. Comput Med Imaging Graph 2005, 29, 171–193. [Google Scholar] [CrossRef] [PubMed]
  8. Muller, H.; Rosset, A.; Garcia, A.; Vallie, J.; Geissbuhler, A. Benefits of content-based visual data access in radiology. RadioGraphics 2005, 25, 849–858. [Google Scholar] [CrossRef] [PubMed]
  9. Lam, M.O.; Disney, T.; Raicu, D.S.; Furst, J.; Channin, D.S. BRISC – An open source pulmonary nodule image retrieval framework. J Digit Imaging 2007, 20, 63–71. [Google Scholar] [CrossRef] [PubMed]
  10. Pourghassem, H.; Ghassemian, H. Content-based medical image classification using a new hierarchical merging scheme. Comput Med Imaging Graph 2008, 32, 651–661. [Google Scholar] [CrossRef] [PubMed]
  11. Muller, H.; Michoux, N.; Bandon, D.; Geissbuhler, A. A review of content-based image retrieval systems in medical applications – clinical benefits and future directions. Int J Med Inform 2004, 73, 1–23. [Google Scholar] [CrossRef] [PubMed]
  12. Nishikawa, R.M. Current status and future directions of computer-aided diagnosis in mammography. Comput Med Imaging Graph 2007, 31, 224–235. [Google Scholar] [CrossRef] [PubMed]
  13. Wiemker, R.; Rogalla, P.; Blaffert, T.; Sifri, D.; Hay, O.; Shah, E.; Truyen, R.; Fleiter, T. Aspects of computer-aided detection (CAD) and volumetry of pulmonary nodules using multi-slice CT. Br J Radiology 2005, 78, S46–S56. [Google Scholar] [CrossRef] [PubMed]
  14. Sluimer, I.C.; Prokop, M.; Hartmann, I.; Ginneken, B. Automated classification of hyperlucency, fibrosis, ground glass, solid, and focal lesions in high-resolution CT of the lung. Med Phys 2006, 33, 2610–2620. [Google Scholar] [CrossRef]
  15. Zheng, B.; Leader, J.; McMurray, J.; Park, S.C.; Fuhrman, C.R.; Gur, D.; Sciurba, F.C. Automated detection and quantitative assessment of pulmonary airways depicted on CT images. Med Phys 2007, 34, 2844–2852. [Google Scholar] [CrossRef] [PubMed]
  16. Buhmann, S.; Liang, J.; Wolf, M.; Salganicoff, M.; Kirchhoff, C.; Reiser, M.; Becker, C.H. Clinical evaluation of a computer-aided diagnosis (CAD) prototype for the detection of pulmonary embolism. Acad Radiol 2007, 14, 651–658. [Google Scholar] [CrossRef] [PubMed]
  17. Bogoni, L.; Cathier, P.; Dundar, M.; Jerebko, A.; Lakare, S.; Liang, J.; Periaswamy, S.; Baker, M.E.; Macari, M. Computer-aided detection (CAD) for CT colonography: a tool to address a growing need. Br J Radiology 2005, 78, S57–S62. [Google Scholar] [CrossRef] [PubMed]
  18. Raimondo, F.; Gavrielides, M.A.; Karayannopoulou, G. Automated evaluation of Her-2/neu status in breast tissue from fluorescent in situ hybridization images. IEEE Trans Image Processing 2005, 14, 1288–1299. [Google Scholar] [CrossRef]
  19. Wang, X.; Zheng, B.; Li, S.; Mulvihill, J.J.; Liu, H. Development and assessment of an integrated computer-aided detection scheme for digital microscopic images of metaphase chromosomes. J Electronic Imaging 2008, 17, 043008-1-9. [Google Scholar]
  20. Freer, T.M.; Ulissey, M.J. Screening mammography with computer-aided detection: prospective study of 12,860 patients in a community breast center. Radiology 2001, 220, 781–786. [Google Scholar] [CrossRef] [PubMed]
  21. Gur, D.; Sumkin, J.H.; Rockette, H.E.; Ganott, M.; Hakim, C.; Hardesty, L.; Poller, W.R.; Shah, R.; Wallace, L. Changes in breast cancer detection and mammography recall rates after the introduction of a computer-aided detection system. J Natl Cancer Inst 2004, 96, 185–190. [Google Scholar] [CrossRef] [PubMed]
  22. Khoo, L.A.; Taylor, P.; Given-Wilson, R.M. Computer-aided detection in the United Kingdom National Breast Screening Programme: prospective study. Radiology 2005, 237, 444–449. [Google Scholar] [CrossRef] [PubMed]
  23. Ko, J.M.; Nicholas, M.J.; Mendel, J.B.; Slanetz, P.J. Prospective assessment of computer-aided detection in interpretation of screening mammograms. Am. J. Roentgenol. 2006, 187, 1483–1491. [Google Scholar]
  24. Gur, D.; Stalder, J.S.; Hardesty, L.A.; Zheng, B.; Sumkin, J.H.; Chough, D.M.; Shindel, B.E.; Rockette, H.E. Computer-aided detection performance in mammographic examination of masses: assessment. Radiology 2004, 233, 418–423. [Google Scholar] [CrossRef] [PubMed]
  25. Zheng, B.; Leader, J.K.; Abrams, G.S.; Lu, A.H.; Wallace, L.P.; Maitz, G.S.; Gur, D. Multiview-based computer-aided detection scheme for breast masses. Med Phys 2006, 33, 3135–3143. [Google Scholar] [CrossRef] [PubMed]
  26. Nishikawa, R.M.; Kallergi, M. Computer-aided detection in its present form is not an effective aid for screening mammography. Med Phys 2006, 33, 811–814. [Google Scholar] [CrossRef]
  27. Fenton, J.J.; Taplin, S.H.; Carney, P.A.; Abraham, L.; Sickles, E.A.; D’Orsi, C.; Berns, E.A.; Cutter, G.; Hendrick, R.E.; Barlow, W.E.; Elmore, J.G. Influence of computer-aided detection on performance of screening mammography. N. Engl. J. Med. 2007, 356, 1399–1409. [Google Scholar] [CrossRef] [PubMed]
  28. Tourassi, G.D.; Vargas-Voracek, R.; Catarious, D.M.; Floyd, C.E. Computer-assisted detection of mammographic masses: a template matching scheme based on mutual information. Med Phys 2003, 30, 2123–2130. [Google Scholar] [CrossRef] [PubMed]
  29. El-Napa, I.; Yang, Y.; Galatsanos, N.P.; Nishikawa, R.M.; Wernick, M.N. A similarity learning approach to content-based image retrieval: application to digital mammography. IEEE Trans Med Imaging 2004, 23, 1233–1244. [Google Scholar] [CrossRef] [PubMed]
  30. Wei, C.; Li, C.; Wilson, R. A general framework for content-based medical image retrival with its application to mammograms. Proc SPIE 2005, 5748, 134–143. [Google Scholar]
  31. Alto, H.; Rangayyan, R.M.; Desautels, J.E. Content-based retrieval and analysis of mammographic masses. J. Electron. Imaging 2005, 14, 023016. [Google Scholar] [CrossRef]
  32. Tao, Y.; Lo, S.B.; Freedman, M.T.; Xuan, J. A preliminary study of content-based mammographic masses retrieval. Proc SPIE 2007, 6514, 65141Z. [Google Scholar]
  33. Kinoshita, S.K.; de Azevedo-Marques, P.M.; Pereira, R.R.; Rodrigues, J.; Rangayyan, R. Content-based retrieval of mammograms using visual features related to breast density patterns. J Digit Imaging 2007, 20, 172–190. [Google Scholar] [CrossRef] [PubMed]
  34. Zheng, B.; Mello-Thoms, C.; Wang, X.; Abrams, G.S.; Sumkin, J.H.; Chough, D.M.; Ganott, M.A.; Lu, A.; Gur, D. Interactive computer aided diagnosis of breast masses: computerized selection of visually similar image sets from a reference library. Acad Radiol 2007, 14, 917–927. [Google Scholar]
  35. Mazurowski, M.A.; Habas, P.A.; Zurada, J.M.; Tourassi, G.D. Decision optimization of case-based computer-aided decision systems using genetic algorithm with application to mammography. Phys Med Biol 2008, 53, 895–908. [Google Scholar] [CrossRef] [PubMed]
  36. Rosa, N.A.; Felipe, J.C.; Traina, A.J.; Rangayyan, R.M.; Azevedo-Marques, P.M. Using relevance feedback to reduce the semantic gap in content-based image retrieval of mammographic masses. Conf Proc IEEE Med Biol Soc 2008, 406–409. [Google Scholar]
  37. Park, S.C.; Pu, J.; Zheng, B. Improving performance of computer-aided detection scheme by combining results from two machine learning classifiers. Acad Radiol 2009, 16, 266–274. [Google Scholar] [CrossRef] [PubMed]
  38. Giger, M.L.; Huo, Z.; Vyborny, C.J.; Lan, L.; Bonta, I.R.; Horsch, K.; Nishikawa, R.M.; Rosenbourgh, I. Intelligent CAD workstation for breast imaging using similarity to known lesions and multiple visual prompt aides. Proc SPIE 2002, 4684, 768–773. [Google Scholar]
  39. Zheng, B.; Abrams, G.; Britton, C.A.; Hakim, C.M.; Lu, A.; Clearfield, R.J.; Drescher, J.; Maitz, G.S.; Gur, D. Evaluation of an interactive computer-aided diagnosis scheme for mammography: a pilot study. Proc SPIE 2007, 6515, 65151M. [Google Scholar]
  40. Zheng, B.; Sumkin, J.H.; Good, W.F.; Maitz, G.S.; Chang, Y.H.; Gur, D. Applying computer-assisted detection schemes to digitized mammograms after JPEG data compression: an assessment. Acad Radiol 2000, 7, 595–602. [Google Scholar] [CrossRef]
  41. Zheng, B.; Lu, A.; Hardesty, L.A.; Sumkin, J.H.; Hakim, C.M.; Ganott, M.A.; Gur, D. A method to improve visual similarity of breast masses for an interactive computer-aided diagnosis environment. Med Phys 2006, 33, 111–117. [Google Scholar] [CrossRef]
  42. Jiang, Y.; Nishikawa, R.M.; Papaioannou, J. Dependence of computer classification of clustered microcalcifications on the correct detection of microcalcifications. Med Phys 2001, 28, 1949–1957. [Google Scholar] [CrossRef] [PubMed]
  43. Zheng, B.; Pu, J.; Park, S.C.; Zuley, M.; Gur, D. Assessment of the relationship between lesion segmentation accuracy and computer-aided diagnosis scheme performance. Proc SPIE 2008, 6915, 6915–30. [Google Scholar]
  44. Hill, P.R.; Canagarajah, N.; Bull, D.R. Image segmentation using a texture gradient based watershed transform. IEEE Trans Image Processing 2003, 12, 1618–1633. [Google Scholar] [CrossRef] [PubMed]
  45. Zheng, B.; Chang, Y.H.; Gur, D. Computerized detection of masses in digitized mammograms using single image segmentation and multi-layer topographic feature extraction. Acad Radiol 1995, 2, 959–966. [Google Scholar]
  46. Eltonsy, N.H.; Tourassi, G.D.; Elmaghraby, A.S. A concentric morphology model for the detection of masses in mammography. IEEE Trans Med Imaging 2007, 26, 880–889. [Google Scholar] [CrossRef] [PubMed]
  47. Lobregt, S.; Viergever, M.A. A discrete dynamic contour model. IEEE Trans. Med Imaging 1995, 14, 12–24. [Google Scholar] [CrossRef] [PubMed]
  48. Sahiner, B.; Petrick, N.; Chan, H.P.; Hadjiiski, L.M.; Paramagul, C.; Helvie, M.A.; Gurcan, M.N. Computer-aided characterization of mammographic masses: accuracy of mass segmentation and its effects on characterization. IEEE Trans. Med Imaging 2001, 20, 1275–1284. [Google Scholar] [CrossRef] [PubMed]
  49. Brake, G.M.; Karssemeijer, N. Segmentation of suspicious densities in digital mammograms. Med Phys 2001, 28, 259–266. [Google Scholar] [CrossRef]
  50. Yuan, Y.; Giger, M.L.; Li, H.; Suzuki, K.; Sennett, C. A dual-stage method for lesion segmentation on digital mammograms. Med Phys 2007, 34, 4180–4193. [Google Scholar] [CrossRef]
  51. Dominguez, A.R.; Nandi, A.K. Improved dynamic-programming-based algorithms for segmentation of masses in mammograms. Med Phys 2007, 34, 4265–4268. [Google Scholar] [CrossRef]
  52. Yuan, Y.; Giger, M.L.; Li, H.; Suzuki, K.; Sennett, C. A dual-stage method for lesion segmentation on digital mammograms. Med Phys 2007, 34, 4180–4193. [Google Scholar] [CrossRef]
  53. Elter, M.; Horsch, A. CADx of mammographic masses and clustered microcalcifications: a review. Med Phys 2009, 36, 2052–2068. [Google Scholar] [CrossRef] [PubMed]
  54. Vyborny, C.J.; Doi, T.; O’Shaughnessy, K.F. Breast cancer: importance of spiculation in computer-aided detection. Radiology 2000, 215, 703–707. [Google Scholar] [CrossRef] [PubMed]
  55. Kegelmeyer, W.P.; Pruneda, J.M.; Bourland, P.D.; Hillis, A.; Riggs, M.W.; Nipper, M.L. Computer-aided mammographic screening for spiculated lesions. Radiology 1994, 191, 331–337. [Google Scholar] [CrossRef] [PubMed]
  56. Rangayyan, R.M.; Mudigonda, N.R.; Desautels, J.E. Boundary modeling and shape analysis methods for classification of mammographic masses. Med Biol Eng Comput 2000, 38, 487–496. [Google Scholar] [CrossRef] [PubMed]
  57. Sahiner, B.; Chan, H.P.; Petrick, N.; Helvie, M.A.; Hadjiiski, L.M. Improvement of mammographic mass characterization using spiculation measures and morphological features. Med Phys 2001, 28, 1455–1465. [Google Scholar] [CrossRef] [PubMed]
  58. Jiang, L.; Song, E.; Xu, X.; Ma, G.; Zheng, B. Automated detection of breast mass spiculation levels and evaluation of scheme performance. Acad Radiol 2008, 15, 1534–1544. [Google Scholar] [CrossRef] [PubMed]
  59. Tourassi, G.D.; Harrawood, B.; Singh, S.; Lo, J.Y.; Floyd, C.E. Evaluation of information-theoretic similarity measures for content-based retrieval and detection of masses in mammograms. Med Phys 2007, 34, 140–150. [Google Scholar] [CrossRef] [PubMed]
  60. Wang, X.; Park, S.C.; Zheng, B. Improving performance of content-based image retrieval schemes in searching for similar breast mass regions: an assessment. Phys Med Biol 2009, 54, 949–961. [Google Scholar] [CrossRef] [PubMed]
  61. Deserno, T.M.; Antani, S.; Long, R. Ontology of gaps in content-based image retrieval. J Digit Imaging 2009, 22, 202–215. [Google Scholar] [CrossRef] [PubMed]
  62. Filev, P.; Hadjiiski, L.; Sahiner, B.; Chan, H.P.; Helvie, M.A. Comparison of similarity measures for the task of template matching of masses on serial mammograms. Med Phys 2005, 32, 515–529. [Google Scholar] [CrossRef]
  63. Felipe, J.C.; Traina, C.; Traina, A.J. A new family of distance functions for perceptual similarity retrieval of medical images. J Digit Imaging 2009, 22, 183–201. [Google Scholar] [CrossRef] [PubMed]
  64. Ma, W.; Manjunath, B. Texture features and learning similarity. In Proc IEEE Conference on Computer Vision and Pattern Recognition, San Francisco, CA, 1996; pp. 425–430.
  65. Ortega, M.; Rui, Y.; Chakrabarti, K. Supporting ranked Boolean similarity queries in MARS. IEEE Trans Knowledge Data Eng 1998, 10, 905–925. [Google Scholar] [CrossRef]
  66. Daugman, J.G. High confidence visual recognition of persons by a test of statistical independence. IEEE Trans Pattern Anal. Machine Intel. 1993, 15, 1148–1161. [Google Scholar] [CrossRef]
  67. Kuo, W.; Chang, R.; Lee, C.C.; Moon, W.K.; Chen, D.R. Retrieval technique for the diagnosis of solid breast tumors on sonogram. Ultrasound Med. Biol. 2002, 28, 903–909. [Google Scholar] [CrossRef]
  68. Milanese, R.; Cherbuliez, M. A rotation, translation and scale-invariant approach to content-based image retrieval. J. Visual Commun. Image Represent 1999, 10, 186–196. [Google Scholar] [CrossRef]
  69. Park, S.C.; Wang, X.; Zheng, B. Assessment of performance improvement in content-based medical image retrieval schemes using fractal dimension. Acad Radiol 2009, 16. in press. [Google Scholar] [CrossRef] [PubMed]
  70. Velanovich, V. Fractal analysis of mammographic lesions: a feasibility study quantifying the difference between benign and malignant masses. Am. J. Med. Sci. 1996, 311, 211–214. [Google Scholar] [CrossRef]
  71. Chevallet, J.P.; Maillot, N.; Lim, J.H. Concept Propagation Based on Visual Similarity Application to Medical Image Annotation. In Proc Third Asia Information Retrieval Symposium, Singapore, October 16-18, 2006; 4182, pp. 514–521.
  72. Soares, F.; Andruszkiewic, P.; Freire, M.M. Self-Similarity Analysis Applied to 2D Breast Cancer Imaging. In Proc International Conf. on Systems and Networks Communications, Cap Esterel, French Riviera, France, August 25-31, 2007; pp. 1–6.
  73. Nishikawa, R.M.; Giger, M.L.; Doi, K.; Metz, C.E.; Yin, F.; Vyborny, C.J.; Schmidt, R.A. Effect of case selection on the performance of computer-aided detection schemes. Med Phys 1994, 21, 265–269. [Google Scholar] [CrossRef]
  74. Kupinski, M.A.; Giger, M.L. Feature selection with limited database. Med Phys 1999, 26, 2176–2182. [Google Scholar]
  75. Zheng, B.; Chang, Y.H.; Good, W.F.; Gur, D. Adequacy testing of training set sample sizes in the development of a computer-assisted diagnosis scheme. Acad Radiol 1997, 4, 497–502. [Google Scholar] [CrossRef]
  76. Mitchell, T.M. Machine Learning; WCB/McGraw-Hill: Boston, MA, 1997; pp. 230–248. [Google Scholar]
  77. Park, S.C.; Sukthankar, R.; Mummert, L.; Satyanarayanan, M.; Zheng, B. Optimization of reference library used in content-based medical image retrieval scheme. Med Phys 2007, 34, 4331–4339. [Google Scholar] [CrossRef]
  78. Tourassi, G.D.; Harrawood, B.; Singh, S.; Lo, J.Y. Information-theoretic CAD system in mammography: entropy-based indexing for computational efficiency and robust performance. Med Phys 2007, 34, 3193–3204. [Google Scholar] [CrossRef]
  79. Mazurowski, M.A.; Zurada, J.M.; Tourassi, G.D. Selection of examples in case-based computer-aided decision systems. Phys Med Biol 2008, 53, 6079–6096. [Google Scholar] [CrossRef] [PubMed]
  80. Li, Q.; Doi, K. Reduction of bias and variance for evaluation of computer-aided diagnostic schemes. Med Phys 2006, 33, 868–875. [Google Scholar] [CrossRef]
  81. Sinha, U.; Kangarloo, H. Principal component analysis for content-based image retrieval. RadioGraphics 2002, 22, 1271–1289. [Google Scholar]
  82. Brodley, C.; Kak, A.; Shyu, C.; Dy, J.G.; Broderick, L.S.; Aisen, A.M. Content-based retrieval from medical image database: A synergy of human interaction, machine learning and computer vision. In Proc 16th National Conference on Artificial Intelligence and 11th Conference on Innovative Applications of Artificial Intelligence, Orlando, FL, July 18-22, 1999; pp. 760–767.
  83. Yang, L.; Jin, R.; Sukthankar, R.; Zheng, B.; Mummert, L.; Satyanarayanan, M.; Chen, M.; Jukic, D. Learning distance metrics for interactive search-assisted diagnosis of mammograms. Proc SPIE 2007, 6514, 65141H. [Google Scholar]
  84. Deserno, T.M.; Guild, M.O.; Plodowski, B.; Spitzer, K.; Wein, B.B.; Schubert, H.; Ney, H.; Seidi, T. Extended query refinement for medical image retrieval. J Digit Imaging 2008, 21, 280–289. [Google Scholar] [CrossRef] [PubMed]
  85. Traina, C.; Traina, A.; Araujo, M.; Bueno, J.M.; Chino, F.; Razente, H.; Azevedo-Marques, P.M. Using an image-extended relational database to support content-based image retrieval in a PACS. Comput Methods Programs Biomed 2005, 80, S71–S83. [Google Scholar] [CrossRef]
  86. Diamond – interactive search of non-indexed data, http://diamond.cs.cmu.edu.
  87. Huston, L.; Sukthankar, R.; Wickremesinghe, R.; Satyanarayanan, M.; Ganger, G.; Riedel, E.; Ailamaki, A. Diamond: a storage architecture for early discard in interactive search. In Proc of the 3rd USENIX Conference on File and Storage Technologies, San Francisco, CA, March, 2004; Available online from: http://diamond.cs.cmu.edu/papers/fast2004-diamond.pdf.
  88. Zheng, B.; Abrams, G.; Leader, J.K.; Park, S.C.; Maitz, G.S.; Gur, D. Mass margins spiculation: agreement between ratings by observers and a computer scheme. Proc SPIE 2007, 6514, 65141P. [Google Scholar]
  89. Muramatsu, C.; Li, Q.; Suzuki, K.; Schmidt, R.A.; Shiraishi, J.; Newstead, G.M.; Doi, K. Investigation of psychophysical measure for evaluation of similar images for mammographic masses: preliminary results. Med Phys 2005, 32, 2295–2304. [Google Scholar] [CrossRef]
  90. Paquerault, S.; Yarusso, L.M.; Papaioannou, J.; Jiang, Y.; Nishikawa, R.M. Radial gradient-based segmentation of mammographic microcalcifications: observer evaluation and effect on CAD performance. Med Phys 2004, 31, 2648–2657. [Google Scholar] [CrossRef]
  91. Rosner, B. Fundamentals of biostatistics; Duxbury, Pacific Grove, CA, 2000. [Google Scholar]
  92. Muramatsu, C.; Li, Q.; Schmidt, R.A.; Shiraishi, J.; Suzuki, K.; Newstead, G.M.; Doi, K. Determination of subjective similarity for pairs of masses and pairs of clustered microcalcifications on mammograms: comparison of similarity ranking scores and absolute similarity ratings. Med Phys 2007, 34, 2890–2895. [Google Scholar] [CrossRef] [PubMed]

