Fast Structural Alignment of Biomolecules Using a Hash Table, N-Grams and String Descriptors

Abstract
:1. Introduction
1.1. Macromolecules and Their Function
1.2. Protein Function and Similarity
1.3. RNA Function and Similarity
1.4. Scope of this Work
2. Material and Methods
2.1. In a Nutshell
String representation of linear polymers
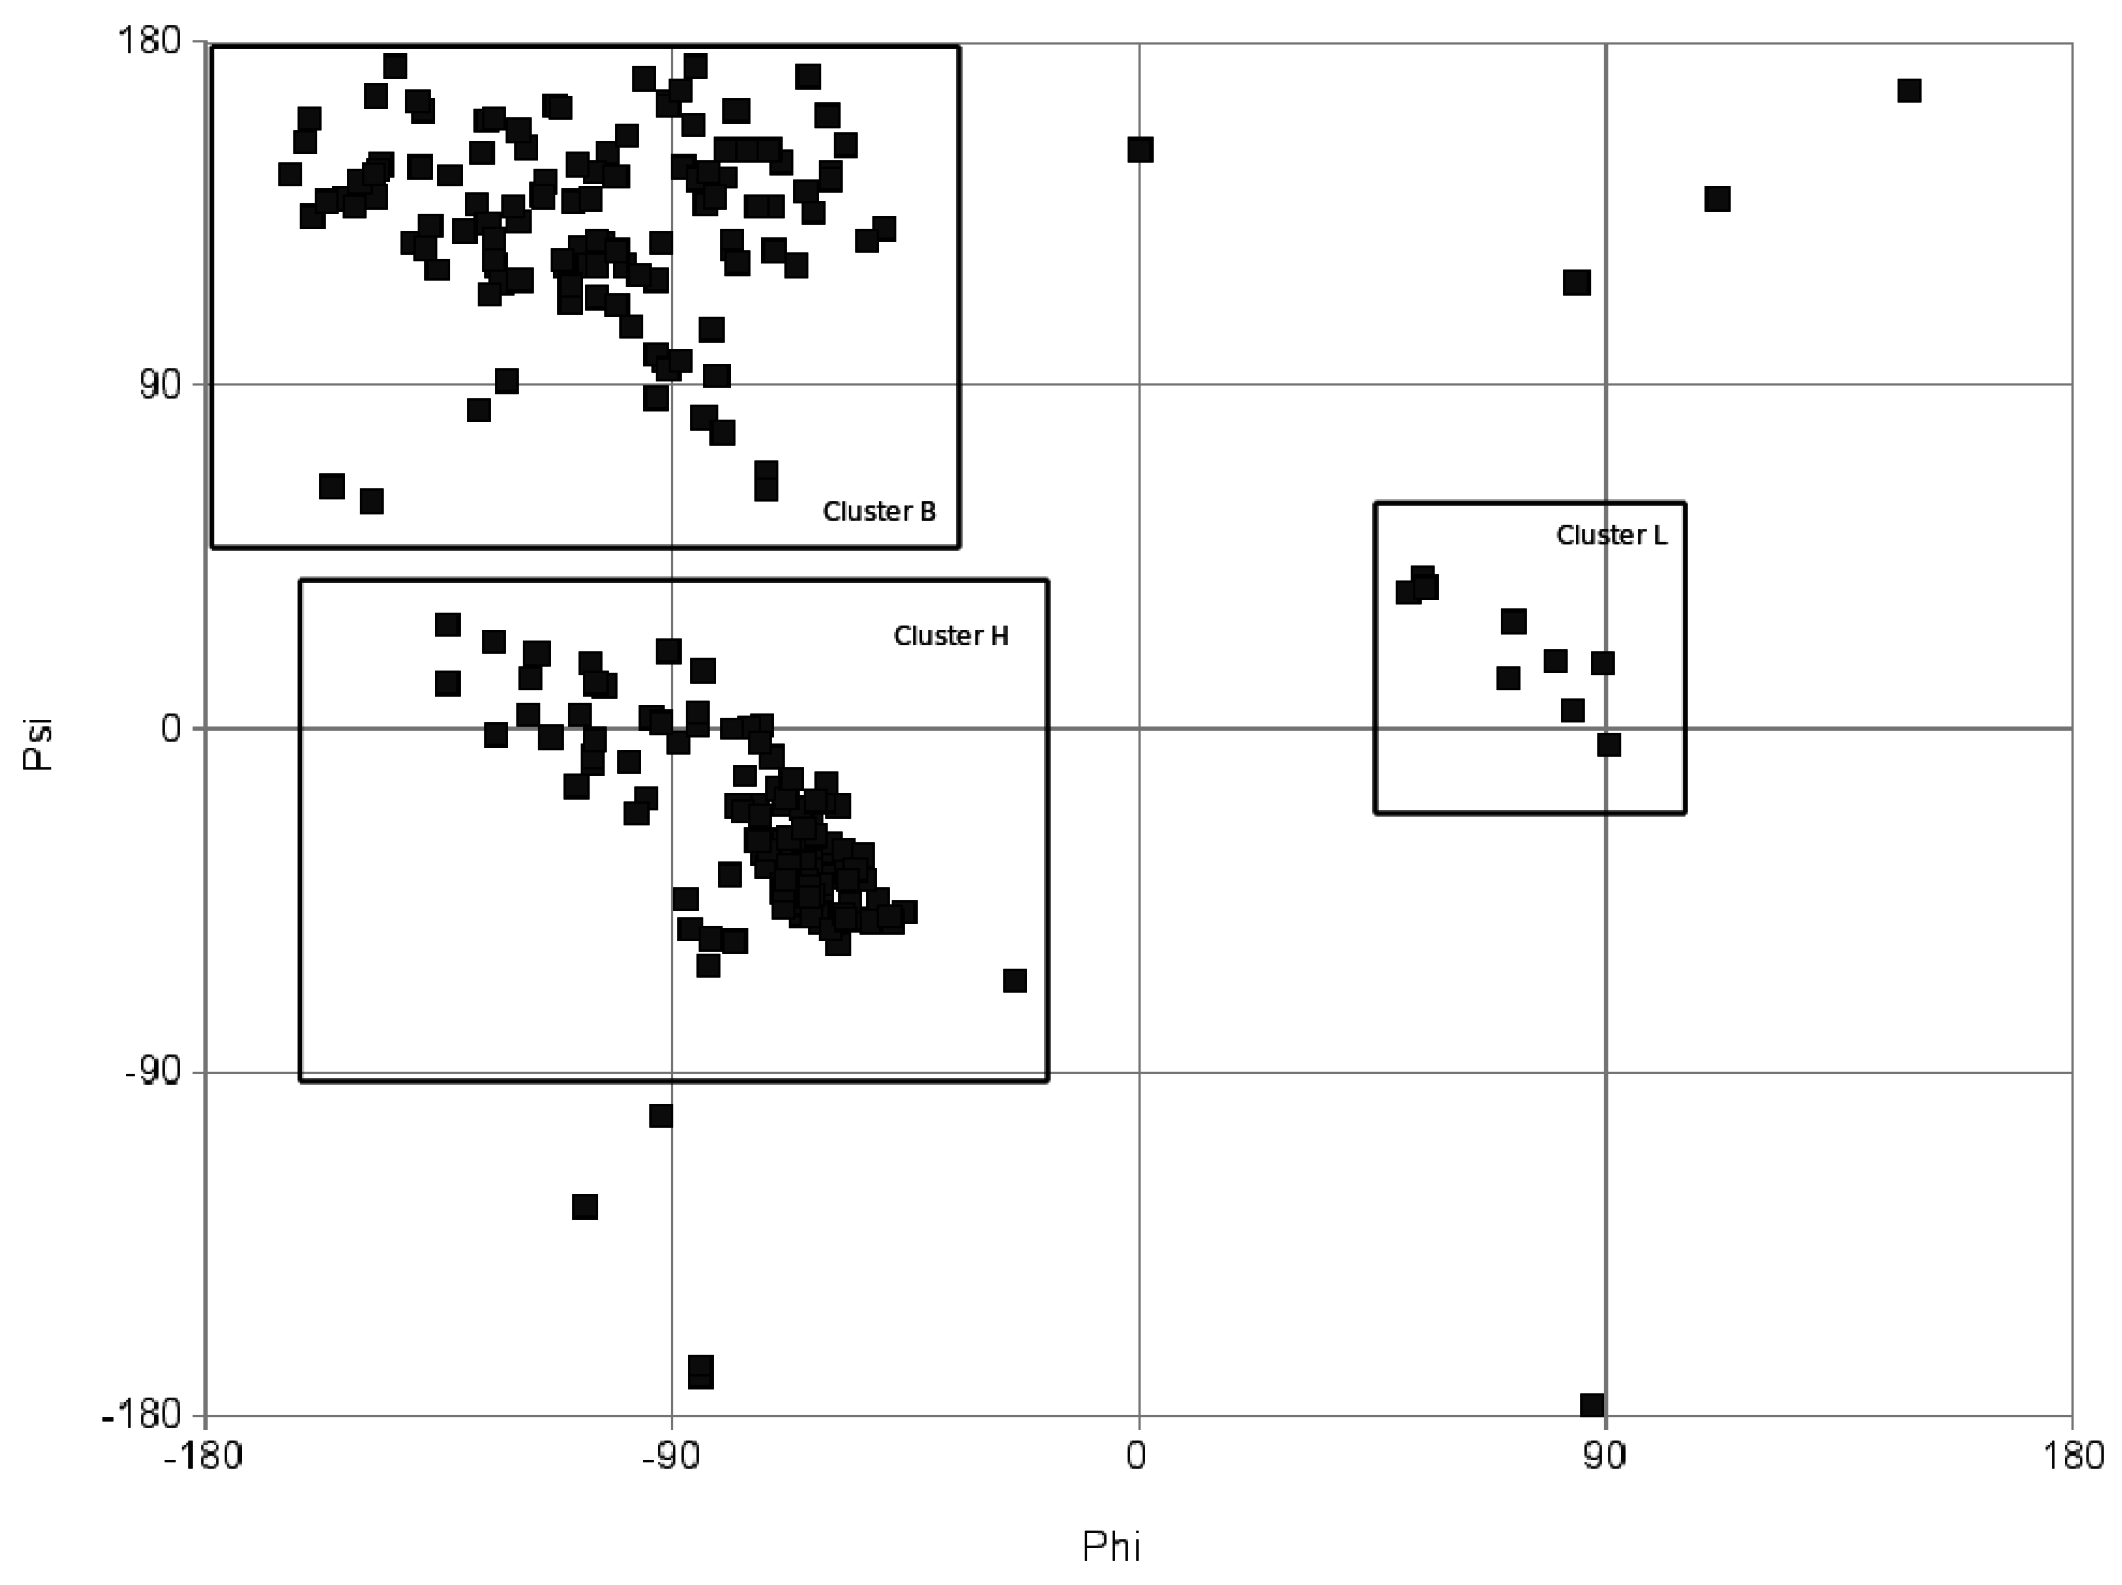
From torsion angles to a string
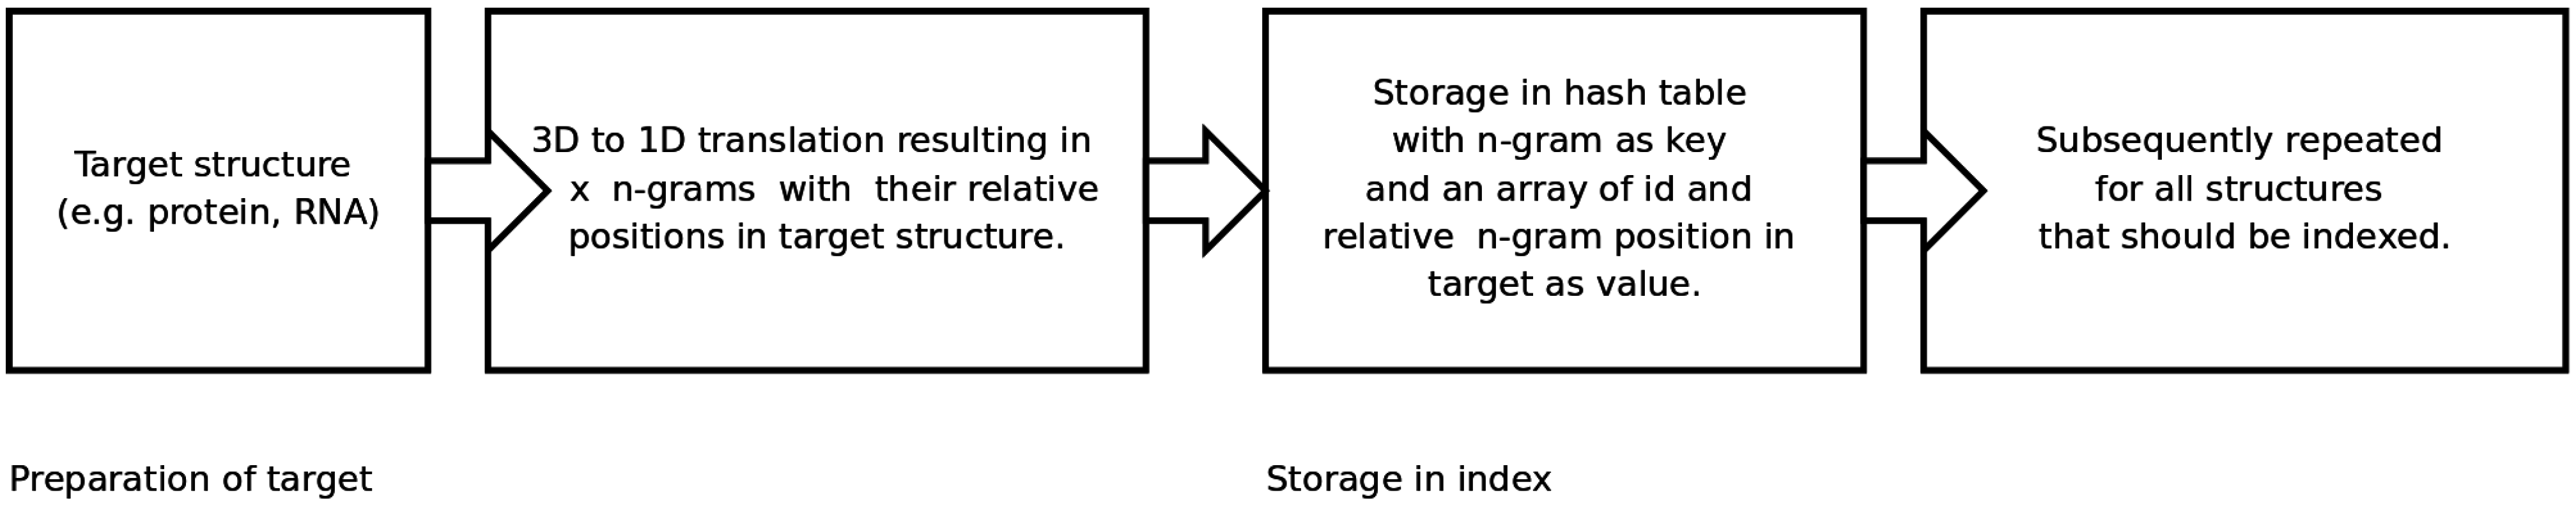
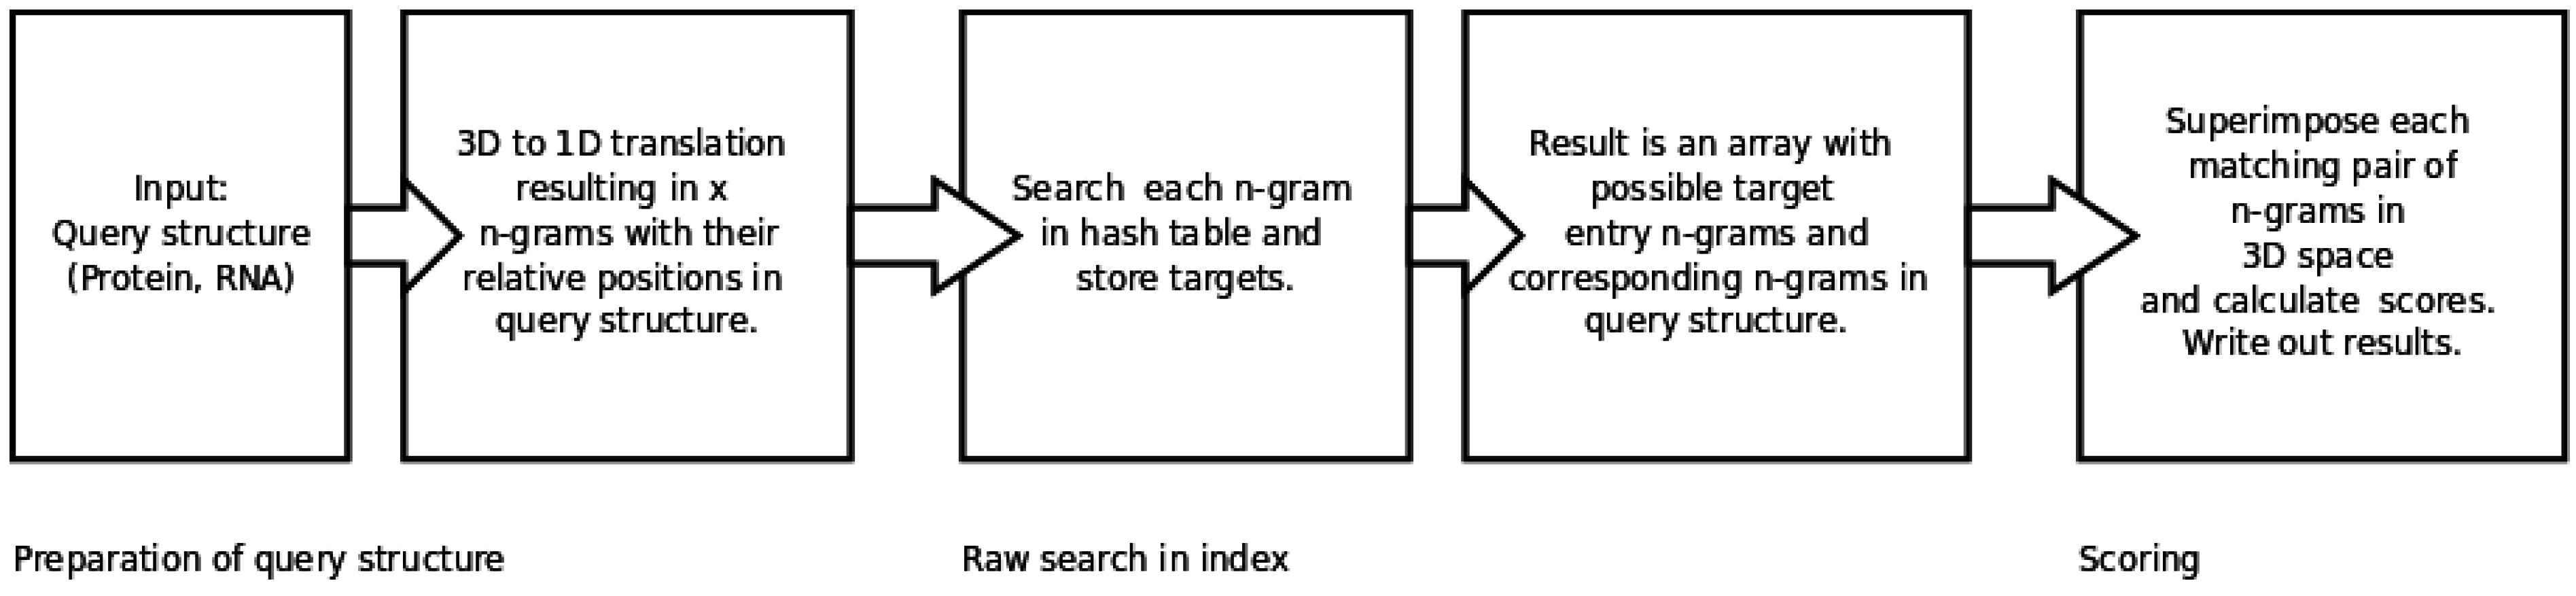
An n-gram based index structure for fast searches
2.2. Generating and Searching the Index
2.3. Datasets Used
tRNA dataset
Protein benchmarking
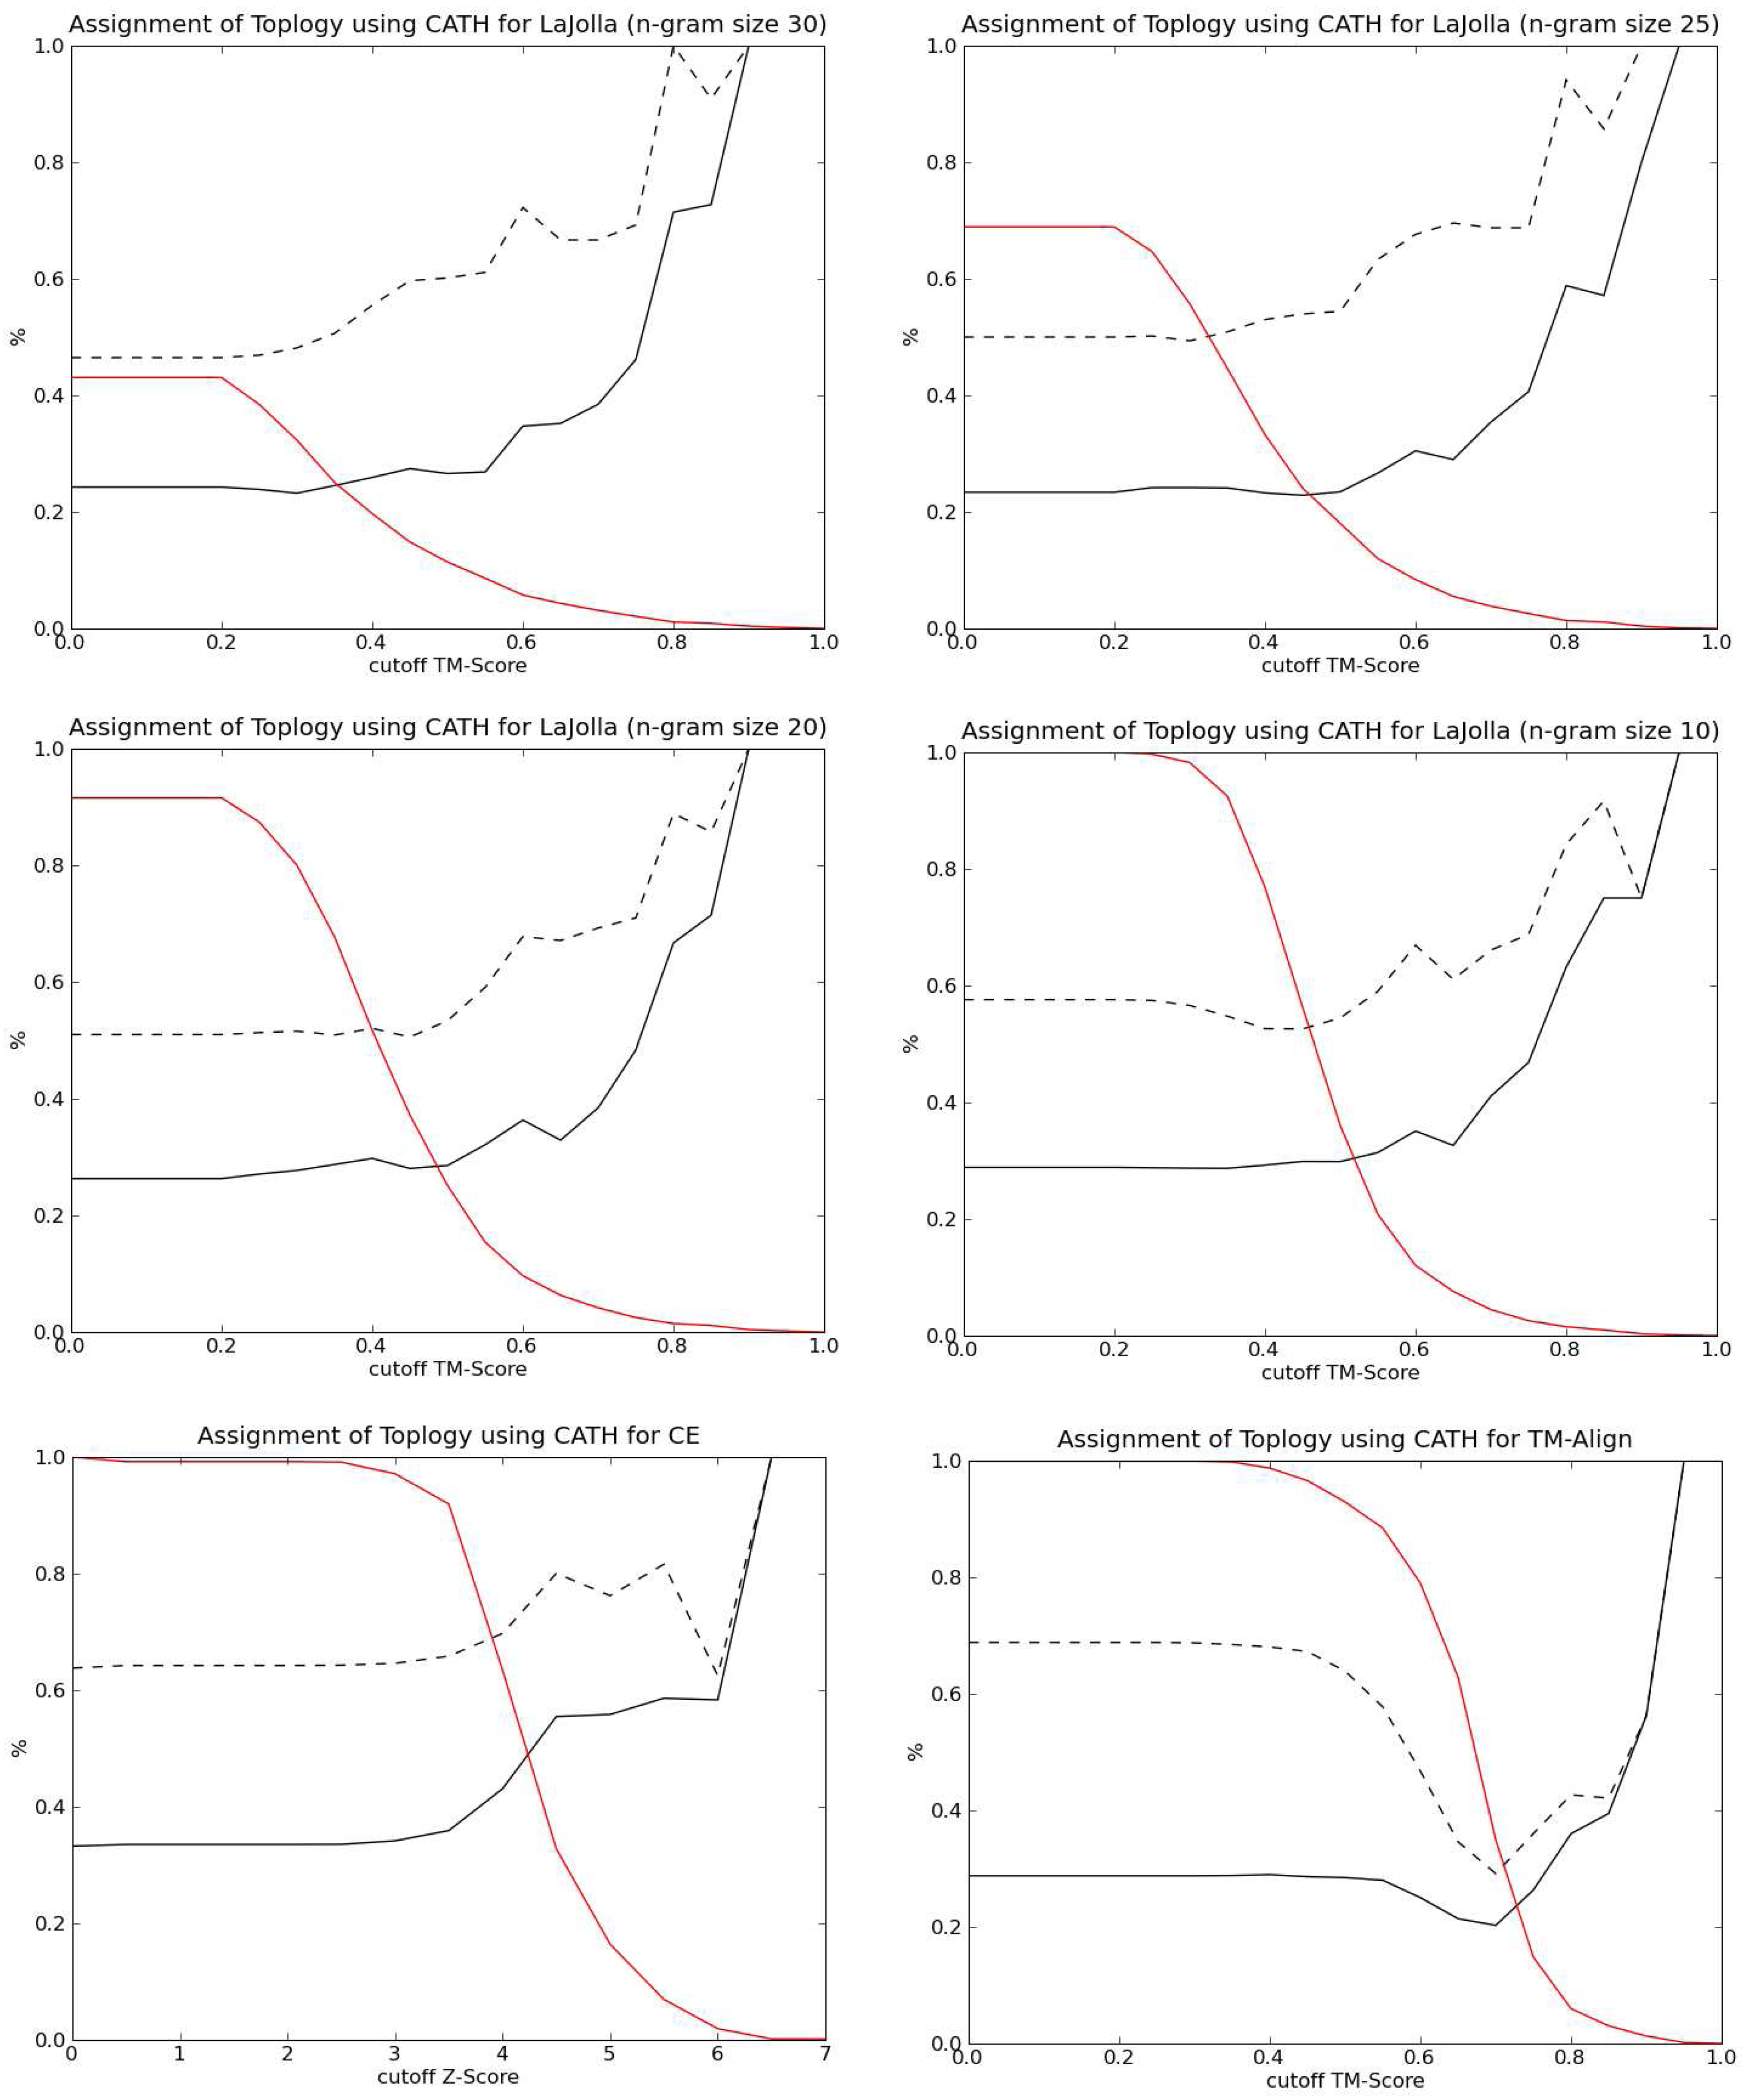
3. Results
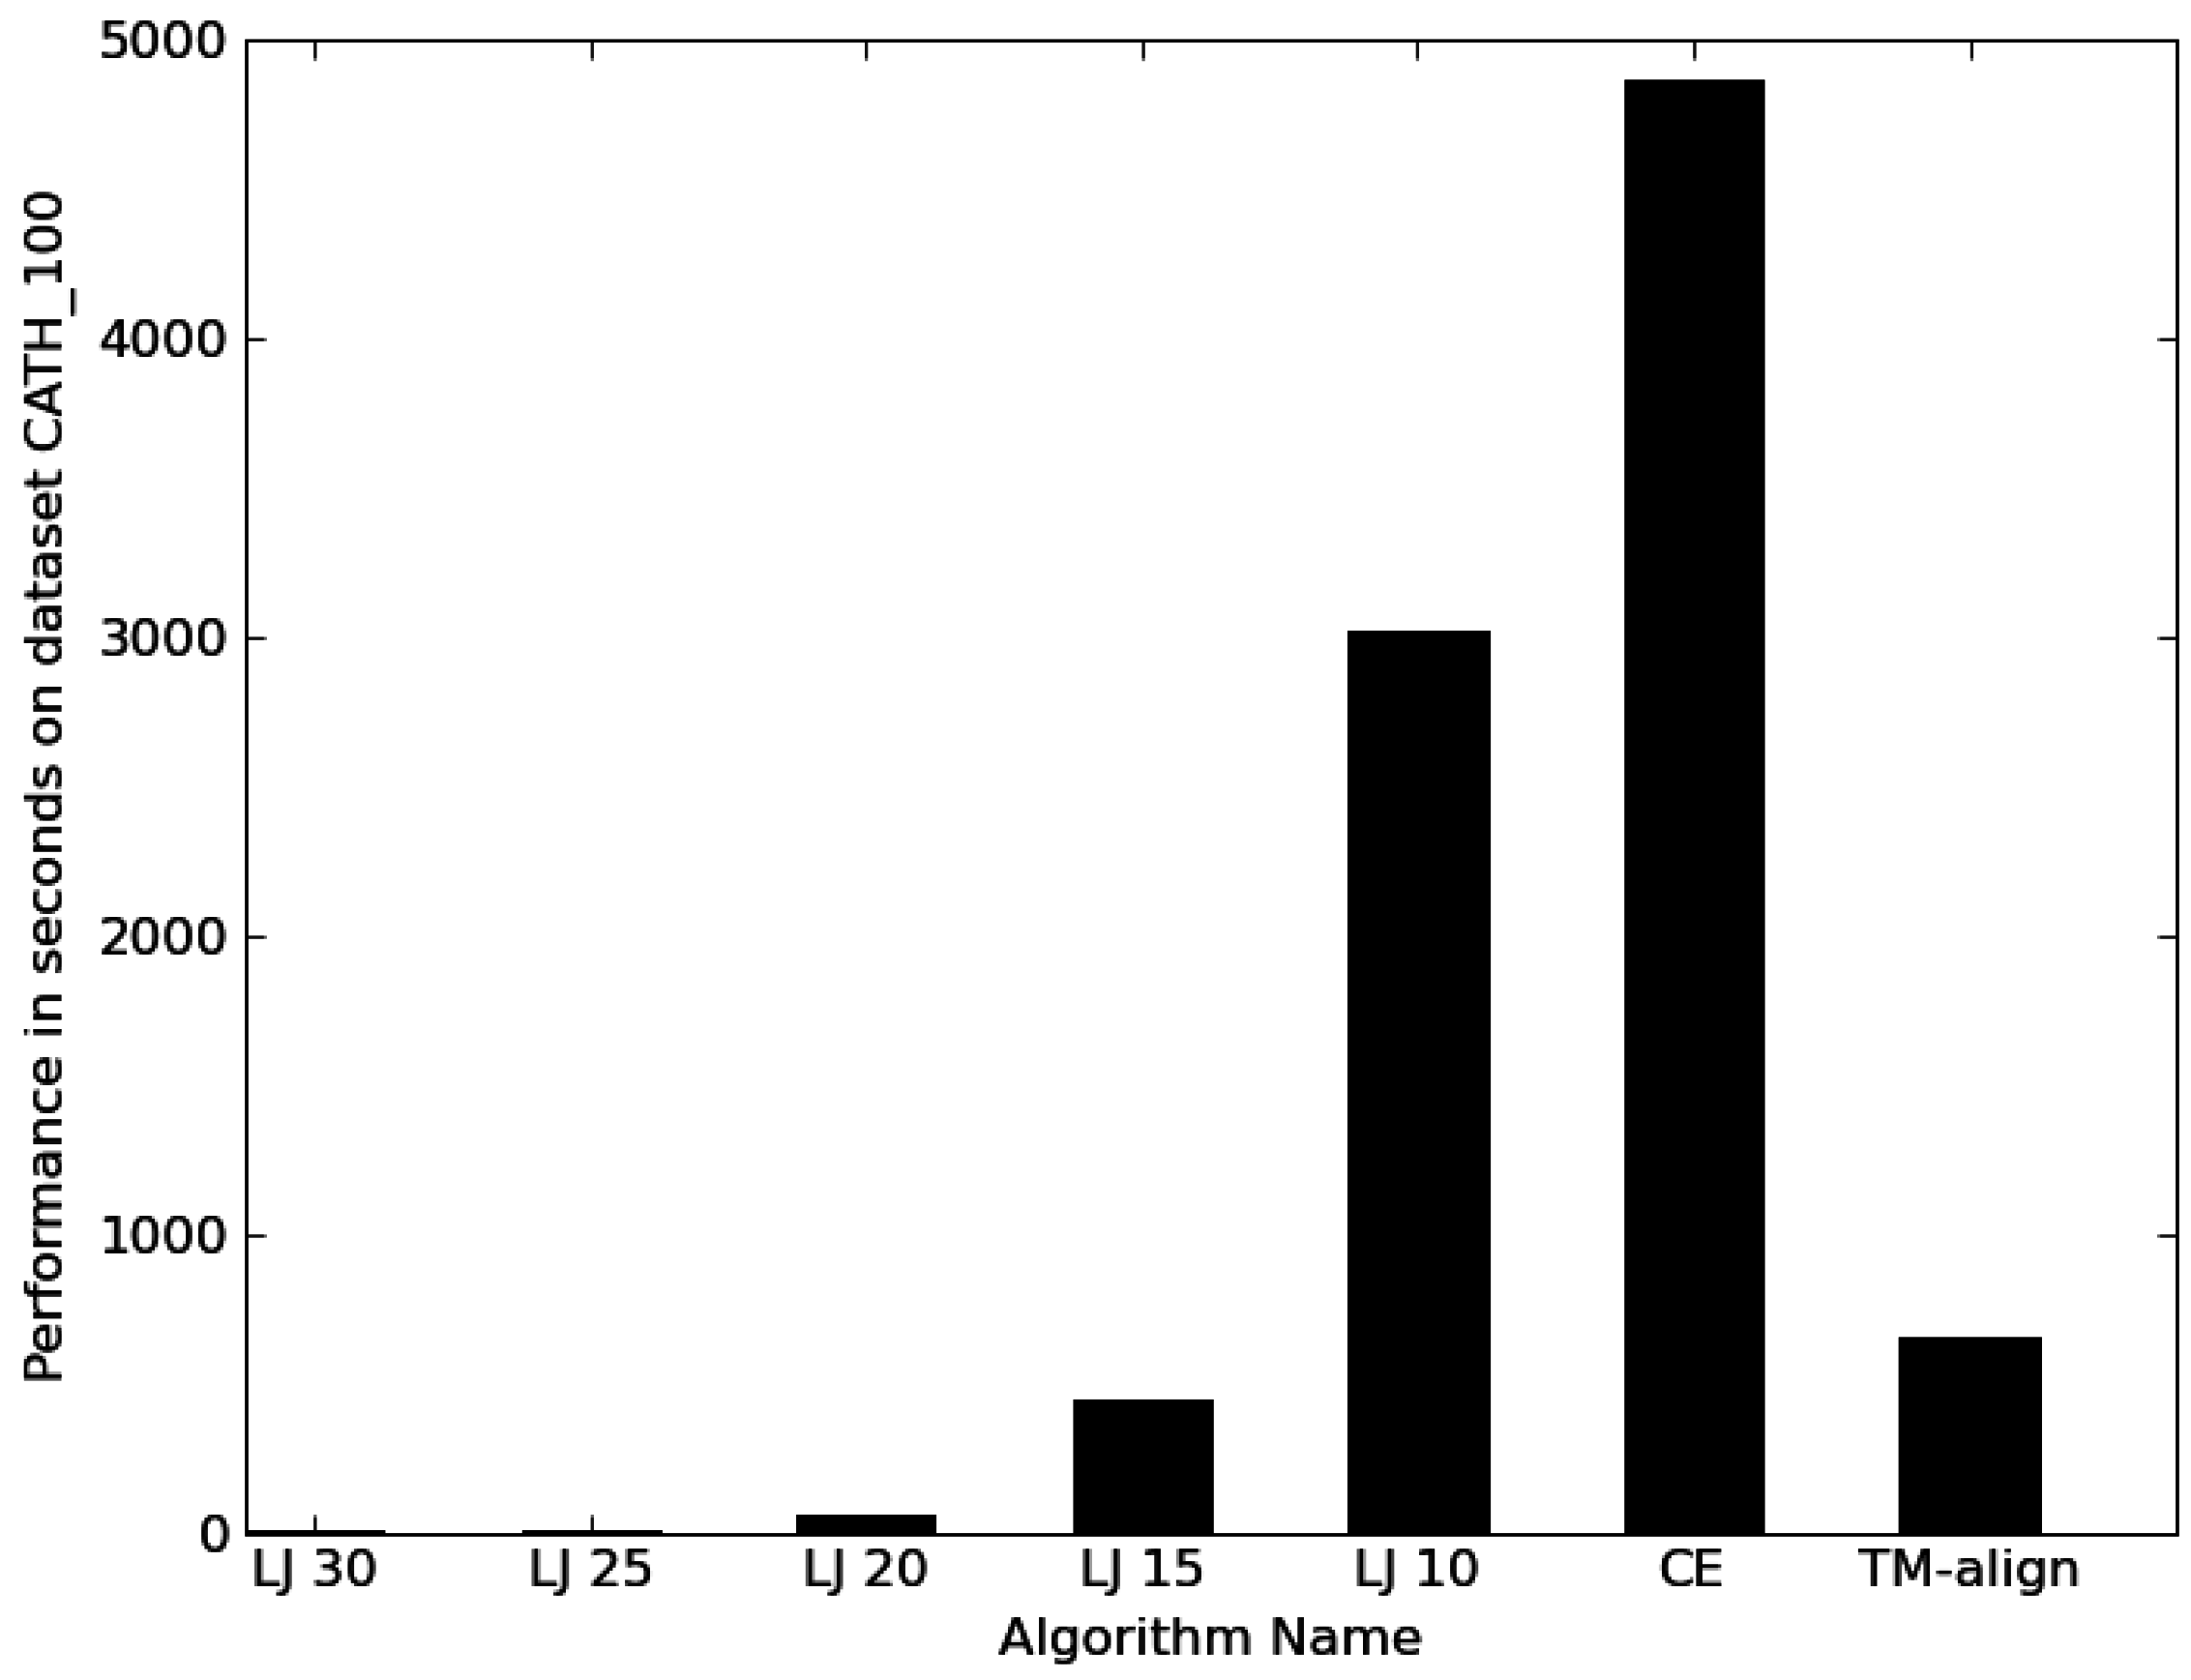
3.1. Performance
3.2. RNA Retrieval
3.3. Protein retrieval

| PDB-ID | chain | resolution | tRNA type | complex with | N hits | RMSD | TM-Score | percentage aligned residues |
|---|---|---|---|---|---|---|---|---|
| 1b23 | R | 2,60 | tRNA_Cys | Ef-Tu | 87 | 1.75 | 0.38 | 36.24 |
| 1c0a | B | 2,40 | tRNA_Asp | AspRS | 98 | 1.71 | 0.48 | 44.85 |
| 1efw | C | 3,00 | tRNA_Asp | AspRS | 92 | 1.76 | 0.48 | 44.95 |
| 1efw | D | 3,00 | tRNA_Asp | AspRS | 95 | 1.73 | 0.48 | 44.29 |
| 1ehz | A | 1,93 | tRNA_Phe | uncomplexed | 98 | 1.70 | 0.52 | 49.18 |
| 1eiy | C | 3,30 | tRNA_Phe | PheRS | 65 | 1.89 | 0.33 | 33.23 |
| 1euq | B | 3,10 | tRNA_Gln | GlnRS | 98 | 1.71 | 0.52 | 46.91 |
| 1euy | B | 2,60 | tRNA_Gln | GlnRS | 98 | 1.67 | 0.52 | 47.00 |
| 1exd | B | 2,70 | tRNA_Gln | GlnRS | 99 | 1.75 | 0.51 | 47.07 |
| 1f7u | B | 2,20 | tRNA_Arg | ArgRS | 98 | 1.75 | 0.43 | 40.52 |
| 1f7v | B | 2,90 | tRNA_Arg | ArgRS | 98 | 1.74 | 0.44 | 40.66 |
| 1ffy | T | 2,20 | tRNA_Ile | IleRS | 96 | 1.69 | 0.48 | 44.37 |
| 1g59 | B | 2,40 | tRNA_Glu | GluRS | 89 | 1.62 | 0.49 | 44.88 |
| 1g59 | D | 2,40 | tRNA_Glu | GluRS | 88 | 1.65 | 0.49 | 44.54 |
| 1gts | B | 2,80 | tRNA_Gln | GlnRS | 95 | 1.70 | 0.48 | 44.53 |
| 1h3e | B | 2,90 | tRNA_Tyr | TyrRS | 97 | 1.77 | 0.45 | 42.83 |
| 1h4s | T | 2,85 | tRNA_Pro | ProRS | 91 | 1.68 | 0.45 | 38.62 |
| 1il2 | C | 2,60 | tRNA_Asp | AspRS | 90 | 1.84 | 0.45 | 44.02 |
| 1il2 | D | 2,60 | tRNA_Asp | AspRS | 96 | 1.72 | 0.47 | 42.05 |
| 1j1u | B | 1,95 | tRNA_Tyr | TyrRS | 99 | 1.63 | 0.50 | 45.30 |
| 1j2b | C | 3,30 | tRNA_Val | archaeosine transglycosylase | 38 | 1.79 | 0.34 | 32.84 |
| 1j2b | D | 3,30 | tRNA_Val | archaeosine transglycosylase | 31 | 1.80 | 0.35 | 32.43 |
| 1n77 | C | 2,40 | tRNA_Glu | GluRS | 94 | 1.62 | 0.49 | 44.59 |
| 1n77 | D | 2,40 | tRNA_Glu | GluRS | 91 | 1.68 | 0.50 | 46.08 |
| 1n78 | C | 2,10 | tRNA_Glu | GluRS | 93 | 1.62 | 0.50 | 45.50 |
| 1n78 | D | 2,10 | tRNA_Glu | GluRS | 91 | 1.69 | 0.50 | 46.42 |
| 1ob2 | B | 3,35 | tRNA_Phe | Ef-Tu | 97 | 1.85 | 0.43 | 42.31 |
| 1pns | V | 8,70 | tRNA_Phe | 70S ribosome | 98 | 1.71 | 0.53 | 49.57 |
| 1pns | W | 8,70 | tRNA_Phe | 70S ribosome | 99 | 1.70 | 0.50 | 46.53 |
| 1qf6 | B | 2,90 | tRNA_Thr | ThrRS | 96 | 1.71 | 0.45 | 41.68 |
| 1qrs | B | 2,60 | tRNA_Gln | GlnRS | 94 | 1.69 | 0.49 | 45.49 |
| 1qrt | B | 2,70 | tRNA_Gln | GlnRS | 94 | 1.70 | 0.48 | 44.62 |
| 1qru | B | 3,00 | tRNA_Gln | GlnRS | 94 | 1.69 | 0.49 | 44.97 |
| 1qtq | B | 2,25 | tRNA_Gln | GlnRS | 98 | 1.68 | 0.49 | 44.82 |
| 1qu2 | T | 2,20 | tRNA_Ile | IleRS | 96 | 1.69 | 0.48 | 44.37 |
| 1qu3 | T | 2,90 | tRNA_Ile | IleRS | 98 | 1.68 | 0.49 | 44.93 |
| 1wz2 | C | 3,21 | tRNA_Leu | LeuRS | 97 | 1.75 | 0.43 | 40.84 |
| 1wz2 | D | 3,21 | tRNA_Leu | LeuRS | 97 | 1.74 | 0.46 | 43.21 |
| 1yl4 | B | 5,50 | tRNA_Phe | 70S ribosome | 98 | 1.83 | 0.50 | 48.26 |
| 1yl4 | C | 5,50 | tRNA_Phe | 70S ribosome | 99 | 1.75 | 0.50 | 47.07 |
| 1zjw | B | 2,50 | tRNA_Glu | GluRS | 98 | 1.68 | 0.50 | 45.61 |
| 2ake | B | 3,10 | tRNA_Trp | TrpRS | 96 | 1.67 | 0.44 | 40.14 |
| 2azx | C | 2,80 | tRNA_Trp | TrpRS | 100 | 1.72 | 0.50 | 45.71 |
| 2azx | D | 2,80 | tRNA_Trp | TrpRS | 100 | 1.73 | 0.48 | 44.01 |
| 2b64 | V | 5,90 | tRNA_Phe | 70S ribosome | 98 | 1.76 | 0.47 | 45.16 |
| 2b64 | W | 5,90 | tRNA_Phe | 70S ribosome | 98 | 1.82 | 0.52 | 49.75 |
| 2b9m | V | 6,76 | tRNA_Phe | 70S ribosome | 98 | 1.77 | 0.47 | 44.88 |
| 2b9m | W | 6,76 | tRNA_Phe | 70S ribosome | 99 | 1.83 | 0.48 | 46.98 |
| 2b9o | V | 6,46 | tRNA_Phe | 70S ribosome | 100 | 1.78 | 0.46 | 44.43 |
| 2b9o | W | 6,46 | tRNA_Phe | 70S ribosome | 98 | 1.79 | 0.51 | 49.07 |
| 2bte | B | 2,90 | tRNA_Leu | LeuRS | 86 | 1.88 | 0.42 | 40.93 |
| 2bte | E | 2,90 | tRNA_Leu | LeuRS | 81 | 1.84 | 0.41 | 40.17 |
| 2byt | B | 3,30 | tRNA_Leu | LeuRS | 72 | 1.85 | 0.41 | 40.15 |
| 2byt | E | 3,30 | tRNA_Leu | LeuRS | 71 | 1.85 | 0.42 | 40.36 |
| 2csx | C | 2,70 | tRNA_Met | MetRS | 95 | 1.68 | 0.47 | 44.03 |
| 2csx | D | 2,70 | tRNA_Met | MetRS | 95 | 1.66 | 0.47 | 43.39 |
| 2ct8 | C | 2,70 | tRNA_Met | MetRS | 99 | 1.69 | 0.47 | 43.53 |
| 2ct8 | D | 2,70 | tRNA_Met | MetRS | 97 | 1.70 | 0.43 | 40.05 |
| 2cv0 | C | 2,40 | tRNA_Glu | GluRS | 93 | 1.62 | 0.49 | 44.53 |
| 2cv1 | C | 2,41 | tRNA_Glu | GluRS | 93 | 1.64 | 0.50 | 45.99 |
| 2cv1 | D | 2,41 | tRNA_Glu | GluRS | 91 | 1.70 | 0.50 | 46.78 |
| 2cv2 | C | 2,69 | tRNA_Glu | GluRS | 92 | 1.65 | 0.51 | 46.75 |
| 2cv2 | D | 2,69 | tRNA_Glu | GluRS | 91 | 1.69 | 0.50 | 46.31 |
| 2d6f | E | 3,15 | tRNA_Gln | GluRS | 97 | 1.80 | 0.43 | 40.94 |
| 2d6f | F | 3,15 | tRNA_Gln | GluRS | 98 | 1.87 | 0.41 | 40.11 |
| 2der | C | 3,10 | tRNA_Glu | mnma thiolase | 98 | 1.74 | 0.48 | 44.98 |
| 2der | D | 3,10 | tRNA_Glu | mnma thiolase | 96 | 1.70 | 0.50 | 44.92 |
| 2det | C | 3,40 | tRNA_Glu | mnm5s2U-methyltransferase | 94 | 1.72 | 0.45 | 40.28 |
| 2deu | C | 3,40 | tRNA_Glu | mnm5s2U-methyltransferase | 90 | 1.73 | 0.43 | 40.93 |
| 2deu | D | 3,40 | tRNA_Glu | mnm5s2U-methyltransferase | 89 | 1.73 | 0.44 | 41.02 |
| 2dr2 | B | 3,00 | tRNA_Trp | TrpRS | 100 | 1.68 | 0.43 | 39.79 |
| 2du3 | D | 2,60 | tRNA_Cys | o-phosphoserylRS | 95 | 1.76 | 0.45 | 41.51 |
| 2du4 | C | 2,80 | tRNA_Cys | o-phosphoserylRS | 95 | 1.78 | 0.46 | 42.32 |
| 2du5 | D | 3,20 | tRNA_opal | o-phosphoserylRS | 93 | 1.88 | 0.41 | 39.22 |
| 2du6 | D | 3,30 | tRNA_Amber | o-phosphoserylRS | 96 | 1.89 | 0.40 | 38.27 |
| 2dxi | C | 2,20 | tRNA_Glu | GluRS | 92 | 1.62 | 0.49 | 44.98 |
| 2dxi | D | 2,20 | tRNA_Glu | GluRS | 88 | 1.63 | 0.49 | 44.78 |
| 2fk6 | R | 2,90 | tRNA_Thr | RNase Z | 85 | 1.57 | 0.52 | 36.29 |
| PDB-ID | chain | resolution | tRNA type | complex with | N hits | RMSD | TM-Score | percentage aligned residues |
|---|---|---|---|---|---|---|---|---|
| 2hgi | C | 5,00 | tRNA_fMet | 70S ribosome | 99 | 1.69 | 0.52 | 48.56 |
| 2hgi | D | 5,00 | tRNA_Phe | 70S ribosome | 86 | 1.90 | 0.42 | 41.56 |
| 2hgp | B | 5,50 | tRNA_Phe | 70S ribosome | 90 | 1.91 | 0.44 | 43.47 |
| 2hgp | C | 5,50 | tRNA_Phe | 70S ribosome | 98 | 1.77 | 0.49 | 46.43 |
| 2hgp | D | 5,50 | tRNA_Phe | 70S ribosome | 90 | 1.84 | 0.42 | 41.07 |
| 2hgr | C | 4,51 | tRNA_fMet | 70S ribosome | 100 | 1.68 | 0.51 | 47.38 |
| 2hgr | D | 4,51 | tRNA_Phe | 70S ribosome | 93 | 1.89 | 0.43 | 42.78 |
| 2iy5 | T | 3,10 | tRNA_Phe | PheRS | 51 | 1.95 | 0.33 | 33.58 |
| 2j00 | W | 2,80 | tRNA_Phe | 70S ribosome | 97 | 1.76 | 0.44 | 42.02 |
| 2j02 | V | 2,80 | tRNA_fMet | 70S ribosome | 98 | 1.69 | 0.49 | 46.10 |
| 2j02 | W | 2,80 | tRNA_Phe | 70S ribosome | 97 | 1.80 | 0.46 | 44.09 |
| 2nre | F | 4,00 | tRNA_Leu | pseudouridine synthase | 32 | 1.56 | 0.46 | 33.68 |
| 2ow8 | 0 | 3,71 | tRNA_Phe | 70S ribosome | 93 | 1.89 | 0.42 | 41.68 |
| 2ow8 | z | 3,71 | tRNA_Phe | 70S ribosome | 90 | 1.82 | 0.45 | 43.30 |
| 2qnh | 2 | 3,83 | tRNA_Phe | 70S ribosome | 93 | 1.84 | 0.43 | 41.65 |
| 2qnh | z | 3,83 | tRNA_fMet | 70S ribosome | 100 | 1.74 | 0.51 | 48.56 |
| 2tra | A | 3,00 | tRNA_Asp | uncomplexed | 98 | 1.72 | 0.44 | 40.72 |
| 2v0g | B | 3,50 | tRNA_Leu | LeuRS | 69 | 1.86 | 0.42 | 40.74 |
| 2v0g | F | 3,50 | tRNA_Leu | LeuRS | 69 | 1.85 | 0.42 | 40.22 |
| 2v46 | W | 3,80 | tRNA_fMet | 70S ribosome | 98 | 1.80 | 0.46 | 44.24 |
| 2v48 | W | 3,80 | tRNA_fMet | 70S ribosome | 96 | 1.86 | 0.46 | 44.87 |
| 3tra | A | 3,00 | tRNA_Asp | uncomplexed | 93 | 1.75 | 0.45 | 41.92 |
| 4tna | A | 2,50 | tRNA_Phe | uncomplexed | 100 | 1.70 | 0.52 | 49.00 |
4. Discussion
4.1. General aspects
4.2. RNA specific aspects
4.3. Protein specific aspects
5. Conclusions
Acknowledgements
References and Notes
- Kendrew, J.C.; Bodo, G.; Dintzis, H.M.; Parrish, R.G.; Wyckoff, H.; Phillips, D.C. A three- dimensional model of the myoglobin molecule obtained by x-ray analysis. Nature 1958, 181, 662–666. [Google Scholar] [CrossRef] [PubMed]
- Scheerer, P.; Park, J.H.; Hildebrand, P.W.; Kim, Y.J.; Krausz, N.; Choe, H.W.; Hofmann, K.P.; Ernst, O.P. Crystal structure of opsin in its G-protein-interacting conformation. Nature 2008, 455, 497–502. [Google Scholar] [CrossRef] [PubMed]
- Berman, H.; Henrick, K.; Nakamura, H.; Markley, J.L. The worldwide Protein Data Bank (ww-PDB): Ensuring a single, uniform archive of PDB data. Nucl. Acid. Res. 2007, 35, D301–D303. [Google Scholar] [CrossRef] [PubMed]
- Service, R.F. Structural biology. protein structure initiative: phase 3 or phase out. Science 2008, 319, 1610–1613. [Google Scholar] [CrossRef] [PubMed]
- Levitt, M. Growth of novel protein structural data. Proc. Nat. Acad. Sci. 2007, 104, 3183–3188. [Google Scholar] [CrossRef] [PubMed]
- Rother, K.; Michalsky, E.; Leser, U. How well are protein structures annotated in secondary databases? Proteins 2005, 60, 571–576. [Google Scholar] [CrossRef] [PubMed]
- Andreeva, A.; Howorth, D.; Chandonia, J.M.; Brenner, S.E.; Hubbard, T.J.; Chothia, C.; Murzin, A.G. Data growth and its impact on the SCOP database: new developments. Nucl.Acid.Res. 2008, 36, 419–425. [Google Scholar] [CrossRef] [PubMed]
- He, Y.; Chen, Y.; Alexander, P.; Bryan, P.N.; Orban, J. NMR structures of two designed proteins with high sequence identity but different fold and function. Proc.Nat.Acad.Sci. 2008, 105, 14412–14417. [Google Scholar] [CrossRef]
- Cheek, S.; Qi, Y.; Krishna, S.S.; Kinch, L.N.; Grishin, N.V. SCOPmap: automated assignment of protein structures to evolutionary superfamilies. BMC Bioinformatics 2004, 5, 197. [Google Scholar] [CrossRef] [PubMed]
- Shindyalov, I.N.; Bourne, P.E. Protein structure alignment by incremental combinatorial extension (ce) of the optimal path. Protein Engeering 1998, 11, 739–747. [Google Scholar] [CrossRef]
- Sippl, M.J.; Wiederstein, M. A note on difficult structure alignment problems. Bioinformatics 2008, 24, 426–427. [Google Scholar] [CrossRef] [PubMed]
- Rao, S.T.; Rossmann, M.G. Comparison of super-secondary structures in proteins. J. Mol. Biol. 1973, 76, 241–256. [Google Scholar] [CrossRef]
- Zhang, Y.; Skolnick, J. TM-align: a protein structure alignment algorithm based on the TM-score. Nucl.Acid.Res. 2005, 33, 2302–2309. [Google Scholar] [CrossRef]
- Guerler, A.; Knapp, E.W. Novel protein folds and their nonsequential structural analogs. Protein Sci. 2008, 17, 1374–1382. [Google Scholar] [CrossRef] [PubMed]
- Ilyin, V.A.; Abyzov, A.; Leslin, C.M. Structural alignment of proteins by a novel topofit method, as a superimposition of common volumes at a topomax point. Protein Sci. 2004, 13, 1865–1874. [Google Scholar] [CrossRef] [PubMed]
- Krissinel, E.; Henrick, K. Secondary-structure matching (ssm), a new tool for fast protein structure alignment in three dimensions. Acta Crystallogr-D-Biol Cryst. 2004, 60, 2256–2268. [Google Scholar] [CrossRef] [PubMed]
- Kolodny, R.; Koehl, P.; Levitt, M. Comprehensive evaluation of protein structure alignment methods: scoring by geometric measures. J. Mol. Biol. 2005, 346, 1173–1188. [Google Scholar] [CrossRef] [PubMed]
- Novotny, M.; Madsen, D.; Kleywegt, G.J. Evaluation of protein fold comparison servers. Proteins 2004, 54, 260–270. [Google Scholar] [CrossRef] [PubMed]
- Ramachandran, G.N.; Ramakrishnan, C.; Sasisekharan, V. Stereochemistry of polypeptide chain configurations. J. Mol. Biol. 1963, 7, 95–99. [Google Scholar] [CrossRef]
- Guyon, F.; Camproux, A.C.; Hochez, J.; Tuffery, P. SA-Search: a web tool for protein structure mining based on a Structural Alphabet. Nucl.Acid.Sci. 2004, 32, W545–548. [Google Scholar] [CrossRef] [PubMed]
- Täubig, H.; Buchner, A.; Griebsch, J. PAST: Fast structure-based searching in the PDB. Nucl. Acid. Sci. 2006, 34, W20–W23. [Google Scholar] [CrossRef] [PubMed]
- Friedberg, I.; Harder, T.; Kolodny, R.; Sitbon, E.; Li, Z.; Godzik, A. Using an alignment of fragment strings for comparing protein structures. Bioinformatics 2007, 23, e219–e224. [Google Scholar] [CrossRef] [PubMed]
- Lo, W.C.; Huang, P.J.; Chang, C.H.; Lyu, P.C. Protein structural similarity search by Ramachandran codes. BMC Bioinformatics 2007, 8, 307. [Google Scholar] [CrossRef] [PubMed]
- Gao, F.; Zaki, M.J. PSIST: A scalable approach to indexing protein structures using suffix trees. J. Parallel Distributed Computation 2008, 68, 54–63. [Google Scholar] [CrossRef]
- Günther, S.; May, P.; Hoppe, A.; Frömmel, C.; Preissner, R. Docking without docking: ISEARCH-prediction of interactions using known interfaces. Proteins 2007, 69, 839–844. [Google Scholar] [CrossRef] [PubMed]
- Laederach, A. Informatics challenges in structured RNA. Brief Bioinformatics 2007, 8, 294–303. [Google Scholar] [CrossRef] [PubMed]
- Tamura, M.; Hendrix, D.K.; Klosterman, P.S.; Schimmelman, N.R.; Brenner, S.E.; Holbrook, S.R. SCOR: Structural Classification of RNA, version 2.0. Nucl. Acid. Res. 2004, 32, D182–D184. [Google Scholar] [CrossRef]
- Abraham, M.; Dror, O.; Nussinov, R.; Wolfson, H.J.J. Analysis and classification of RNA tertiary structures. RNA 2008, 14, 2274–2289. [Google Scholar] [CrossRef] [PubMed]
- Chang, Y.F.F.; Huang, Y.L.L.; Chin. SARSA: a web tool for structural alignment of RNA using a structural alphabet. Nucl. Acid. Res. 2008, 36, 19–24. [Google Scholar] [CrossRef] [PubMed]
- Capriotti, E.; Marti-Renom, M.A. RNA structure alignment by a unit-vector approach. Bioinformatics 2008, 24, 112–118. [Google Scholar] [CrossRef] [PubMed]
- Wadley, L.M.; Keating, K.S.; Duarte, C.M.; Pyle, A.M. Evaluating and Learning from RNA Pseudotorsional Space: Quantitative Validation of a Reduced Representation for RNA Structure. J. Mol. Biol. 2007, 372, 942–957. [Google Scholar] [CrossRef] [PubMed]
- Richardson, J.S.; Schneider, B.; Murray, L.W.; Kapral, G.J.; Immormino, R.M.; Headd, J.J.; Richardson, D.C.; Ham, D.; Hershkovits, E.; Williams, L.D.; Keating, K.S.; Pyle, A.M.; Micallef, D.; Westbrook, J.; Berman, H.M. RNA backbone: consensus all-angle conformers and modular string nomenclature (an RNA Ontology Consortium contribution). RNA 2008, 14, 465–481. [Google Scholar] [CrossRef] [PubMed]
- Parisien, M.; Major, F. The MC-Fold and MC-Sym pipeline infers RNA structure from sequence data. Nature 2008, 452, 51–55. [Google Scholar] [CrossRef] [PubMed]
- Leontis, N.B.; Altman, R.B.; Berman, H.M.; Brenner, S.E.; Brown, J.W.; Engelke, D.R.; Harvey, S.C.; Holbrook, S.R.; Jossinet, F.; Lewis, S.E.; Major, F.; Mathews, D.H.; Richardson, J.S.; Williamson, J.R.; Westhof, E. The RNA Ontology Consortium: an open invitation to the RNA community. RNA 2006, 12, 533–541. [Google Scholar] [CrossRef] [PubMed]
- Gusfield, D. Algorithms on Strings, Trees, and Sequences: Computer Science and Computational Biology. Cambridge University Press, 1997. [Google Scholar]
- Bauer, R.A.; Rother, K.; Bujncki, J.; Preissner, R. Suffix techniques as a rapid method for RNA substructure search. Genome Informatics 2008, 20, 183–198. [Google Scholar] [PubMed]
- Dietzfelbinger, M.; Karlin, A.R.; Mehlhorn, K.; Meyer auf der Heide, F.; Rohnert, H.; Tarjan, R.E. Dynamic perfect hashing: Upper and lower bounds. In IEEE Symposium on Foundations of Computer Science; 1988; pp. 524–531. [Google Scholar]
- Cormen, T.H.; Leiserson, C.E.; Rivest, R.L.; Stein, C. Introduction to Algorithms. In McGraw-Hill Science / Engineering / Math, 2nd Edition ed; 2003. [Google Scholar]
- Burkhardt, S.; Crauser, A.; Ferragina, P.; Lenhof, H.P.; Rivals, E.; Vingron, M. q-gram based database searching using a suffix array (QUASAR). In RECOMB ’99: Proceedings of the third annual international conference on Computational molecular biology; 1999; pp. 77–83. [Google Scholar]
- Kabsch, W. A solution for the best rotation to relate two sets of vectors. Acta Crystallogr. A 1976, 32, 922–923. [Google Scholar] [CrossRef]
- Zhang, Y.; Skolnick, J. Scoring function for automated assessment of protein structure template quality. Proteins 2007, 57, 702–710. [Google Scholar] [CrossRef] [PubMed]
- Tyagi, M.; de Brevern, A.G.; Srinivasan, N.; Offmann, B. Protein structure mining using a structural alphabet. Proteins 2008, 71, 920–937. [Google Scholar] [CrossRef] [PubMed]
- Cuff, A.L.; Sillitoe, I.; Lewis, T.; Redfern, O.C.; Garratt, R.; Thornton, J.; Orengo, C.A. The CATH classification revisited–architectures reviewed and new ways to characterize structural divergence in superfamilies. Nucl. Acid. Res. 2009, 37, D310–314. [Google Scholar] [CrossRef] [PubMed]
- Giegé, R. Toward a more complete view of tRNA biology. Nat. Struct. Mol. Biol. 2008, 15, 1007–1014. [Google Scholar] [CrossRef] [PubMed]
- Stombaugh, J.; Zirbel, C.L.; Westhof, E.; Leontis, N.B. Frequency and isostericity of RNA base pairs. Nucl. Acid. Res. 2009, in press. [Google Scholar] [CrossRef] [PubMed]
- Pandit, S.B.; Skolnick, J. Fr-TM-align: A new protein structural alignment method based on fragment alignments and the TM-score. BMC Bioinformatics 2008, 9, 531. [Google Scholar] [CrossRef] [PubMed]
- Holland, R.C.; Down, T.; Pocock, M.; Prlic, A.; Huen, D.; James, K.; Foisy, S.; Dräger, A.; Yates, A.; Heuer, M.; Schreiber, M.J. BioJava: an open-source framework for bioinformatics. Bioinformatics 2008, 24, 2096–2097. [Google Scholar] [CrossRef] [PubMed]
© 2009 by the authors; licensee Molecular Diversity Preservation International, Basel, Switzerland. This article is an open-access article distributed under the terms and conditions of the Creative Commons Attribution license (http://creativecommons.org/licenses/by/3.0/).
Share and Cite
Bauer, R.A.; Rother, K.; Moor, P.; Reinert, K.; Steinke, T.; Bujnicki, J.M.; Preissner, R. Fast Structural Alignment of Biomolecules Using a Hash Table, N-Grams and String Descriptors. Algorithms 2009, 2, 692-709. https://doi.org/10.3390/a2020692
Bauer RA, Rother K, Moor P, Reinert K, Steinke T, Bujnicki JM, Preissner R. Fast Structural Alignment of Biomolecules Using a Hash Table, N-Grams and String Descriptors. Algorithms. 2009; 2(2):692-709. https://doi.org/10.3390/a2020692
Chicago/Turabian StyleBauer, Raphael André, Kristian Rother, Peter Moor, Knut Reinert, Thomas Steinke, Janusz M. Bujnicki, and Robert Preissner. 2009. "Fast Structural Alignment of Biomolecules Using a Hash Table, N-Grams and String Descriptors" Algorithms 2, no. 2: 692-709. https://doi.org/10.3390/a2020692
APA StyleBauer, R. A., Rother, K., Moor, P., Reinert, K., Steinke, T., Bujnicki, J. M., & Preissner, R. (2009). Fast Structural Alignment of Biomolecules Using a Hash Table, N-Grams and String Descriptors. Algorithms, 2(2), 692-709. https://doi.org/10.3390/a2020692