Article

Trajectory Clustering and k-NN for Robust Privacy Preserving Spatiotemporal Databases

1
Department of Computer Engineering and Informatis, University of Patras, 265 04 Patra, Greece
2
Department of Informatics, Ionian University, 491 00 Kerkira, Greece
*
Author to whom correspondence should be addressed.
Algorithms 2018, 11(12), 207; https://doi.org/10.3390/a11120207
Submission received: 30 October 2018 / Revised: 9 December 2018 / Accepted: 10 December 2018 / Published: 14 December 2018
(This article belongs to the Special Issue Humanistic Data Mining: Tools and Applications)

Abstract

:
In the context of this research work, we studied the problem of privacy preserving on spatiotemporal databases. In particular, we investigated the k-anonymity of mobile users based on real trajectory data. The k-anonymity set consists of the k nearest neighbors. We constructed a motion vector of the form (x,y,g,v) where x and y are the spatial coordinates, g is the angle direction, and v is the velocity of mobile users, and studied the problem in four-dimensional space. We followed two approaches. The former applied only k-Nearest Neighbor (k-NN) algorithm on the whole dataset, while the latter combined trajectory clustering, based on K-means, with k-NN. Actually, it applied k-NN inside a cluster of mobile users with similar motion pattern (g,v). We defined a metric, called vulnerability, that measures the rate at which k-NNs are varying. This metric varies from 1 k (high robustness) to 1 (low robustness) and represents the probability the real identity of a mobile user being discovered from a potential attacker. The aim of this work was to prove that, with high probability, the above rate tends to a number very close to 1 k in clustering method, which means that the k-anonymity is highly preserved. Through experiments on real spatial datasets, we evaluated the anonymity robustness, the so-called vulnerability, of the proposed method.

1. Introduction

Nowadays, the rapid development of Internet-of-things and radio-frequency identification sensor systems [1], in combination with evolution in satellites and wireless communication technologies, enables the tracking of moving objects such as vehicles, animals, and people [2]. Through mobility tracking, we collect a huge number of data, which give us considerable knowledge. Moving objects keep a continuous trajectory, however, this is described by a set of discrete points acquired by sampling at a specific rate and time-stamps for a period [3]. A simple description of a trajectory is as a finite sequence of pairs of locations with time-stamp, which meets GIS (Geographical Information System) database [2]. In the real world, people activities constitute spatiotemporal trajectories that are recorded either passively or actively, and can be used in human behavior analysis. Some examples of active recording are the check-ins of a user in a location-based social network or a series of tagged photos in Flickr, as each photo has a location tag (where) and a time-stamp (when). Moreover, an example of passive recording are credit card transactions, as each transaction has a corresponding time-stamp and location id. Modern vehicles such as taxies, buses, vessels and aircrafts have been equipped with GPS (Global Positioning System) devices that enable reporting of time-stamped locations [2]. Therefore, real-life examples make moving object and trajectory data mining important. Animal scientists and biologists can study the moving animals trajectories, for example to understand their migratory traces, behavior and/or living conditions. Meteorologists, environmentalists, climatologists, and oceanographers collect trajectory data of natural phenomena, as they capture environmental and climate changes, can forecast weather, manage natural disasters (hurricanes) and protect the environment. In addition, trajectory data can be used in law enforcement (e.g., video surveillance) and traffic analysis to improve transportation networks. More to the point, the evolution of technology in the domain of mobile devices, in combination with positioning capabilities (e.g., GPS), pave the way to location-based applications such as Facebook and Twitter. Indeed, social media networking has thoroughly changed people’s habits in each aspect of their life, from personal and social to professional. A GPS sensor allows users to periodically transmit their location to a location-based service provider (active recording) to retrieve information about proximate points. However, queries based on location may conceal sensitive information about an individual [4]. Therefore, the privacy and anonymity preserving problem of mobile objects remains an important issue, which was in this work.
The above issues, along with the work in [5], motivated us to perform the research presented in this paper. Specifically, k-NN queries are applied on the trajectory data points of mobile users in cases with or without clustering. In both methods, mobile users are camouflaged by their k nearest neighbors, which constitute their k-anonymity set. In the case of clustering, the trajectory points of all users in each time-stamp are grouped based on K-means (on-line clustering) and k-NN queries are applied to find the indexes of k nearest neighbors of all users, inside the cluster they belong to. Irrespective of the method used, if k nearest neighbors indexes remain the same or vary at a low rate in time, it is difficult for an adversary to discover a mobile user based on history data. We experimented on how this set changes in cases with or without clustering for different combinations of dimensions (x,y,g,v), which is the main contribution of this work. We provide an analysis of the effect of dimensions on k-anonymity method. We conclude that, when a dataset contains a large number of attributes that are open to inference attacks, we are faced with a choice of either completely suppressing most of the data or losing the desired level of anonymity. The rest of this paper is organized as follows: In Section 2 are described in detail: (a) the clustering and classification problems along with the algorithms used; (b) the system architecture; (c) the problem definition; (d) the system model and adopted methods; and (e) the k-anonymity privacy preserving; and (f) the experimental environment and datasets source. In Section 3, previous related works are presented in relation to our approach and future directions of this work are recorded. Finally, Section 4 presents the graphical results gathered from experiments and the conclusions of their evaluation in terms of the studied problem.

2. Materials and Methods

2.1. Clustering

Clustering is an iterative procedure that groups similar data, primarily concerned with distance measures, and is a fundamental method in data mining. Clustering methods are classified as partition-based, hierarchy-based, density-based, grid-based and model-based. Moving object activity pattern analysis (i.e., similar motion patterns) and activity prediction are some typical application scenarios of trajectory clustering [3]. In our case, clustering is used to organize moving objects into groups so that the members of a group are similar, with great compactness, according to a similarity criterion, based on spatiotemporal data. Specifically, for a group of mobile objects, we apply clustering of their current trajectory point attributes (spatial coordinates, angle, and velocity) in specific time-stamps. In other words, we apply on-line clustering.
K-means (Algorithm 1) [6], used in this work, belongs to partitioning clustering methods and is popular due to its simplicity. It is based on the squared error minimization method and the main advantage of K-means is that, in each iteration, only the distance between a point and the K cluster centers is computed. Its time complexity is O ( N K t ) , where N, K and t are the number of data objects, clusters and iterations, respectively. However, K-means clustering suffers in some points, e.g., the number of clusters K must be known in advance, and its computational cost with respect to the number of data observations, clusters and iterations. K-means and other clustering algorithms use the compactness criterion to assign clusters, which is our concern, in contrast with spectral clustering in [7], which makes use of the spectrum (or eigenvalues) of the similarity matrix of the data and examines the connectedness of the data. It is expected that K-means algorithm may be a good option for exclusive clustering (which we considered in this study) against Fuzzy C-Means, which assigns each mobile object to different clusters with varying degrees of membership. Therefore, it may give good results for overlapping clusters. Furthermore, it has much higher time complexity than K-means [8].
Algorithm 1 K-means.
1:
Input:number of clusters K and training data P
2:
Output:a set of K clusters
3:
Method:Arbitrarily choose K objects from P as the initial cluster centers
4:
repeat
  • assign each object to the cluster to which the object is the most similar based on the mean value of the objects in the cluster
  • Update the cluster means, i.e., calculate the mean value of the objects for each cluster
5:
untilno change

2.2. Classification

Classification is an unsupervised machine learning approach and concerns the assigning of class labels to a new sample on the basis of a training dataset whose sample class membership is known. The principle behind nearest neighbor method is to find a number of training samples closest in distance to the new point, and predict the class label from these. The number of k nearest neighbors can be user-defined, constant or varying, based on the local density of points (radius-based neighbor learning). The most common distance measure is Euclidean. The k-Nearest Neighbor (Algorithm 2) [9] is a non-parametric method and by far the simplest of all machine learning algorithms. The use of k-NN solely has great calculation complexity. This means that the classification of a new data point needs the calculation of distances between it and all training dataset points, with the ultimate goal choosing the k nearest neighbors. To overcome this issue, we combine it with a clustering method, namely K-means, which reduces the size of training sets efficiently as well as the computational time of k-NN. It is worth mentioning that the application of k-NN inside a cluster has no sense if the cluster size is less than the number of k nearest neighbors we are looking for, inside it. Hence, the appropriate combination of parameters K, since K influences cluster size, and k is crucial. Despite the aforementioned advantages, it gives to each labeled sample the same importance for classification, in contrast with what fuzzy classifier considers [10]. Finally, in a recent work [11], the authors described and suggested an efficient method in which kernel fuzzy clustering is combined with harmony search algorithm for scheme classification.
Algorithm 2k-nearest neighbor.
1:
Input:X:training dataset, C l X :class labels of X, p:testing point to classify
2:
Method:Compute distances d ( X i , p ) to every training point X i and keep the indexes I of the k smallest distances.
3:
Select the k labels C l X ( I )
4:
returnI and the majority class c l b in C l X ( I )

2.3. Useful Definitions

We consider points in a d-dimensional space D . Given two points a and b, we define as d i s t ( a , b ) the distance between a and b in D . In this paper, we utilize the Euclidean distance metric, which is defined as
d i s t ( a , b ) = i = 1 d a [ i ] b [ i ] 2
where a [ i ] and b [ i ] denote the values of a and b along the i dimension in D .
Definition 1.
k-NN: Given a point b, a dataset X and an integer k, the k nearest neighbors of b from X, denoted as k N N ( b , X ) , is a set of k points from X such that p k N N ( b , X ) and q { X k N N ( b , X ) } , d i s t ( p , b ) < d i s t ( q , b ) .
Definition 2.
k-NN Classification: Given a point b, a training dataset X and a set of classes C l X where points of X belong, the classification process produces a pair ( b , c l b ), where c l b is the majority class b belongs.
Definition 3.
Clustering: Given a finite dataset P = { a 1 , a 2 , ..., a N } in R d , and number of clusters K, the clustering procedure produces K partitions of P such that among all K partitions (clusters) C 1 , C 2 , ..., C K it finds one that minimizes
arg min C 1 , C 2 , , C K = P c = 1 K a C c a 1 | C c | a j C c a j 2
where | C c | the number of points in cluster C c .

2.4. System Architecture

In this section, we briefly describe how the system, used to extract the desired datasets, operates and extracts the trajectory data points. The system architecture is based on SMaRT (Spatiotemporal Mysql ReTrieval) framework [12] and works as an expansion sub-system that produces new datasets out of sample points that are stored in a relational database. It exploits Google maps API to define trajectories between two randomly chosen points that follow road paths over a geographical area of interest. To support the above functionality, a class was created by extending the existing framework and giving the corresponding user interface. The data flow of this sub-system, as shown in Figure 1, follows a three-stage path. Before the beginning of the process, there is an initialization phase, while the database is populated with manually pre-created trajectories from a comma separated file (csv) through the importing class that is implemented on SMaRT framework. The trajectory objects T i are in the form of sequential spatiotemporal points P n and stored in the database as tuples of latitude, longitude, time-stamp and objid where objid is a unique identification integer number of the moving object that participates in our analysis and takes values from 1 (the first mobile object objid) to N (the Nth mobile object objid). Moreover, the dimensions of latitude and longitude are transformed to the equivalent Cartesian coordinates (x,y), through Mercator transformation, to efficiently calculate measures such as distance between points, velocity and angle vectors. After the initialization phase is over, a repeated procedure takes place as described below.
First, two points are randomly chosen from a relational database with a significant Euclidean distance between them. Because the transformation every point is at a distance measured in meters, the distance between them is given by ( x 2 + y 2 ) and should be over a threshold of 10 m. This threshold is given by heuristic way and it eliminates the problem of zero velocity and angle calculations. Then, an API call (see Figure 2) is raised against Google Maps Directions API Service given the points along with route settings information. This information may contain the way in which the target object moves, as it could be pedestrian, car or bicycle, if it should follow toll roads or not, and is most helpful if the response should contain other relative routing paths beside the first proposed one. By this last attribute, trajectories can be multiplied by obtaining not only the proposed routing path but also the relative ones. This method also solves the drawback that Google service imposes, which restricts the service calls to 10 per second by introducing a slight delay time in the insertion process. Second, the API response, which contains the routing paths following the road network that connect the two points of reference, provides the information to the class that constructs the trajectory object. For each point of the trajectory, several calculations take place, such as acquiring the time-stamp t n of the moving object at this specific point compared with the user defined velocity scale v n and the Euclidean distance d n from the previous point. In addition, the angle vector g n is measured using the coordinates ( x n , y n ) of the specific point and the next point ( x n + 1 , y n + 1 ) of the trajectory. Because of the randomness of the chosen reference points of the API request, there is a difference between the number of points that the user provided as the trajectory multitude and the API response routing path. In case some routing path R n has more points than the user defined upper limit, it is shortened by that number and the endpoint of the final trajectory object T n becomes the last point in the array. In the opposite situation, the trajectory is discarded and the current thread resets its state to make a new request. This procedure ends up with the final trajectory object T n being stored to the database. For the storage procedure, a class from the SMaRT framework is used, which checks all the rules that the database instance implies. When the user defined number of trajectory objects is achieved, the whole process stops with a termination message containing the number of trajectories that was stored in the database, the time spent for the procedure, the number of tuples inserted in the database and the space used for those trajectory objects including the overhead of the indexing of the appropriate fields in the database.
In the event of failure of any of the stages that should be followed, all trajectory information is discarded and each of these processes is restarted. Thus, to overcome subsequently failures, a parallel methodology is deployed, where a number of user defined simultaneous multiple calls is instantiated at the beginning of each process. After each call response, a new trajectory is stored in the database, given a new object ID, denoted as objid in the following. Those that failed are restarted with a different set of points. Finally, in terms of space consumption, each point of a trajectory object costs 17 bytes ( 2 × 4 bytes for the representation of the coordinates ( x n , y n ), 5 bytes for the time-stamp and 4 bytes for the objid) when it is stored as a simple point with the three dimensions stored separately as ( x n , y n , t n ) and the objid. When it is stored as a single spatial point with extra fields for the time-stamp and the objid, the cost goes up to 34 bytes (25 bytes for the spatial representation of ( x n , y n ), 5 bytes for the time-stamp and 4 bytes for the objid).

2.5. Problem Definition

We studied the problem of privacy preserving considering spatiotemporal databases of N records with d attributes each. The spatiotemporal data are the location data of a number of mobile users along with the time-stamp of each position, as shown in Table 1. Through SMaRT system, we have in our disposal trajectory data, which give us information about angle direction and velocity amplitude. Therefore, for each record, i.e., mobile user, we know the values of four attributes. We employ a popular anonymization approach, called k-anonymity, such that any organization or adversary can deduce information about the mobile user identity by observing its location attributes. With k-anonymity, attributes can be suppressed, namely their values can be replaced by “*”, or generalized [13] until each row is identical with at least k 1 other rows. At this point, the database is said to be k-anonymous and, thus, prevents database linkages. In our case, we select to anonymize location data attributes by employing a classification method that enables us to construct the k-anonymity set of each user per time-stamp. The rationale behind anonymity preserving lies in the preserving of the k nearest neighbors from one position to another. To this end, we investigated the problem considering two approaches. In the first approach, the anonymization is handled as a clustering problem, in which the d-dimensional space of attributes is partitioned into homogeneous groups so that each group contains at least k records, namely the minimum number of records in a cluster, to satisfy k-anonymity. To achieve it, as a first approach, which will be elaborated in the future, we adopt the K-means clustering method. The k-anonymity set of each user is formed based on the cluster it belongs to. In the second approach, the anonymity set is formed again by the k nearest neighbors indexes but without considering d attributes space partitioning. The maximum number of clusters is K = N k , where N is the total number of records in the dataset and k < < N is the anonymity parameter for k-anonymization.
For L trajectory points, which correspond to L time-stamps, we compute for each mobile user i its k nearest neighbors indexes and record them in a vector of the form k n n s i t = [ i d i t 1 i d i t 2 i d i t k ] for t = 1 , 2 , , L . An example of such sets for N mobile users is shown in Table 2. For each user, we measure how many of the k nearest neighbors remained the same from one position to another.
Definition 4.
(k-anonymity). A spatiotemporal database is k-anonymous with respect to a set of attributes d if at most one of the k nearest neighbor has changed from one time-stamp to another so that each mobile user cannot be distinguished from its k 1 neighbors.
According to the authors of [14], k-anonymity is able to prevent mobile users’ identity from being unveiled. This means that the probability of a user re-identification between its k neighbors is only possible with 1 k . Nevertheless, k-anonymity may not protect users against attributes disclosure. Motivated by this argument, we evaluated the robustness of both approaches by computing how many of the nearest neighbors, out of the k, remained the same, and the previous probability per time-stamp.

2.6. System Model

We consider N mobile users in R 2 . The configuration space, namely, the environment that objects are moving, may be the free space or a road network (constrained or unconstrained) [3]. In our case, we considered unconstrained road network, as described in Section 2.4, where mobile users are densely distributed and do not develop high speeds [12]. We excluded national or international road networks, since we cannot assume that users are moving with linear velocity on these networks.
Each ( x i j , y i j ) represents the position (Cartesian coordinates) of the mobile user j in time-stamp t i j or point i of its trajectory j [3]. For each point i in trajectory j, we define in four-dimensional space a vector D i j = ( x i j , y i j , g i j , v i j ) , i = 1 , 2 , , L , which is described by the location coordinates ( x , y ) and motion pattern ( g , v ) , respectively. For the first point of each trajectory, direction and velocity are defined with respect to point ( 0 , 0 ) .
We approach the problem of privacy preserving on spatiotemporal databases with two methods. The first one is called Method-Without-CLustering (MWCL, Algorithm 3) and the second one is called Method-with-CLustering (MCL, Algorithm 4). In the latter, we apply on-line clustering, i.e., in each time-stamp t, we group into clusters the mobile users based on their vector values D i j that moment. This vector is formulated depending on which of the following attributes x, y, g, v, we choose to apply K-means and k-NN algorithms.
Algorithm 3 MWCL.
1:
Input:the number of k nearest neighbors, the number of mobile users N, vectors D i j of N users in L time-stamps
2:
Output:k nearest neighbors indexes of N users in L time-stamps
3:
for i = 1 : L do
4:
    for J = 1 : N do
5:
        Compute vector D i j of user j in time instant i
6:
        Apply k-NN between the vector D i j and the vectors { D i j } j = 1 N of all users to find the set of k-NN indexes, I i j , of user j in time-stamp i
7:
    end for
8:
end for
Algorithm 4 MCL.
1:
Input:number of k nearest neighbors, number of mobile users N, vectors D i j of N users in L time-stamps
2:
Output:k-NN indexes of N users in L time-stamps
3:
for i = 1 : L do
4:
    for j = 1 : N do
5:
        Compute vector D i j of user j in time instant i
6:
        Apply k-NN method between the vector D i j and the vectors { D i j } j = 1 N inside the cluster C i j of user j in time-stamp i and find the set of k-NN indexes, I i j .
7:
    end for
8:
end for
We define a location data security metric, which we call vulnerability. Vulnerability quantifies and measures the robustness of each method. Specifically, it expresses the rate with which k nearest neighbors of each mobile user changes. The vulnerability of each method is computed as the mean value of vulnerabilities of all users in L time-stamps. The less the neighbor indexes change (e.g., objid), the lower the value vulnerability takes.
Suppose a collection of trajectories T = { T 1 , , T N } (trajectories database) of equal length L. Each trajectory consists of a sequence of time ordered positions a mobile user goes through as it moves from a start point to a specific destination. It is a vector of the form
T j = { ( x 1 j , y 1 j , t 1 j ) , ( x 2 j , y 2 j , t 2 j ) , , ( x L j , y L j , t L j ) } .
Definition 5.
Vulnerability Algorithm 5: Given a mobile user j, a set I i j with the k nearest neighbors indexes in time-stamp i, V i j is defined as
V i j = 1 | I i j I i 1 j |
where 0 V i j 1 , | I i j I i 1 j | , and the number of k indexes remain the same.
Algorithm 5 Vulnerability.
1:
Input:sets I i j with the k nearest neighbors indexes, number of mobile users N and time period L
2:
Initialization: V 1 j = 1 k
3:
Output:Vulnerability values of N mobile users in L time-stamps
4:
for i = 2 : L do
5:
    for j = 1 : N do
6:
         V i j = 1 | I i j I i 1 j |
7:
    end for
8:
end for

2.7. Privacy Preserving Analysis

The rising advances in video tracking technology has attracted the scientific attention of understanding of social behavior of swarming animals. The video tracking method can automatically measure an individual’s motion states using videos from different camera views [15]. Swarming behavior is connected with collective behavior, which usually happens in large groups of animals such as birds, mosquitos, and other insects [16]. Researchers employ mathematical models to simulate and understand the swarm behavior. The simplest mathematical models generally consider that individual animals move in the same direction as their neighbors, remain close to them (thus, neighbors remain constant) and avoid collisions with these neighbors. In our study, mobile users constitute the “swarming animals” who have collective motion behavior and either organize into groups or not, as described in the previous section. It is worth making privacy preserving analysis in the case that mobile objects are moving randomly (thus, independently of each other) from one position to another. In both approaches (either applying on-line clustering or not), we observe that mobile users’ nearest neighbor indexes change and, thus, the vulnerability of both methods increases. In the case of random motion, mobile users’ behavior is similar to that of a swarm of bees or flies. Their direction (angle) is linear and velocity amplitude is approximately constant. Similar motion characteristics have users in a road network, but they do not move randomly. Generally, a mobile object in a dense road network is moving on a piece-wise linear random path with a constant speed.
Let X t i be a sequence of independent random variables that relate to the neighbors of a mobile user i which changes in a time interval t i . To maintain low levels of vulnerability, much less than 1 and close to 0, users’ motion behavior should not change considerably so that their k nearest neighbors remains the same from one time-stamp to another. This results in the following theorem:
Theorem 1.
The probability that the nearest neighbors do not remain the same within a time interval ( 0 , t i ] and at least l of them change such that users can be distinguishable from an adversary, tends to 1 if objects move randomly.
lim l k P ( X t i l ) = 1
Proof. 
We conducted a Poisson experiment. We consider that the number of successes that are resulting from the Poisson experiment termed as a Poisson random variable with average number of successes λ and k a positive integer which relates with k-anonymity level.
  • The outcomes of the experiment were discrete. Specifically, they concerned the nearest neighbor’s sustainability and are classified as either success (neighbors remained the same are at least k 1 ) or failure (number of neighbors remained the same are at most k 2 , which is less than k 1 ).
  • λ is the average or expected number of successes within a time interval t i for a mobile user i, E ( X t i ) and assumed to be known and constant throughout the experiment.
  • Poisson describes the distribution of events. Each event is independent of the other events.
  • The probability for a mobile user i to have at least l different neighbors, in a time-interval t i (occurrence of a failure) is written as
    P ( X t i > l ) = 1 P ( X t i l ) = 1 λ l e λ l !
    lim l k P ( X t i l ) = lim l k ( 1 λ l e λ l ! )
 □
Due to the random moving assumption, it is highly certain that the indexes of all k nearest neighbors will change. Hence, the above probability will be very close to 1. If k is large enough, previous limit will tend to 1.

2.8. Experimental Data and Environment

The experimental data used in this paper come from SMaRT Database GIS Tool in http://www.bikerides.gr/thesis2/. We experimented on two trajectory datasets of 400 and 2000 bike riders, as shown in Figure 3, in the area of Corfu, with 100 trajectory points each. For each trajectory point, we have available the four dimension values for 100 time-stamps, i.e., the Cartesian coordinates (x,y), the angle (g), and the velocity (v). The environment in which experiments were carried out has the following characteristics: Intel(R) Core(TM)2 Duo CPU E8400 @ 3.00 GHz 3.00 GHz, 16 GB Memory, Windows 10 Education, 64-bit Operating System, x64-based processor and Matlab 2018a.

3. Discussion

In the last decade, the problem of privacy preserving of location data has been of particular concern to researchers. Hence, many research works have been conducted to reinforce the security level previous ones provide, such as the association of location data with pseudonyms.
In a recent work [17], the authors recommended an asymmetric Private Equality Testing protocol (PET) that allows two users to communicate with each other safely and without the involvement of a third party. PET requires two public-key exponentiation per each user and needs three rounds to complete. Both users compute their private input through hash functions and send it to each other. The output of protocol in the end of third round indicates the equality or not of two keys and as a result their communication. This protocol can be used by location-based social services to find the location of users who are in the same region or in a specific radius depending on the preference of user. The security of private inputs of involver lies in the use of Computational Diffie–Hellman and Discrete Log Problem. In addition, asymmetry does not reveal whether the computation and equality of inputs are successful and that prevents observers to identify if the connection is established or not.
More to the point, k-anonymity method has been used to reinforce and quantify location data privacy. If k-anonymity is achieved, a person cannot be distinguished from k 1 other people [4]. In the context of k-anonymity, authors in [4] proposed an enhanced Dummy-Location Selection (DLS) algorithm for users in LBS. From a different perspective, authors in [14] aimed at the utility improvement of differentially private published datasets. More specifically, they showed that the amount of noise required to fulfill ϵ -differential privacy can be reduced if noise is added to a k-anonymous version of the dataset, where k-anonymity is achieved through a specially designed micro-aggregation of all attributes. As a result of noise reduction, the general analytical utility of the anonymized output is increased. Moreover, authors in [18] attempted to protect users’ private locations in location-based services adopting the spatial cloaking technique, which organizes users’ exact locations into cloaked regions. This method satisfies the k-anonymity requirement within the cloaked region. They proposed a cloaking system model, which they called “anonymity of motion vectors” (AMV), that provides anonymity for spatial queries minimizing the cloaked region of a mobile user using motion vectors. The AVM creates a search area that includes the nearest neighbor objects to the querier who issued a cloaked region-based query. In addition, in [19], the authors suggested a clustering based k-anonymity algorithm and optimized it with parallelization. The experimental evaluation of the proposed approach shows that the algorithm performs better in information loss, due to anonymization, and its performance is compared with the existing algorithms such as KACA and Incognito.
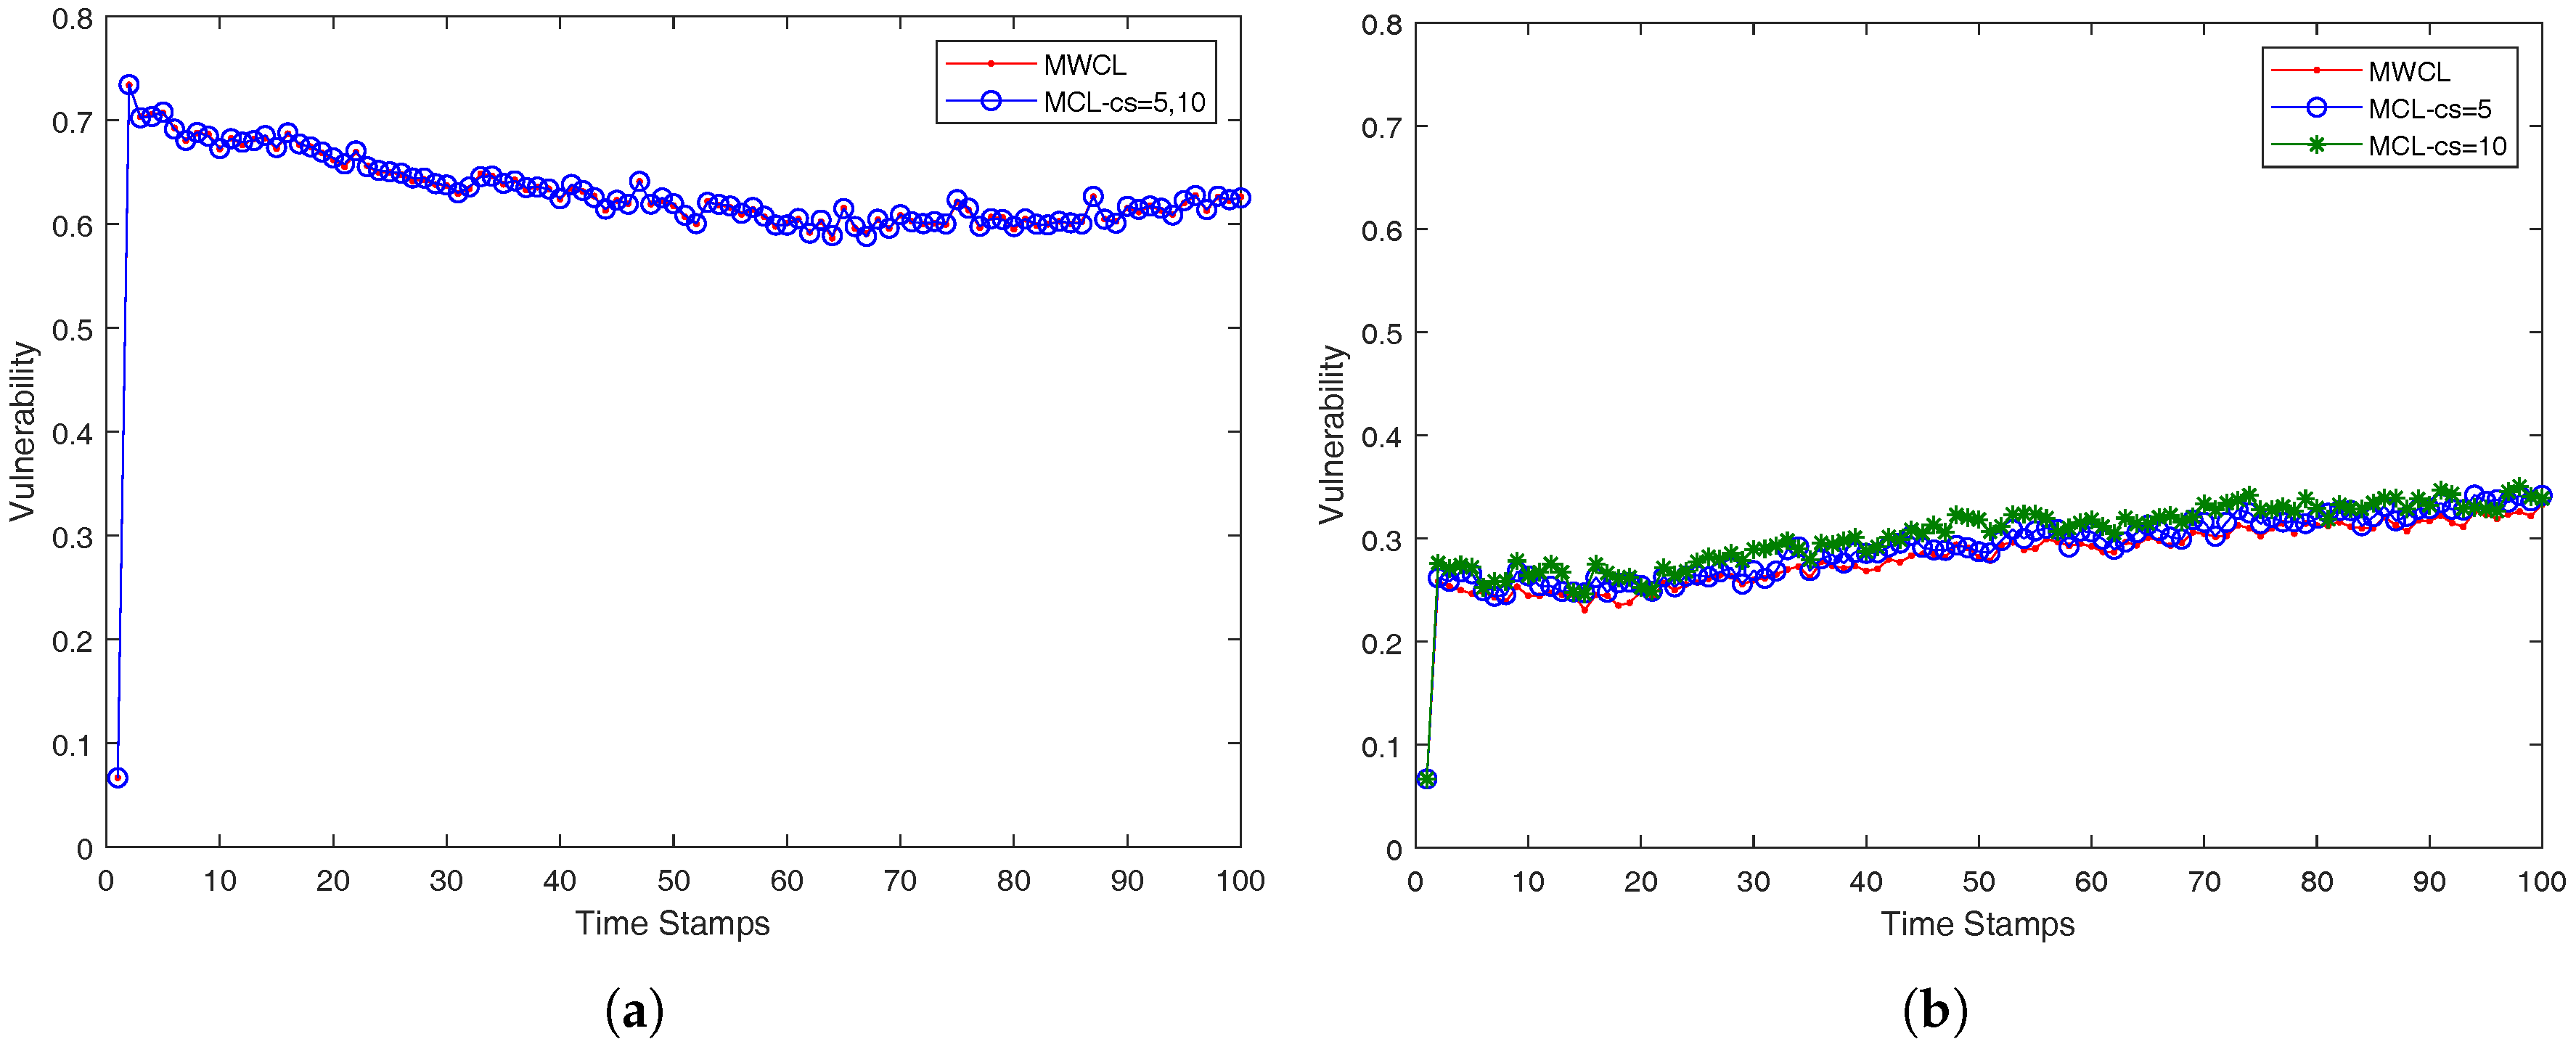
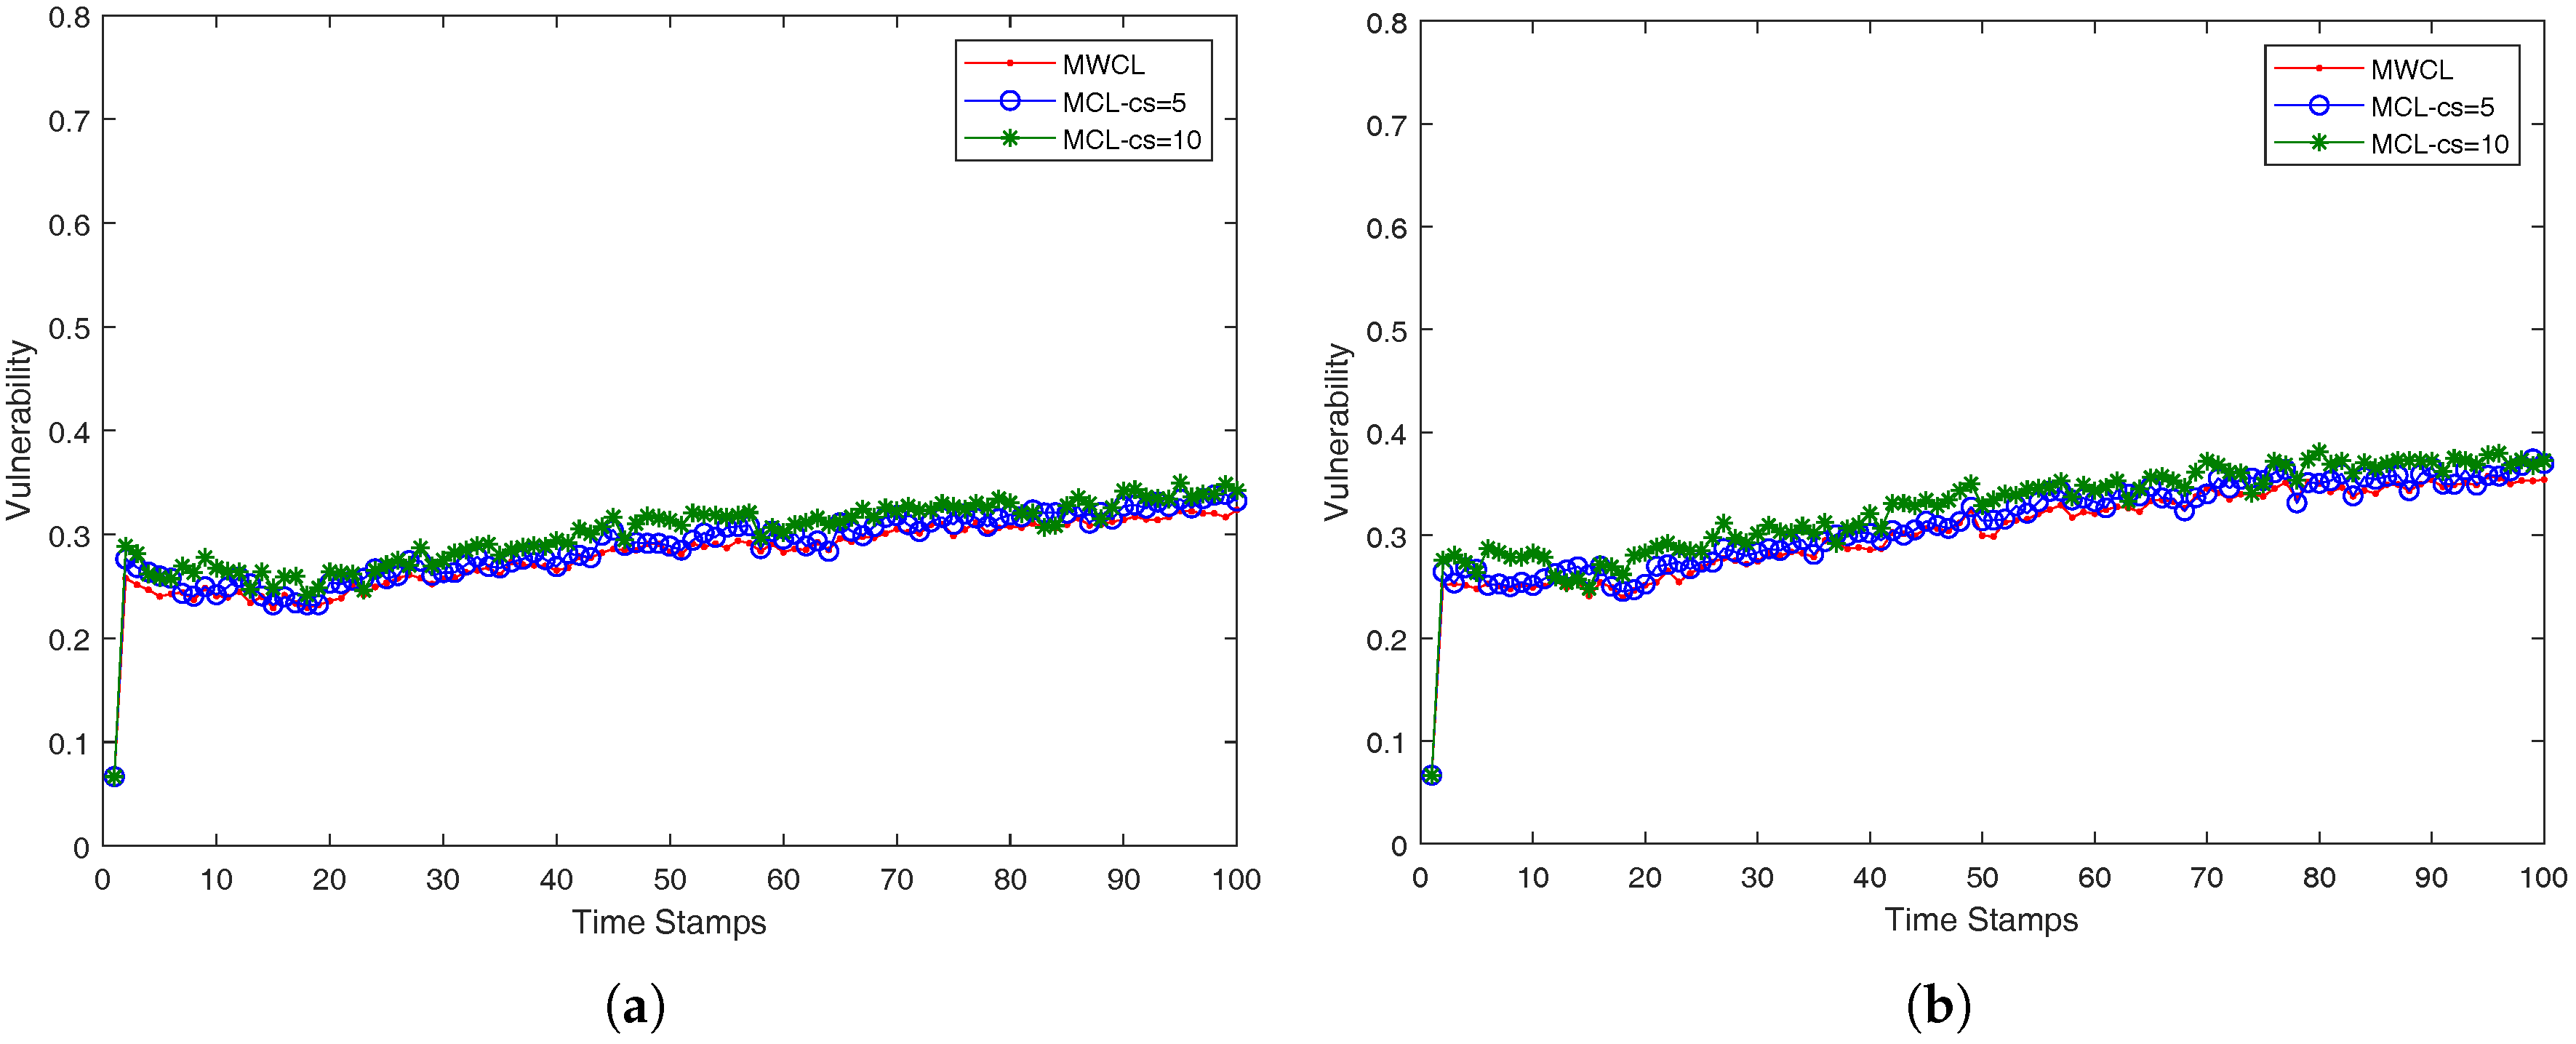
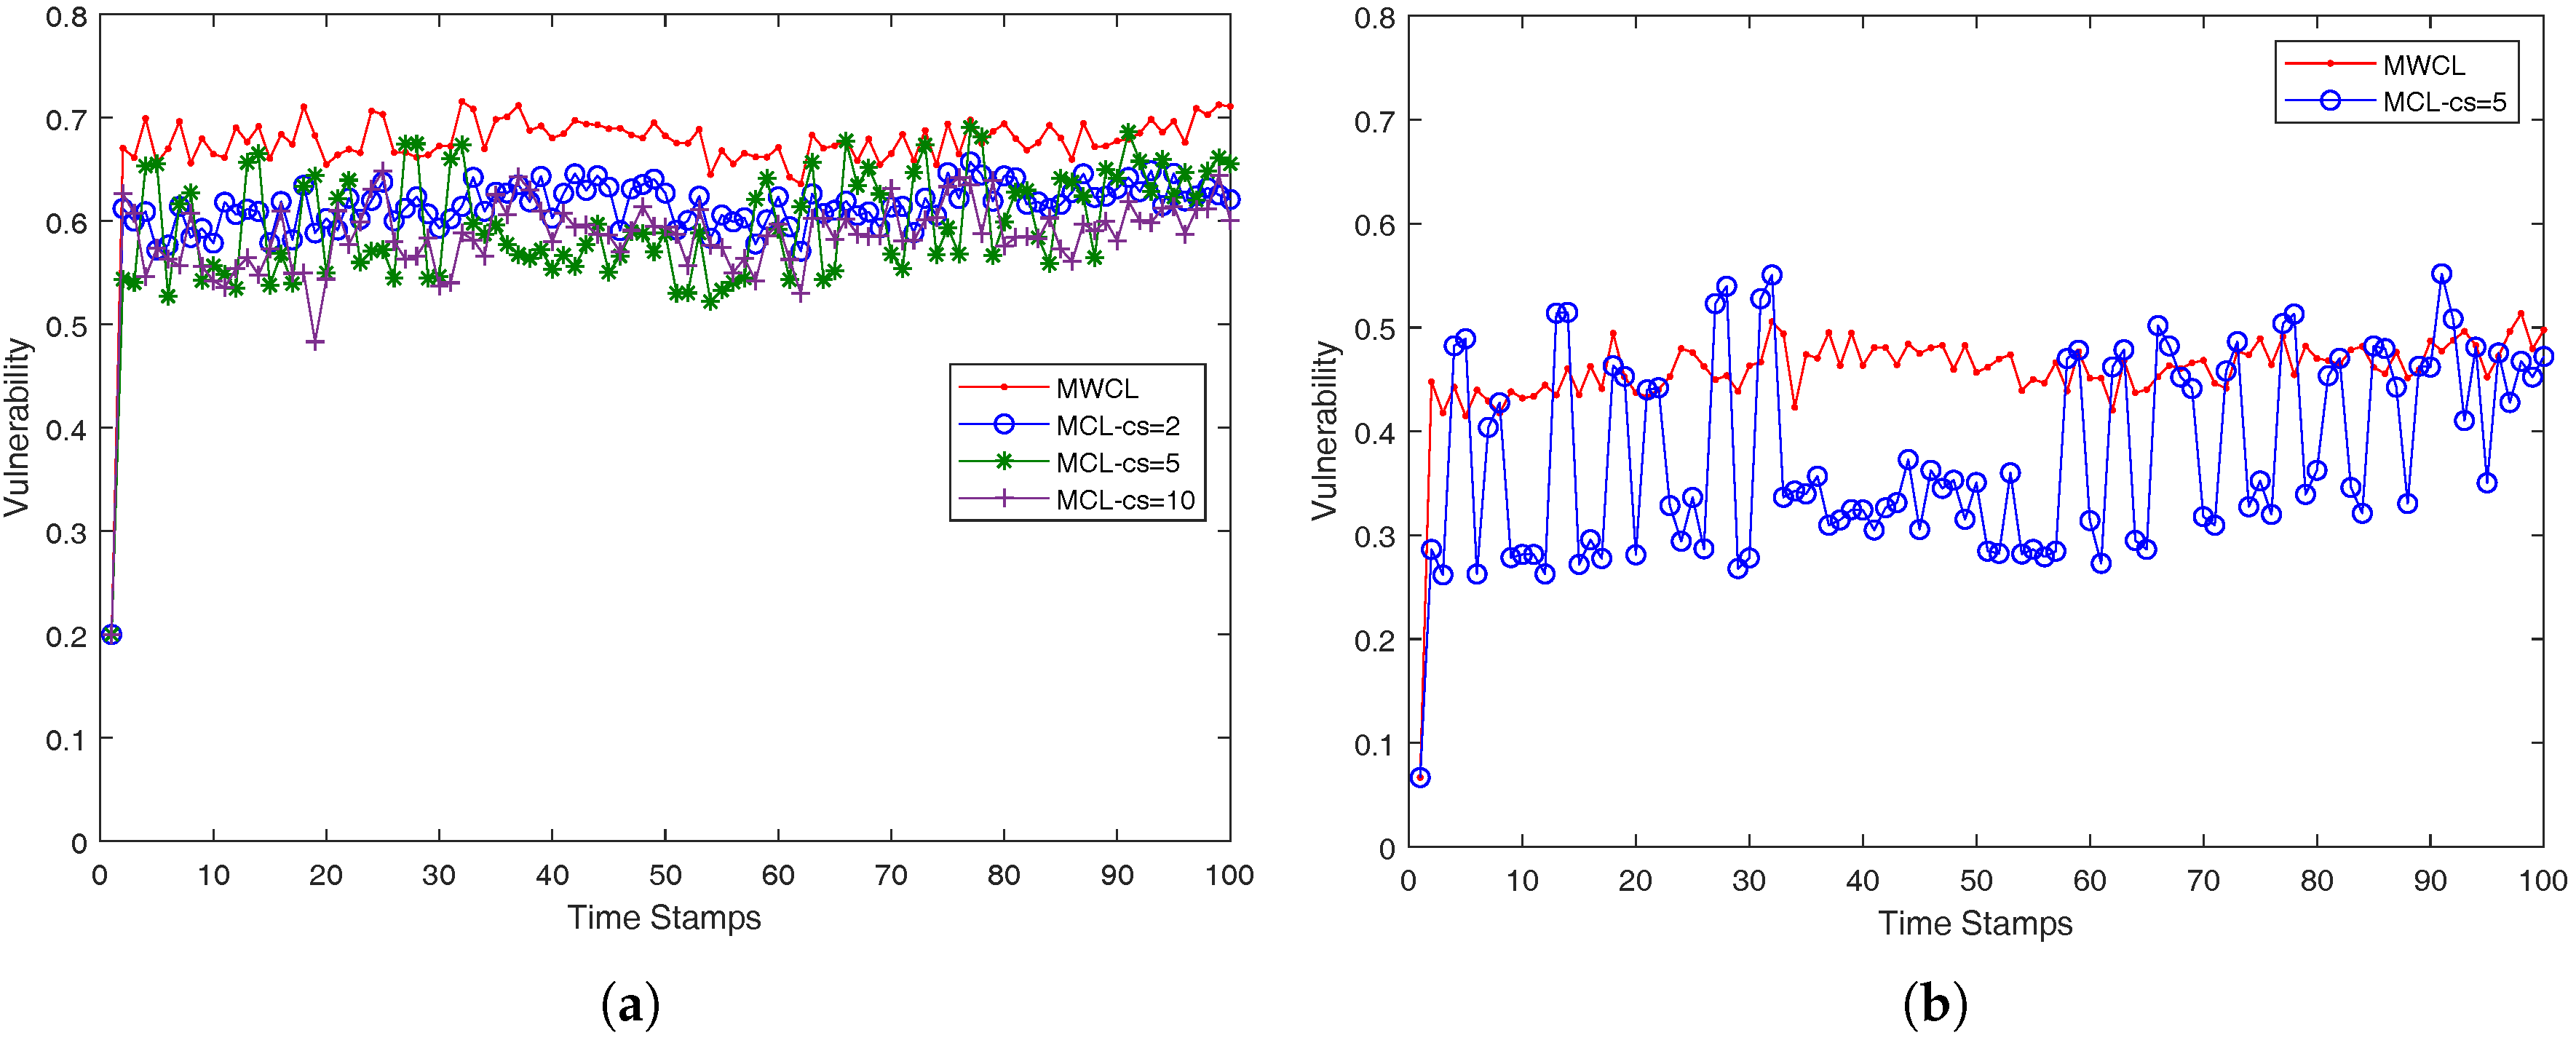
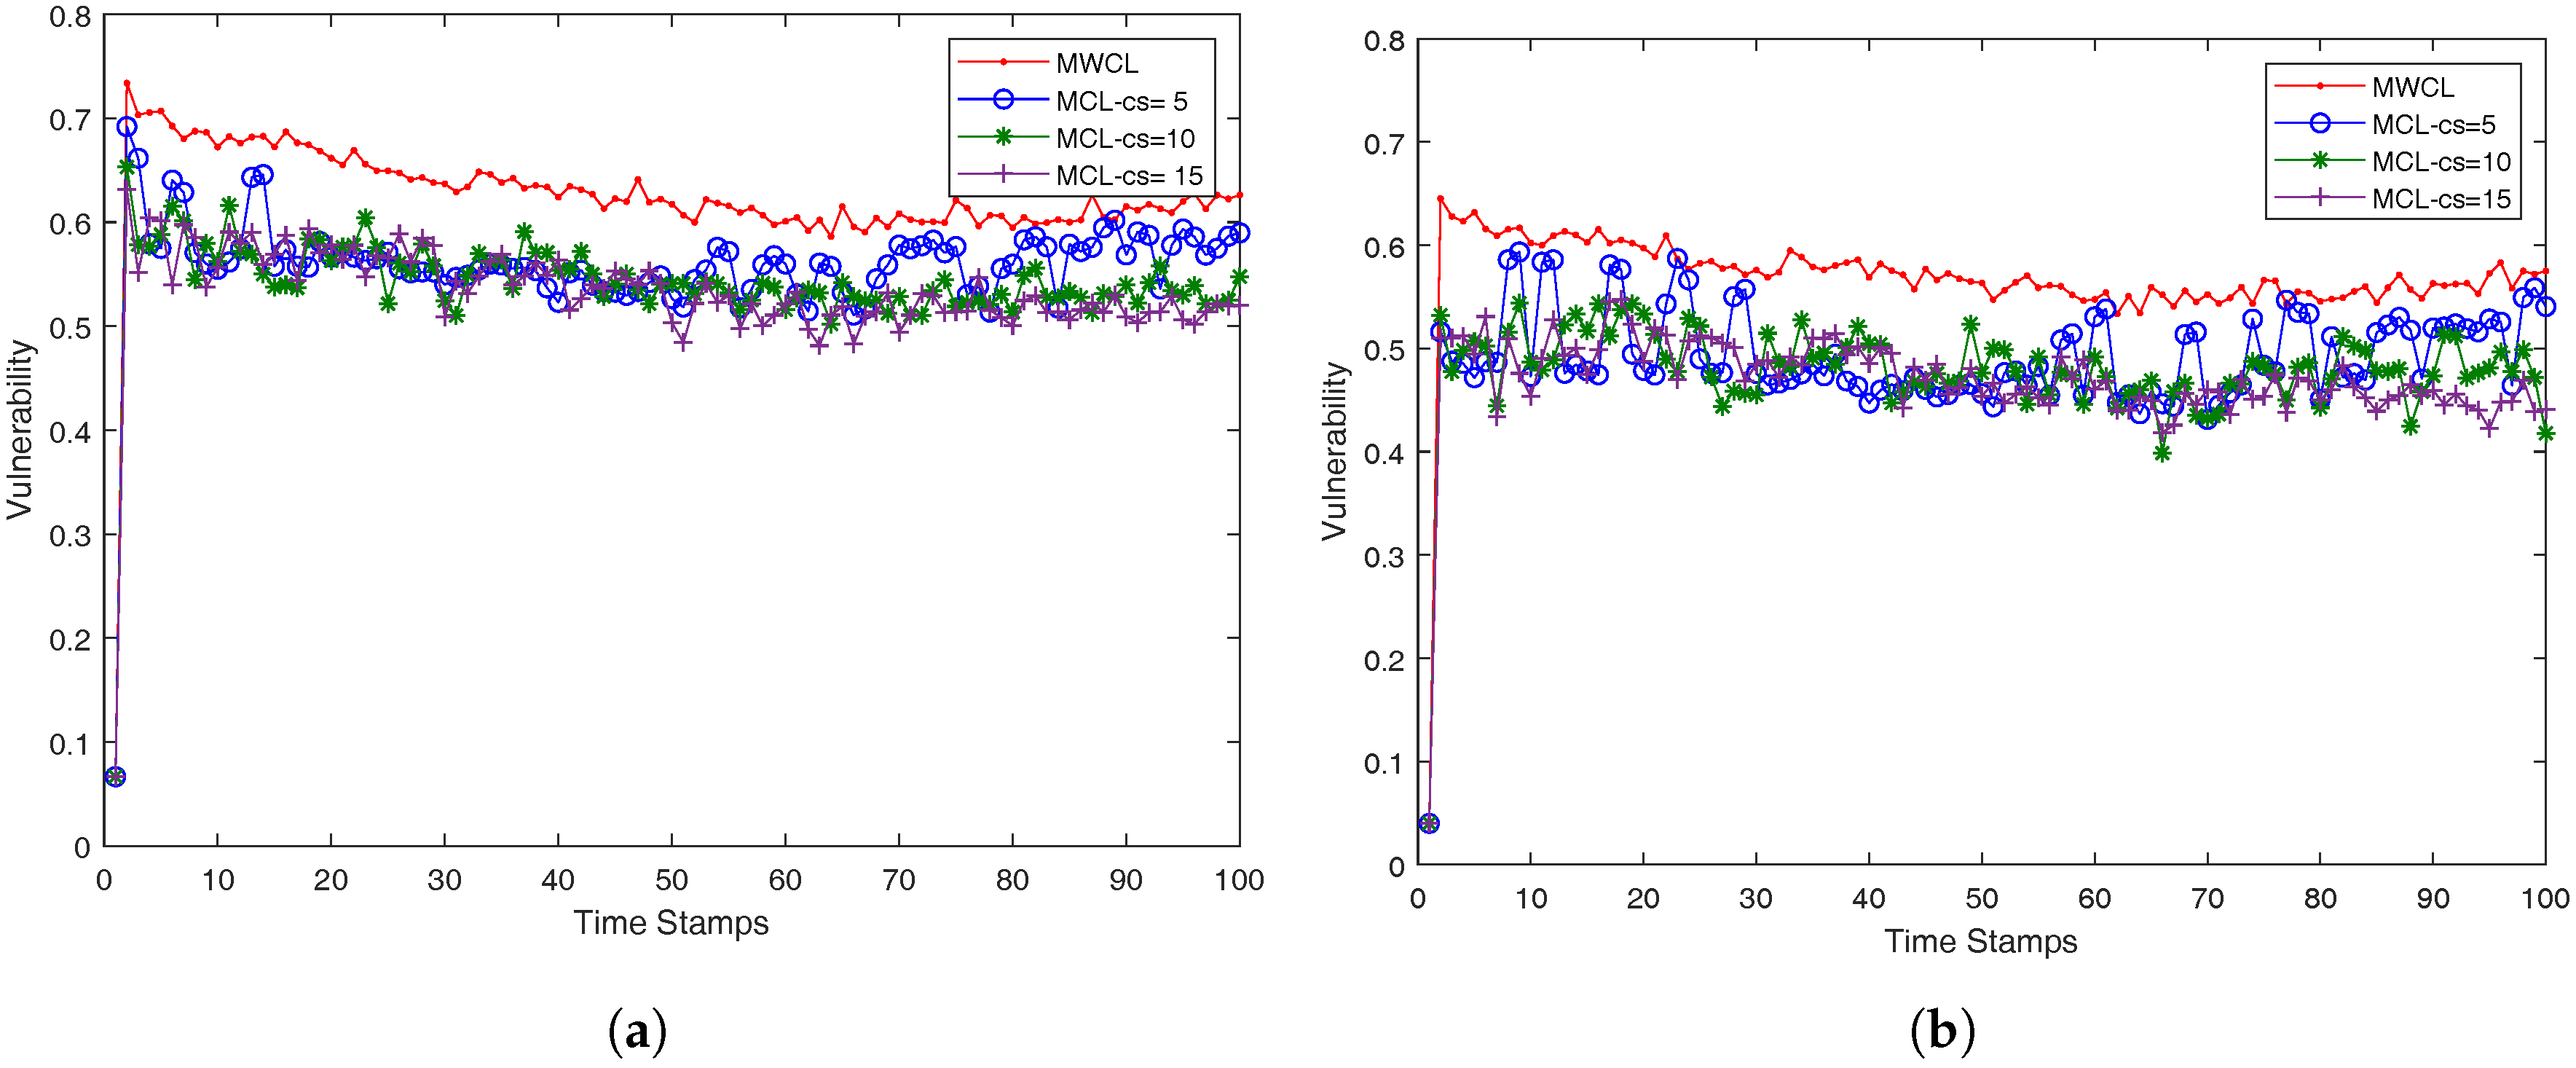
In our case, we approach the k-anonymity preserving as follows. We investigated the impact of the used attributes (x, y, g, and v) in the robustness of the proposed methods, MWCL (Method-Without-CLustering) and MCL (Method-with-CLustering) which are presented in a compact form in Algorithms 3 and 4. Since, from time-stamp to time-stamp, the number of nearest neighbors may not remain the same and be less than k, the robustness is decreased, namely the probability one mobile user is identified from its anonymity set may be higher than the optimum value 1 k . The proposed MCL (Method-with-CLustering) method in Algorithm 4 adopts a simple K-means clustering micro-aggregation technique that maintains k-anonymity, which was the aim of this study. However, the proposed approach in Algorithm 4 has some limitations and drawbacks. Firstly, it works for numeric or continuous location data, but does not work for categorical data. Secondly, although there may exist natural relations among attributes such as angle and velocity with Cartesian coordinates, the proposed algorithm cannot incorporate such information to find more desirable solutions. Moreover, the focus is too heavily placed on preserving k nearest neighbors to guarantee mobile users anonymity. As a result, the algorithm lacks the ability to address other issues (e.g., l-diversity and t-closeness) that previous works address to find more desirable solutions. Additionally, the method MCL (Method-With-CLustering), i.e., Algorithm 4, tries to minimize the within-cluster sum of squares and maximize intra-cluster sum of squares, so that the number of records in each partition is greater than k. Using K-means, there is no guarantee that the optimum is found, thus the quality of the resulting anonymized data cannot be guaranteed. Similar to all greedy algorithms, the K-means algorithm will reach a local, but not necessarily a global, minimum. Hence, the information loss is not minimized even though clusters are formed such that they contain at least k similar objects. In addition to, the Algorithm 4, designed for MCL (Method-with-CLustering), assigns mobile users to the nearest cluster by squared Euclidean distance. Using a different distance function may stop the algorithm from converging. Hence, as a first approach, we focused on this version of K-means. Moreover, the proposed technique cannot handle effectively hidden latent patterns, outliers, missing values, corrupted signals, noise, artifacts, and other disturbances. To this end, deep learning techniques and neural networks (e.g., convolution, recurrent or feed-forward neural networks) [20,21,22,23,24], due to their wide range of applications, are being studied to investigate how and to what extent they can improve the performance of our approach for spatiotemporal databases [25]. The main idea of using deep learning, known as feature learning, is to extract more effective representations of spatiotemporal database records to compute similarity between moving objects and perform clustering of mobile objects with similar motion patterns with higher performance and accuracy, such that the privacy preserving techniques achieve much lower vulnerability close to 1 k . In a future work, the simultaneous use of deep learning methods with K-means, various modifications of K-means or other clustering algorithms will be used to investigate the impact on k-anonymity. Finally, our aim was to extend this work for large-scale trajectory data and transfer the whole processing in a distributed computing environment based on Hadoop. Apache Spark is the most promising environment with high performance in parallel computing, designed to efficiently deal with supervised machine learning algorithms, e.g., k-NN [26]. Deep Learning, which is part of a broader family of machine learning methods, gains more and more attention due to the rising volume of data. Thus, deep learning platforms have been designed for mining values in big data [27]. A future direction is to design above methods and experiments in big data environments [28,29,30,31] and investigate their scalability and running time performance under different datasets and parameters k, K combinations.

4. Results

4.1. Experiments Results

In this section, the results of the experiments conducted are presented in Figure 4, Figure 5, Figure 6, Figure 7, Figure 8 and Figure 9. We relied on real data to evaluate the performance in terms of the vulnerability of MWCL (Method-Without-CLustering, Algorithm 3) and MCL (Method-with-CLustering, Algorithm 4). We experimented on two different datasets with size N = { 400 , 2000 } , respectively. The parameters of two experiments and the relevant values are presented in Table 3 and Table 4, respectively.
Parameter c s refers to the number of clusters and k to the number of nearest neighbors in terms of Euclidean distance. Concerning the MCL (Method-with-CLustering, Algorithm 4), we considered the attribute combination shown in both tables. For a fair comparison, in MWCL (Method-Without-CLustering Algorithm 3), the k-NN was applied to the same attribute combination.
We investigated the k-anonymity gradually, by adding one new attribute each time. In the first four cases of both experiments and approaches (see Figure 4, Figure 5, Figure 6 and Figure 7), we observed that the information of attribute x is not sufficient to make both methods robust enough in terms of nearest neighbors indexes change. More to the point, in the combination (x,y), although vulnerability (see Algorithm 5) dropped significantly, the usage of attributes (g,v) did not enhance it. In real datasets, many dimensions contain high levels of inter-attribute correlations. In this work, by definition, as described in Section 2.4, attributes (g,v) and (x,y) are correlated. This stems from the fact that the non-linear trajectories of the mobile users are approximated as linear ones between time-stamps. Specifically, velocity is computed as v x = x n + 1 x n t n + 1 t n , v y = y n + 1 y n t n + 1 t n and v = v x 2 + v y 2 while angle g = tan 1 ( y n + 1 y n x n + 1 x n ) . The curse of dimensionality has remained a challenge for a wide variety of algorithms in data mining, clustering, classification, and privacy, and seems to affect both methods performance in terms of vulnerability. The experimental results seem to suggest that the dimensionality curse is an obstacle to privacy preservation. It was shown that an increasing dimensionality makes the data resistant to effective privacy and achieve the lower bound of k-anonymity, i.e., 1 k . However, in practice, we showed that some of the attributes of real data can be leveraged to greatly ameliorate the negative effects of the curse of dimensionality in privacy. To obtain an even more accurate classification, we considered two more attributes in computations, the angle and velocity. However, it is doubt if we can obtain a perfect classification by carefully defining a few of these features. In fact, after a certain point, which in our case was (x,y) attributes, increasing the dimensions of the problem, by adding new features, degraded the performance of k-NN classifier. As shown in the following figures, as the dimensionality increased, the vulnerability performance, computed by Algorithm 5, improved until the optimal number of features was reached, i.e., 2. Further increasing of the dimensionality did not ameliorate vulnerability performance.
In the following figures, we present the same procedure as previously, but considering a larger dataset of size N = 2000 trajectories.
From cluster number perspective, the number of clusters c s obviously affected only MCL (Method-with-CLustering), where we see that vulnerability became a little worse as the clusters increased. This relates with the fact that, not only the average cluster size reduced but also their composition changed, and, thus, MCL (Method-with-CLustering, Algorithm 4) became more sensitive to the change of the nearest neighbors of mobile users inside the cluster. Focusing on the last combination of attributes of both experiments (see Figure 8 and Figure 9), we observed that attributes suppression, in terms of k nearest neighbors indexes computation, made MCL (Method-with-CLustering, Algorithm 4) superior in terms of vulnerability (that is, lower values), which is the main issue in k-anonymity and thus in privacy preserving. Moreover, it is the combination that highlights MCL (Method-with-CLustering, Algorithm 4) as the clusters number increases. The fact that clustering is based on all available attributes empowers cluster homogeneity and reflects better the real word communities. More to the point, when the mobile users were camouflaged by k nearest neighbors based on one of the attributes, in that case x, it is disclosed less information about them and their neighbors. Therefore, it is more difficult to break security, even if an intruder monitors history data and tries to link k 1 public records of nearest neighbors. This case keeps vulnerability in relatively high level for low values of k. It is obvious that, the more nearest neighbors are used to camouflage the mobile users inside the cluster, the lower the vulnerability becomes. In addition, in terms of computation cost, k-NN is more time effective when applied to less volume (inside cluster) and fewer dimension data. Moreover, we avoid the dimensionality effect in classification and, thus, in k-NN performance. Finally, in Figure 8 and Figure 9, we also demonstrate the impact of parameter k in vulnerability (see Algorithm 5). We observed that increasing k benefited both methods. This shows that the security of mobile users is more vulnerable when they are protected by few nearest neighbors.

4.2. Experiments Conclusions

In the context of this work, we carried out research on privacy preserving based on real spatiotemporal data. This paper proposes a k-anonymity model based on motion vectors that provides anonymity for spatial queries. Specifically, we investigated the problem of k-anonymity from dimensionality perspective and how the combination of dimensions affects both methods vulnerability, which is estimated based on Algorithm 5. We observed that the inter-attribute combinations or suppression within a record have a powerful revealing effect in the increase of dimensional case. We proved the effectiveness and efficacy of MCL (Method-with-CLustering, Algorithm 4), under specific dimensions combination, by intensive experiments. Finally, the anonymization using clustering (based on all attributes) and attributes’ suppression in k-anonymity set computation is a solution for privacy preserving.

Author Contributions

Formal analysis, E.D.; investigation, E.D., M.T.; methodology, S.S.; project administration, S.S.; resources, P.G.; software, P.G.; supervision, S.S.; visualization, E.D.; writing—review and editing, E.D., M.T.

Funding

This research work was funded by General Secretariat for Research and Technology (HSRT), Hellenic Foundation for Research and Innovation (HFRI), and supported by University of Patras.

Acknowledgments

The authors gratefully acknowledge the helpful comments and suggestions of the reviewers, which have improved both content and presentation, and their college Andreas Kanavos, for his helpful and constructive instructions during all steps of research process.

Conflicts of Interest

The authors declare no conflict of interest.

References

  1. Wu, Y.; Shen, H.; Sheng, Q.Z. A cloud-friendly RFID trajectory clustering algorithm in uncertain environments. IEEE Trans. Parallel Distrib. Syst. 2015, 26, 2075–2088. [Google Scholar] [CrossRef]
  2. Sun, P.; Xia, S.; Yuan, G.; Li, D. An overview of moving object trajectory compression algorithms. Math. Probl. Eng. 2016, 2016. [Google Scholar] [CrossRef]
  3. Yuan, G.; Sun, P.; Zhao, J.; Li, D.; Wang, C. A review of moving object trajectory clustering algorithms. Artif. Intell. Rev. 2017, 47, 123–144. [Google Scholar] [CrossRef]
  4. Niu, B.; Li, Q.; Zhu, X.; Cao, G.; Li, H. Achieving k-anonymity in privacy-aware location-based services. In Proceedings of the IEEE INFOCOM 2014-IEEE Conference on Computer Communications, Toronto, ON, Canada, 27 April–2 May 2014; pp. 754–762. [Google Scholar]
  5. Huang, Y.K. Processing knn queries in grid-based sensor networks. Algorithms 2014, 7, 582–596. [Google Scholar] [CrossRef]
  6. Zhou, P.Y.; Chan, K.C. A Model-Based Multivariate Time Series Clustering Algorithm. In Pacific-Asia Conference on Knowledge Discovery and Data Mining; Springer: Berlin/Heidelberg, Germany, 2014; pp. 805–817. [Google Scholar]
  7. He, X.; Zhang, S.; Liu, Y. An Adaptive Spectral Clustering Algorithm Based on the Importance of Shared Nearest Neighbors. Algorithms 2015, 8, 177–189. [Google Scholar] [CrossRef] [Green Version]
  8. Cebeci, Z.; Yildiz, F. Comparison of K-means and Fuzzy C-means algorithms on different cluster structures. J. Agric. Inform. 2015, 6, 13–23. [Google Scholar] [CrossRef]
  9. Tay, B.; Hyun, J.K.; Oh, S. A machine learning approach for specification of spinal cord injuries using fractional anisotropy values obtained from diffusion tensor images. Comput. Math. Methods Med. 2014, 2014, 276589. [Google Scholar] [CrossRef]
  10. Guzman, J.C.; Melin, P.; Prado-Arechiga, G. Design of an optimized fuzzy classifier for the diagnosis of blood pressure with a new computational method for expert rule optimization. Algorithms 2017, 10, 79. [Google Scholar] [CrossRef]
  11. Feng, Y.; Zhou, J.; Tayyab, M. Kernel Clustering with a Differential Harmony Search Algorithm for Scheme Classification. Algorithms 2017, 10, 14. [Google Scholar] [CrossRef]
  12. Gerolymatos, P.; Sioutas, S.; Nodarakis, N.; Panaretos, A.; Tsakalidis, K. SMaRT: A novel framework for addressing range queries over nonlinear trajectories. J. Syst. Softw. 2015, 105, 79–90. [Google Scholar] [CrossRef]
  13. Xu, Y.; Ma, T.; Tang, M.; Tian, W. A survey of privacy preserving data publishing using generalization and suppression. Appl. Math. Inf. Sci. 2014, 8, 1103. [Google Scholar] [CrossRef]
  14. Soria-Comas, J.; Domingo-Ferrer, J.; Sánchez, D.; Martínez, S. Enhancing data utility in differential privacy via microaggregation-based k-anonymity. Int. J. Very Large Data Bases 2014, 23, 771–794. [Google Scholar] [CrossRef]
  15. Dell, A.I.; Bender, J.A.; Branson, K.; Couzin, I.D.; de Polavieja, G.G.; Noldus, L.P.; Pérez-Escudero, A.; Perona, P.; Straw, A.D.; Wikelski, M.; et al. Automated image-based tracking and its application in ecology. Trends Ecol. Evol. 2014, 29, 417–428. [Google Scholar] [CrossRef] [PubMed] [Green Version]
  16. Attanasi, A.; Cavagna, A.; Del Castello, L.; Giardina, I.; Melillo, S.; Parisi, L.; Pohl, O.; Rossaro, B.; Shen, E.; Silvestri, E.; et al. Collective behaviour without collective order in wild swarms of midges. PLoS Comput. Biol. 2014, 10, e1003697. [Google Scholar] [CrossRef] [PubMed]
  17. Magkos, E.; Kotzanikolaou, P.; Magioladitis, M.; Sioutas, S.; Verykios, V.S. Towards secure and practical location privacy through private equality testing. In International Conference on Privacy in Statistical Databases; Springer: Berlin/Heidelberg, Germany, 2014; pp. 312–325. [Google Scholar]
  18. Song, D.; Sim, J.; Park, K.; Song, M. A privacy-preserving continuous location monitoring system for location-based services. Int. J. Distrib. Sens. Netw. 2015, 11, 815613. [Google Scholar] [CrossRef]
  19. Ni, S.; Xie, M.; Qian, Q. Clustering Based K-anonymity Algorithm for Privacy Preservation. Int. J. Netw. Secur. 2017, 19, 1062–1071. [Google Scholar]
  20. Wang, D.; Cui, P.; Zhu, W. Structural deep network embedding. In Proceedings of the 22nd ACM SIGKDD International Conference On Knowledge Discovery and Data Mining, San Francisco, CA, USA, 13–17 August 2016; ACM: New York, NY, USA, 2016; pp. 1225–1234. [Google Scholar]
  21. Mudgal, S.; Li, H.; Rekatsinas, T.; Doan, A.; Park, Y.; Krishnan, G.; Deep, R.; Arcaute, E.; Raghavendra, V. Deep Learning for Entity Matching: A Design Space Exploration. In Proceedings of the 2018 International Conference on Management of Data, Houston, TX, USA, 10–15 June 2018; ACM: New York, NY, USA, 2018; pp. 19–34. [Google Scholar]
  22. Zhang, L.; Tao, J. Research on Degeneration Model of Neural Network for Deep Groove Ball Bearing Based on Feature Fusion. Algorithms 2018, 11, 21. [Google Scholar] [CrossRef]
  23. Qu, H.; Wang, M.; Zhang, C.; Wei, Y. A Study on Faster R-CNN-Based Subway Pedestrian Detection with ACE Enhancement. Algorithms 2018, 11, 192. [Google Scholar] [CrossRef]
  24. Madhusudhanan, S.; Jaganathan, S. Incremental Learning for Classification of Unstructured Data Using Extreme Learning Machine. Algorithms 2018, 11, 158. [Google Scholar] [CrossRef]
  25. Wang, W.; Zhang, M.; Chen, G.; Jagadish, H.; Ooi, B.C.; Tan, K.L. Database meets deep learning: Challenges and opportunities. ACM SIGMOD Rec. 2016, 45, 17–22. [Google Scholar] [CrossRef]
  26. Reyes-Ortiz, J.L.; Oneto, L.; Anguita, D. Big data analytics in the cloud: Spark on hadoop vs mpi/openmp on beowulf. Procedia Comput. Sci. 2015, 53, 121–130. [Google Scholar] [CrossRef]
  27. Zou, Y.; Jin, X.; Li, Y.; Guo, Z.; Wang, E.; Xiao, B. Mariana: Tencent deep learning platform and its applications. Proc. VLDB Endow. 2014, 7, 1772–1777. [Google Scholar] [CrossRef]
  28. Jiang, F.; Leung, C.K. A data analytic algorithm for managing, querying, and processing uncertain big data in cloud environments. Algorithms 2015, 8, 1175–1194. [Google Scholar] [CrossRef]
  29. Xie, Y.; Zheng, M. A Differentiated Anonymity Algorithm for Social Network Privacy Preservation. Algorithms 2016, 9, 85. [Google Scholar] [CrossRef]
  30. Cuzzocrea, A. Algorithms for Managing, Querying and Processing Big Data in Cloud Environments. Algorithms 2016, 9, 13. [Google Scholar] [CrossRef]
  31. Boehm, M.; Dusenberry, M.W.; Eriksson, D.; Evfimievski, A.V.; Manshadi, F.M.; Pansare, N.; Reinwald, B.; Reiss, F.R.; Sen, P.; Surve, A.C.; et al. SystemML: Declarative machine learning on spark. Proc. VLDB Endow. 2016, 9, 1425–1436. [Google Scholar] [CrossRef]
Figure 1. Data flow diagram.
Algorithms 11 00207 g001
Figure 2. API request diagram.
Algorithms 11 00207 g002
Figure 3. A Matlab overview of mobile users trajectories’ points.
Algorithms 11 00207 g003
Figure 4. Both clustering and k-NN: (a) x and (b) (x,y) for N = 400 trajectories, L = 100 time-stamps and k = 5.
Algorithms 11 00207 g004
Figure 5. Both clustering and k-NN: (a) (x,y,g) and (b) (x,y,g,v) for N = 400 trajectories, L = 100 time-stamps and k = 5.
Algorithms 11 00207 g005
Figure 6. Both clustering and k-NN: (a) x and (b) (x,y) for N = 2000 trajectories and L = 100 time-stamps.
Algorithms 11 00207 g006
Figure 7. Both clustering and k-NN: (a) (x,y,g) and (b) (x,y,g,v) for N = 2000 trajectories and L = 100 time-stamps.
Algorithms 11 00207 g007
Figure 8. Clustering (x,y,g,v) and k-NN x for N = 400 trajectories, L = 100 time-stamps for (a) k = 5 and (b) k = 15.
Algorithms 11 00207 g008
Figure 9. Clustering with (x,y,g,v) and k-NN in x. Figure (a) concerns k = 15 while (b) k = 30 for N = 2000 trajectories and L = 100 time-stamps.
Algorithms 11 00207 g009
Table 1. An example of spatiotemporal database for d = 4.
ObjidTime-StampTime to Next, PointxyAngleVelocity
12013-03-09 10:00:01021,08256,4361.230
12013-03-09 10:00:04321,09956,4321.164.5
12013-03-09 10:00:11721,22156,4841.5114.6
12013-03-09 10:00:19821,33156,5241.9511.3
12013-03-09 10:00:21221,40256,495029.5
22013-03-09 10:00:03035,58759,829−2.760
22013-03-09 10:00:08535,56859,7822.947.8
22013-03-09 10:00:16835,58059,723−2.075.8
22013-03-09 10:00:25935,53059,668−1.526.4
22013-03-09 10:00:34935,47659,671−2.854.6
Table 2. k-anonymity sets for N mobile users in L = 5 time-stamps.
ObjidTime Instantknns Indexes
11 [ i d 111 , i d 112 , , i d 11 k ]
12 [ i d 121 , i d 122 , , i d 12 k ]
13 [ i d 131 , i d 132 , , i d 13 k ]
14 [ i d 141 , i d 142 , , i d 14 k ]
15 [ i d 151 , i d 152 , , i d 15 k ]
21 [ i d 211 , i d 212 , , i d 21 k ]
22 [ i d 221 , i d 222 , , i d 22 k ]
23 [ i d 231 , i d 232 , , i d 23 k ]
24 [ i d 241 , i d 242 , , i d 24 k ]
25 [ i d 251 , i d 252 , , i d 25 k ]
N1 [ i d N 11 , i d N 12 , , i d N 1 k ]
N2 [ i d N 21 , i d N 22 , , i d N 2 k ]
N3 [ i d N 31 , i d N 32 , , i d N 3 k ]
N4 [ i d N 41 , i d N 42 , , i d N 4 k ]
N5 [ i d N 51 , i d N 52 , , i d N 5 k ]
Table 3. Parameters for the first experiment of N = 400 trajectories.
cs kClustering Attributesk-NN Attributes
2,55xx
2,55 x , y x , y
2,55 x , y , g x , y , g
2,55 x , y , g , v x , y , g , v
2,5,105 x , y , g , v x , , ,
Table 4. Parameters for the second experiment of N = 2000 trajectories.
cs kClustering Attributesk-NN Attributes
5,1015xx
5,1015 x , y x , y
5,1015 x , y , g x , y , g
5,1015 x , y , g , v x , y , g , v
5,10,1515,30 x , y , g , v x , , ,

