1. Introduction
Nowadays, bio-inspired algorithms are used for optimization in different application areas, such as control [
1], prediction [
2], security [
3], scheduling [
4], etc. Optimization is defined as the mathematical process to find the best solution to a problem [
5]. Several metaheuristics have been used to carry out this process, such as the Genetic Algorithm (GA) [
6], Particle Swarm Optimization (PSO) [
7], Flower Pollination Algorithm (FPA) [
8], and Social Spider Algorithm (SSA) [
9], among others. For this work, the Bird Swarm Algorithm (BSA) was used to optimize the membership function parameters of the fuzzy systems.
The Bird Swarm Algorithm [
10] was originally proposed by Xian-Bing Men in 2015 to solve optimization problems. This algorithm mimics the behavior and social interaction of birds in a swarm. The behaviors imitated by this algorithm are the way in which birds search for food, flight and vigilance are performed.
BSA has been used to optimize the cost of power generation in the energy system network of both wind energy and photovoltaic solar energy [
11], and variants of this algorithm have also been made to improve its performance, such as the Enhanced Bird Swarm Algorithm (EBSA) [
12] for variable-strength combinatorial test data generation and the Chaotic Bird Swarm Optimization Algorithm (CBSA) [
13], which is proposed to avoid local minimums.
With regards to fuzzy systems, these have been widely used in the medical field, specifically to provide diagnosis of diseases, such as malaria [
14], leukemia [
15], hepatitis [
16], and meniscus tear [
17], among others. In this work, a fuzzy system is presented for the classification of the heart rate level of the patients and with this, to be able to provide a medical diagnosis, in this case of the risk of having a cardiovascular event.
Initially, a type-1 fuzzy system with trapezoidal membership functions was designed to obtain the patient’s heart rate classification, which is based on the experience of the cardiologist. It has as inputs the age and the trend of the heart rate, and as output has the patient’s heart rate level. Also, a type-1 fuzzy system with Gaussian membership functions was designed, in the same way as the aforementioned, to find out with which type of membership functions a better classification can be provided.
To improve the classification rate and provide an even more precise diagnosis, it was proposed to realize the optimization of the membership functions for both fuzzy systems, for which different experiments are carried out using the Bird Swarm Algorithm.
Once the type-1 fuzzy systems were optimized, the problem was also addressed using interval type-2 fuzzy systems that can theoretically handle higher levels of uncertainty. The use of type-2 can consider if, in certain cases or for certain patients, the information can be very imprecise or has certain changes that could be viewed as noise or with much uncertainty.
For the design of these fuzzy systems, the initial designs of the type-1fuzzy systems are considered as the basis, and in this form an optimized and precise classification was obtained after performing different experiments. For this, the parameters of the membership functions are used, and with BSA the optimal representation of the uncertainty is search for, which means finding the optimal footprint of uncertainty.
It can also be found that in different studies, the heart rate is used as an additional input for the diagnosis of hypertension, while in this work, it is used in a separate fashion in conjunction with the nocturnal profile to determine the risk that the patient has in having a cardiovascular event.
The main contribution of this paper is the design of fuzzy systems for the classification of the heart rate level of patients. The fuzzy systems are designed based on the expert experience and tested with different architectures. Once this was done, their optimization was performed to improve the classification percentage, and for this, the Bird Swarm Algorithm was used. The reason is that when compared to other optimization methods such as the Crow Search Algorithm (CSA), the best results were obtained with BSA. Additionally, comparisons between the type-1 and interval type-2 fuzzy systems were performed to find out with which method a more precise classification is obtained.
This paper is organized as follows: In
Section 2 the basic concepts are presented, in
Section 3 the problem statement and proposed method are explained, in
Section 4 the knowledge representation of the different optimized type-1 and interval type-2 fuzzy systems are presented, in
Section 5 the results of different experiments are presented, and finally in
Section 6 the conclusions and future work are presented.
2. Basic Concepts
2.1. Heart Rate
The heart rate is the number of times the heart contracts for one minute (beats per minute). As we age, changes in the rate and regularity of the heart rate may change and may signify a heart condition or other condition that must be treated by a physician.
Heart rate can be measured in different locations of the human, including: wrists, inside of the elbow, top of the foot, and the side of the neck. To get a more accurate reading, we need to put the finger on one of the above-mentioned parts of the body and count the number of beats in 60 s.
The resting heart rate is when the heart pumps the least amount of blood needed, which, in a healthy person, is between 60 and 100 beats per minute; however, a heart rate lower than 60 beats per minute is not necessarily a signal of a medical problem, as it may be due to some drug, or it could be a well-trained athlete, since the heart rate in athletes tends to be as low as 40 beats per minute; in
Table 1 the values of heart rate based on age and sex are presented [
18,
19].
Some of the factors that affect the heart rate are:
Air temperature: When temperatures and humidity soar, the heart pumps a little more blood, so the heart rate may increase, but usually no more than five to ten beats per minute.
The position of the body: At rest, sitting or standing, the heart rate is usually the same. Sometimes, when the person stands up for the first 15 to 20 s, the heart rate may go up a bit, but after a couple of minutes, it should be set.
Emotions: If the person is stressed, anxious or “extraordinarily happy or sad” the emotions can raise the heart rate.
Body size: Body size usually does not change pulse. If the person is very obese, it is possible to see a resting heart rate greater than normal, but usually no more than 100 beats per minute.
The use of medications: Drugs that block adrenaline (beta blockers) tend to slow the heart rate, while too much thyroid medicine or too high a dose tends to raise it [
18].
When the heart rate is lower than 60 beats per minute, the condition is called bradycardia, which means that the heart rate is slow or irregular, this can cause dizziness or shortness of breath in normal activities or light exercises [
20]. When the heart rate is greater than 100 beats per minute it is called tachycardia, which means that the heart rate is fast or irregular. With such a high rate, the heart cannot effectively pump blood with high levels of oxygen to the body [
21].
2.2. Bird Swarm Algorithm
The Bird Swarm Algorithm (BSA) was proposed by Xian-Bing Men in 2015 [
10], which is inspired by the behavior and social interactions in swarm of birds, imitating feeding, flight and vigilance compartments to solve optimization problems.
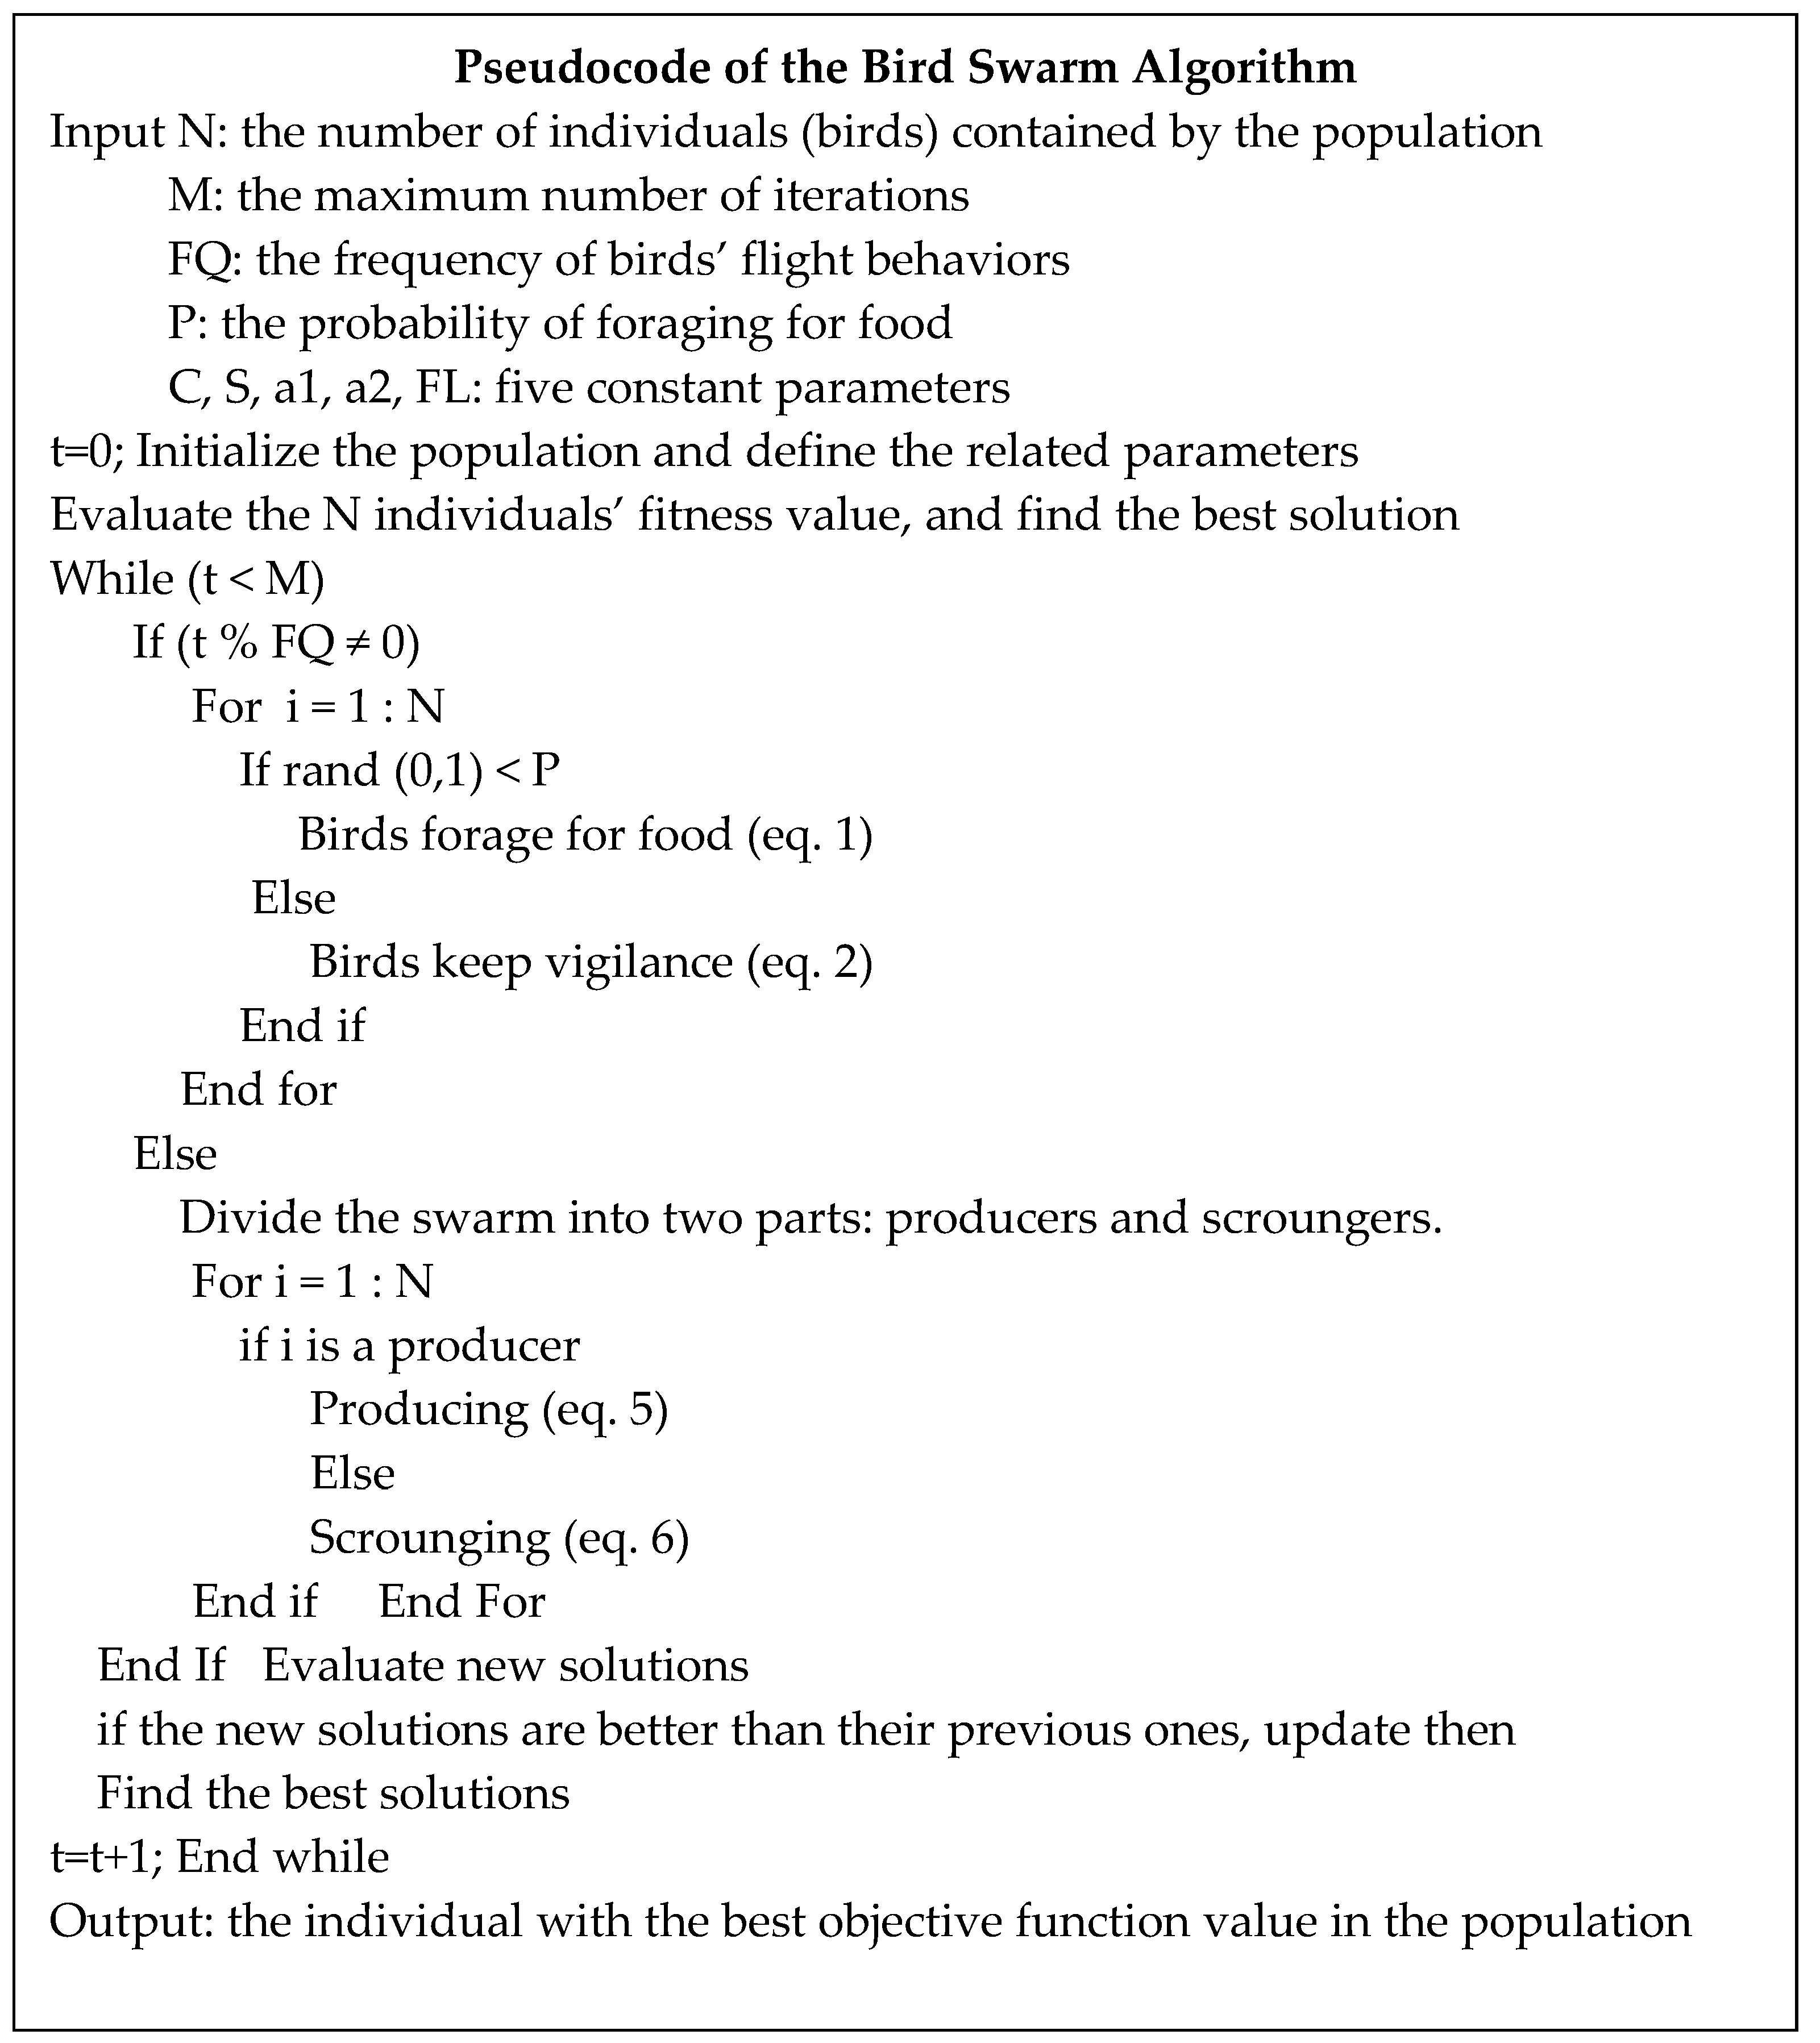
The social behaviors of birds are simplified in 5 rules, which are described below:
Rule 1: Each bird may change between vigilance and foraging behaviors. The foraging of birds or their vigilance is modeled as a stochastic decision.
Rule 2: In foraging, each bird may record and update its best previous experience and the best previous swarm experience on the food patch. This experience may be used again to search for food. The social information is shared instantly between the entire swarm.
Rule 3: While vigilance is maintained, each bird tries to move to the center of the swarm, this behavior may be affected by the interference induced from the competition in the swarm. Birds that have higher provisions would be more likely to lie nearer to the center of the swarm than birds with low provisions of food.
Rule 4: Birds can habitually fly to another site; when this happens, they can switch among producing and scrounging. The birds with the highest reserves of food will be producers, and those that have the lowest provisions will be scroungers. Birds with intermediate provisions would randomly choose to be a producer or scrounger.
Rule 5: Producers actively search for food. Scroungers would randomly follow a producer to search for food.
The aforementioned rules are expressed mathematically as follows:
Foraging behavior, in which each bird seeks food according to its experience and the swarms’ experience, is expressed by:
where
j means independent numbers uniformly distributed in (0,1).
C and S are positive numbers, which may be called cognitive and social acceleration coefficients respectively. Pi,j is the best previous position in the ith bird and gj is the best previous position shared in the swarm.
In vigilance behavior, each bird will try to move to the center of the swarm and compete; therefore, each bird will not move directly to the center of the swarm. This is expressed as follows:
where
k is a positive integer, chosen randomly among 1 and
N.
pFit
i corresponds to the best value fitness in the
ith position and
sumFit signifies the sum of the best fitness value of the swarms.
is used to avoid the error in zero-division.
meanj is the
jth element of the average place of the entire swarm.
a1 and
a2 are positive constants in (0,2).
Given the fact that each bird wants to stand in the center of the swarm, the product of A1 and rand (0,1) should not be more than 1. A2 is used to simulate the direct effect induced by a specific interference when a bird moves towards the center of the swarm.
In flight behavior, birds can fly to an alternative site in response to predation threats, foraging, or for any other reason. At the new site, the birds will look again for food. The producing birds look for patches of food, while the scroungers try to feed on the food patch found by the producers. The behaviors of producers and scroungers are described as follows:
where randn (0,1) denotes a Gaussian distributed random number with mean 0 and standard deviation 1, k
[1,2,3… N], k ≠ i. FL (FL
[0, 2]) represents that the scrounger would follow the producer to search for food.
The authors assume, for the sake of simplicity, that each bird flies to another place every FQ unit interval, where FQ is a positive integer.
The BSA pseudo code is presented in
Figure 1.
2.3. Blood Pressure
Blood pressure is defined as the force exerted against the walls of the arteries as the heart pumps blood through the body in order to carry the necessary oxygen and nutrients. Blood pressure is divided into two components, the first is systolic blood pressure, this refers to when the heart contracts and can be identified by the largest number at the time of examining the blood pressure. The second component is diastolic pressure, which is when the heart relaxes and is identified as the smallest number, and this is measured in millimeters of mercury (mmHg) [
22,
23,
24,
25].
The normal blood pressure in an adult is the one that goes from below 139 mmHg in systolic pressure and below 89 mmHg in diastolic pressure [
26].
2.4. High Blood Pressure
Hypertension is the sustained elevation of blood pressure above normal limits, which according to the European guidelines for the management of hypertension are above 140 mmHg in systolic pressure or above 90 mmHg in diastolic pressure [
26].
2.5. Type-1 Fuzzy Logic
Fuzzy logic was proposed by Lofti A. Zadeh [
27] in 1965, and implies approximate ways of reasoning instead of exact ones, using vague, imprecise or incomplete information, which can be viewed as an attempt to construct a model of human reasoning reflecting its approximate character. Its objective is to provide a basis for approximate reasoning using imprecise propositions based on the theory of fuzzy sets.
2.6. Interval Type-2 Fuzzy Logic
This is an extension of type-1 fuzzy systems proposed by Zadeh in 1975. These were designed to mathematically represent the vagueness and uncertainty of linguistic problems. A type-2 fuzzy set is characterized by a fuzzy membership function, that is, the membership degree for each element of this set is a fuzzy set in (0,1), unlike a type-1, where the membership grade is established as a crisp number in (0,1) [
28].
2.7. Related Works
Different works have been carried out in the medical area using type-1 and interval type-2 fuzzy systems (IT2FS) [
28,
29,
30,
31,
32,
33], which we will briefly describe next.
Sadat et al. [
15] designed a type-2 fuzzy system for the diagnosis of leukemia, in which they use 14 inputs which correspond to the symptoms of leukemia and as output the diagnosis of the disease, obtaining a 94% correct classification.
For the diagnosis of hepatitis, Sotudian et al. [
16] designed a type-1 and IT2FS to perform classification comparison; the fuzzy systems have ten inputs, which are attributes related to the disease, and one output, obtaining 90.0% classification with the type-1 fuzzy system and 93.94% of classification with the interval type-2 fuzzy system.
Zarandi et al. [
17] presented a type-2 fuzzy expert system for the diagnosis of meniscal tears using magnetic resonance imaging. For segmentation, first, the interval type-2 fuzzy C-means is applied to the images, whose outputs are then used by interval type-2 possibilistic C-means to perform postprocessing. Finally, a neural network with two hidden layers is used for the classification stage. The results of the proposed type-2 expert system were compared with a well-known segmentation algorithm, confirming the superiority of the proposed system in the recognition of meniscal tears.
For dengue diagnosis, Varinder Pabbi [
34] proposed a fuzzy system with 5 input variables corresponding to age, blood pressure, and other variables necessary to identify the disease, and the type of dengue that the patient has as output. The author reports having obtained good results in the diagnosis.
Mohamed and Hussein [
14] designed a fuzzy system for the diagnosis and treatment of malaria, using as inputs the temperature, body mass index and pulse of the patient. The first output determines if the patient is free of malaria or, if the patient has it, the degree of complication; the second output determines the type of medication to be prescribed, obtaining as a result a high percentage of precision in the diagnosis.
3. Problem Statement and Proposed Method
A hybrid neural model, described in [
35,
36,
37], was previously designed for the same problem, using 3 fuzzy systems: the first provides the classification of the patient’s blood pressure level [
38,
39,
40], the second classifies the heart rate level and a third classifies the night profile of the patient [
41]. Now, in this paper, we are using the Bird Swarm Algorithm for finding the optimal design of type-1 and type-2 fuzzy systems for the classification of the heart rate level of patients.
Because the improvement in classification is aimed at providing an accurate diagnosis to patients, it was decided to use a bio-inspired algorithm, such as the Bird Swarm Algorithm, for the optimization of fuzzy systems, in order for the algorithm to make the necessary adjustment in the membership functions.
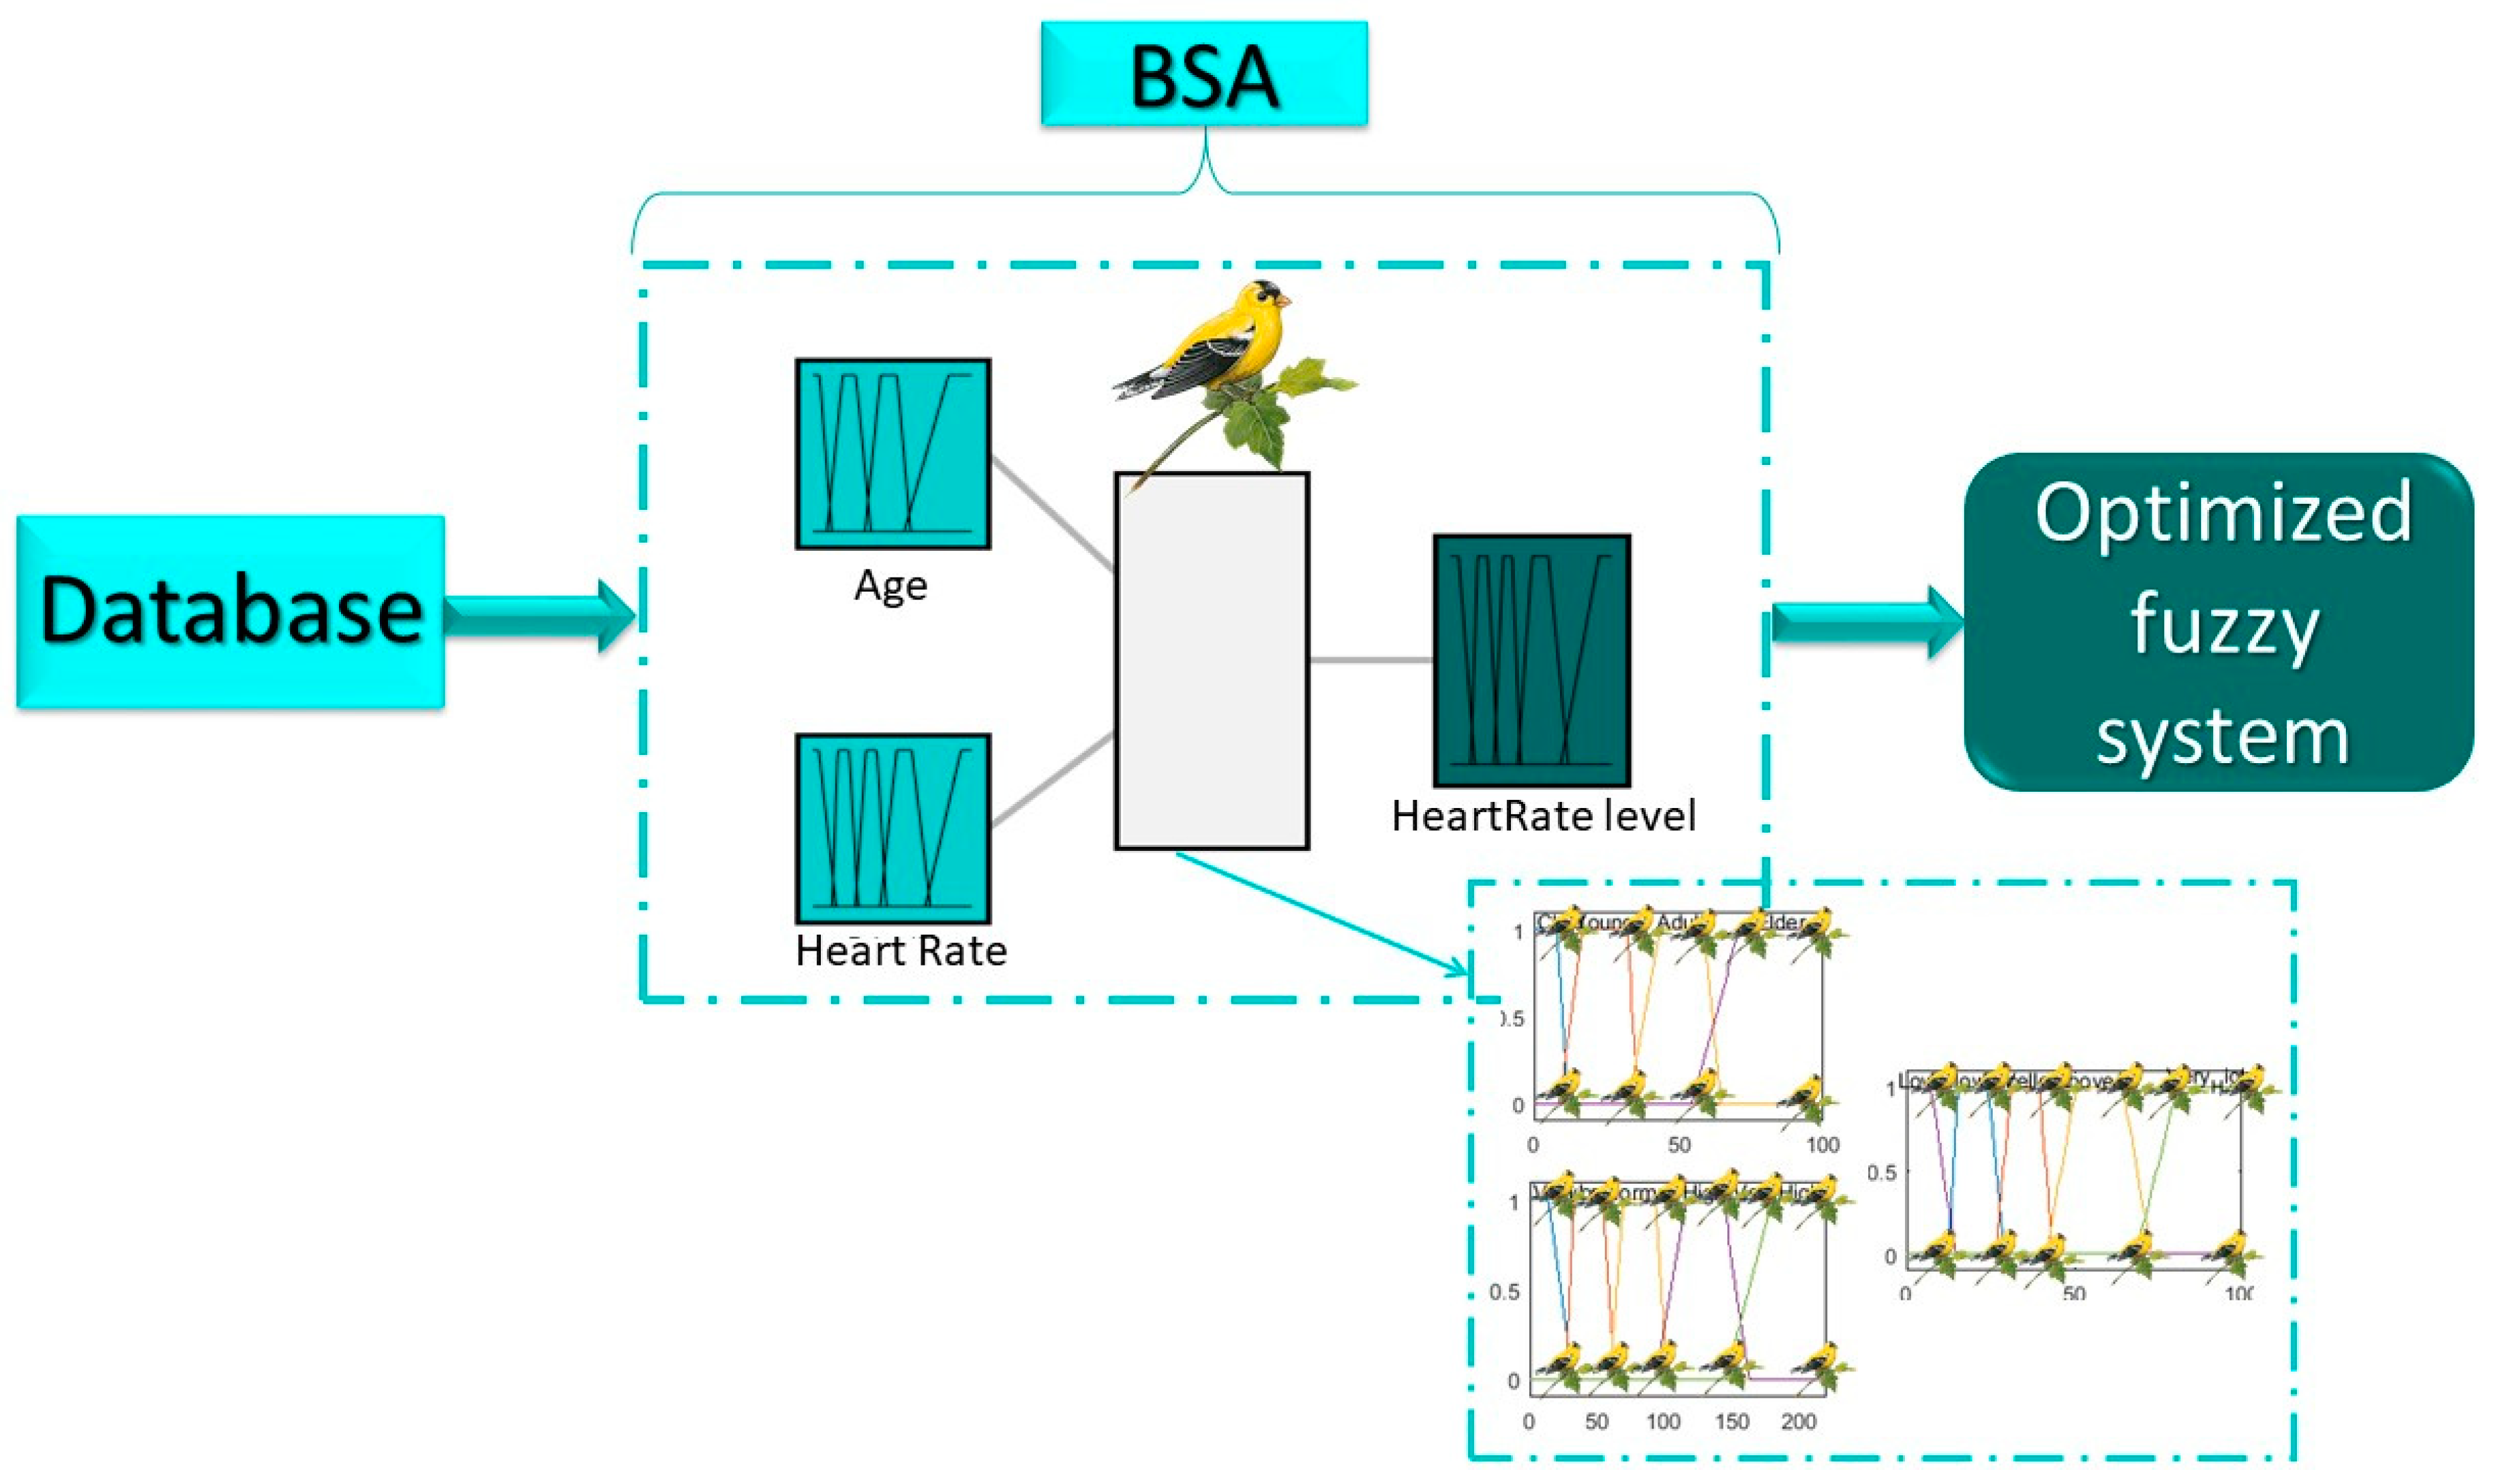
Figure 2 shows the proposed methodology for what is being addressed in this work and which is explained below:
A database with readings of the heart rate of a set of patients was used, which were obtained through the Ambulatory Blood Pressure Monitoring device (ABPM) [
42]. To perform the optimization, 30 patients were taken from the database. The necessary information is the age and the tendency of the heart rate, and these are the inputs to the fuzzy system.
Regarding optimization, the individuals, in this case the birds, are the ones that will be moving the membership functions in the search space, until fuzzy system is found that provides a classification with less error, and for this reason, the mean square error is used as an objective function, as presented in Equation (7).
The algorithm will provide the fuzzy system with the least error in the classification, and this is tested with different sets of patients to observe its performance.
Once this is done with type-1 fuzzy systems with Gaussian and trapezoidal membership functions and the best fuzzy systems are obtained, they are taken as a basis to perform the optimization of the interval type-2 fuzzy system for which the BSA algorithm will adjust the footprint of uncertainty; for this, the procedure described above is also performed.
3.1. Design of the Type-1 Fuzzy Inference System with Trapezoidal Membership Functions for the Classification of the Heart Rate Level
A Mamdani fuzzy inference system is designed for the classification of the heart rate level based on [
19] and the experience of the cardiologist, the inputs and output of which are described below and illustrated in
Figure 3:
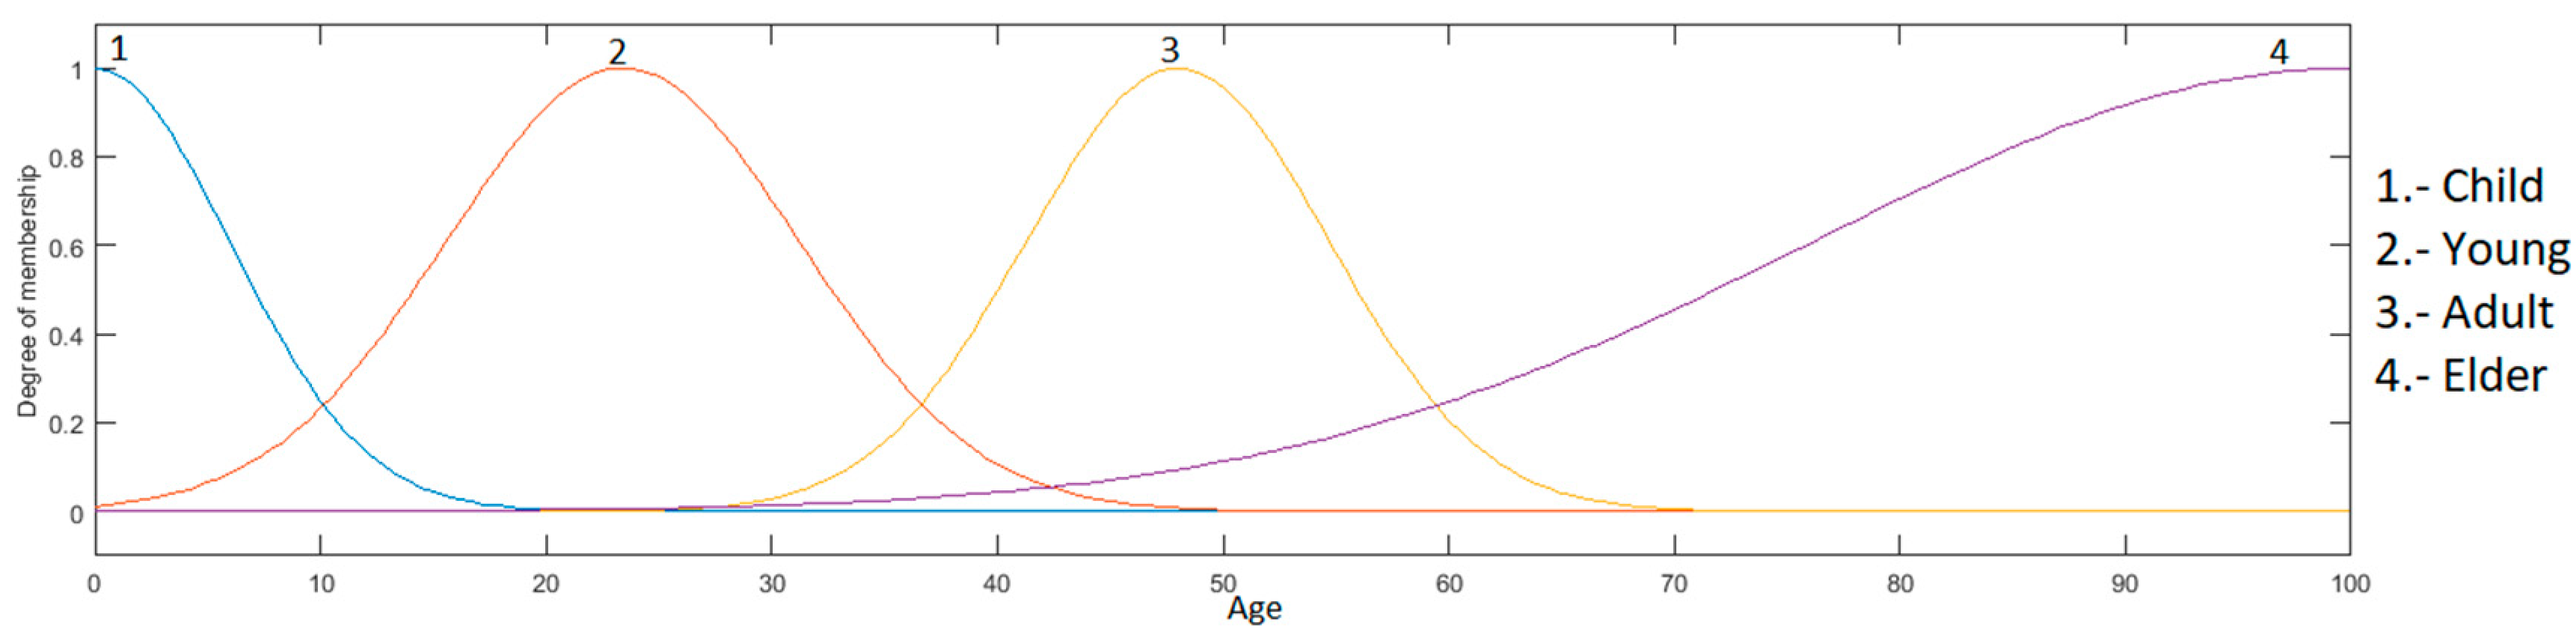
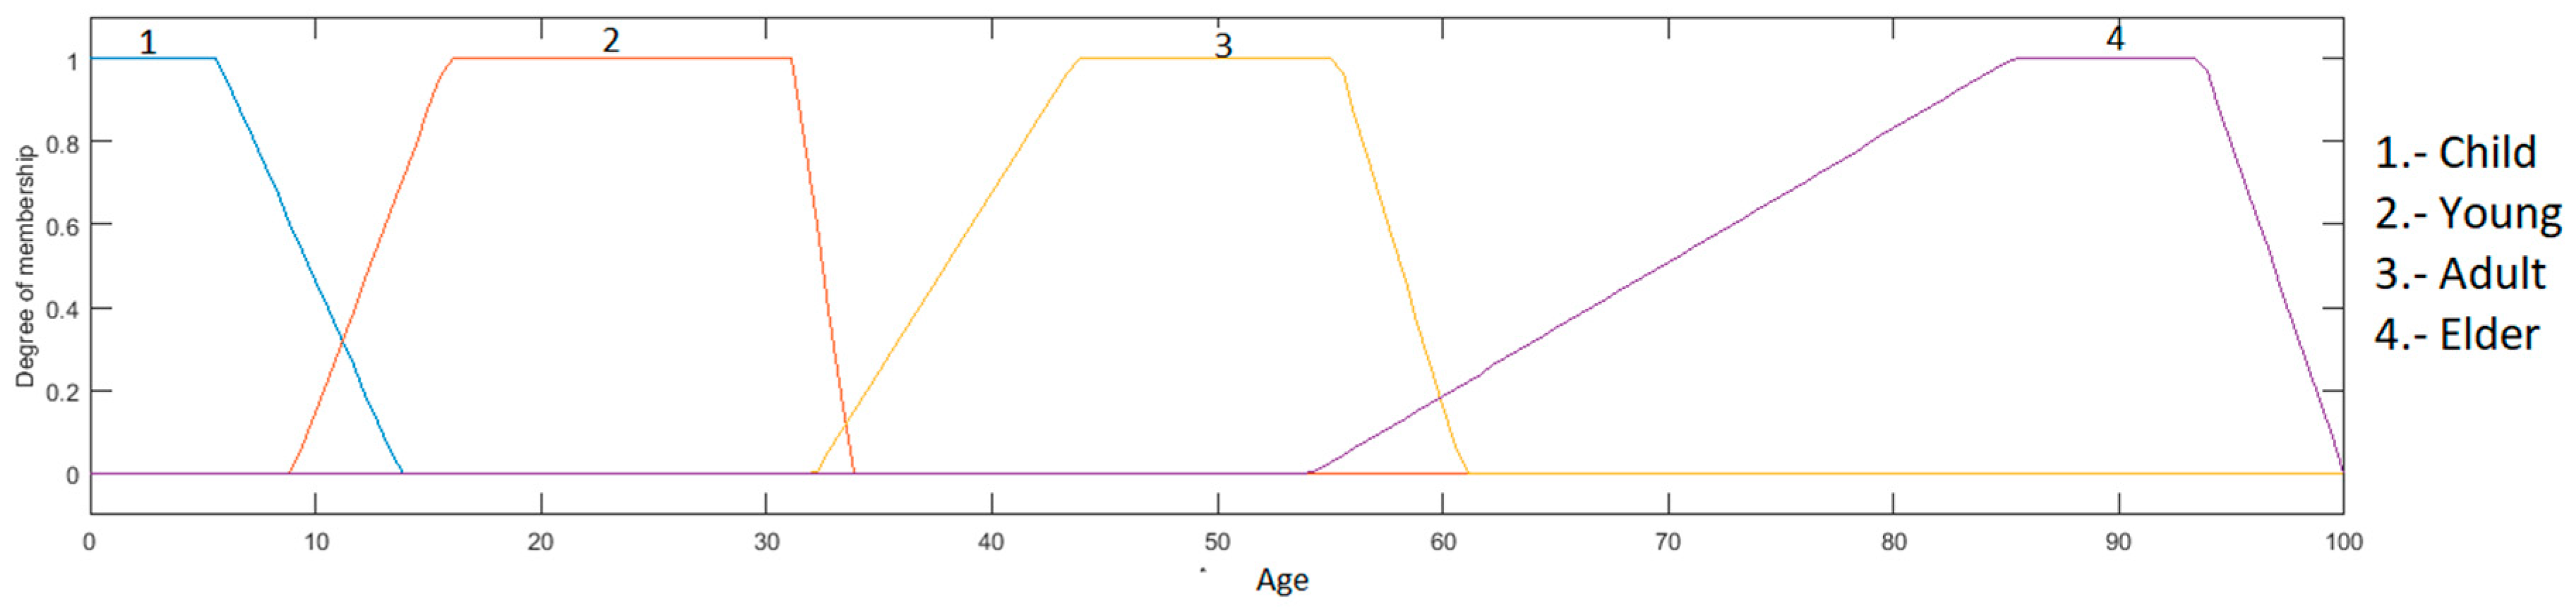
Age input: this input is in a range from 0 to 100, granulated in 4 membership functions corresponding to the linguistic variables “Child”, “Young”, “Adult” and “Elder”, as presented in
Figure 4.
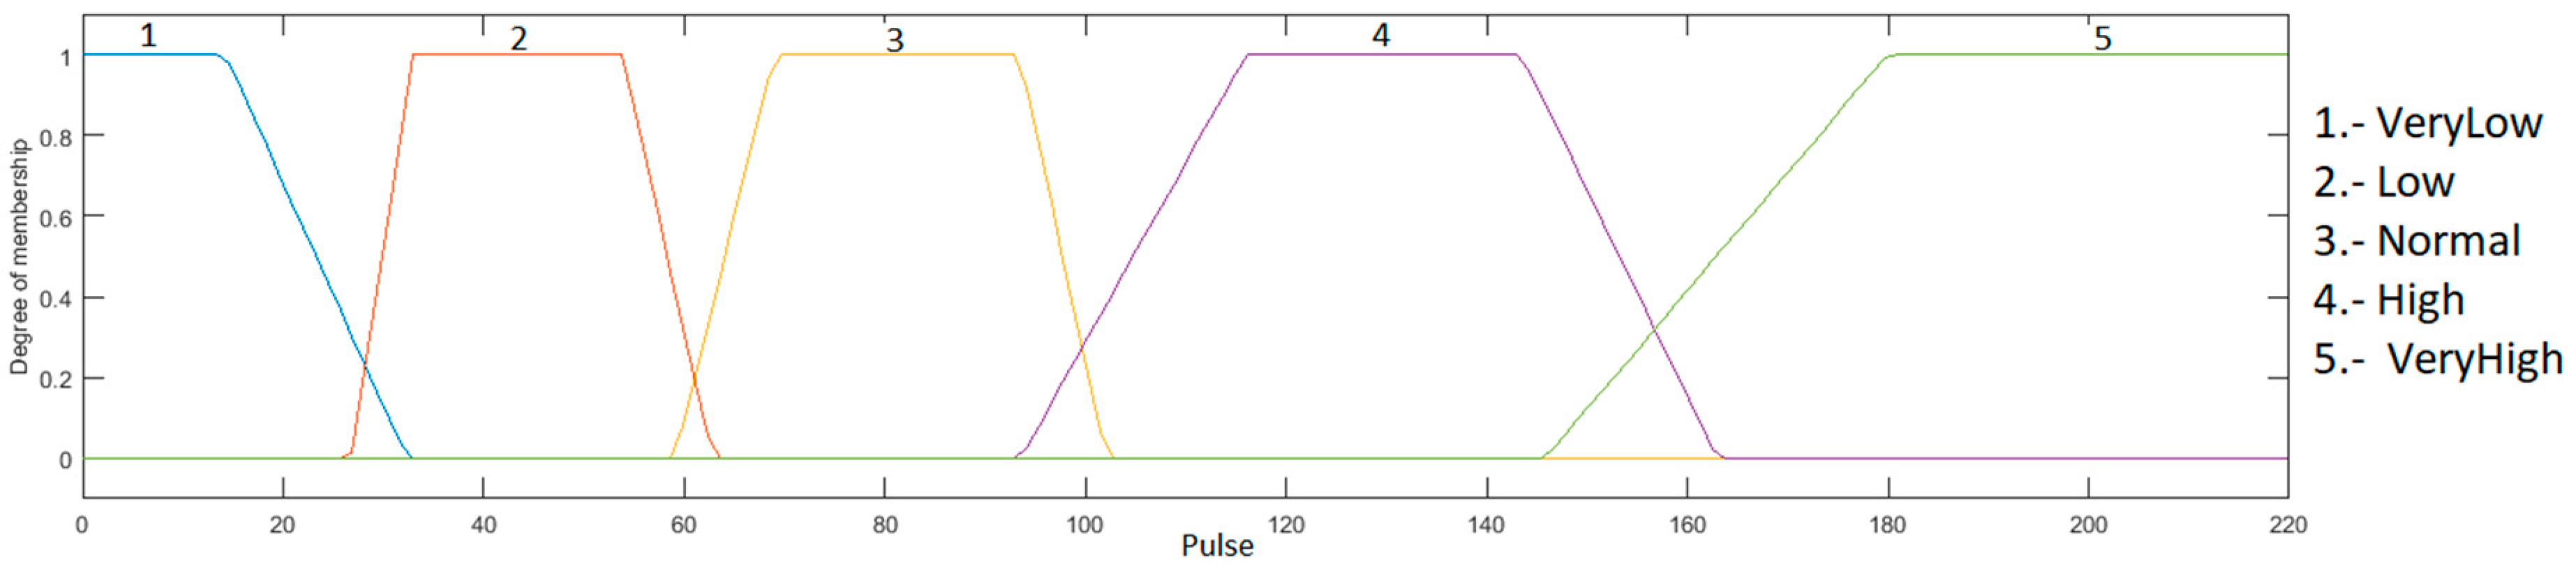
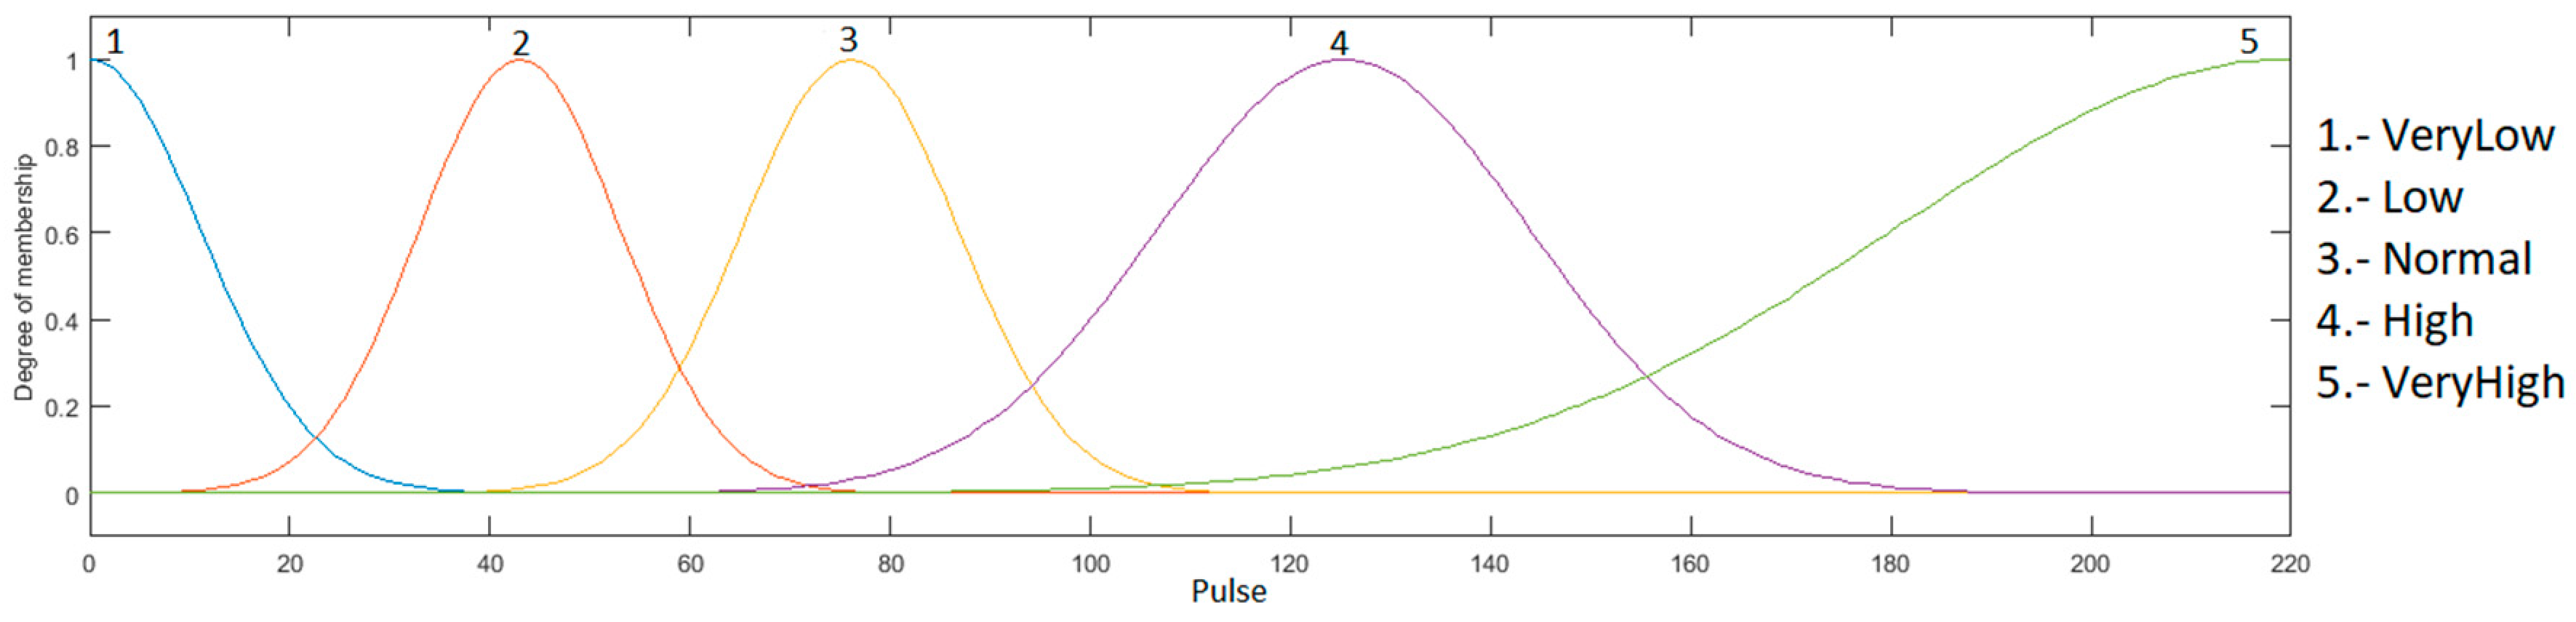
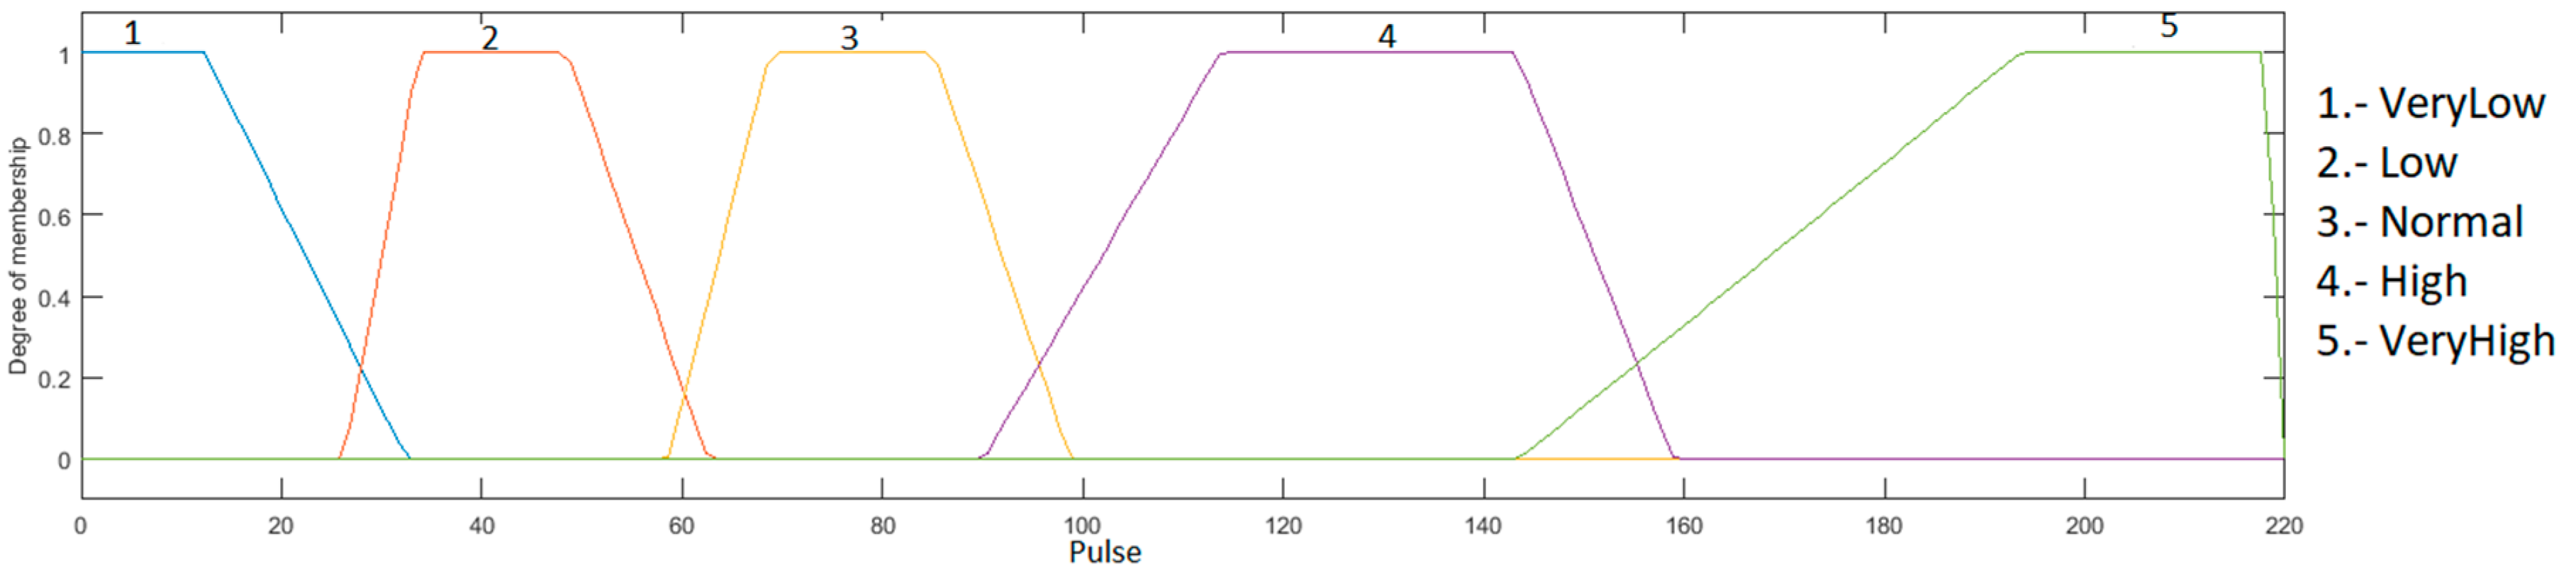
Heart rate input: this input goes between the range of 0 to 220, because it is the maximum heart rate that a young person may have during physical activity, and is granulated into 5 membership functions using the linguistic variables “Very Low”, “Low”, “Normal”, “High” and “VeryHigh”, as presented in
Figure 5.
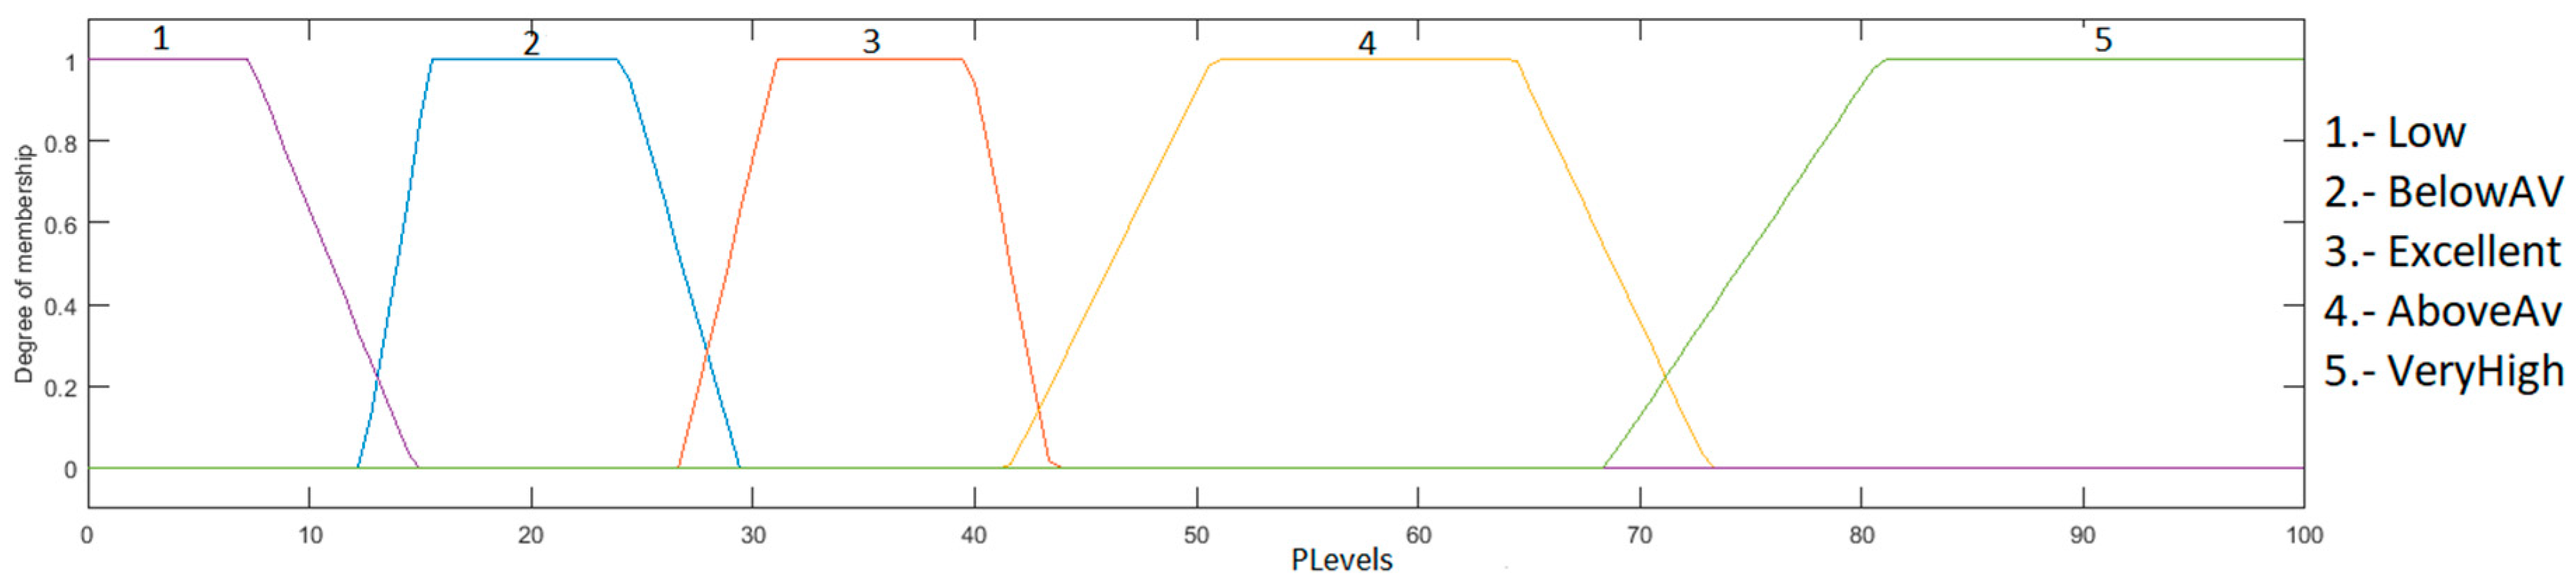
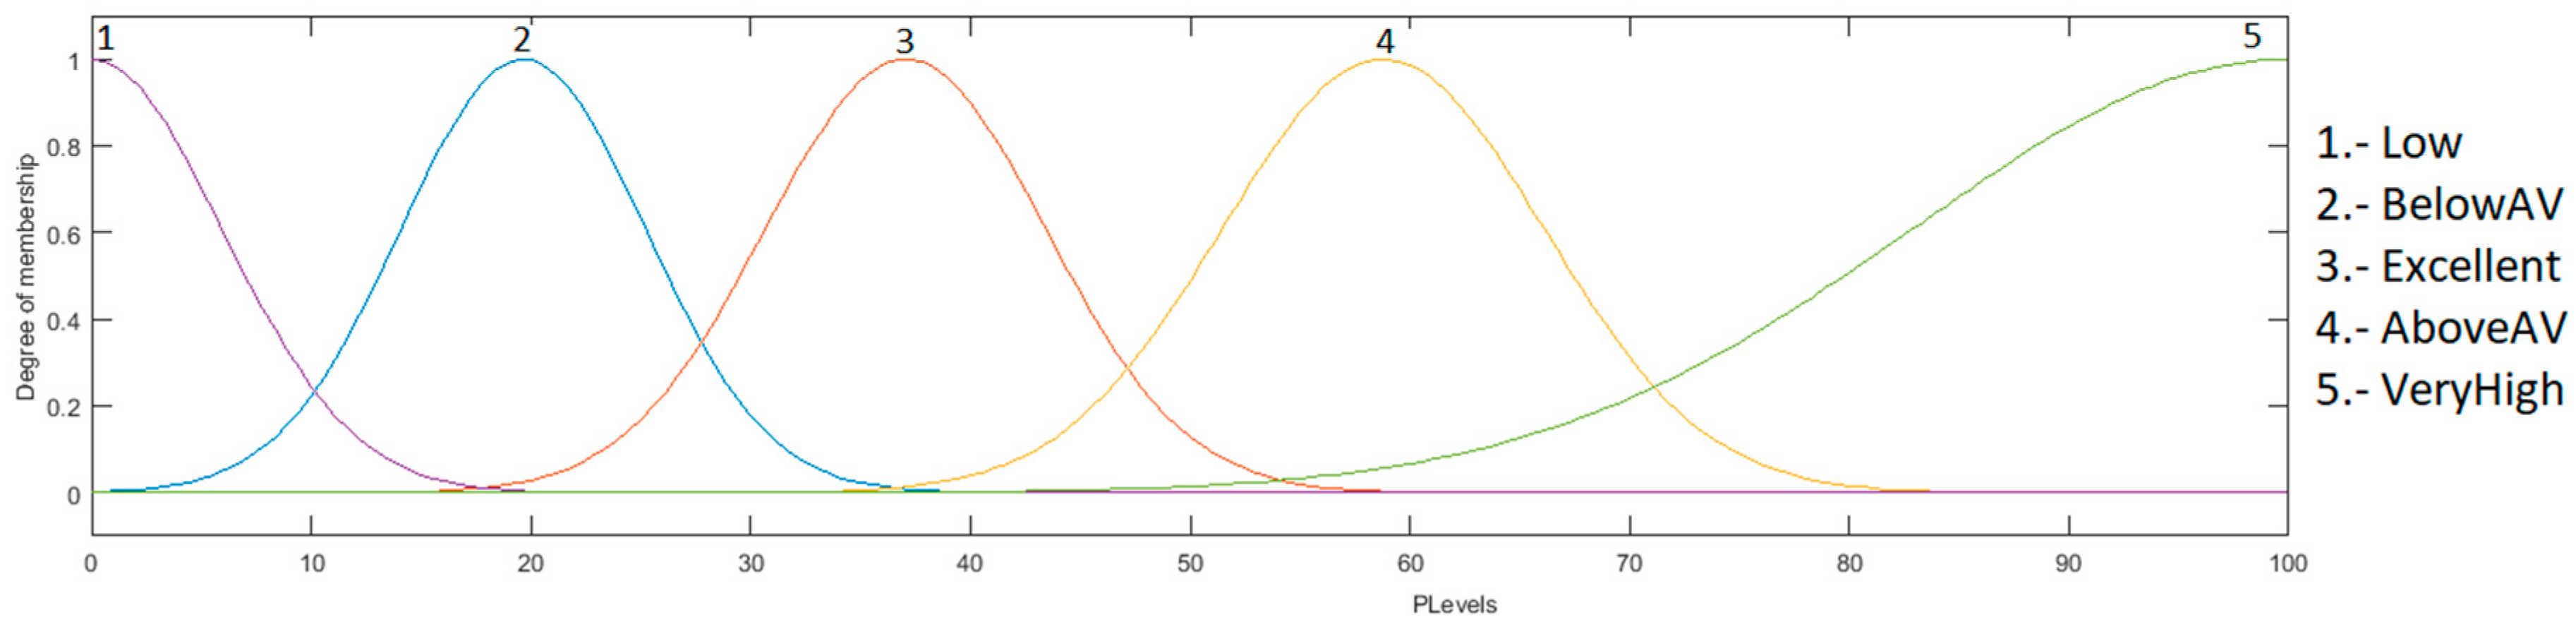
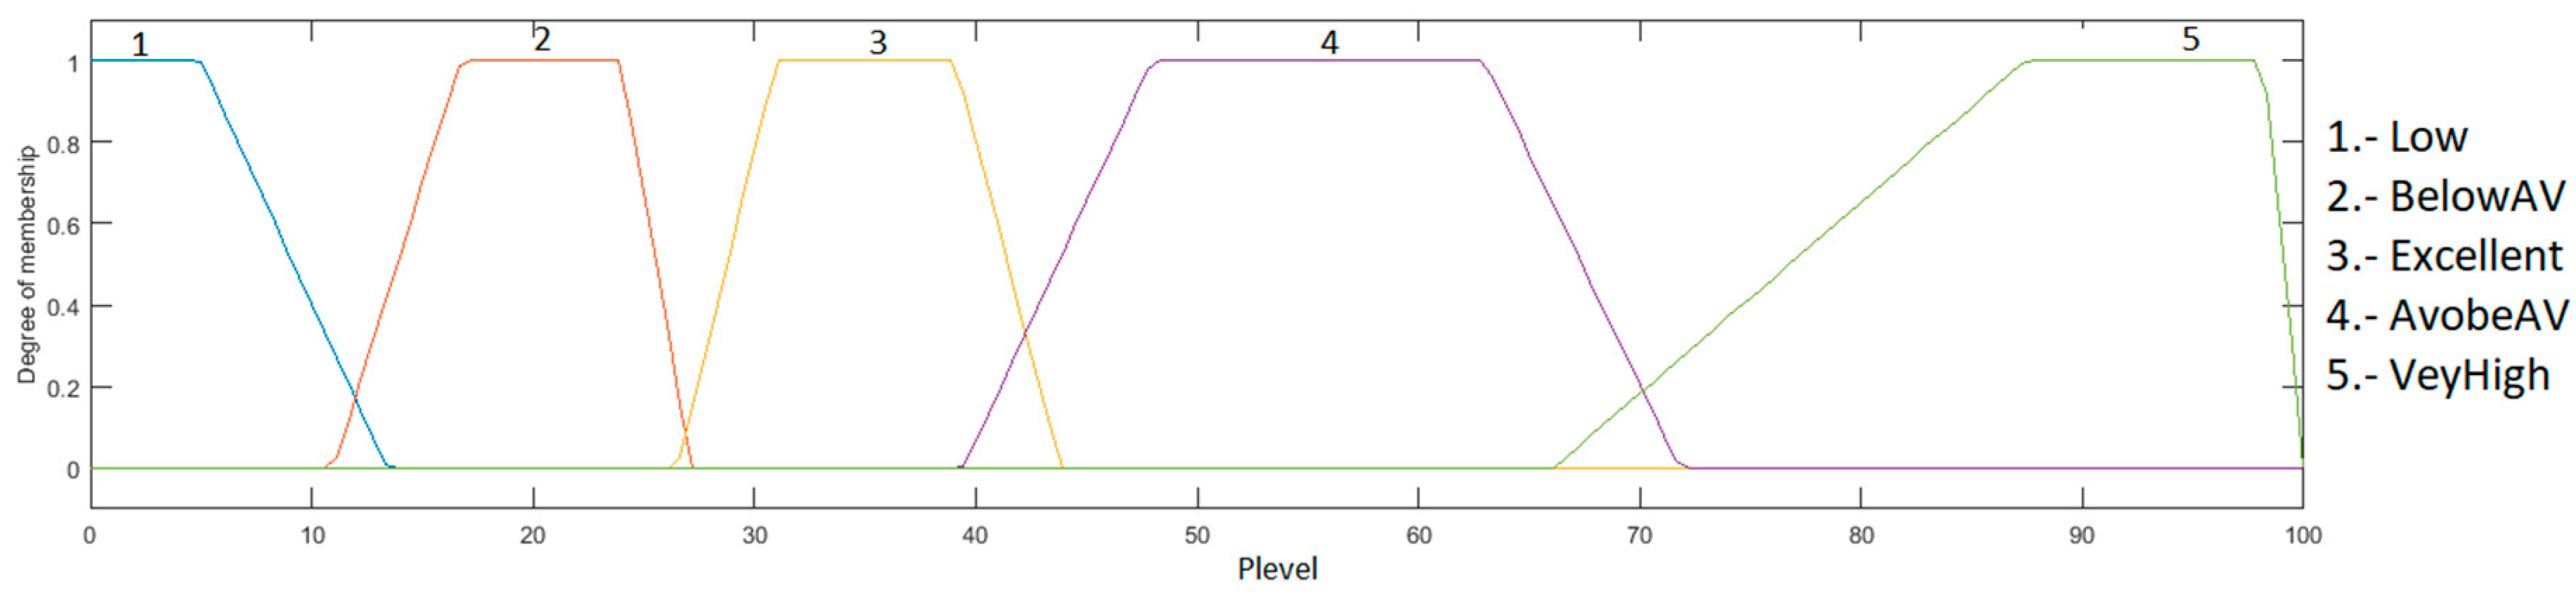
The output is the heart rate level, which ranges from 0 to 100%; this indicates how high or low the patient’s heart rate is, and is granulated into 5 membership functions, with the linguistic variables “Low”, “BelowAV”, “Excellent”, “AboveAV” and “VeryHigh”. As a defuzzification method, the centroid of area was used. The fuzzy system output is illustrated in
Figure 6.
3.2. Design of the Type-1 Fuzzy Inference System with Gaussian Membership Functions for the Classification of the Heart Rate Level
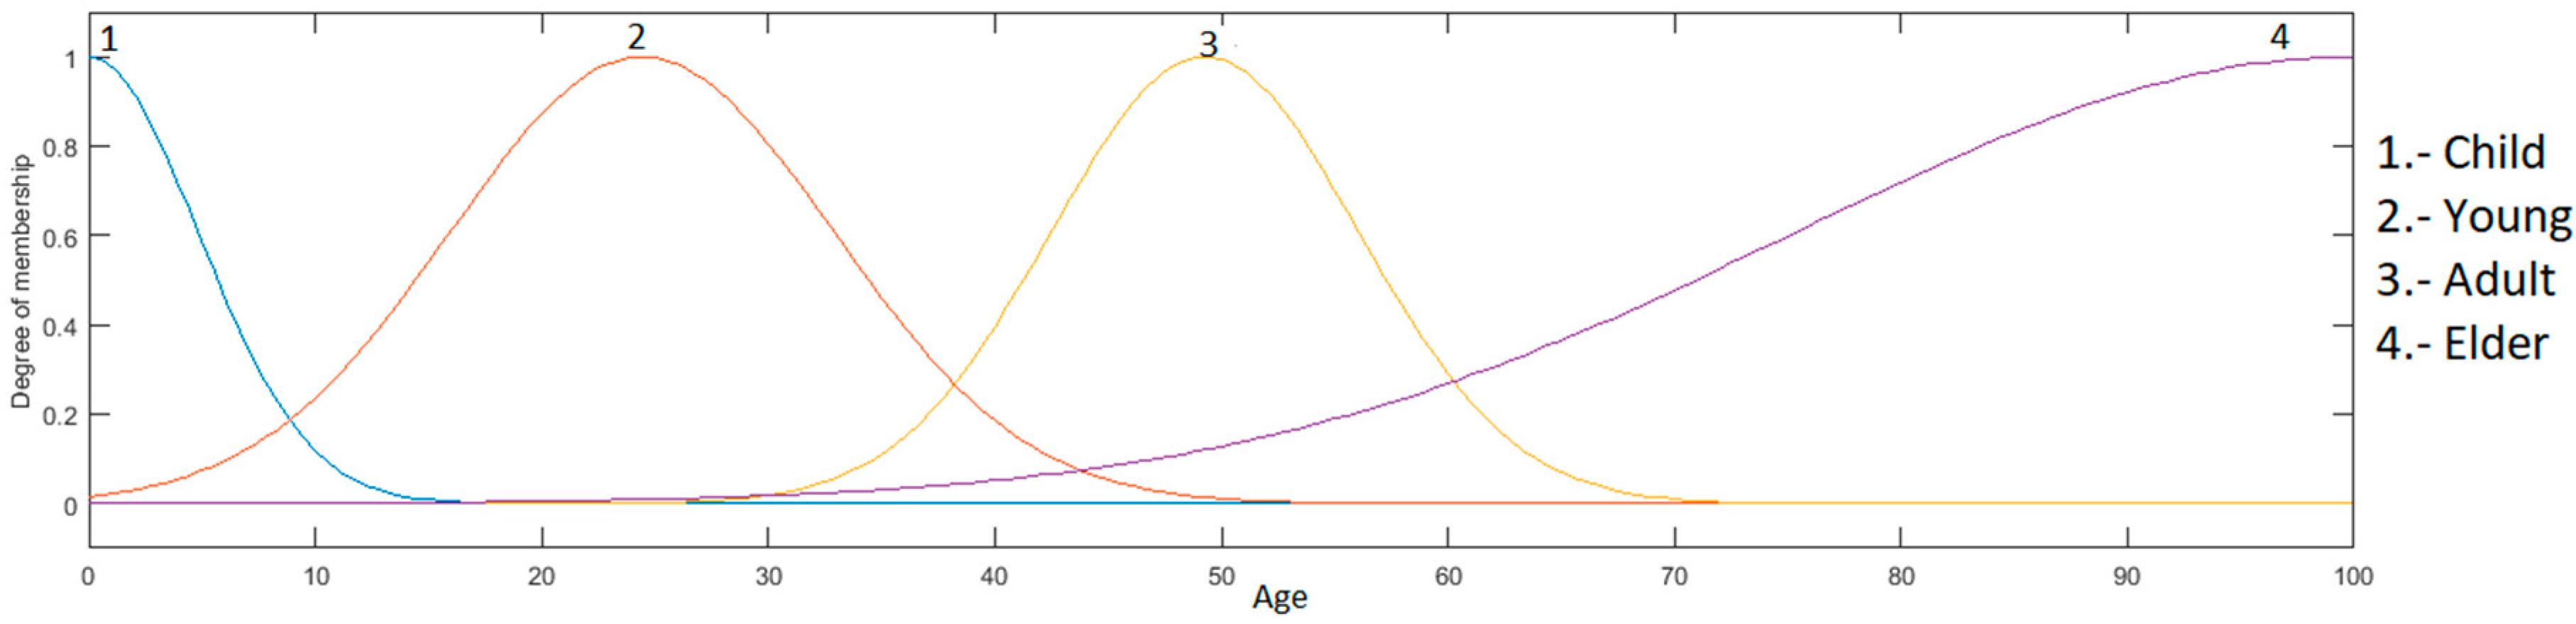
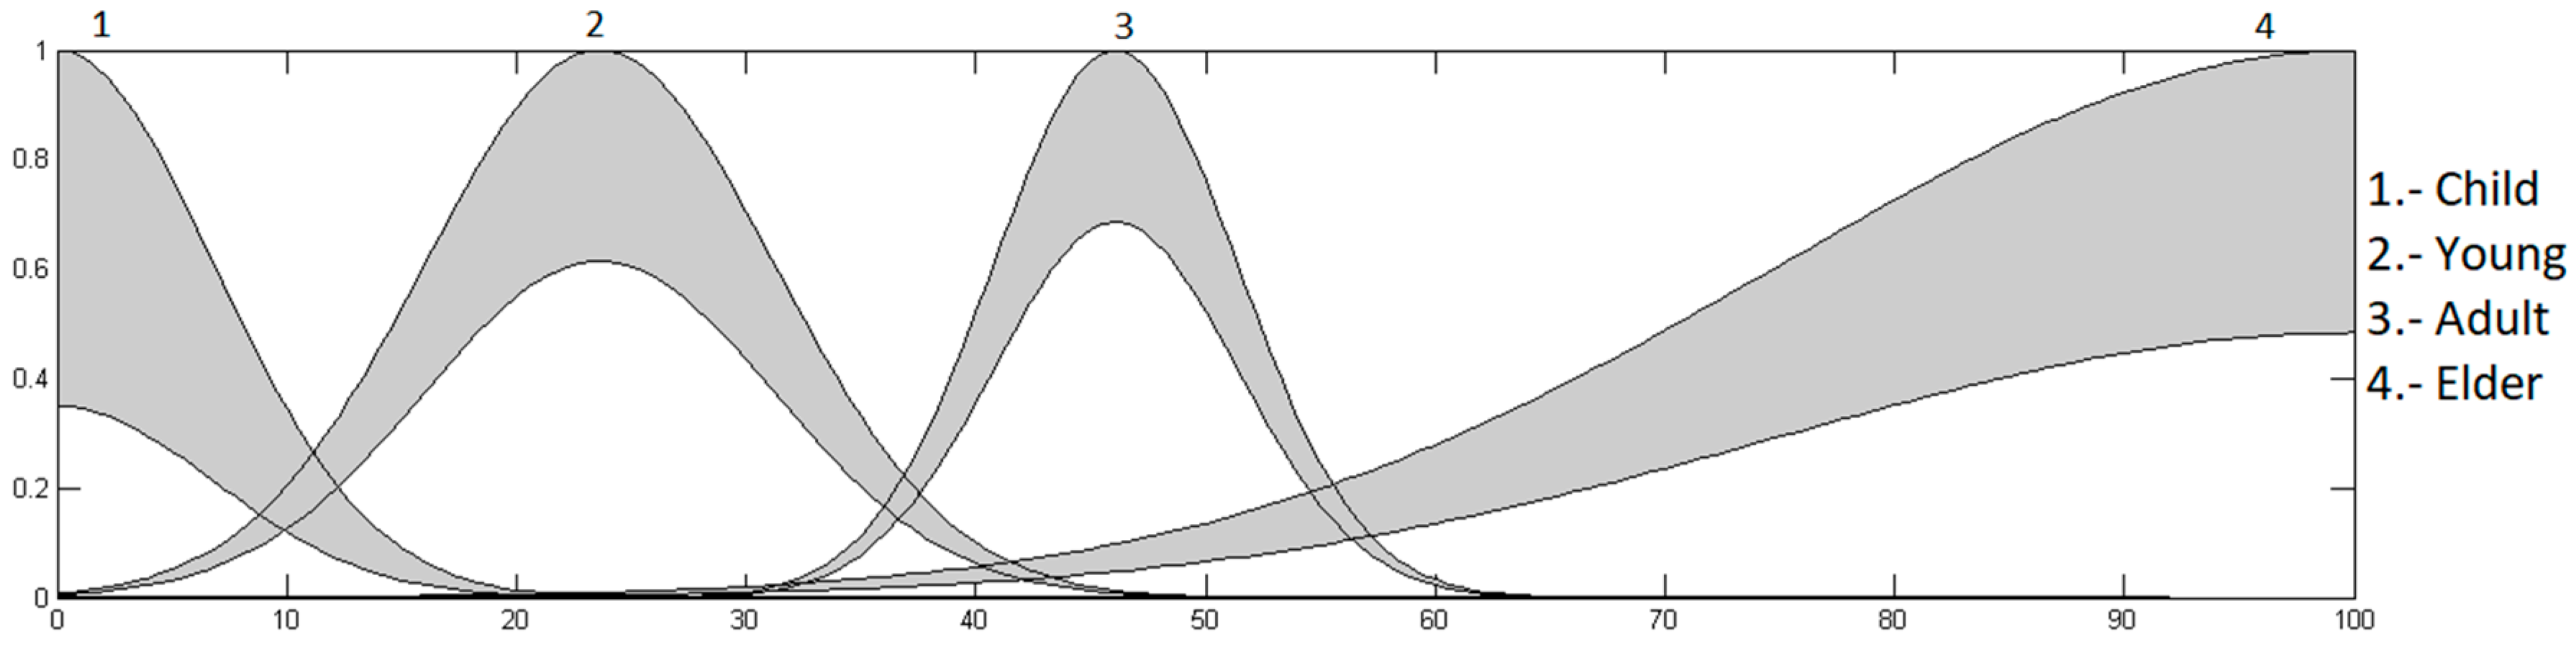
Age input: this is in a range of 0 to 100, granulated into 4 membership functions, having as linguistic values “Child”, “Young”, “Adult” and “Elder”, which are presented in
Figure 7.
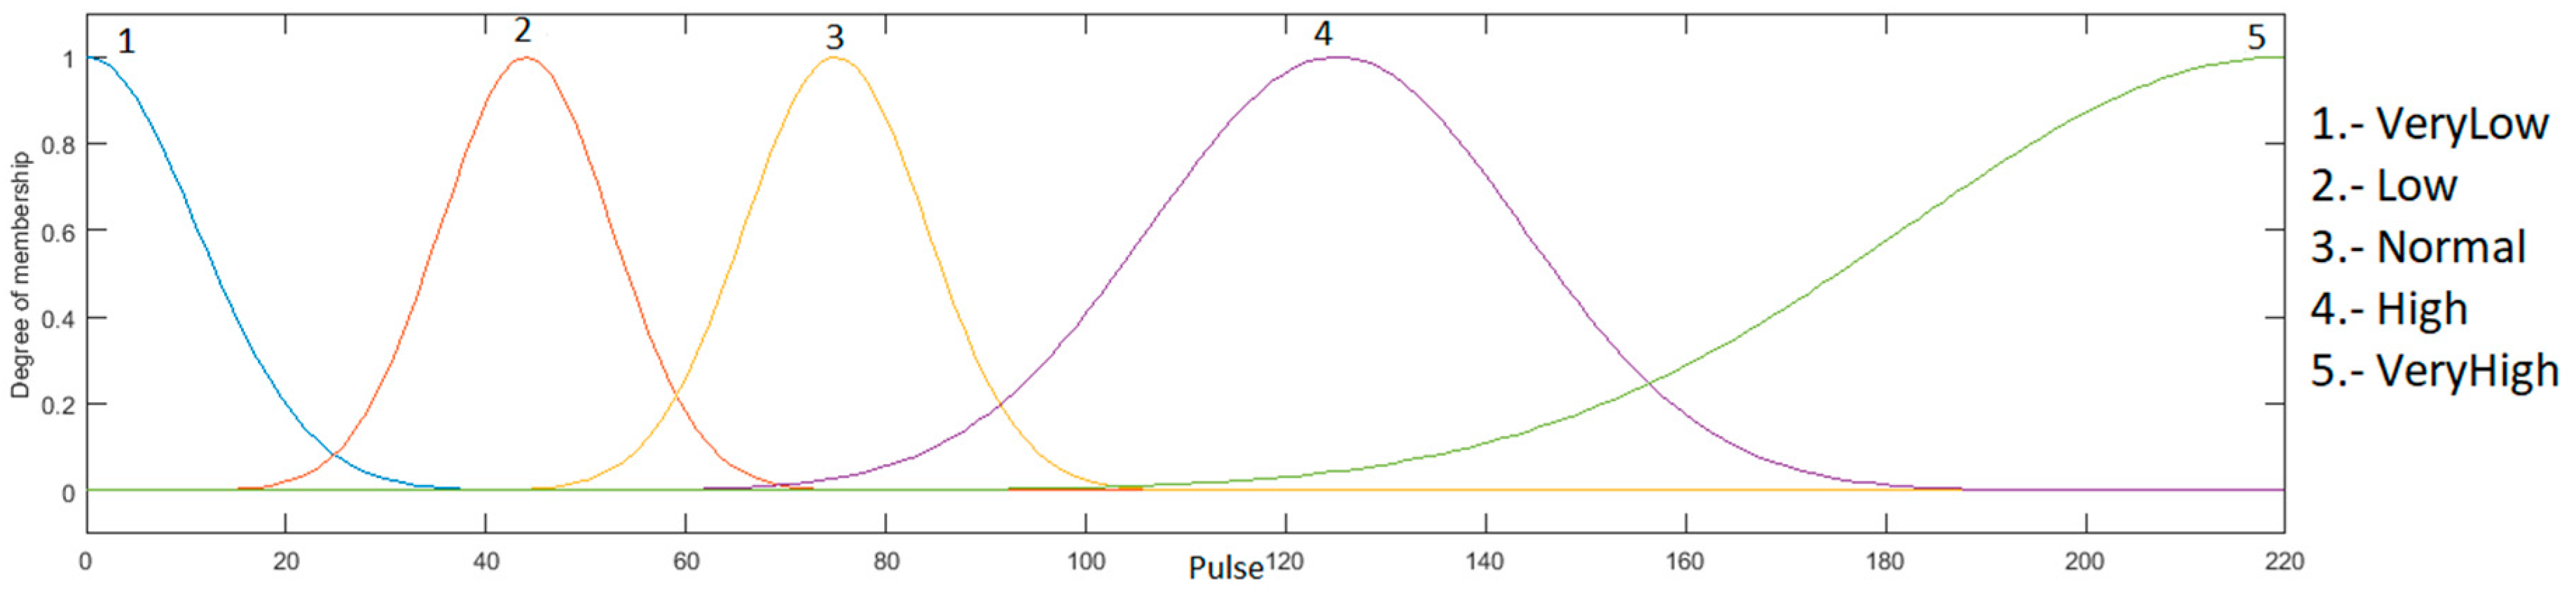
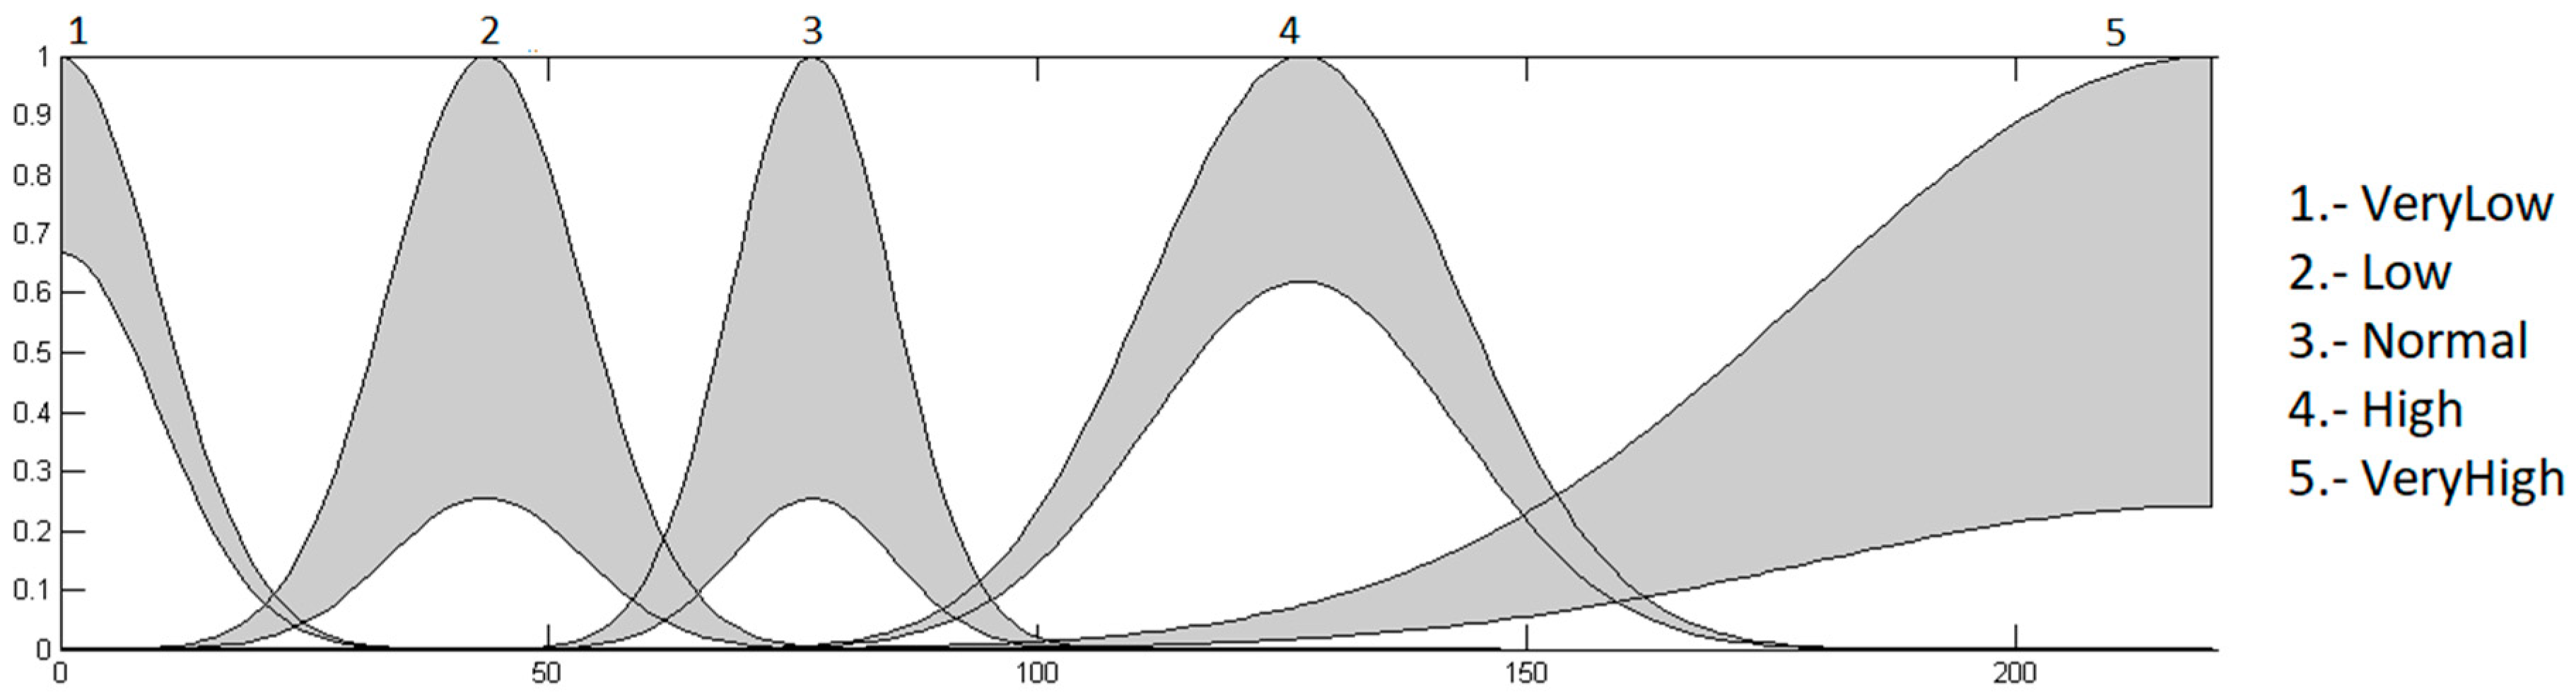
Heart rate input: this input has values in the range of 0 to 220, because it is the maximum heart rate that a young person may have during physical activity, and is granulated into 5 membership functions, which correspond to the linguistics values “Very Low”, “Low”, “Normal”, “High” and “VeryHigh”. This input is presented in
Figure 8.
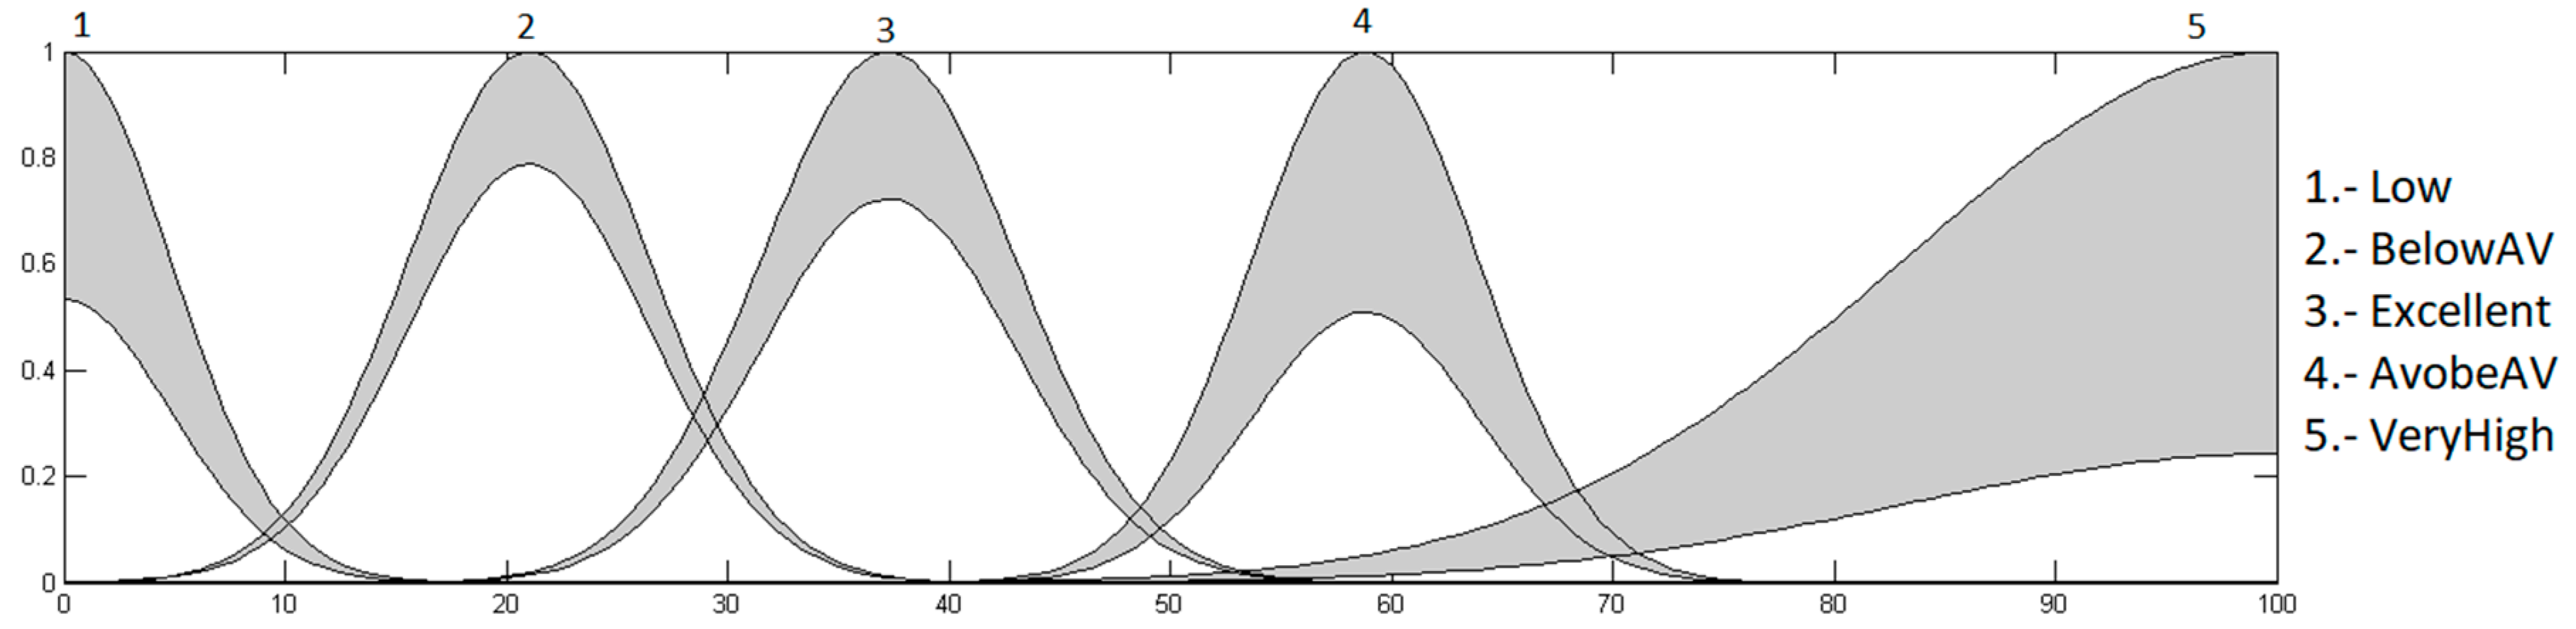
The output is the heart rate level, which has values in the range from 0 to 100%. This indicates how high or low the heart rate of the patient is, which is granulated into 5 membership functions, using the linguistic values “Low”, “BelowAV”, “Excellent”, “AboveAV” and “VeryHigh”. As a defuzzification method, the centroid of area was used. The fuzzy system output is presented in
Figure 9.
The fuzzy system is formed by 20 rules, which depend on the age and heart rate to define the heart rate level of the patient, and are presented below:
If (Age is Child) and (Pulse is VeryLow) then (PLevels is Low) (1)
If (Age is Child) and (Pulse is Low) then (PLevels is Low) (1)
If (Age is Child) and (Pulse is Normal) then (PLevels is Excellent) (1)
If (Age is Child) and (Pulse is High) then (PLevels is Excellent) (1)
If (Age is Child) and (Pulse is VeryHigh) then (PLevels is AboveAV) (1)
If (Age is Young) and (Pulse is VeryLow) then (PLevels is Low) (1)
If (Age is Young) and (Pulse is Low) then (PLevels is BelowAV) (1)
If (Age is Young) and (Pulse is Normal) then (PLevels is Excellent) (1)
If (Age is Young) and (Pulse is High) then (PLevels is AboveAV) (1)
If (Age is Young) and (Pulse is VeryHigh) then (PLevels is Very_High) (1)
If (Age is Adult) and (Pulse is VeryLow) then (PLevels is Low) (1)
If (Age is Adult) and (Pulse is Low) then (PLevels is BelowAV) (1)
If (Age is Adult) and (Pulse is Normal) then (PLevels is Excellent) (1)
If (Age is Adult) and (Pulse is High) then (PLevels is AboveAV) (1)
If (Age is Adult) and (Pulse is VeryHigh) then (PLevels is Very_High) (1)
If (Age is Elder) and (Pulse is High) then (PLevels is Very_High) (1)
If (Age is Elder) and (Pulse is VeryHigh) then (PLevels is Very_High) (1)
If (Age is Elder) and (Pulse is VeryLow) then (PLevels is Low) (1)
If (Age is Elder) and (Pulse is Low) then (PLevels is Excellent) (1)
If (Age is Elder) and (Pulse is Normal) then (PLevels is Excellent) (1)
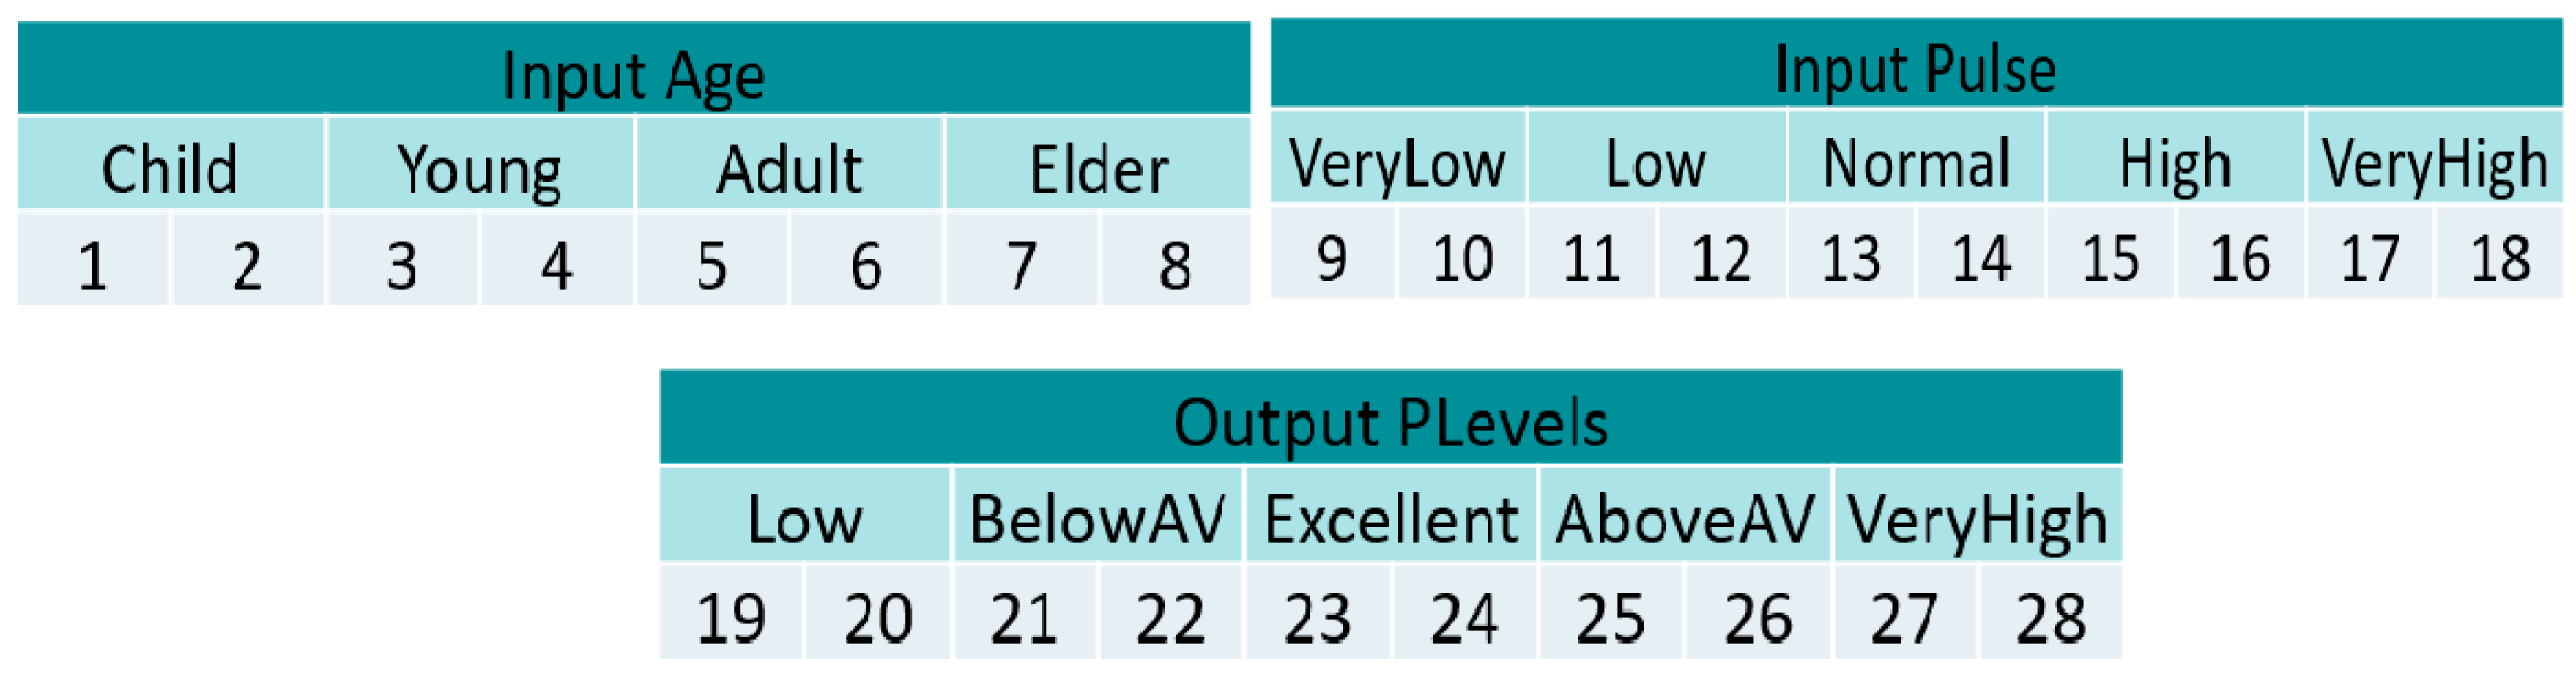
3.3. Optimization of the Type-1 Fuzzy Inference System with the BSA
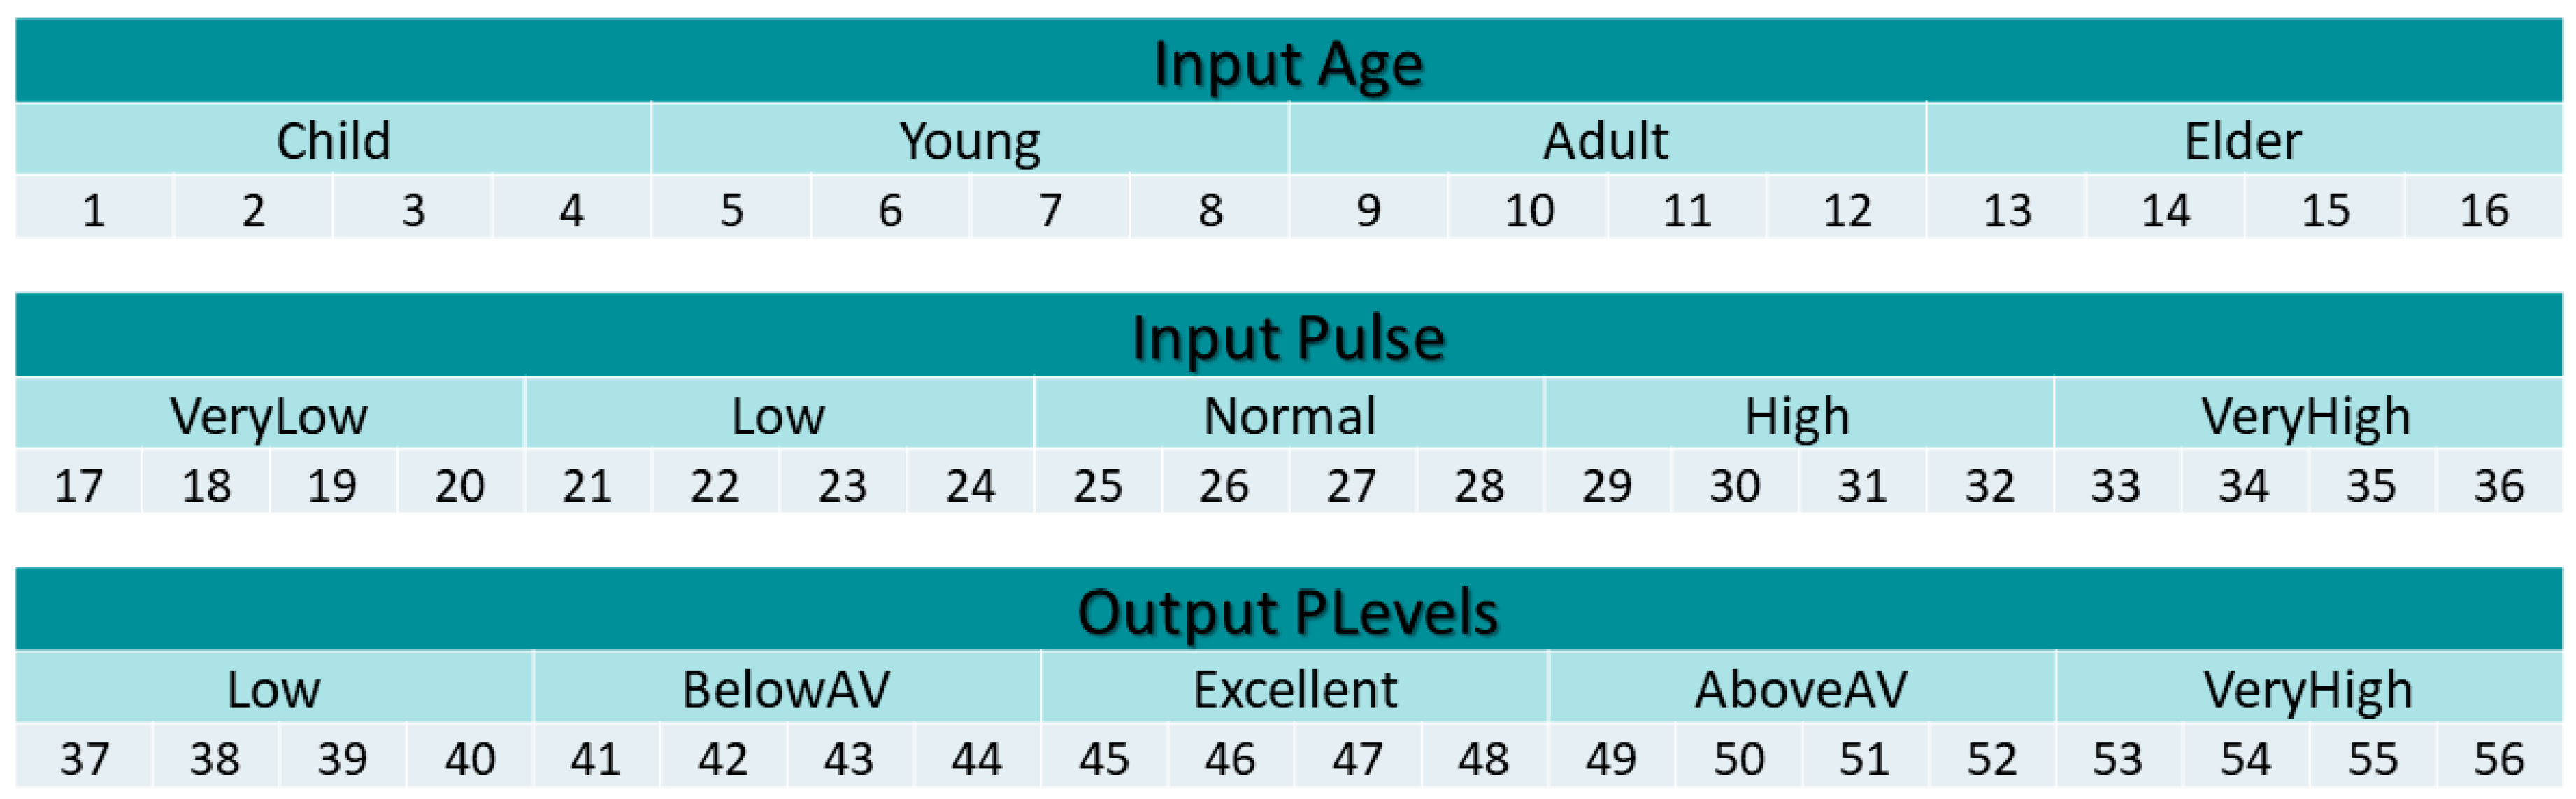
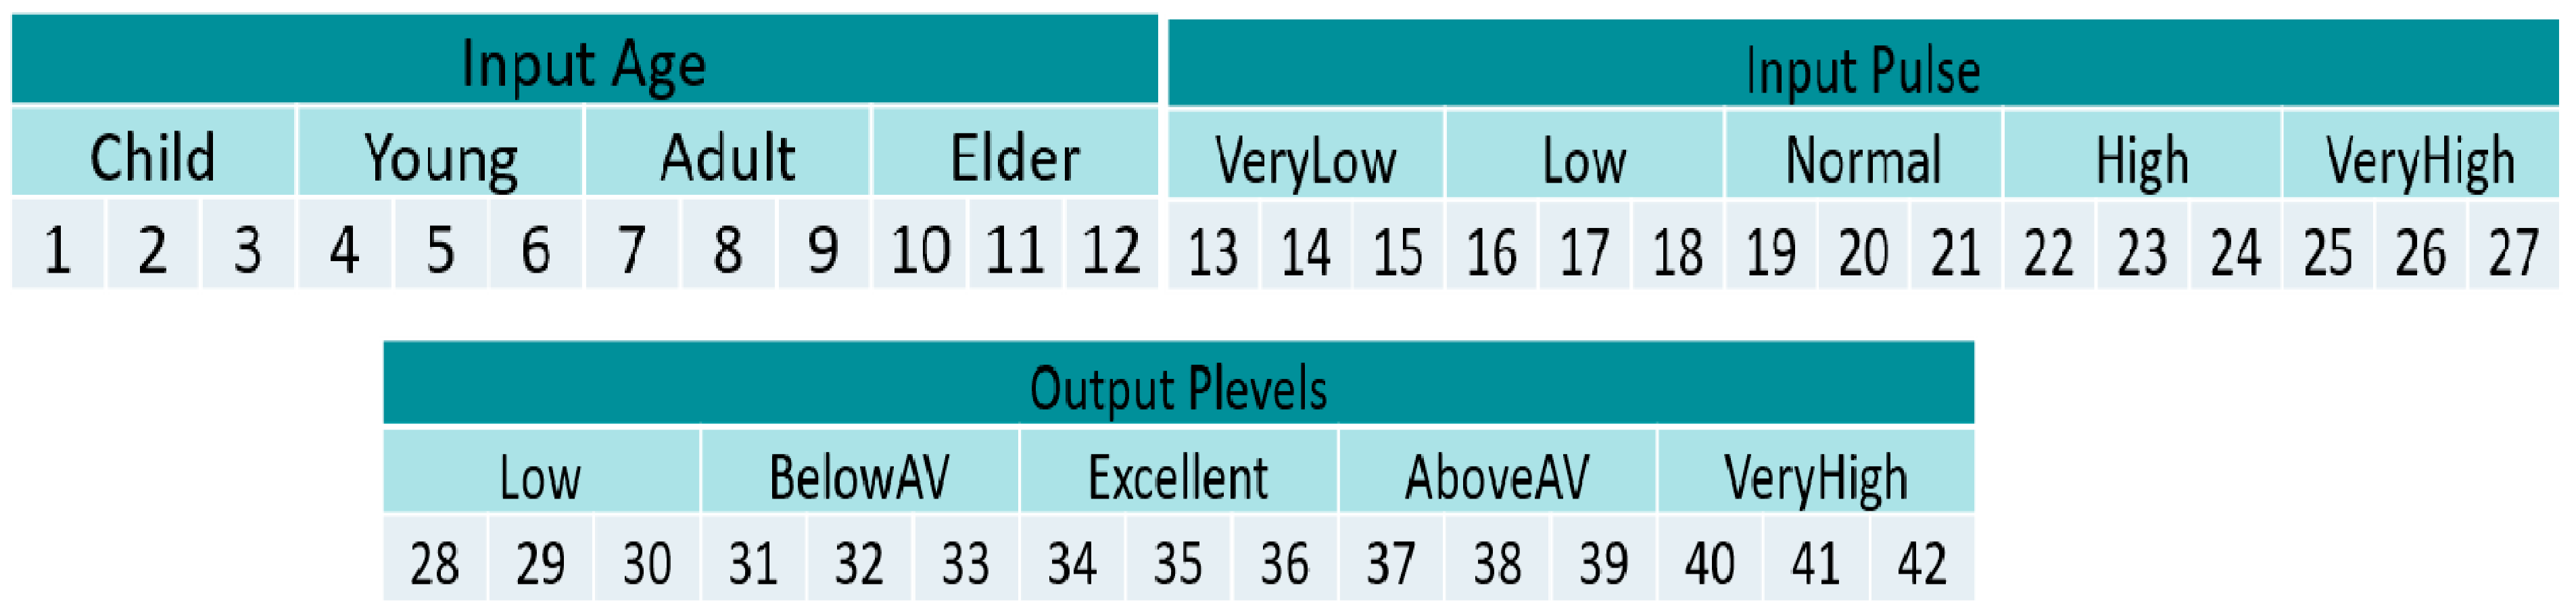
The fuzzy systems were optimized to improve their performance using the BSA, where a search for the best parameter values for the membership functions was made with the aim of obtaining an improvement in the classification of the patients. Thirty experiments were carried out in which the parameters of the BSA were varied, as presented in
Table 2.
Figure 10 presents the representation of the fuzzy system with Trapezoidal membership functions, and in
Figure 11, the representation of the fuzzy system with Gaussian membership functions is illustrated, with each one of the points of the membership functions adjusted by the BSA.
As a fitness function, the mean square error is used, in order to minimize the error in classification. For this, the previous error is compared with the one obtained in the new iteration.
Where: n = number of data points, Ŷ = output value by the model, Y = the real value for data point i.
3.4. Design and Optimization of the Interval Type-2 Fuzzy Systems
Once the type-1 fuzzy systems have been optimized with the different membership functions used, they are taken as a reference for the design of the IT2FS systems to test the model. In this case, the footprint of uncertainty is symmetrical.
In
Figure 12 and
Figure 13, the inputs of the fuzzy system with trapezoidal membership functions are presented, and the output of the fuzzy system with trapezoidal membership functions is presented in
Figure 14.
The inputs with Gaussian membership functions are presented in
Figure 15 and
Figure 16. The output of the heart rate is presented in
Figure 17.
For these fuzzy systems, the footprint of uncertainty is optimized; this is to obtain its correct adjustment, and thus classification can be satisfactorily performed.
Figure 18 presents the representation of the Gaussian membership functions, and for the trapezoidal membership functions, the representation of individuals is presented in
Figure 10, which is the same as for the type-1 fuzzy system. Each of these represents the points related to the footprint of uncertainty of the membership functions to be optimized. It is worth mentioning that the 20 rules above are also used in these fuzzy systems.
In the same way as for the optimization of type-1 fuzzy systems, the mean square error is used as a fitness function in order to minimize classification error, as found in Equation (7).
4. Knowledge Representation
4.1. Knowledge Representation of the Optimized Type-1 Fuzzy System with Trapezoidal Membership Functions
In this section, the knowledge representation of the inputs and output of the optimized type-1 fuzzy system for the classification of the pulse level with trapezoidal membership functions is presented.
4.1.1. Input Variables
4.1.1.1. Input Age
This input variable has the linguistic values “
Child”, “
Young”, “
Adult” and “
Elder”. The fuzzy values for the given functions are presented as follows:
4.1.1.2. Input Heart Rate
This variable has the linguistic values “
Very Low”, “
Low”, “
Normal”, “
High” and “
VeryHigh”. The fuzzy values for the given functions are presented as follows:
4.1.2. Output Variable
This fuzzy inference system has an output variable, which corresponds to the heart rate level of the patients and has the following linguistic values: “
Low”, “BelowAV”, “Excelent”, “AboveAV” and “
VeryHigh”. The fuzzy values for the functions are given below:
4.2. Knowledge Representation of the Optimized Type-1 Fuzzy System with Gaussian Membership Functions
The knowledge representation of the optimized type-1 fuzzy system with Gaussian membership functions is presented below.
4.2.1. Input Variables
4.2.1.1. Input Age
This input variable has the linguistic values “
Child”, “
Young”, “
Adult” and “
Elder”. The fuzzy values for the given functions are presented as follows:
4.2.1.2. Input Heart Rate
This variable has the linguistic values “
Very Low”, “
Low”, “
Normal”, “
High” and “
VeryHigh”. The fuzzy values for the given functions are presented as follows:
4.2.2. Output Variable
This fuzzy inference system has an output variable, which corresponds to the heart rate level of the patient’s and has the following linguistic values: “
Low”, “
BelowAV”, “
Excelent”, “
AboveAV” and “
VeryHigh”. The fuzzy values for the given functions are given below:
4.3. Knowledge Representation of the Optimized Interval Type-2 Fuzzy System with Trapezoidal Membership Functions
The knowledge representation of the interval type-2 fuzzy system with trapezoidal membership functions is presented below.
4.3.1. Input Variables
4.3.1.1. Input Age
This input variable has the linguistic values “
Child”, “
Young”, “
Adult” and “
Elder”, for each of the upper and lower membership functions. The fuzzy values for the given functions are presented as follows:
4.3.1.2. Input Heart Rate
This variable has the linguistic values “
Very Low”, “
Low”, “
Normal”, “
High” and “
VeryHigh”, for each of the upper and lower membership functions. The fuzzy values for the given functions are presented as follows:
4.3.2. Output Variable
This fuzzy system has an output variable, which corresponds to the heart rate level of the patient’s and has the following linguistic values: “
Low”, “
BelowAV”, “
Excelent”, “
AboveAV” and “
VeryHigh”, for each of the lower and upper membership functions. The fuzzy values for the given functions are given below:
4.4. Knowledge Representation of the Optimized Interval Type-2 Fuzzy System with Gaussian Membership Functions
In this section, knowledge representation of the inputs and output of the optimized interval type-2 fuzzy system for the classification of the heart rate level with Gaussian membership functions is presented.
4.4.1. Input Variables
4.4.1.1. Input Age
This input variable has the linguistic values “
Child”, “
Young”, “
Adult” and “
Elder”, for each of the upper and lower membership functions. The fuzzy values for the given functions are presented as follows:
4.4.1.2. Input Heart Rate
This variable has the linguistic values “
Very Low”, “
Low”, “
Normal”, “
High” and “
VeryHigh”, for each of the upper and lower membership functions. The fuzzy values for the given functions are presented as follows:
4.4.2. Output Variable
This fuzzy system has an output variable, which corresponds to the heart rate level of the patient’s and has the following linguistic values: “
Low”, “
BelowAV”, “
Excelent”, “
AboveAV” and “
VeryHigh”, for each of the lower and upper membership functions. The fuzzy values for the given functions are given below:
5. Results
5.1. Optimization of Type-1 Fuzzy Systems
To carry out the optimization of the fuzzy systems, 30 experiments were performed, changing the parameters of the BSA in each case. These parameters are presented in
Table 2, where
M is the number of iterations,
pop the population of birds,
DimT is the number of dimensions used to optimize the fuzzy inference system with trapezoidal membership functions,
DimG the dimensions used to optimize the fuzzy system with Gaussian membership functions,
FQ (FL) is the frequency of bird behavior,
c1 and
c2 are the cognitive and social accelerated coefficients, respectively, and
a1 and
a2 are parameters related to the indirect and direct effects of bird vigilance behavior.
In
Table 3, the parameters with the best results when performing the optimization are presented, being the same for both fuzzy inference systems.
The percentage of classification of each experiment for both fuzzy systems are presented in
Table 4, in column 2, referring to the experiments with trapezoidal membership functions. The experiments 14 and 28 were the best, with 100% classification, while column 3 refers to the experiments with Gaussian membership functions, where experiment 14 was the best, with 95% classification. The best experiments are highlighted in green.
The average classification of the 30 experiments in the fuzzy systems with trapezoidal membership functions was 94.58%, while for the Gaussian membership functions it was 90.33%.
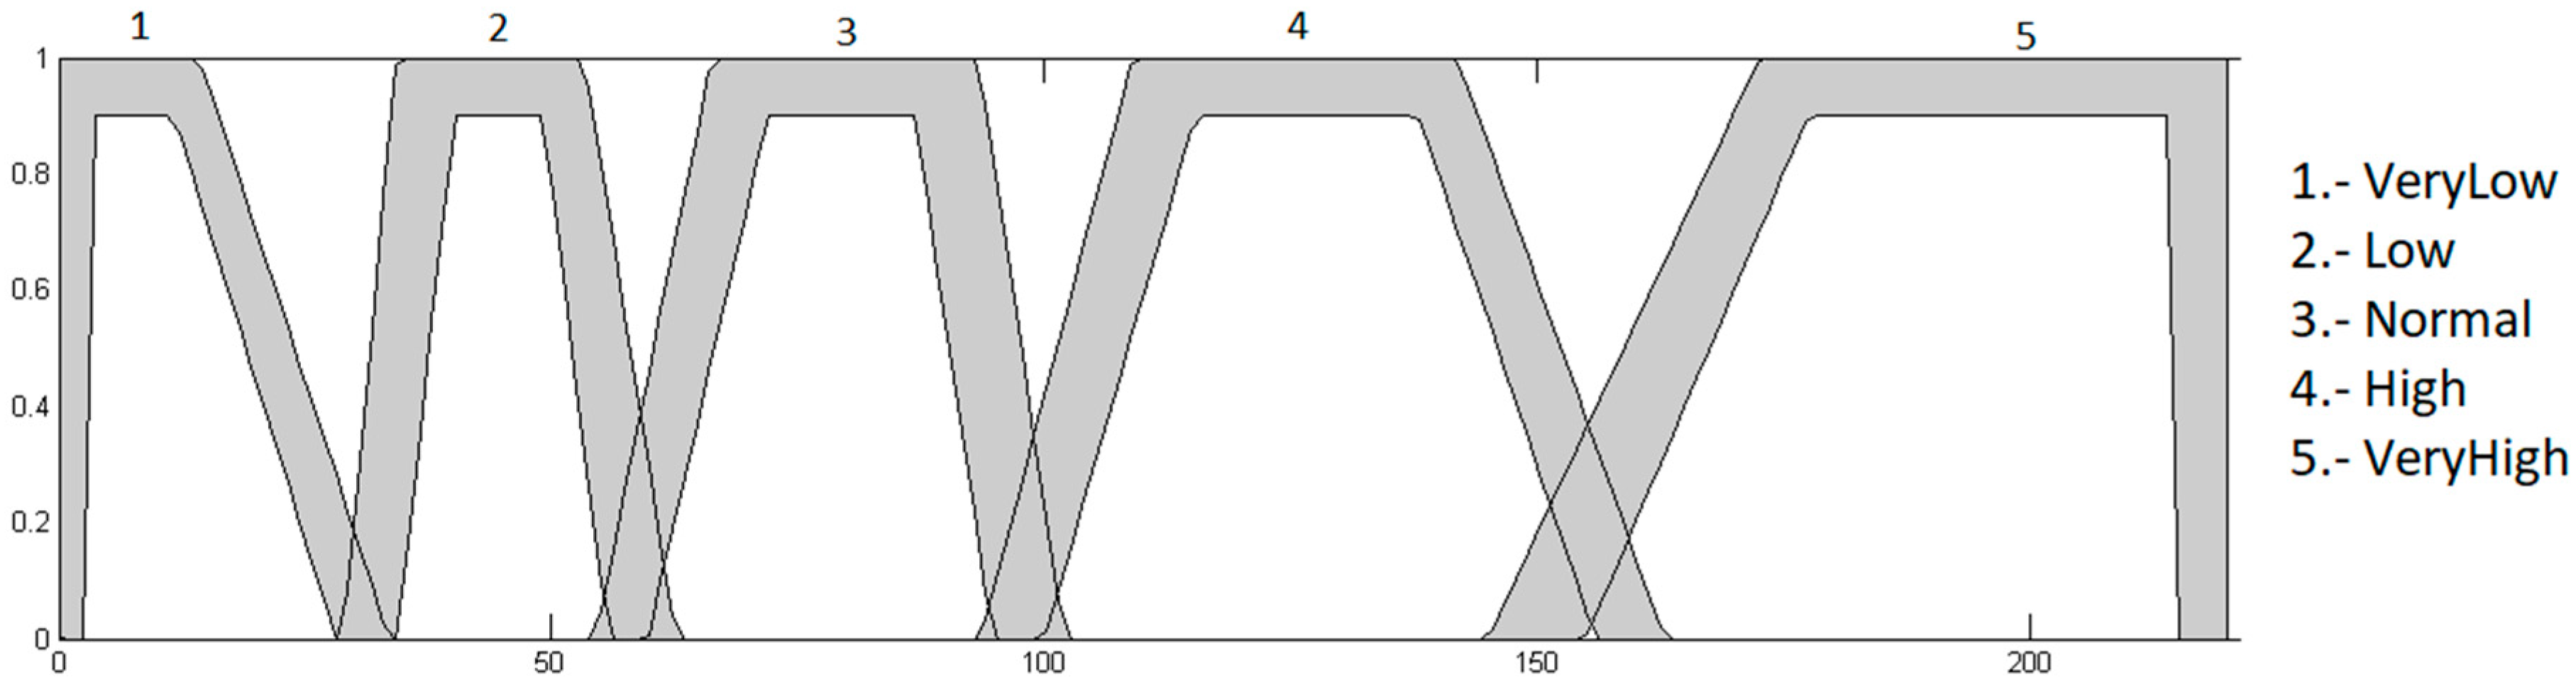
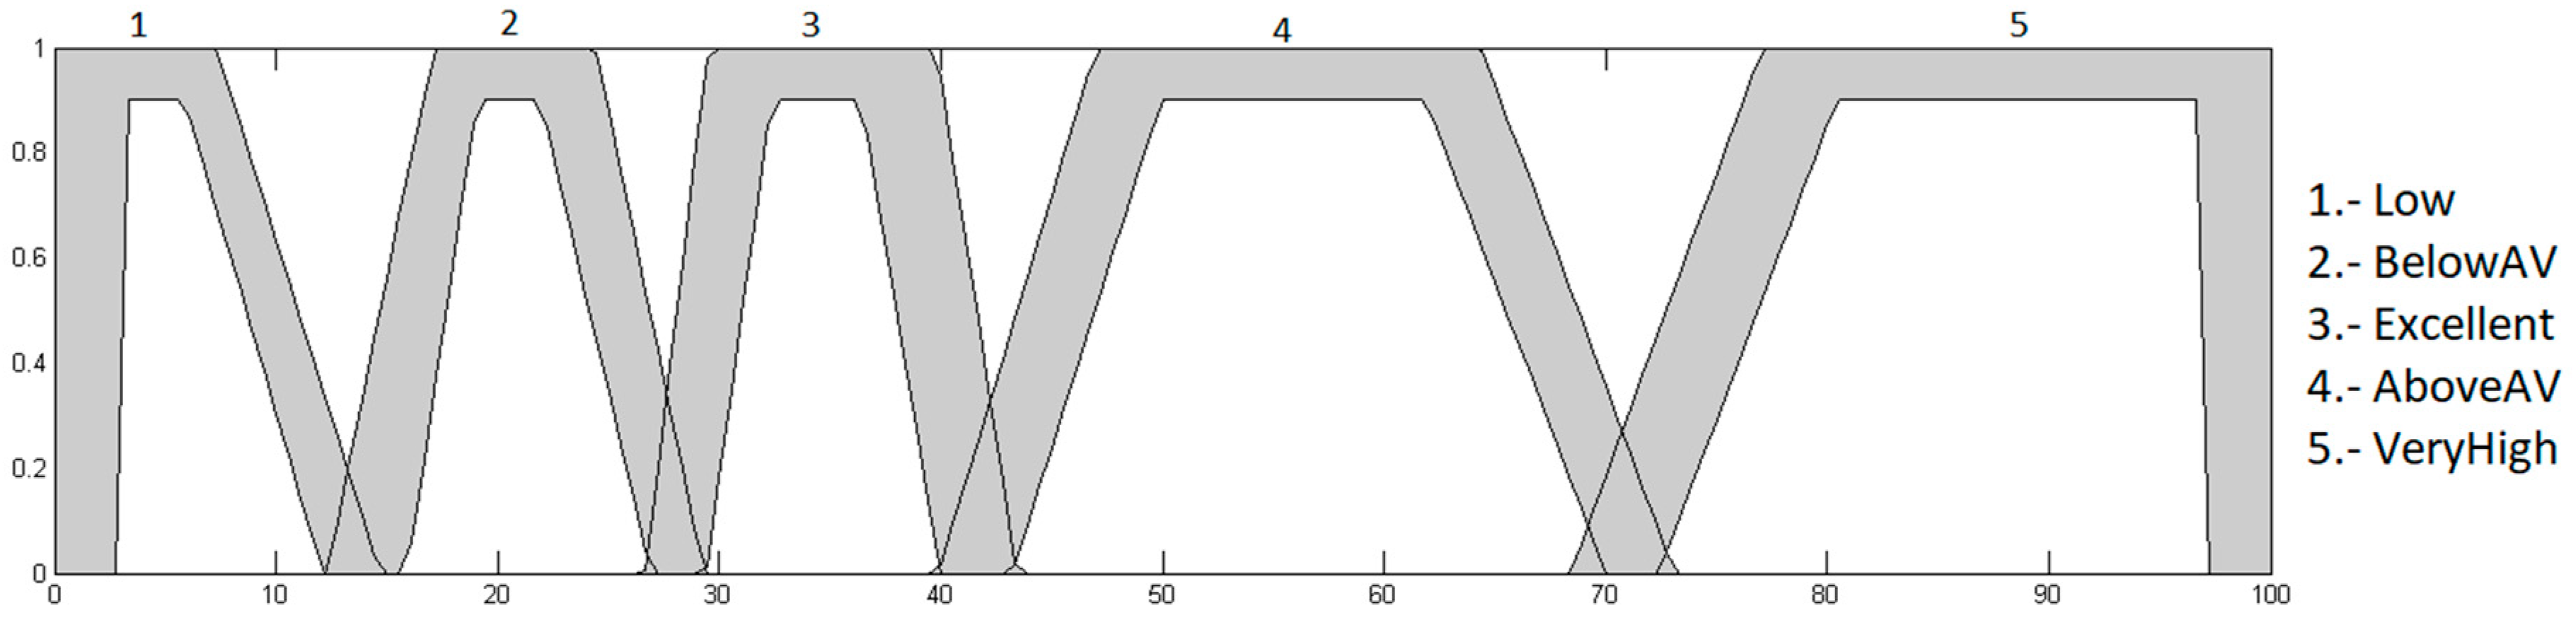
In
Figure 19 and
Figure 20, the inputs of the fuzzy system with optimized trapezoidal membership functions are illustrated. Likewise, in
Figure 21 the output with optimized trapezoidal membership functions is presented.
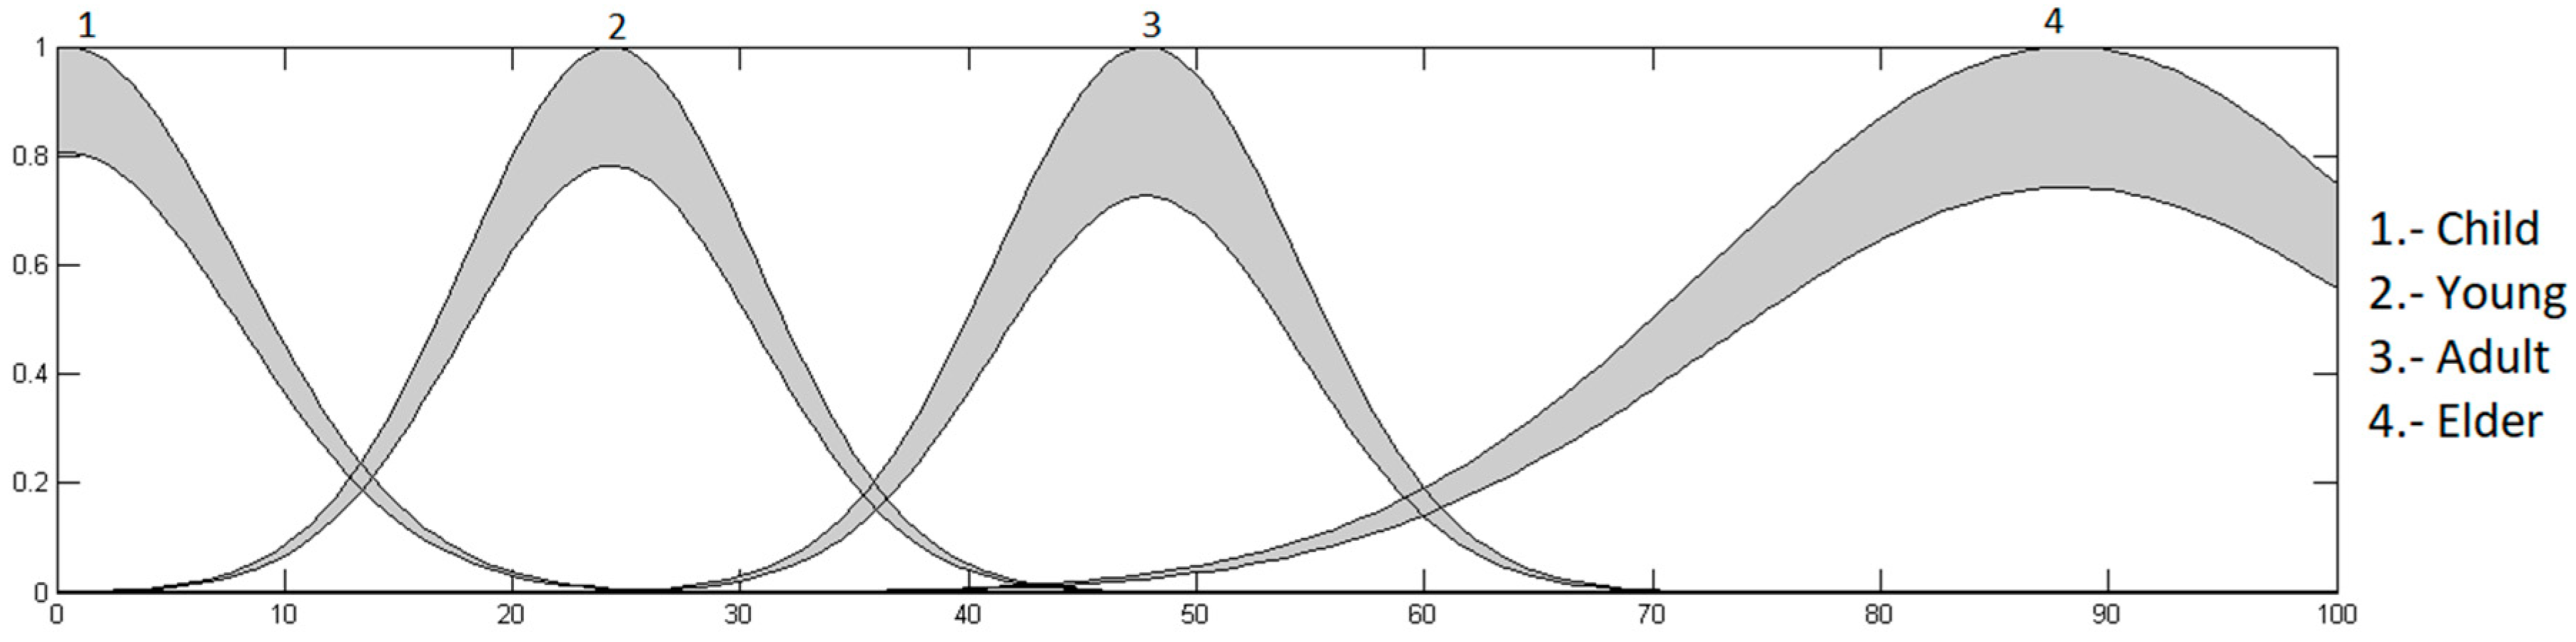
In the same way, in
Figure 22 and
Figure 23 the inputs of the optimized fuzzy system with Gaussian membership functions are presented. In
Figure 24, the output of the optimized fuzzy system with Gaussian membership function is presented. In both cases, the adjustment in each of the membership functions accomplished with the BSA can be observed.
Tests with the CSA were performed. In the same way as with BSA, 30 experiments were performed using the same population and iterations of
Table 2, also obtaining the percentage of classification of the patients. In
Table 5, the percentage of classification for each experiment is presented; column 2 presents the results with trapezoidal membership functions, while column 3 presents the results with Gaussian membership functions, in both cases presented with the type-1 fuzzy system.
The average classification of the 30 experiments in the fuzzy systems with trapezoidal membership functions was 88.33%, while for the Gaussian membership functions it was 89.66%.
In
Table 6, the comparison of the averages of the experiments performed with CSA and BSA is presented; it can be seen that a higher percentage of classification was obtained when the optimization was done with the BSA.
5.2. Optimization of the Interval Type-2 Fuzzy Systems
For the optimization of the interval type-2 fuzzy systems, 30 different experiments were carried out, using the parameters in
Table 2. Experiment 21 was the one with the best classification results for the fuzzy system with trapezoidal membership functions, with 97.5% classification. In
Table 7, the parameters of the aforementioned experiment are presented.
Meanwhile, for the interval type-2 fuzzy system with Gaussian membership functions, experiment 28 was the best, with a 100% classification. In
Table 8, the parameters of that experiment are presented.
Table 9 presents the percentage of classification in each experiment for both membership functions, having a classification average for interval type-2 fuzzy systems with trapezoidal membership functions of 92.92%, while for the interval type-2 fuzzy system with Gaussian membership functions an average rating of 92.78%. The best experiments are highlight in green.
The optimized inputs with trapezoidal membership function are presented in
Figure 25 and
Figure 26, while the output is presented in
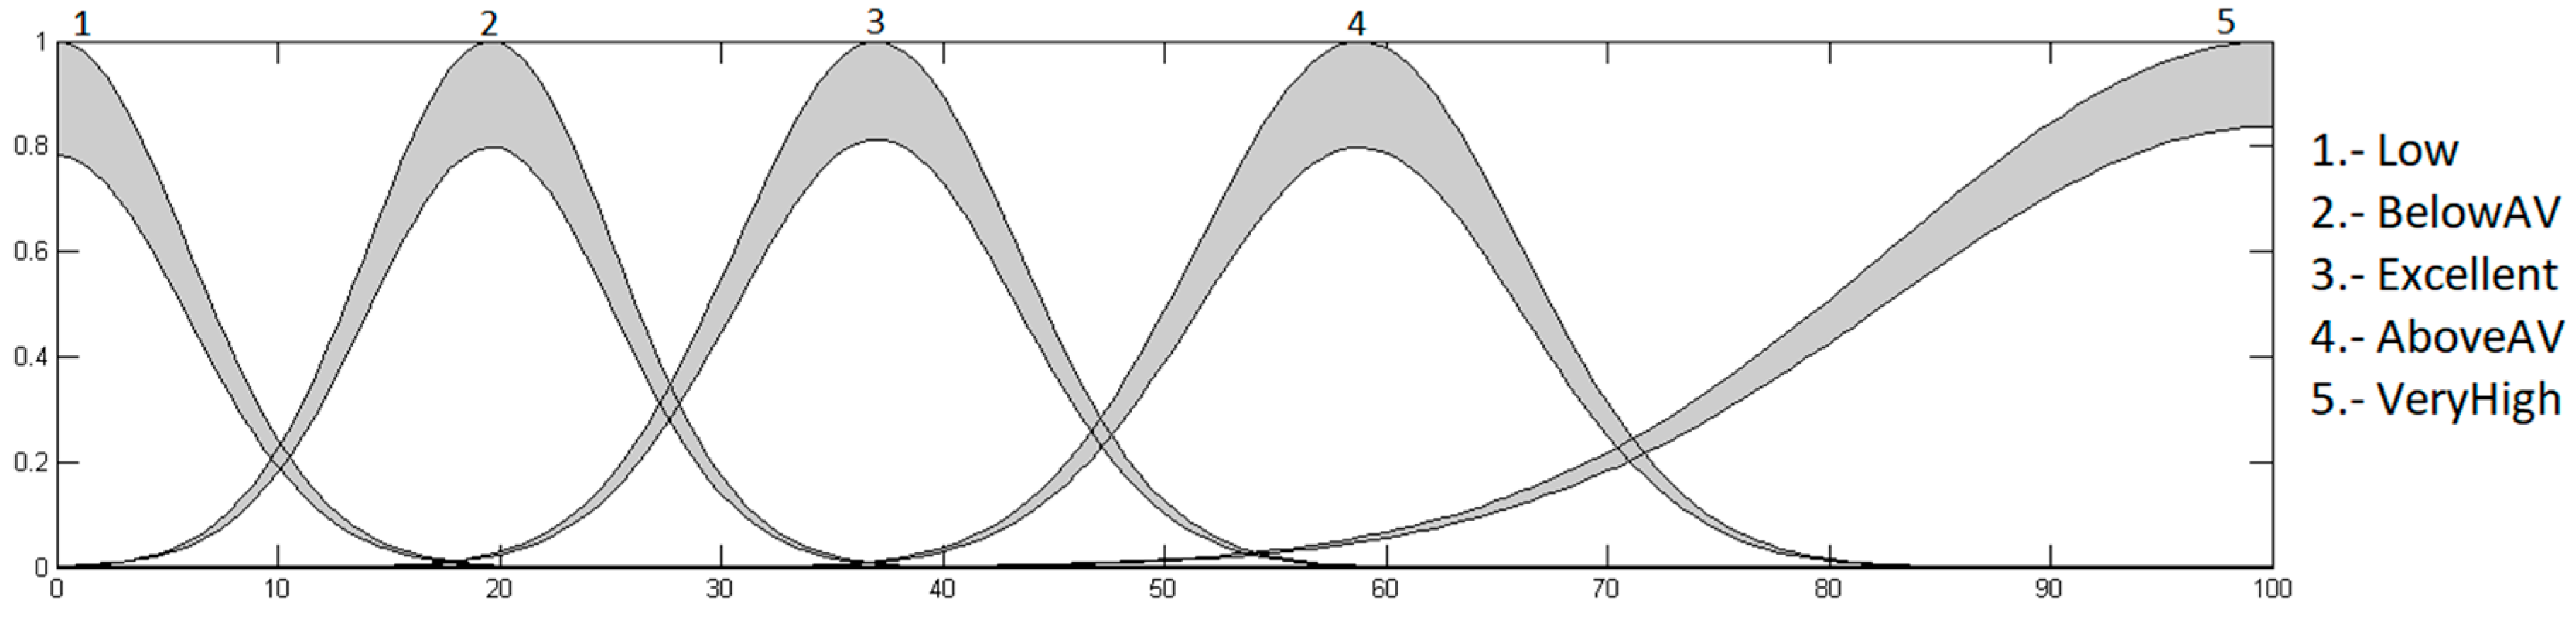
Figure 27.
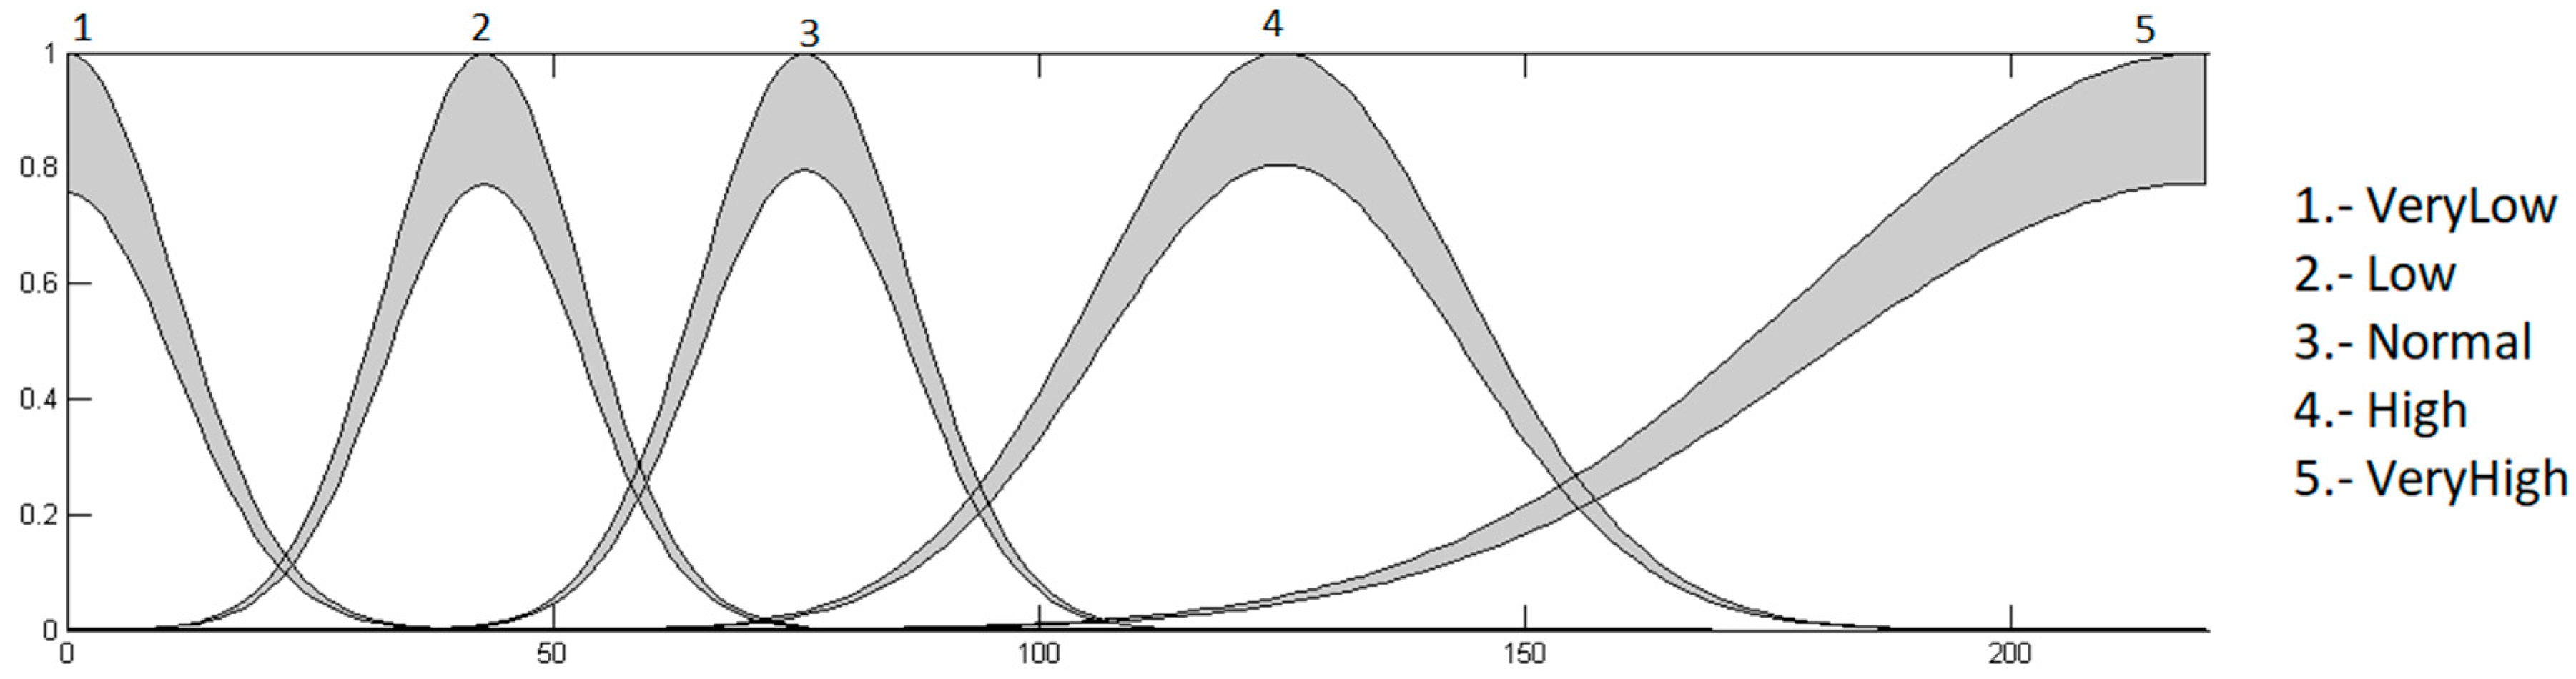
Similarly, in
Figure 28 and
Figure 29, the inputs of optimized interval type-2 fuzzy system with Gaussian membership functions are presented. The output of this fuzzy system is presented in
Figure 30.
In this case, the adjustment in the footprint of uncertainty is more noticeable than the optimizations of the type-1 fuzzy systems.
30 experiments with the CSA were performed, using the same population and iterations presented in
Table 2, and also obtaining the percentage of classification of the patients. In
Table 10, the percentage of classification for each experiment is presented; column 2 presents the results with trapezoidal membership functions, while column 3 presents the results with Gaussian membership functions in both cases being presented with the interval type-2 fuzzy system.
The average classification of the 30 experiments in the fuzzy systems with trapezoidal membership functions was 92.83%, while for the Gaussian membership functions it was 88.33%.
In
Table 11, the comparison of the averages of the experiments performed with CSA and BSA is presented, it can be seen that a higher percentage of classification was obtained when the optimization was done with the BSA.
5.3. Tests with Patients Using the Type-1 Fuzzy Systems
Tests were carried out with 15 random patients; this is because in our group of patients, there is not much variation in age and, usually, the level of the pulse is found to be in the excellent range, and we wanted to observe that the fuzzy system made classifications correctly for different ages and heart rate levels.
Table 12 presents the age and pulse of the randomized patients when
BelowAV is the value below average,
Excnt is excellent,
AboveAV is above average and
Vhigh is very high value. In this case, the non-optimized fuzzy system with trapezoidal membership functions classified 13 patients correctly, and the optimized fuzzy system classified all 15 patients correctly. On the other hand, the non-optimized Gaussian fuzzy system classified 12 patients correctly, and the optimized fuzzy system classified 14 patients correctly. The patients classified incorrectly are highlighted in red.
Table 13 presents the results of the classification of 20 patients from our database, with the non-optimized fuzzy system with trapezoidal membership functions correctly classifying 19 patients, as well as the optimized fuzzy system. In the case of the non-optimized fuzzy system with Gaussian membership functions, 19 patients were classified correctly, while the optimized fuzzy system did not have a single error in the classification.
5.4. Tests with Patients Using Interval Type-2 Fuzzy Systems
In the same way as with the type-1 fuzzy systems, interval type-2 (optimized and non-optimized) fuzzy systems were tested to compare their results, considering the classification results of 15 random patients in
Table 14. In this case, the fuzzy system with non-optimized trapezoidal membership functions classified 13 patients correctly, as did the optimized fuzzy system. The fuzzy system with non-optimized Gaussian membership functions classified 12 patients correctly, while the optimized one classified all 15 patients correctly.
Table 15 presents classification results with interval type-2 fuzzy systems with our patients. As can be seen, the non-optimized fuzzy system with trapezoidal membership functions classified 19 patients correctly, the non-optimized fuzzy system with Gaussian membership functions classified 18 patients correctly, while optimized fuzzy systems classified all patients correctly.
Table 16 summarizes the percentages of classification of the fuzzy inference systems for the 15 random patients.
Table 17 presents the percentages of classification in the fuzzy inference systems for the 20 real patients.
It can be observed in
Table 16 and
Table 17 that the fuzzy systems, both type-1 and interval type-2 with Gaussian membership functions, achieved a 100% classification in most of the experiments performed with the different sets of patients, and in which the improvement of classification when optimized was also remarkable, given that the lowest value for the non-optimized fuzzy system was 80% correct classification.
6. Discussion
Optimization has been applied in a large number of areas using different bio-inspired algorithms to find the best solution to different types of problems. In industry, we can find how genetic algorithms are implemented to maximize the useful life of a high-performance controller in the drilling process, as well as the material removal rate [
43]. With regard to the optimization of artificial neural networks, the harmony search algorithm has been used to train the echo estate neural networks [
44], which are a special form of recurrent neural networks.
Optimization of fuzzy controllers has been carried out applying the gray wolf optimizer, to find the best parameters of a Takagi-Sugeno proportional-integral fuzzy controllers for a class of non-linear servo systems [
45], and in another case was used to optimize a Takagi-Sugeno fuzzy PI controller for the flux and conductivity control of Reverse Osmosis Desalination Plants [
46].
In this work, BSA was used for the optimization of the membership function parameters in type-1 and interval type-2 fuzzy systems, with the aim of improving the performance at the moment of classifying the heart level of different patients. The optimization was performed in the same way with the CSA; in
Table 6 the comparison of the results is presented when the type-1 fuzzy systems are optimized, showing that for both membership functions, using the BSA provides a better result. Meanwhile, in
Table 11, the results are presented when optimizing the footprint of uncertainty of interval type-2 fuzzy systems. In the case when the trapezoidal membership functions were optimized, the improvement is minimal when the BSA algorithm is compared with the CSA; on the contrary, for optimization of fuzzy system with Gaussian membership functions, it is observed that the BSA was better.
Different tests were performed with patients in order to decide which of the optimized fuzzy systems yields a better classification, and the results were compared with non-optimized fuzzy systems, as presented in
Table 16 and
Table 17, noting that, for the different sets of patients, better results were obtained with the fuzzy systems optimized with Gaussian membership functions, since they classified 100% of patients correctly in both cases.
7. Conclusions
In this work, the design, implementation, and optimization of fuzzy systems for the classification of the heart level is presented. The algorithm chosen for this optimization was the BSA, with which a total of 30 different experiments were carried out with type-1 and IT2FS, varying the parameters of the algorithm until good results were obtained. The experiments described above were made in the same way as with the CSA, and when performing the comparison of results, a better classification was obtained when optimizing with the BSA.
Experiments were performed with different sets of patients, testing the fuzzy systems, which produced a better percentage of classification when optimized, as well as the non-optimized fuzzy systems to compare the classification provided.
Once this was done and the results were compared, it could be observed that a better classification was obtained with fuzzy systems in both type-1 and IT2FS with Gaussian functions, with the IT2FS model showing the best results. When the BSA algorithm was compared with the CSA algorithm, better results were obtained with the former algorithm.
With the experimentation carried out, based on the obtained results, a reliable fuzzy classifier can be provided, which correctly classifies the different heart rate levels that a patient can have based on their age and heart rate tendency provided by a modular neuronal network, and which, when used by an expert, will provide an accurate final diagnosis of any condition that the patient may have.
When comparing the proposed fuzzy system with some of those found in the literature, we could observe that the granulation in the membership functions is carried out in a simpler way, giving our fuzzy system a more extensive pulse level classification.
As future work, we envision the following: general type-2 fuzzy logic can be used to enhance uncertainty management in the fuzzy model of diagnosis, other optimization methods can be used for comparison of results, and the model of diagnosis can be adapted to other medical diagnostic problems.


