1. Introduction
High-level technology makes people desire comfort—even in negative ways. Papers, journals, and assignments are widely spread over the internet, which makes them accessible to most scholars. Easy access to information on the internet for academic purposes may lead to unethical actions, such as plagiarism. One way to plagiarize is by translating a paper into different language. With several editings, people can easily submit their plagiarized papers to local publishers. Plagiarism describes the appropriation of other persons’ ideas and intellectual or creative work and passing them of as one’s own [
1]. Observations of plagiarism behavior in practice reveal a number of commonly found methods for illegitimate text usage, which are characterized below.
“Disguised plagiarism” subsumes practices intended to mask copied segments [
2].
“Technical disguise” summarizes techniques for hiding plagiarized content from being automatically detected by exploiting weaknesses off current text-based analysis methods, e.g., by substituting characters with graphically identical symbols from foreign alphabets or inserting letters in white font color [
3].
“Undue paraphrasing” means the intentional rewriting of foreign thoughts in the vocabulary and style of the plagiarist without giving due credit for concealing the original source [
2].
“Idea plagiarism” encompasses the usage of a broader foreign concept without due source acknowledgement [
4].
“Self-plagiarism” characterizes the partial or complete reuse of one’s own previous writings not being justified by scientific goals, e.g., for presenting updates or providing access to a larger community, but primarily serving the author, e.g., for artificially increasing citation counts [
5,
6].
Hence, it is necessary to create countermeasures; one of which is checking the submitted papers for any indication of plagiarism and apply penaties to its authors. Manual plagiarism detection; however; is time consuming and requires a lot of effort, diminished its effectiveness. An automated plagiarism detection system; so-called computer-assisted plagiarism detection; is needed to able to detect cross-language similarities between the documents which are currently under development.
Automated plagiarism detection is the process of determining plagiarism in a text-based paper by using software. Some methods can be used to perform textual plagiarism detection automatically, such as checking the grammatical structure of the document (grammar based), using vector-space models to detect similarities between two documents (semantic based), using a reference corpus of documents whose contents may have been plagiarized, using a clustering method, or combining two or more of these techniques [
7].
Currently, the majority of academic sources (such as journals, proceedings, and books) are written in English, and the action of plagiarism often involves language translation process. In order to provide better tools for local publishers, the plagiarism detection system developed in this research focuses on bilingual plagiarism detection. This paper discusses a case study in which the document tested for plagiarism is in the Indonesian language while the suspected source of plagiarism is written in English. Since the sentences’ structure between Indonesian and English are very different, structure- and grammar-based detection techniques are highly sophisticated. In this research, the detection method is conducted using a semantic-based technique.
The cross-language plagiarism detection system needs to be a semantic-based computer-assisted plagiarism detector and the choice of algorithm used in the system is therefore Latent Semantic Analysis (LSA). The algorithm does not only find the similarity between two documents, but it is also supported by a language translation process. Since the detection is based on semantics, current work only focuses on word translation without paying attention to grammatical rules. This is because semantics only views a document as interrelated words and the frequency of those words within, removing the necessity for applying accurate language rules.
The method proposed in this research uses LSA, which previously showed good results in an essay grading system. The reason for using LSA in our bilingual plagiarism detection system is based on the lack of natural language processing systems for the Indonesian language; consequently, the best method would be by paying attention only to the lexical features of plagiarism detection; this is supported by LSA. Because LSA only pays attention to the existence of words in a document and does not regard the grammar, the word-by-word translation should be sufficient, and this will make the translation process relatively simple. The classification part of the detection system is conducted using a learning vector quantization (LVQ) algorithm, which is a neural network algorithm to group data based on the distance from the input vector to the classification vector.
We have developed a bilingual plagiarism detection system using LSA and LVQ. The success rate of the proposed methodology is measured by the value of precision, recall, and F-measure. Precision and recall are two calculations that are widely used to measure the performance of a system or method. They are used in this paper to measure the performance of natural language processing, which is used for the relevant documents. Precision is the degree of accuracy of the information expected by the user compared to the results given by the system (how precise the prediction of natural language processing is). Recall is the success rate of the system in rediscovering updates of information in the test language [
8].
This paper is organized as follows:
Section 2 reviews the techniques implemented in our proposed algorithm, including LSA and LVQ techniques.
Section 3 explains the methodology for conducting automated cross-language plagiarism and how LSA and LVQ are implemented in the plagiarism checker.
Section 4 explains the experiments and results of our proposed methodology in recognizing plagiarism. Finally,
Section 5 concludes the paper.
3. Methodology of the Automatic Cross-Language Plagiarism Detection System
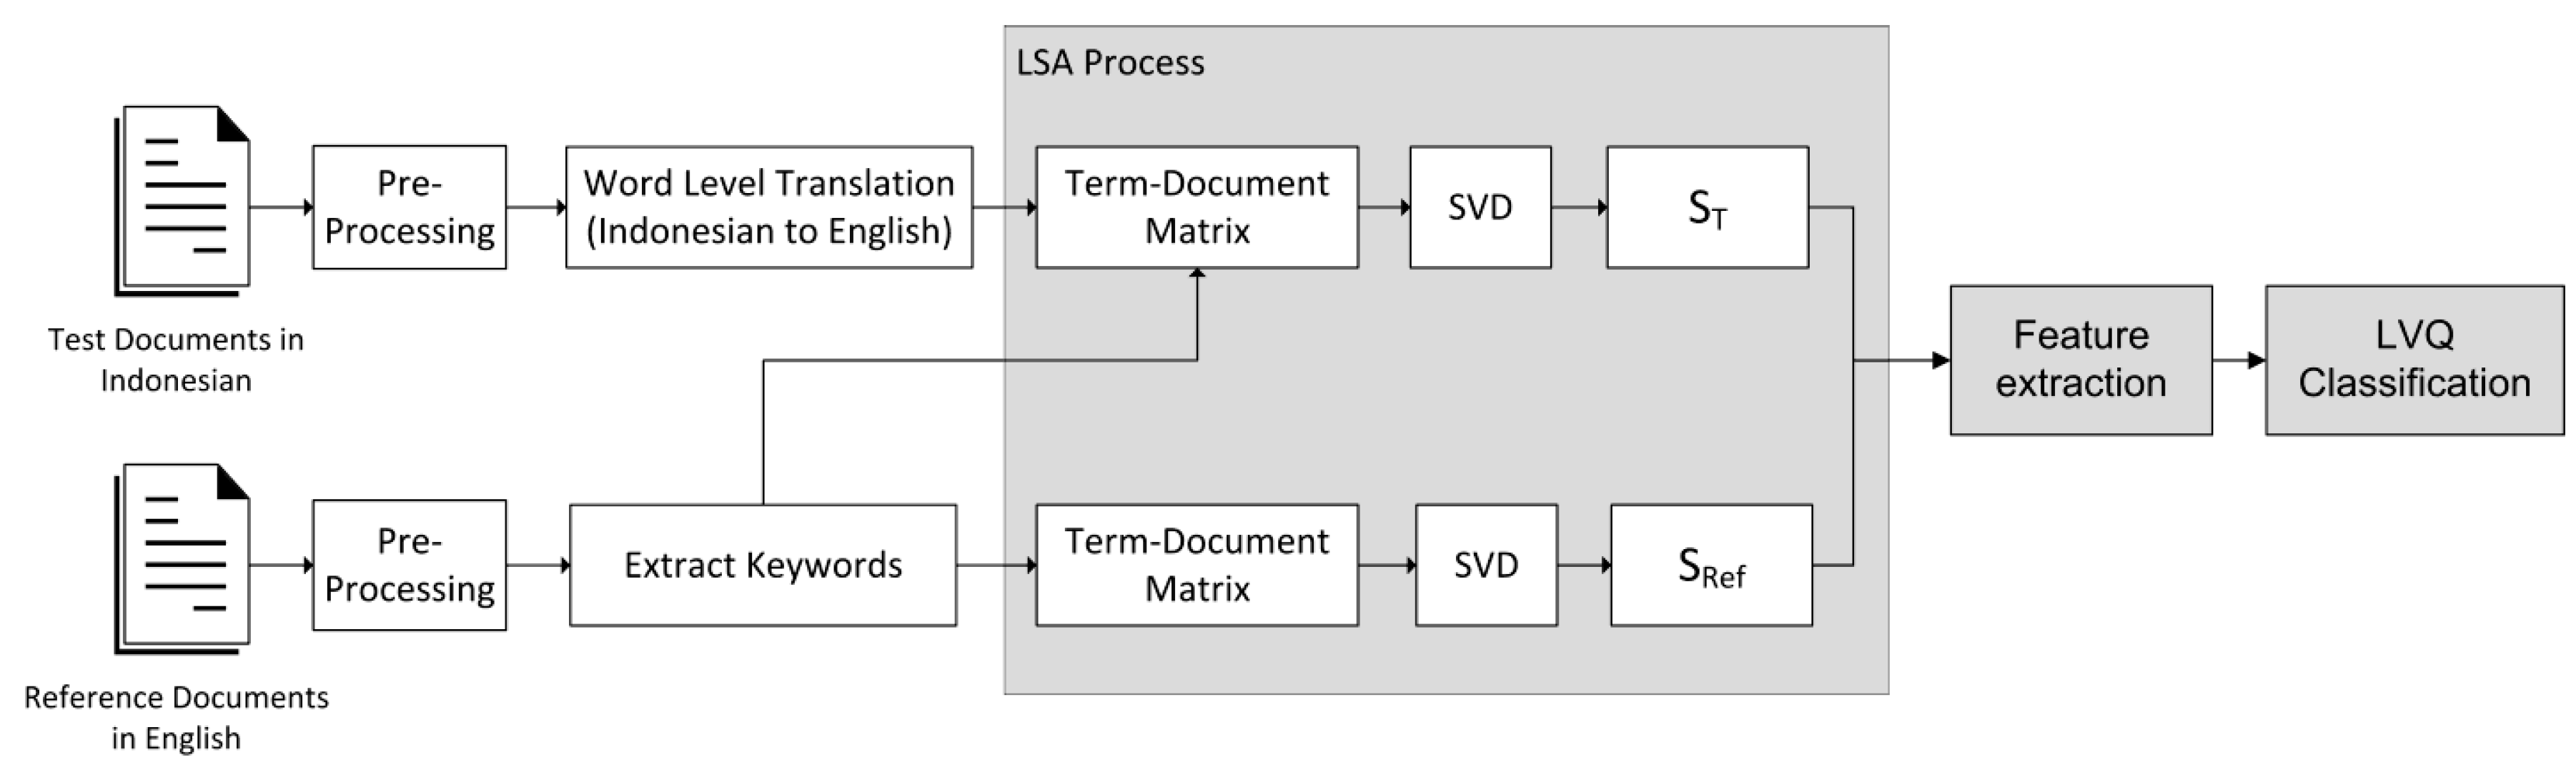
Figure 1 shows a block diagram of the plagiarism detection system for two different languages. As shown in the diagram, the test document and the reference document will be first pre-processed. At the pre-processing stage, words are separated from their sentences. Then the test document (which is written in Indonesian) is translated into English word by word, ignoring the sentence’s structure and grammar. After all the words are translated, a term–document matrix is formed and processed using SVD. The result of SVD for the test document is a singular matrix S
T; for the reference document, the result of SVD is a singular matrix S
Ref. After both singular matrices are generated, the feature extraction is conducted; as the last stage, LVQ is used as the classifier. A more detailed process is explained below.
3.1. Pre-Processing
At first, punctuations are removed; then, sentences are broken down into words (array of words), and stop words are removed. Stop words (i.e.,: prepositions, auxiliaries, etc.) must be cleaned out because they pose no important semantic meaning [
8]. The frequent occurrence of stop words will disrupt the LSA algorithm and causes the algorithm became biased in determining the semantic context of the corresponding document. The result of this stage is one array for each document, where the elements are the words.
3.2. Word Level Translation for the Test Paragraph
The translation process from Indonesian to English is conducted for each of the array’s elements, and it is performed word by word by using a dictionary database. The dictionary database is stored in our own server, and it does not use an online or commercial database. The translation process is only applied to the test document, which is written in Indonesian; this step is not performed for the reference document, which is already written in English.
3.3. Extracting Keywords from Reference Paragraph
Keywords are the important words that should be noticed; in this system, keywords are taken from the reference document only. The keywords are useful in determining the term–document matrix.
3.4. LSA Process
This step is the heart of the plagiarism detection system. In the first stage, each test and reference paragraph is separately tranformed into a term–document matrix. A term–document matrix is a mathematical matrix that describes the frequency of the occurrence of keywords (terms) in the documents. In the term–document matrix, the row is a collection of words, and the column is the frequency that they appear in documents. The definition of document in the term–document matrix can be different. They can be defined as a non-fixed size document bounded only in a sentence or ended by a full-stop [
16]; however, in this paper, we used the fixed size document, and observe its behavior over variations in sizes (number of words) every 5 words from 5 up to 25.
Each term–document matrix from the test document and the reference document is processed separately using SVD, and the results of this process are ST vector for the test document and SRef vector for the reference document, which will be processed further in the feature extraction process. Furthermore, the ST and SRef vectors are processed to form feature vectors so that they can be classified using a classifier.
3.5. Feature Extraction
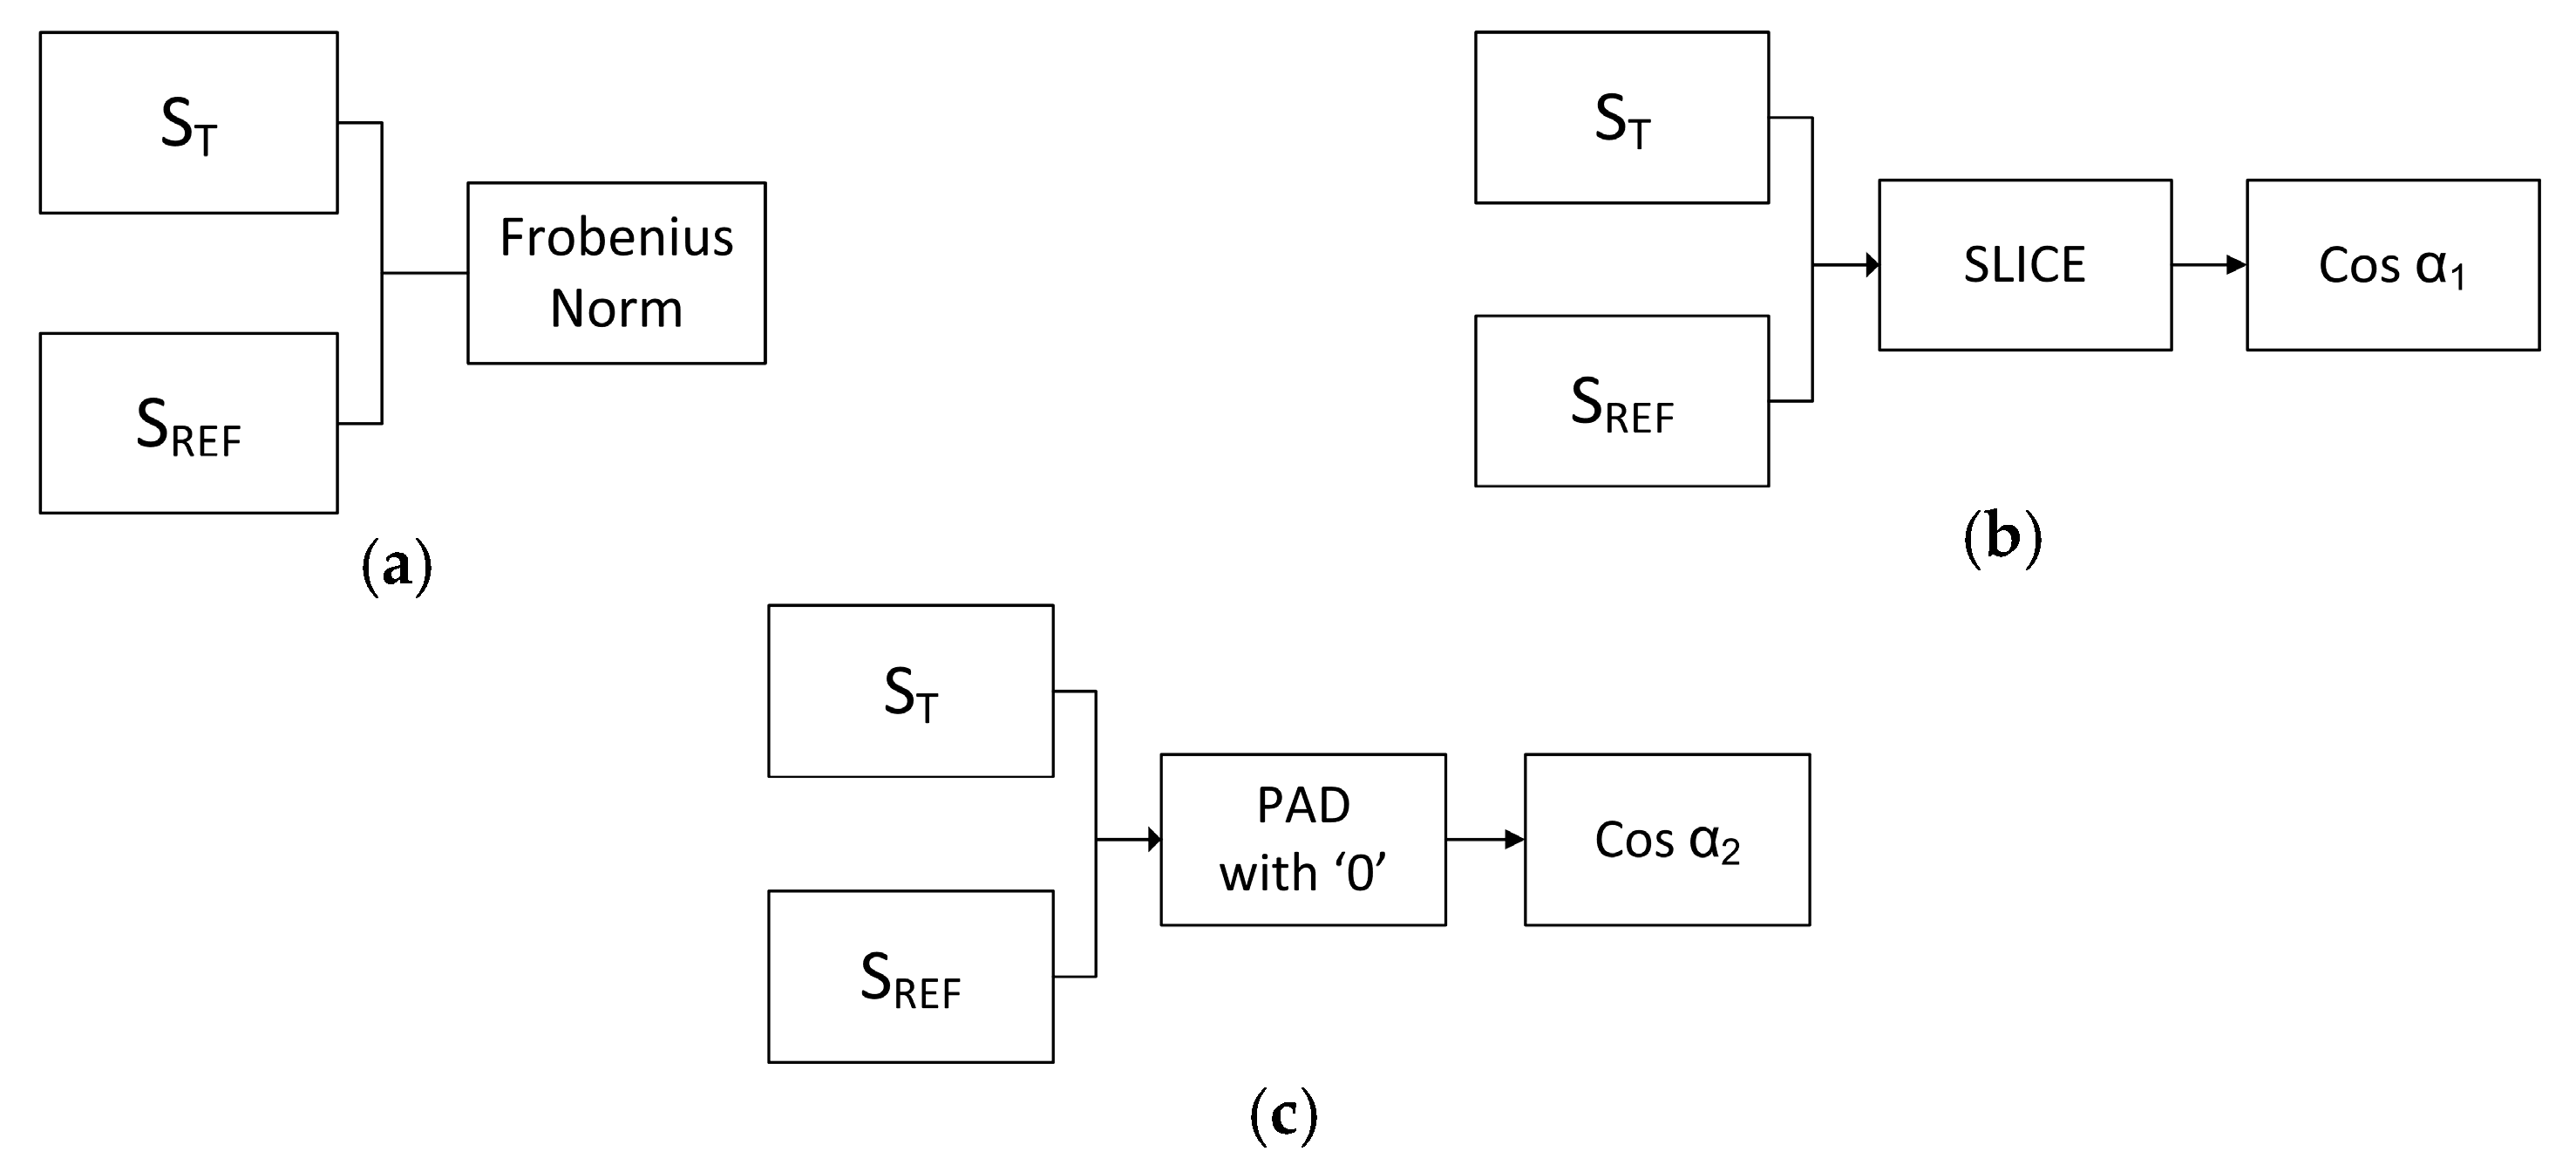
This work compares three types of features, which are the ratio of the Frobenius norm on both vectors; the angle between the vectors using slice method; and the angle between the vectors using pad method as depicted in
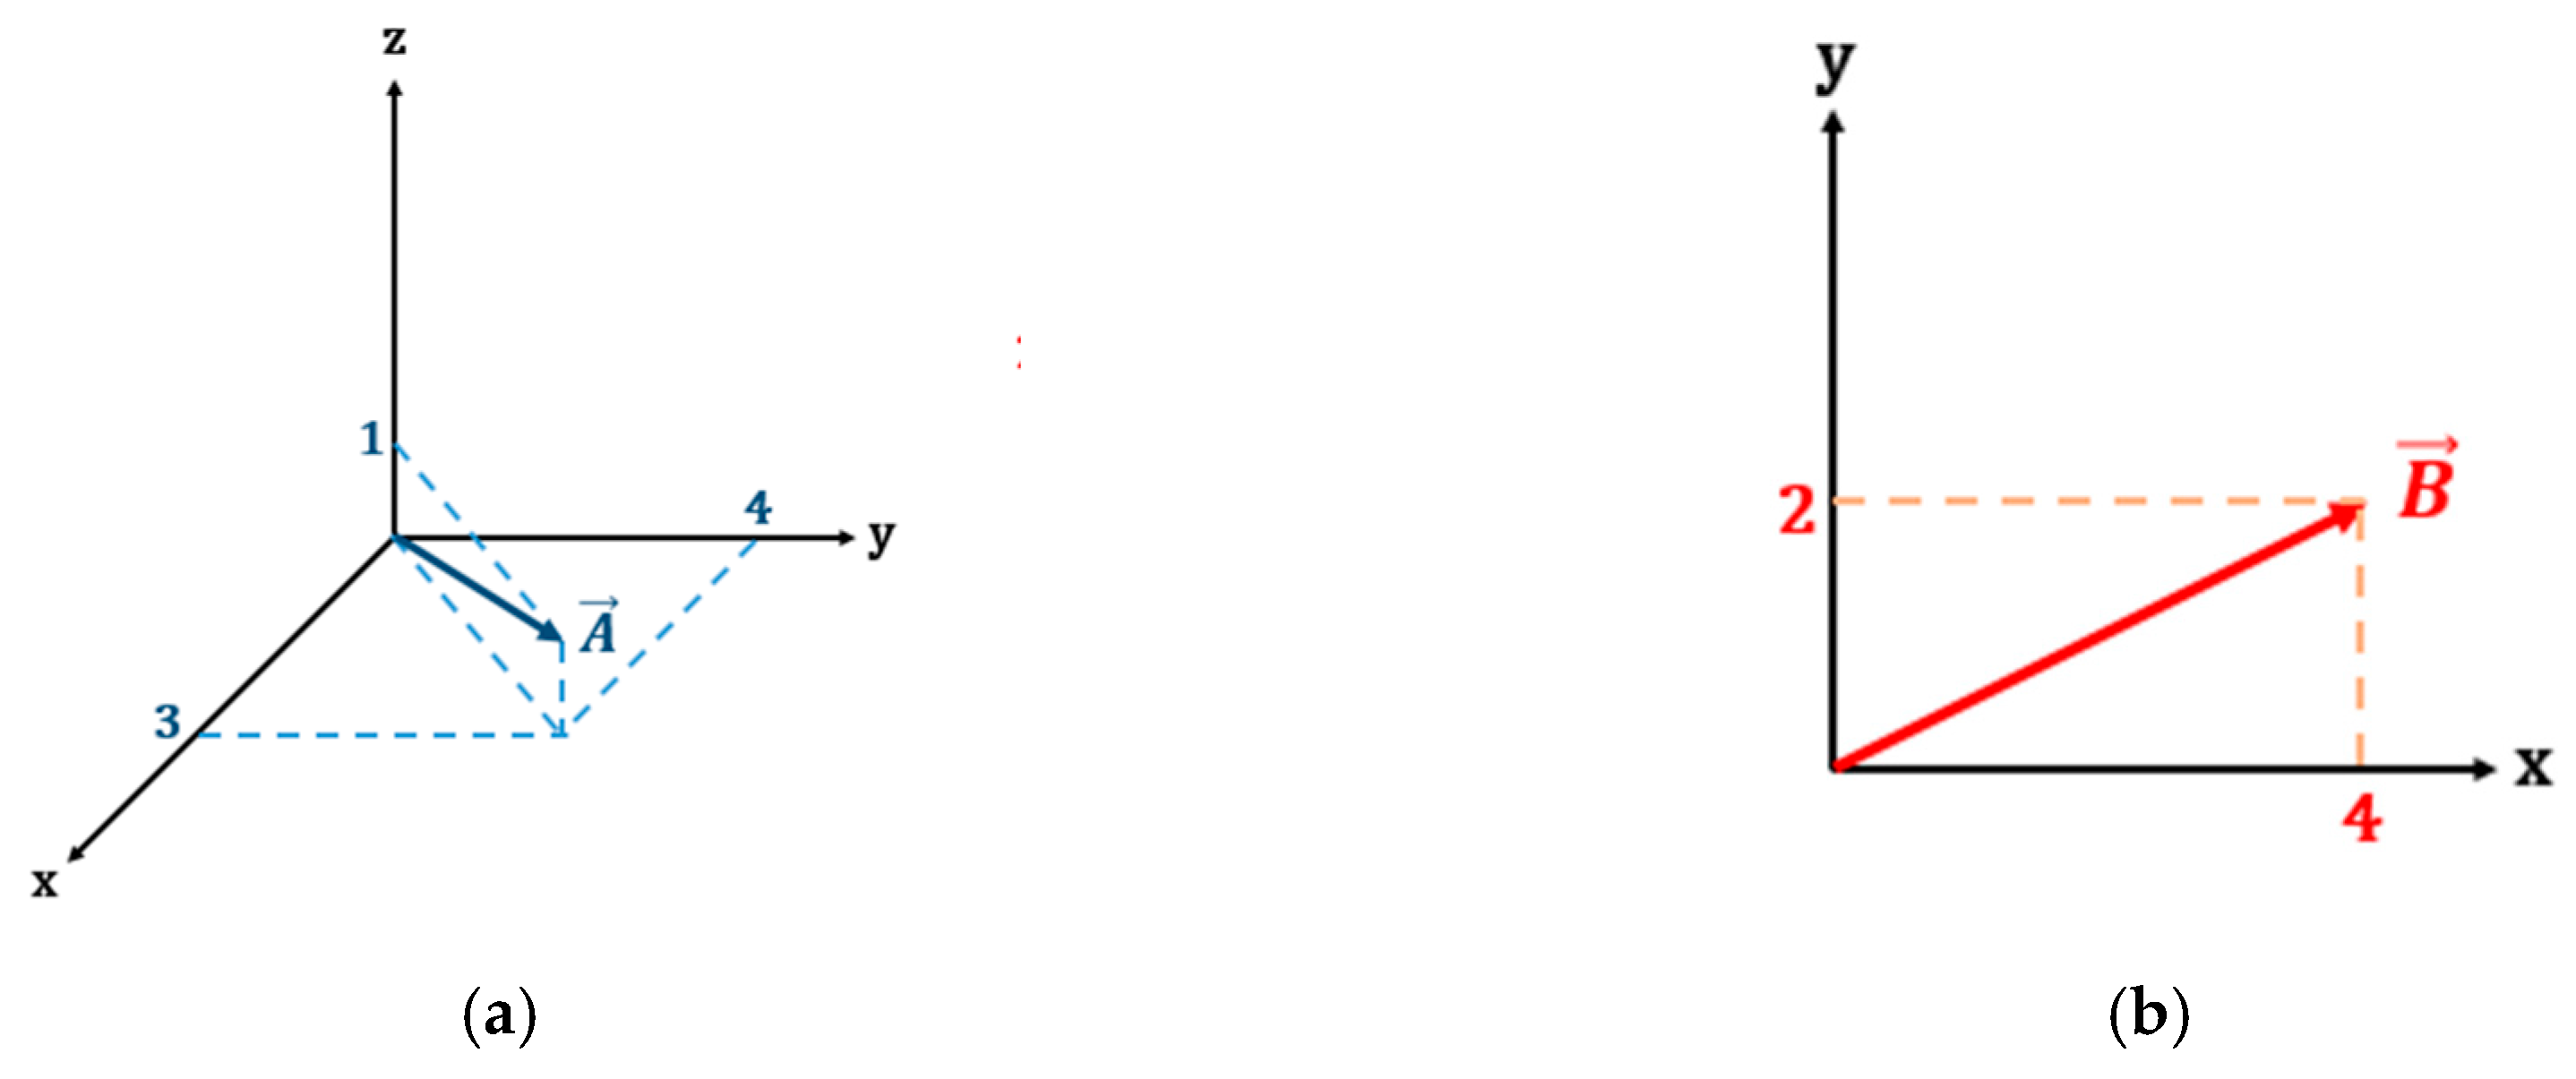
Figure 2. An illustration of the slice and pad procedures are as follows: Assume that there are two diagonal matrix SVD results, both of which will be compared (i.e., matrix A and matrix B), where matrix A is three-dimensional and matrix B is two-dimensional.
Shown in
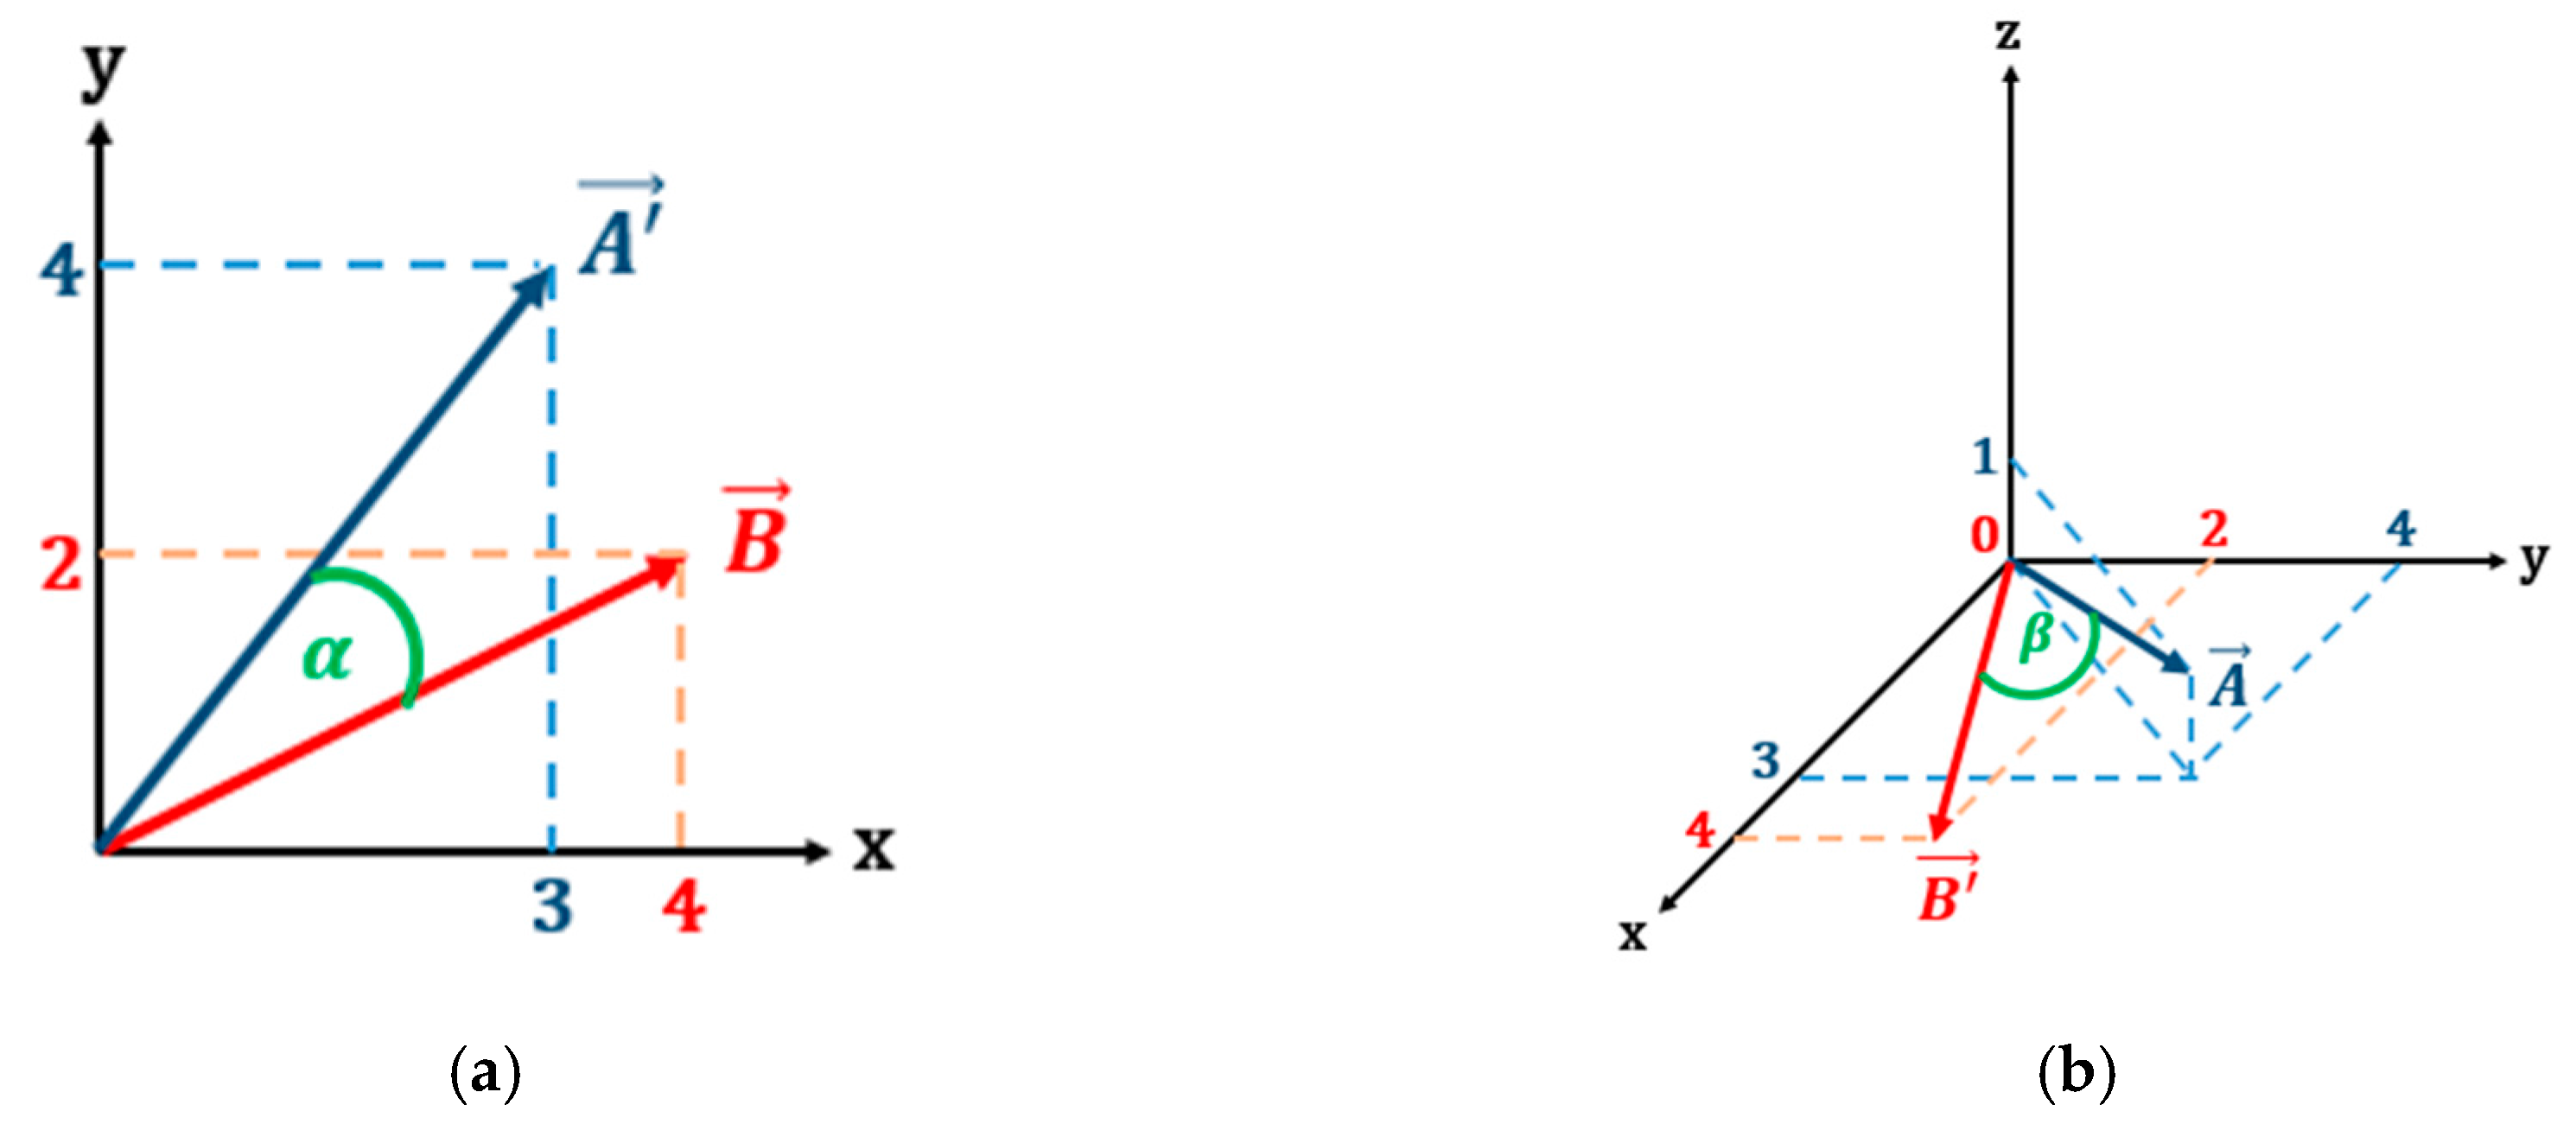
Figure 3, the angle between the two vectors cannot be calculated due because they are in difference dimensional spaces. Therefore, the dimension of there two vectors must be aligned. The slice procedure projects the higher dimension vector to the lower one. As a result, matrix A becomes
The pad procedure transforms the lower dimension vector into the higher one of course with zero value as the result of its projection into the new axis. Hence, matrix B becomes
After both matrices lie in the same space, the angle between the two diagonal vectors can be calculated. The angles resulting from slice and pad processes are illustrated by
Figure 4.
Angle calculation between two vectors can be easily calculated using dot product of two vectors, taken from (4)
For example, according to (4), the cosine of the slice angle between vector A and B in
Figure 4 is 0.8945, while the cosine of pad angle between them is 0.8771.
3.6. Classification Using LVQ
Weight modification is done using the variable alpha, which is lessened as the training continues, in order to increase the precision of the weight modifications. The weight modification will continue until the stopping criteria are fulfilled. The stopping criteria can be either the number of repetitions (epoch) in the training process or after the alpha drops below a certain number. The update for the variable alpha done for each training iteration follows (5); because the value of
n < 1, the alpha lessens after each update.
In the testing phase, LVQ uses the weights obtained in the training phase. The process uses the same algorithm as in the training phase; however, the testing phase stops at the determination of the winning neurons (neurons that have the shortest Euclidean distance with a particular input). The output of this testing phase is the pair of its input with the output neuron (namely, whether there is plagiarism or not). The pseudocode of the LVQ classifier is described in Algorithm 1.
| Algorithm 1 Learning Vector Quantization Algorithm |
Training Phase:
1. Initialize weights wij
2. Define: epoch_max, α_min
3. If ((epoch < epoch_max) AND (α > α_min))
4. For each vector (xi) dimension k = 1:K
5. For each j dimensional output neuron,
6. Calculate Euclidean distance between input xi to the wij based on (1)
7. end
8. Determine index j that gives the minimum distance Dj
9. If (xi = yi)
10. Update weight according to (2)
11. else
12. Update weight according to (3)
13. end
14. Modify the pace of learning based on (5)
15. end
16. end |
Training Phase:
17. For each vector data (xi) dimension k = 1:K
18. For each j dimensional output neuron,
19. Calculate Euclidean distance between input xi to the wij based on (1)
20. end
21. Determine index j that gives the minimum distance Dj
22. Output: class of data xi is j
23. end |
4. Experiments and Results
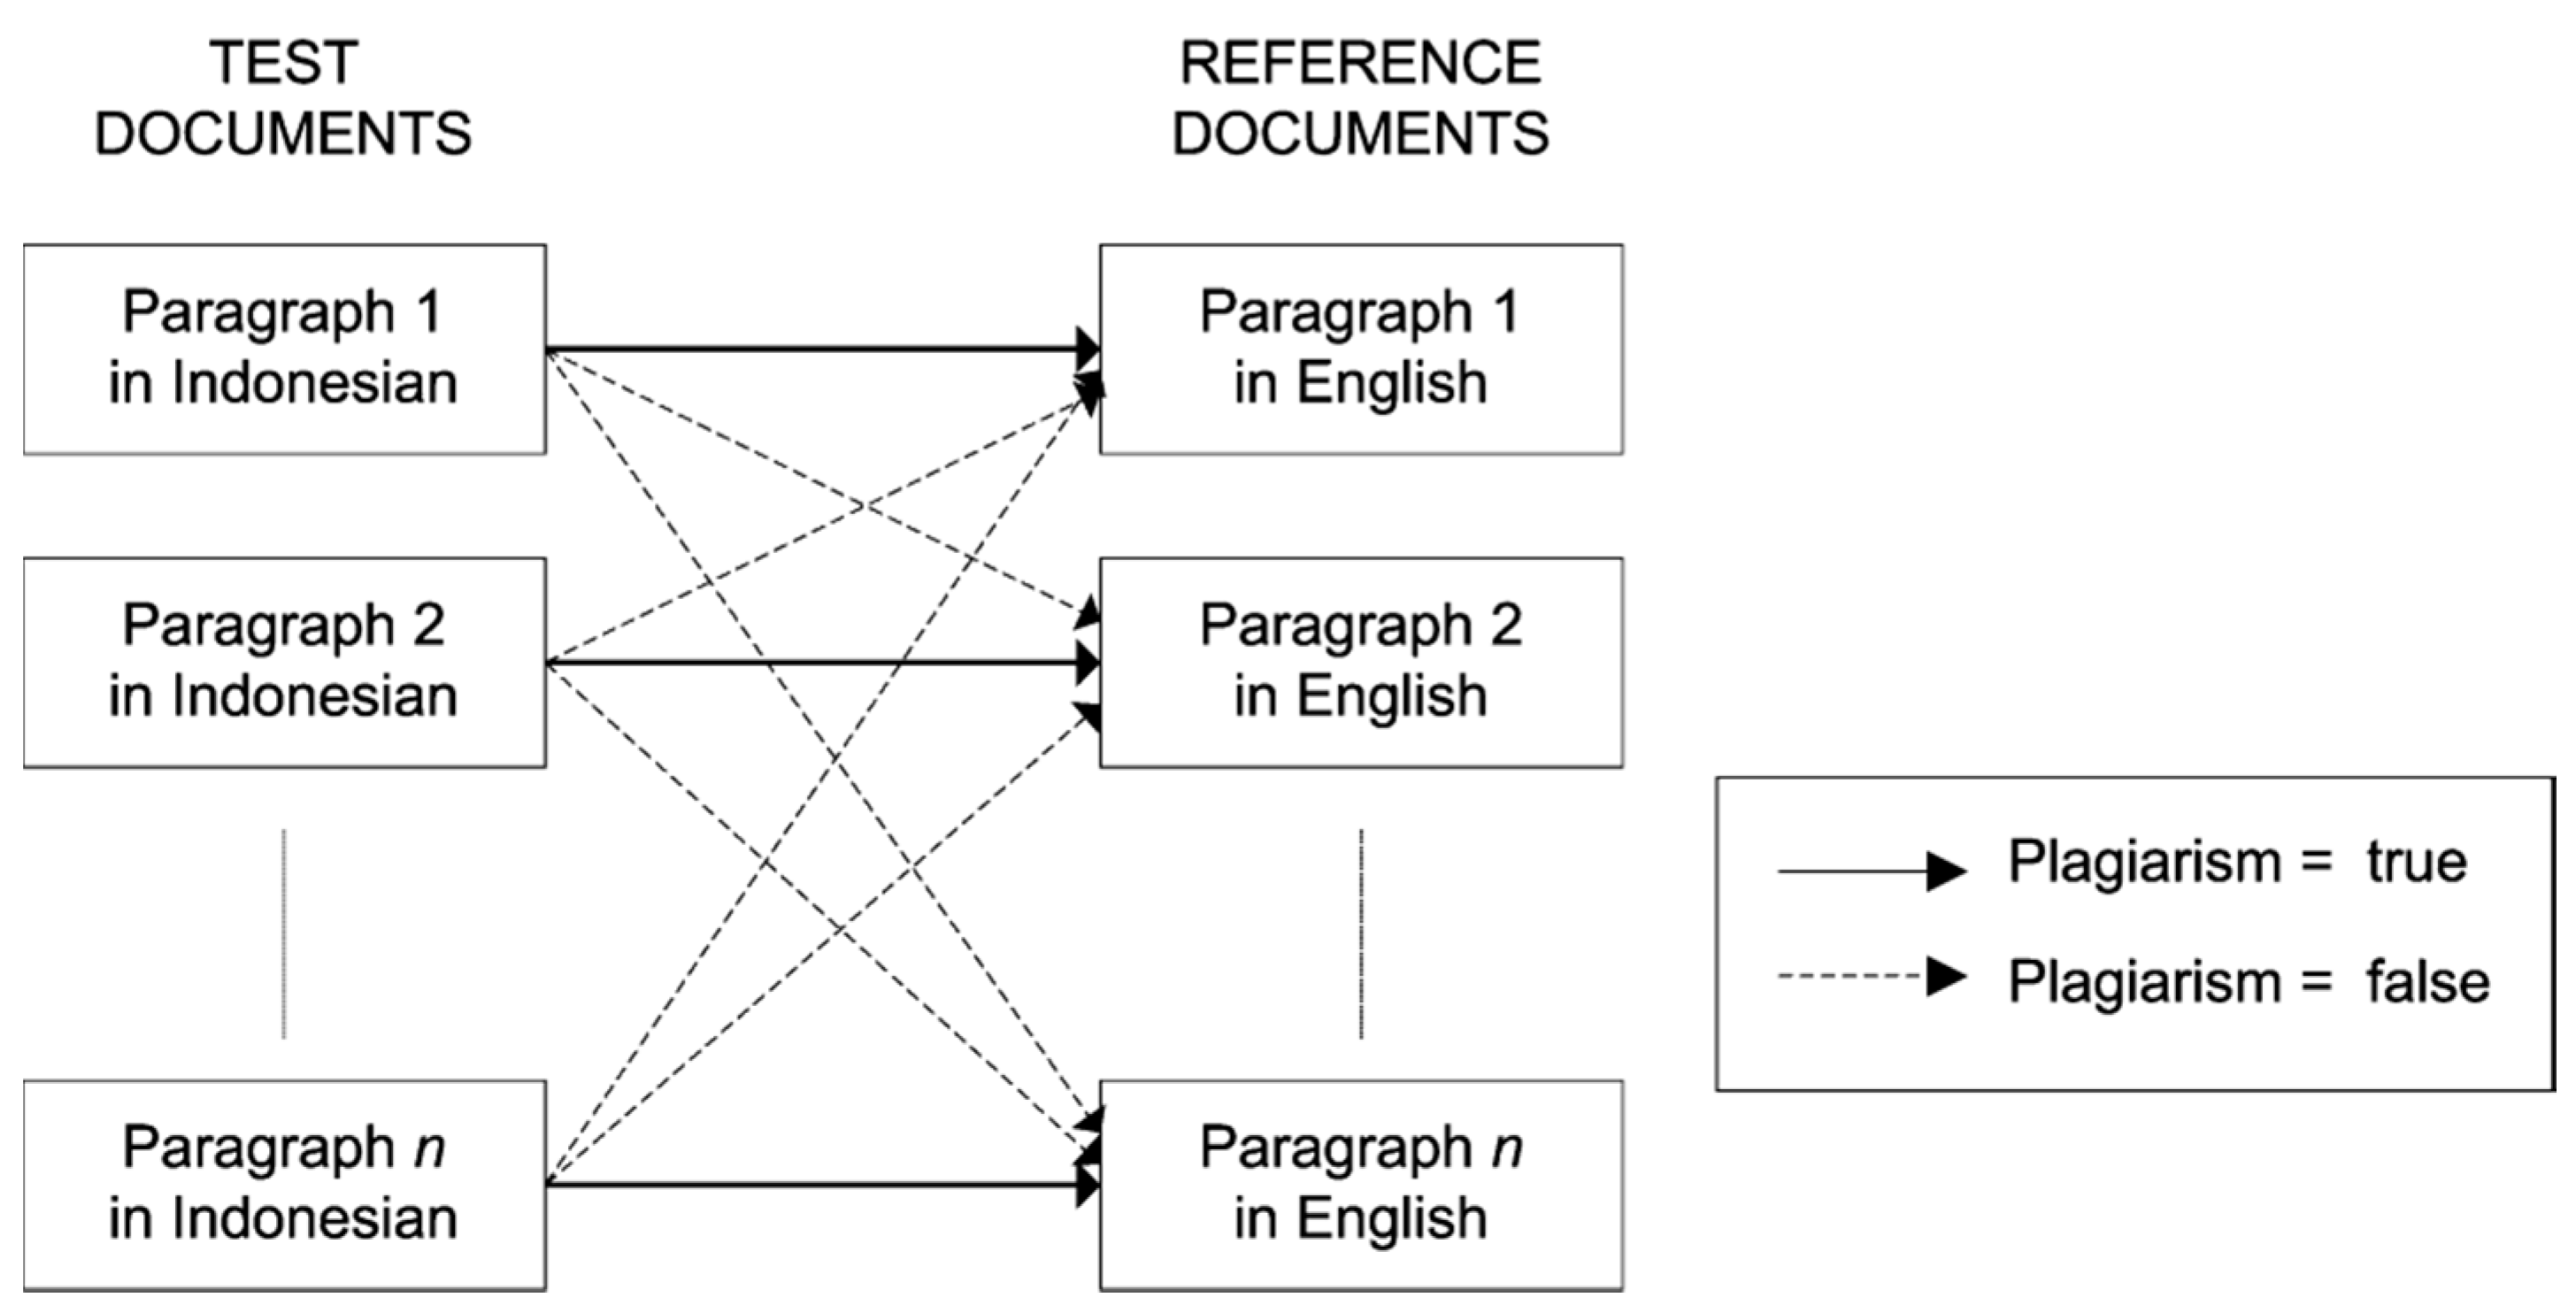
The experiments were carried out with 10 scientific papers written in English, which were used to evaluate the proposed methodology. From these 10 papers, there were a total 184 paragraphs extracted. The original English paragraphs were treated as the “reference documents”. All documents were manually translated into Indonesian using a human translator. The translated documents were used as “test documents”. For each paper, the comparisons were conducted between all pair combinations of paragraphs. For example, paper number 1 consists of 10 paragraphs, paragraph number 1 (translated into Indonesian) was compared to all 10 paragraphs in English. Thus, there should be one pair that indicates plagiarism and nine pairs that indicate no plagiarism; this is illustrated in
Figure 5. Since the papers are taken from different scientific ares, it doest not make sense to perform comparison on different papers. Comparisons are performed only over paragraphs within the same paper. Thus, from the original 10 papers with 184 paragraphs, there were 4050 pairs of paragraph comparisons; 184 were marked as plagiarism, and 3856 of them were marked as not plagiarism.
The plagiarism detection process was conducted using the proposed cross-language detection system illustrated in
Figure 1. In this system, the inputs in the form of test documents and reference documents were pre-processed, and the test documents were translated using a dictionary database. Then, the LSA was performed, and the features extracted were the Frobenius norm, the angle of two vectors with slice, and the angle of two vectors with pad. The classification was conducted using LVQ.
Table 1 provides an example of three feature values extracted after the LSA process, namely Fnorm, α_slice, and α_pad for test documents 3001 and 3002 compared to reference documents 3001–3002.
The evaluation of the proposed cross-language automated plagiarism detection system was conducted by a comparison with the manual/human evaluation, which was presented in three values of accuracy. These three values were precision, recall, and F-measure. They were then analyzed and used to draw conclusions.
4.1. Comparison of Various Learning Rate Parameters for LVQ
In accordance with the theory in LVQ for classification, the value of alpha and
n both have the same function, which is to speed up the learning process; the experiment over the variation of these two variables is conducted together with the same sequence respectively. By using the default values, which are α = 1 and
n = 5, the variation is applied by multiplying both parameters with values of 10
−1, 10
−2 and 10
−3. Thus, there are three variations in the experiment, which are: (1) α = 0.1 and
n = 0.5, (2) α = 0.01 and
n = 0.05 and (3) α = 0.001 and
n = 0.005. The result of this experiment is presented in
Table 2 and the corresponding graph in
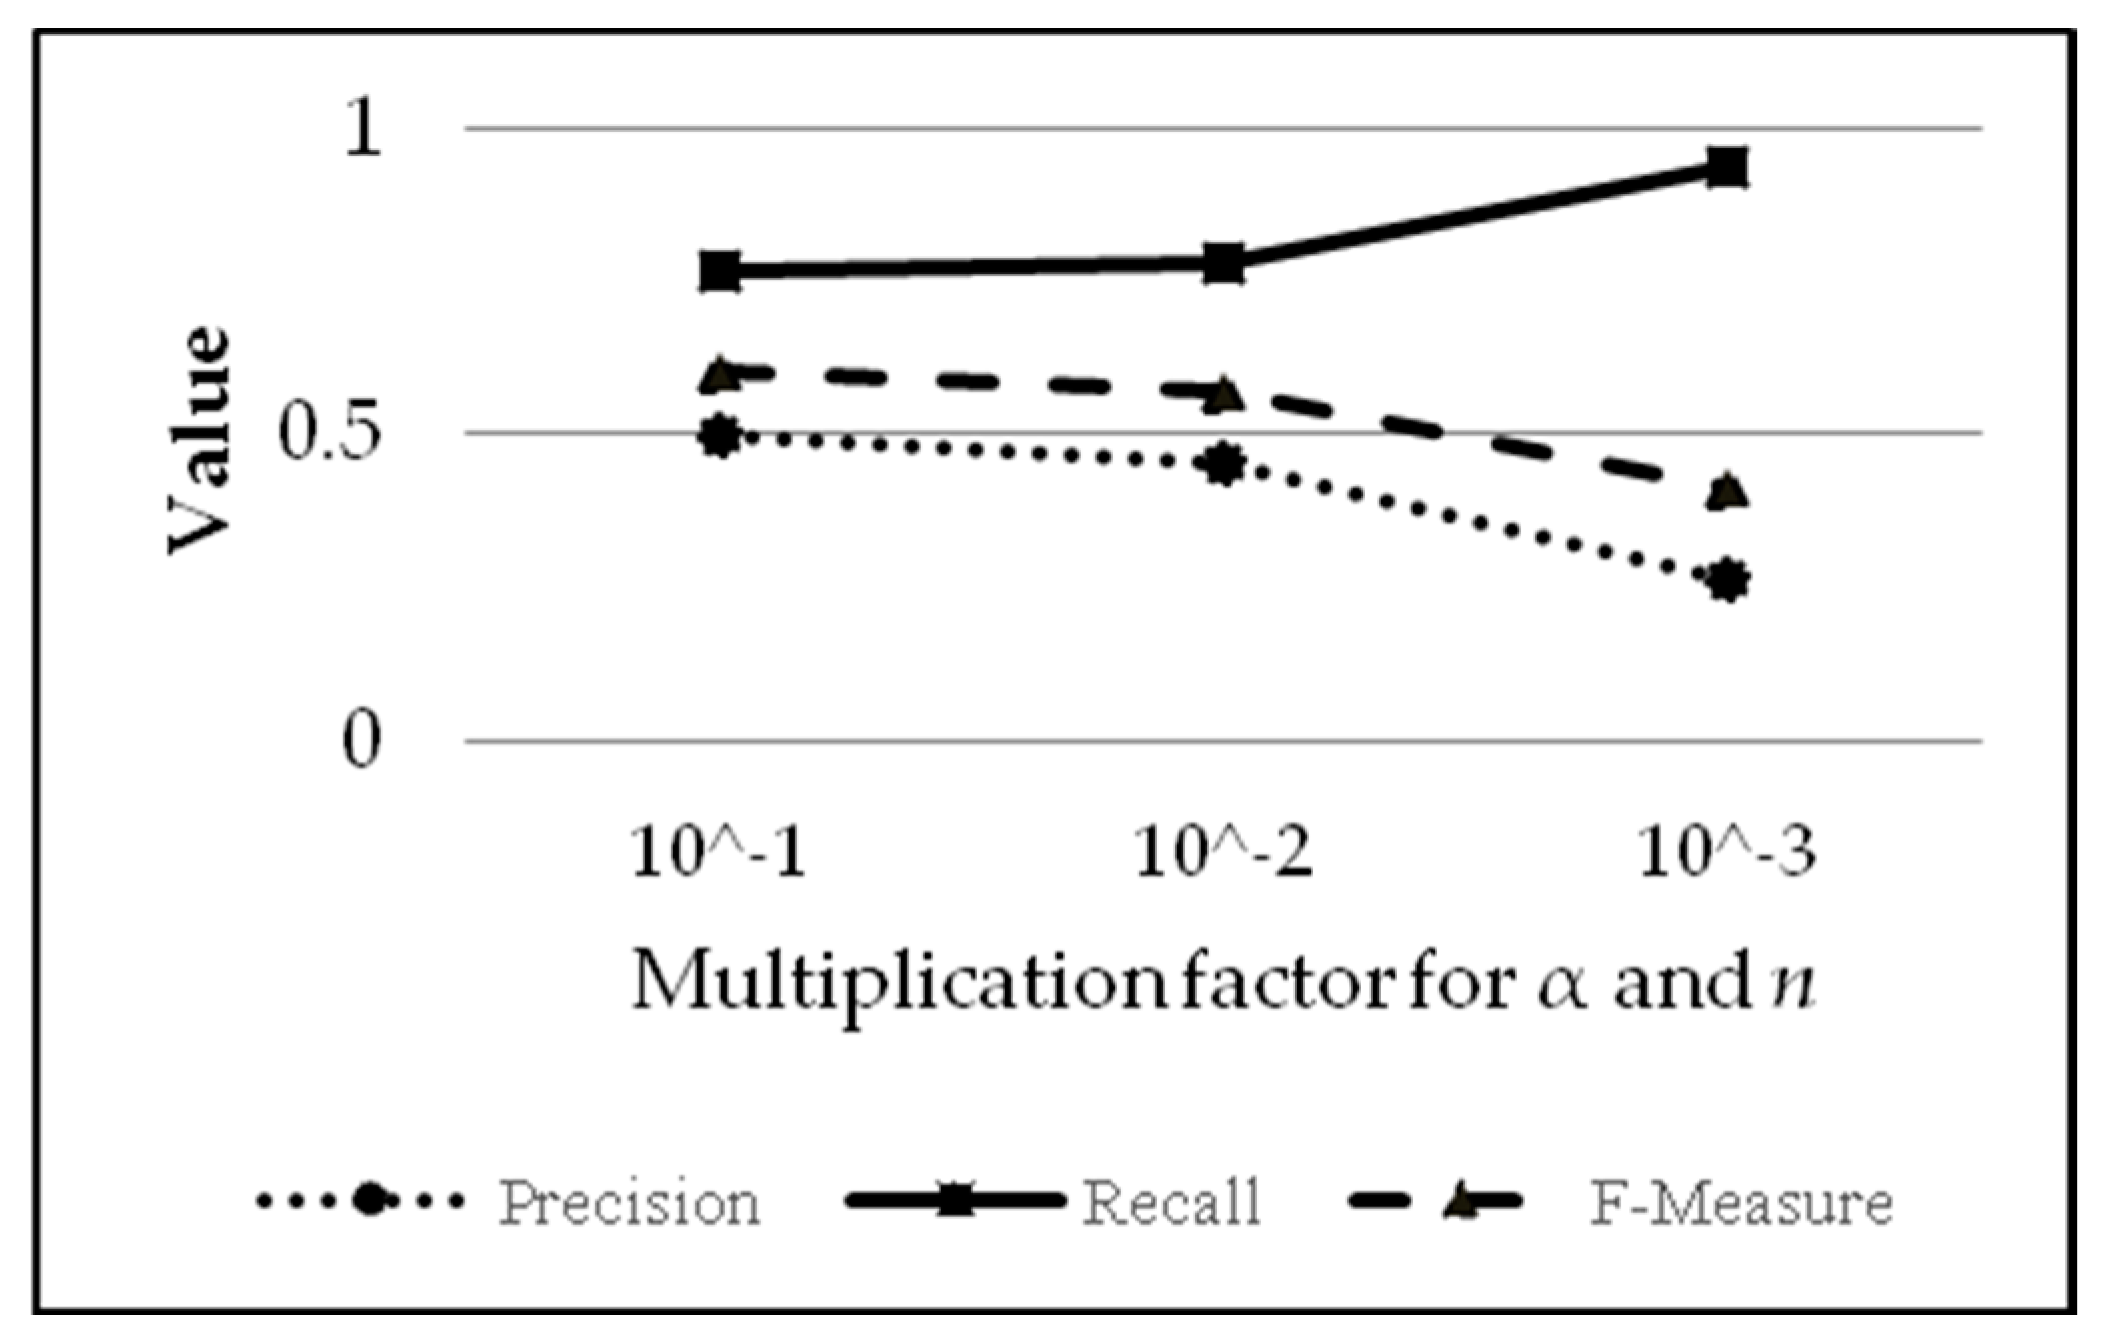
Figure 6.
Based on
Table 2 (the results of which are depicted in the graph in
Figure 6), it can be concluded that the values of alpha and
n are directly proportional to precision (increasing alpha and
n means increasing precision), but the values of alpha and
n are inversely proportional to recall (increasing alpha and
n means decreasing recall). F-measure increases with the increase of alpha and
n.
Figure 6 also shows that a higher alpha value means fewer false positives (due to fewer positives) but also fewer true positives (due to more positives being judged as negative). The analysis related to the variation results of variable alpha and
n can be explained as follows: increasing the values of alpha and
n will increase the iterations needed for alpha to surpass the limit value to stop the learning process. More iterations mean more corrections to weights in the algorithm. Moreover, the data used for training are from all 10 papers, with many more “not/negative” values than “plagiarism/positive” (194 for positives and 3856 for false negatives; yield ratio of 1:19.876), causing the algorithm to learn to recognize negative results (not indicated as plagiarism) rather than positive results (indicated as plagiarism). For comparison, if the values of alpha and
n are, respectively, 0.1 and 0.5, the training iteration will take place 24 times; whereas if alpha and
n are, respectively, 0.01 and 0.05, the training iteration only occurs five times. For alpha and
n with values of 0.001 and 0.005, the training iteration occurs only three times. In addition, according to Equations (2) and (3), small values of alpha and
n means that there is not much difference in weight after each correction. Hence, the training results in weights that are similar to the initial weight, which came from the first and second entries of the input. There are not enough data to learn whether a text should be labelled as ‘not/negative’ (not indicated as plagiarism). This explains why, for example, smaller values for alpha and
n mean fewer negative values and low score precision (too many false positives).
4.2. Comparison of the Feature Types of the LSA
To find the best feature type after the LSA process, this study focused on comparing three types of feature values, namely the Frobenius norm (
f), Cos α with slice (
s), Cos α with pad (
p), and a combination of them. The results of this experiment are shown in
Table 3.
Table 3 shows the test results using various combinations of the Frobenius norm (
f), Cos α with slice (
s), and Cos α with pad (
p) as the feature. The combination of the feature value was accomplished using the AND operation. From this experiment, it can be seen that the combination of two or more feature values is better than using a single feature value. Moreover, the combination of all three feature values provides the highest results of precision, recall and F-measure. The combination of the Frobenius norm with Cos α and with either slice or pad also provides a comparable result. In contrast, using the combination of Cos α with slice and Cos α with pad provides a very low accuracy. This result implies that both the Frobenius norm value and Cos α are important features in the LSA-based, cross-language automated plagiarism detection system; however, using a single feature will significantly reduce the accuracy.
4.3. Comparison of the Term–Document Matrix Definition
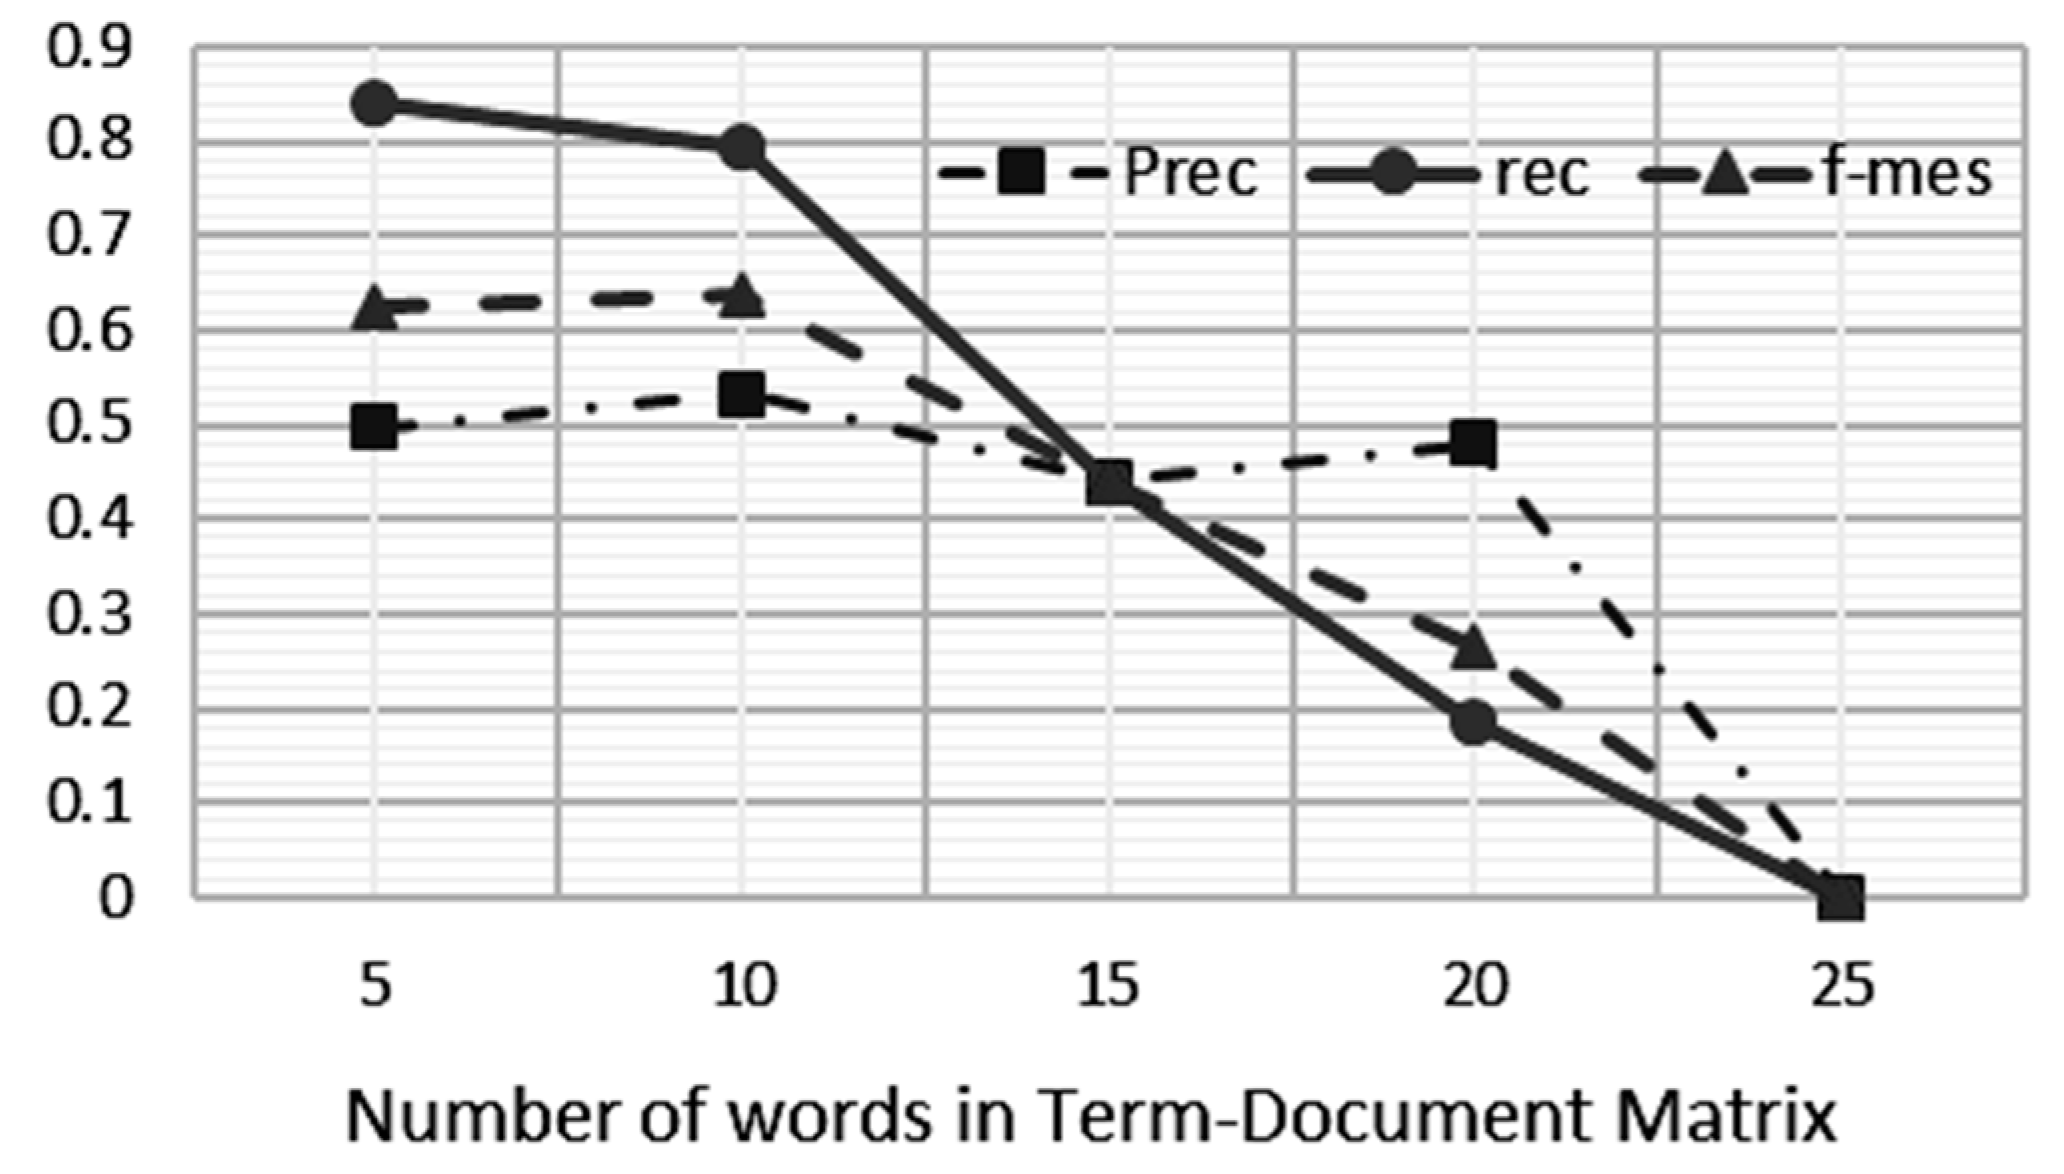
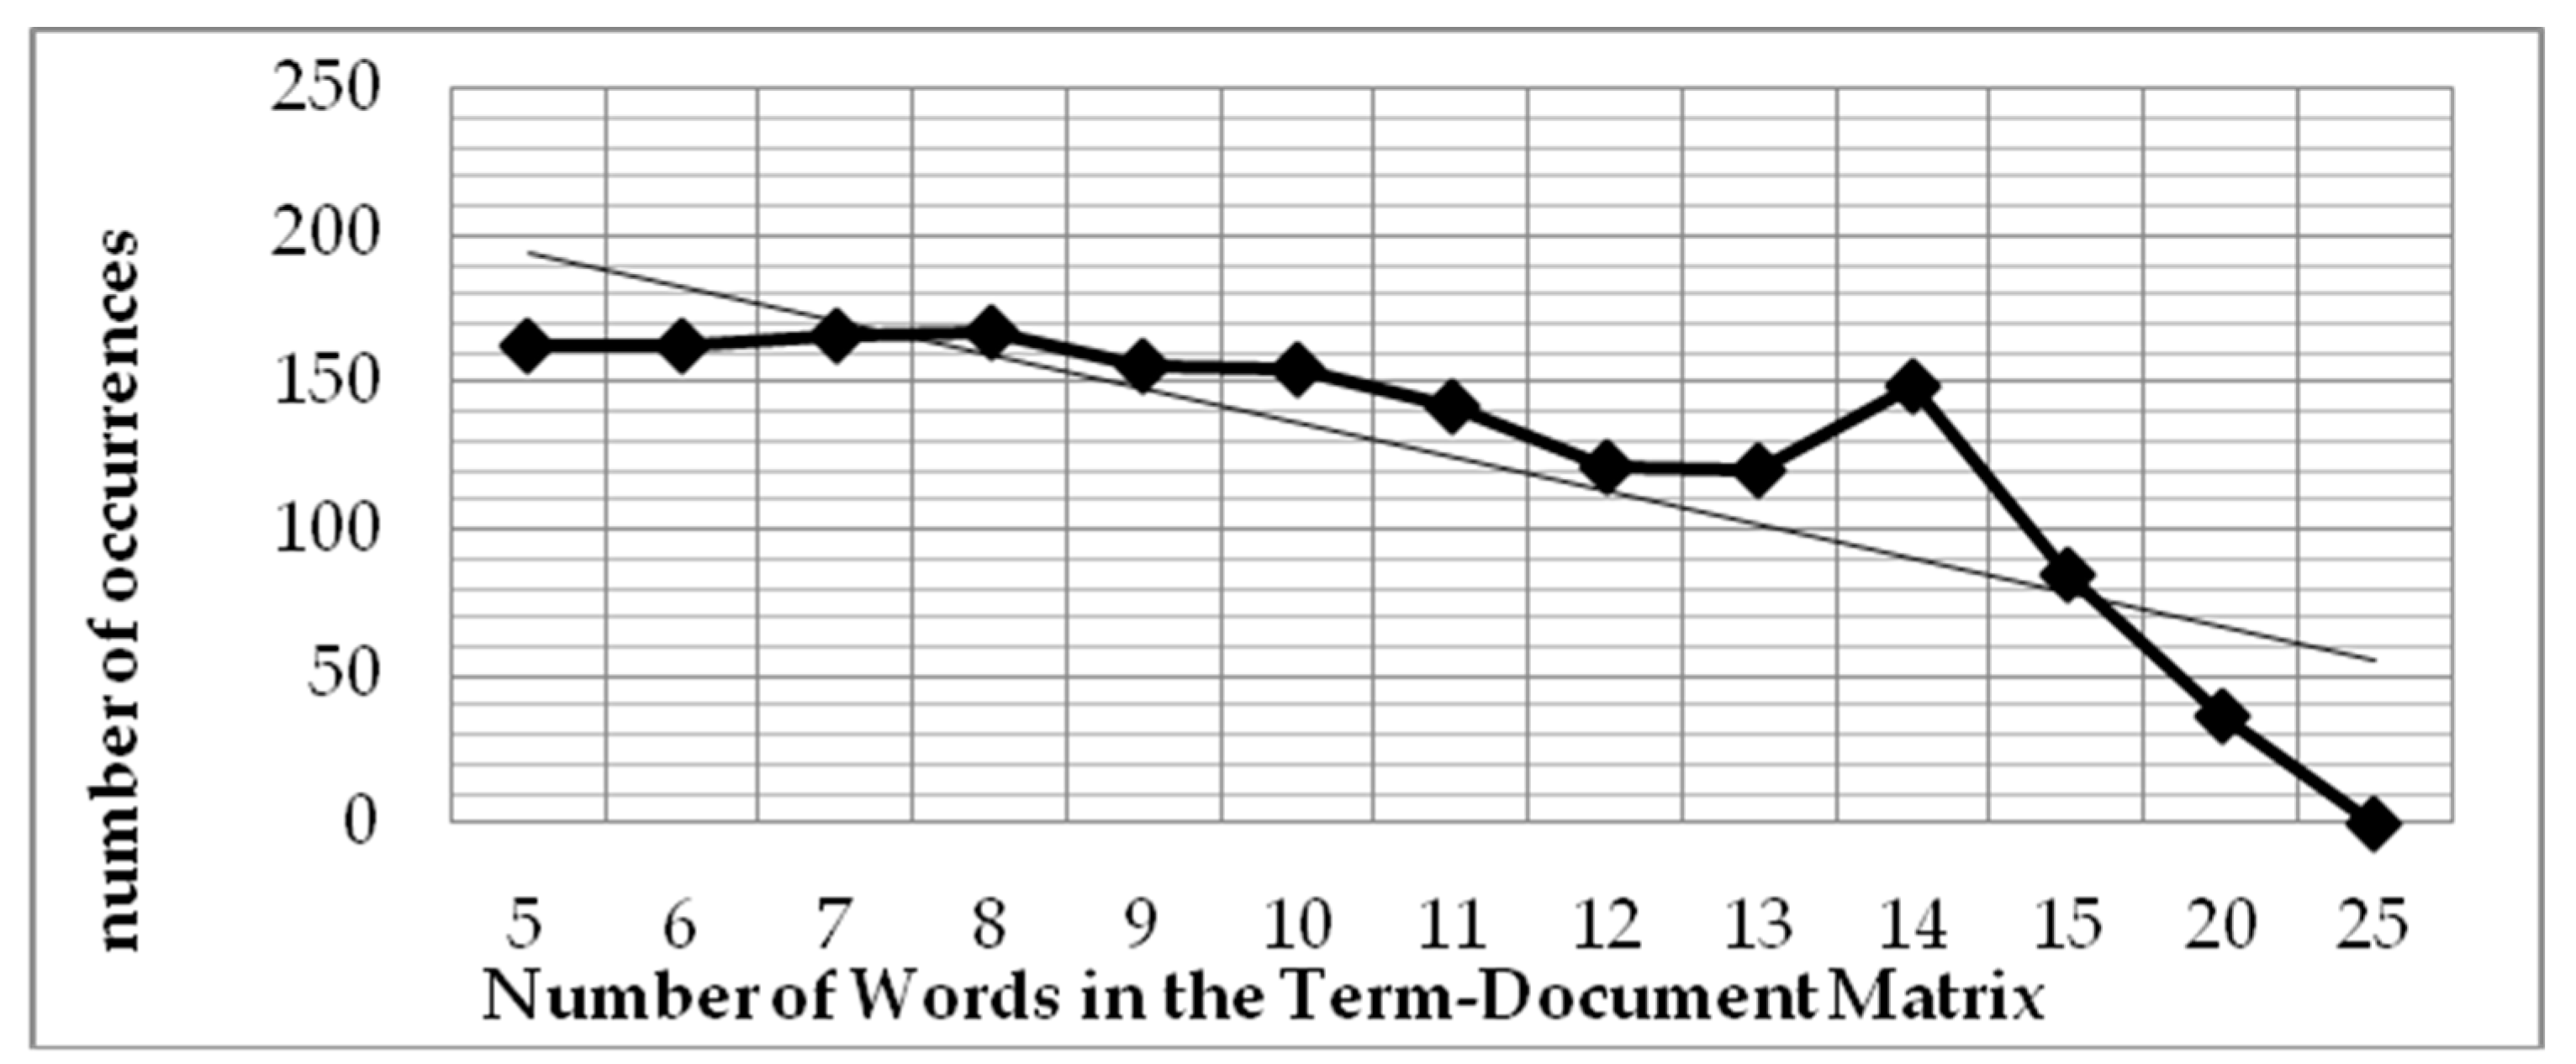
In this work, we investigate the optimum number of term–document matrix definitions, which is the optimum number of words to be defined in one document to allow deterministic resource allocation to be applied onto the algorithm for the sake of processing performance. A document can be defined as a sentence, a paragraph, or a fixed number of words in a sequence. In the developed system, we defined the term–document matrix based on a fixed number of words in a sequence; in this experiment, we varied the number of words to 5, 6, 7, 8, 9, 10, 11, 12, 13, 14, 15, 20, and 25 words. The results of this experiment can be seen in
Figure 7 and
Figure 8.
Figure 7 shows the impact of decreasing the values of precision, recall and F-measure on increasing the number of words used in the term–document matrix. According to the human rater’s assessment, the number of words in the document that should be declared plagiarism is 192 out of 4050 words. This means that there are 3858 words that are not considered plagiarism. The system became less effective in detecting plagiarism when the term–document matrix increased. A bigger term–document matrix size will suppress the number of false positives and false negatives, but the weight of the harmonic precision and recall is reduced. Thus, the LSA precision and relevance of LSA as well as the accuracy of the detection tend to be worse when the size is larger.
4.4. Comparison of Frequency and Binary Occurrence in the Term–Document Matrix Definition
All of the previous experiments were performed using the binary method. The same set of samples were also used to perform experiments using the frequency method. The difference between them lies in the values used in the term–document matrix formation. The binary method uses the values of 1 and 0 to indicate the existence or absence of words in the document, while the frequency method uses the word count of the document. The results of term–document matrix using the binary method are depicted in
Table 4; using the frequency method is depicted in
Table 5.
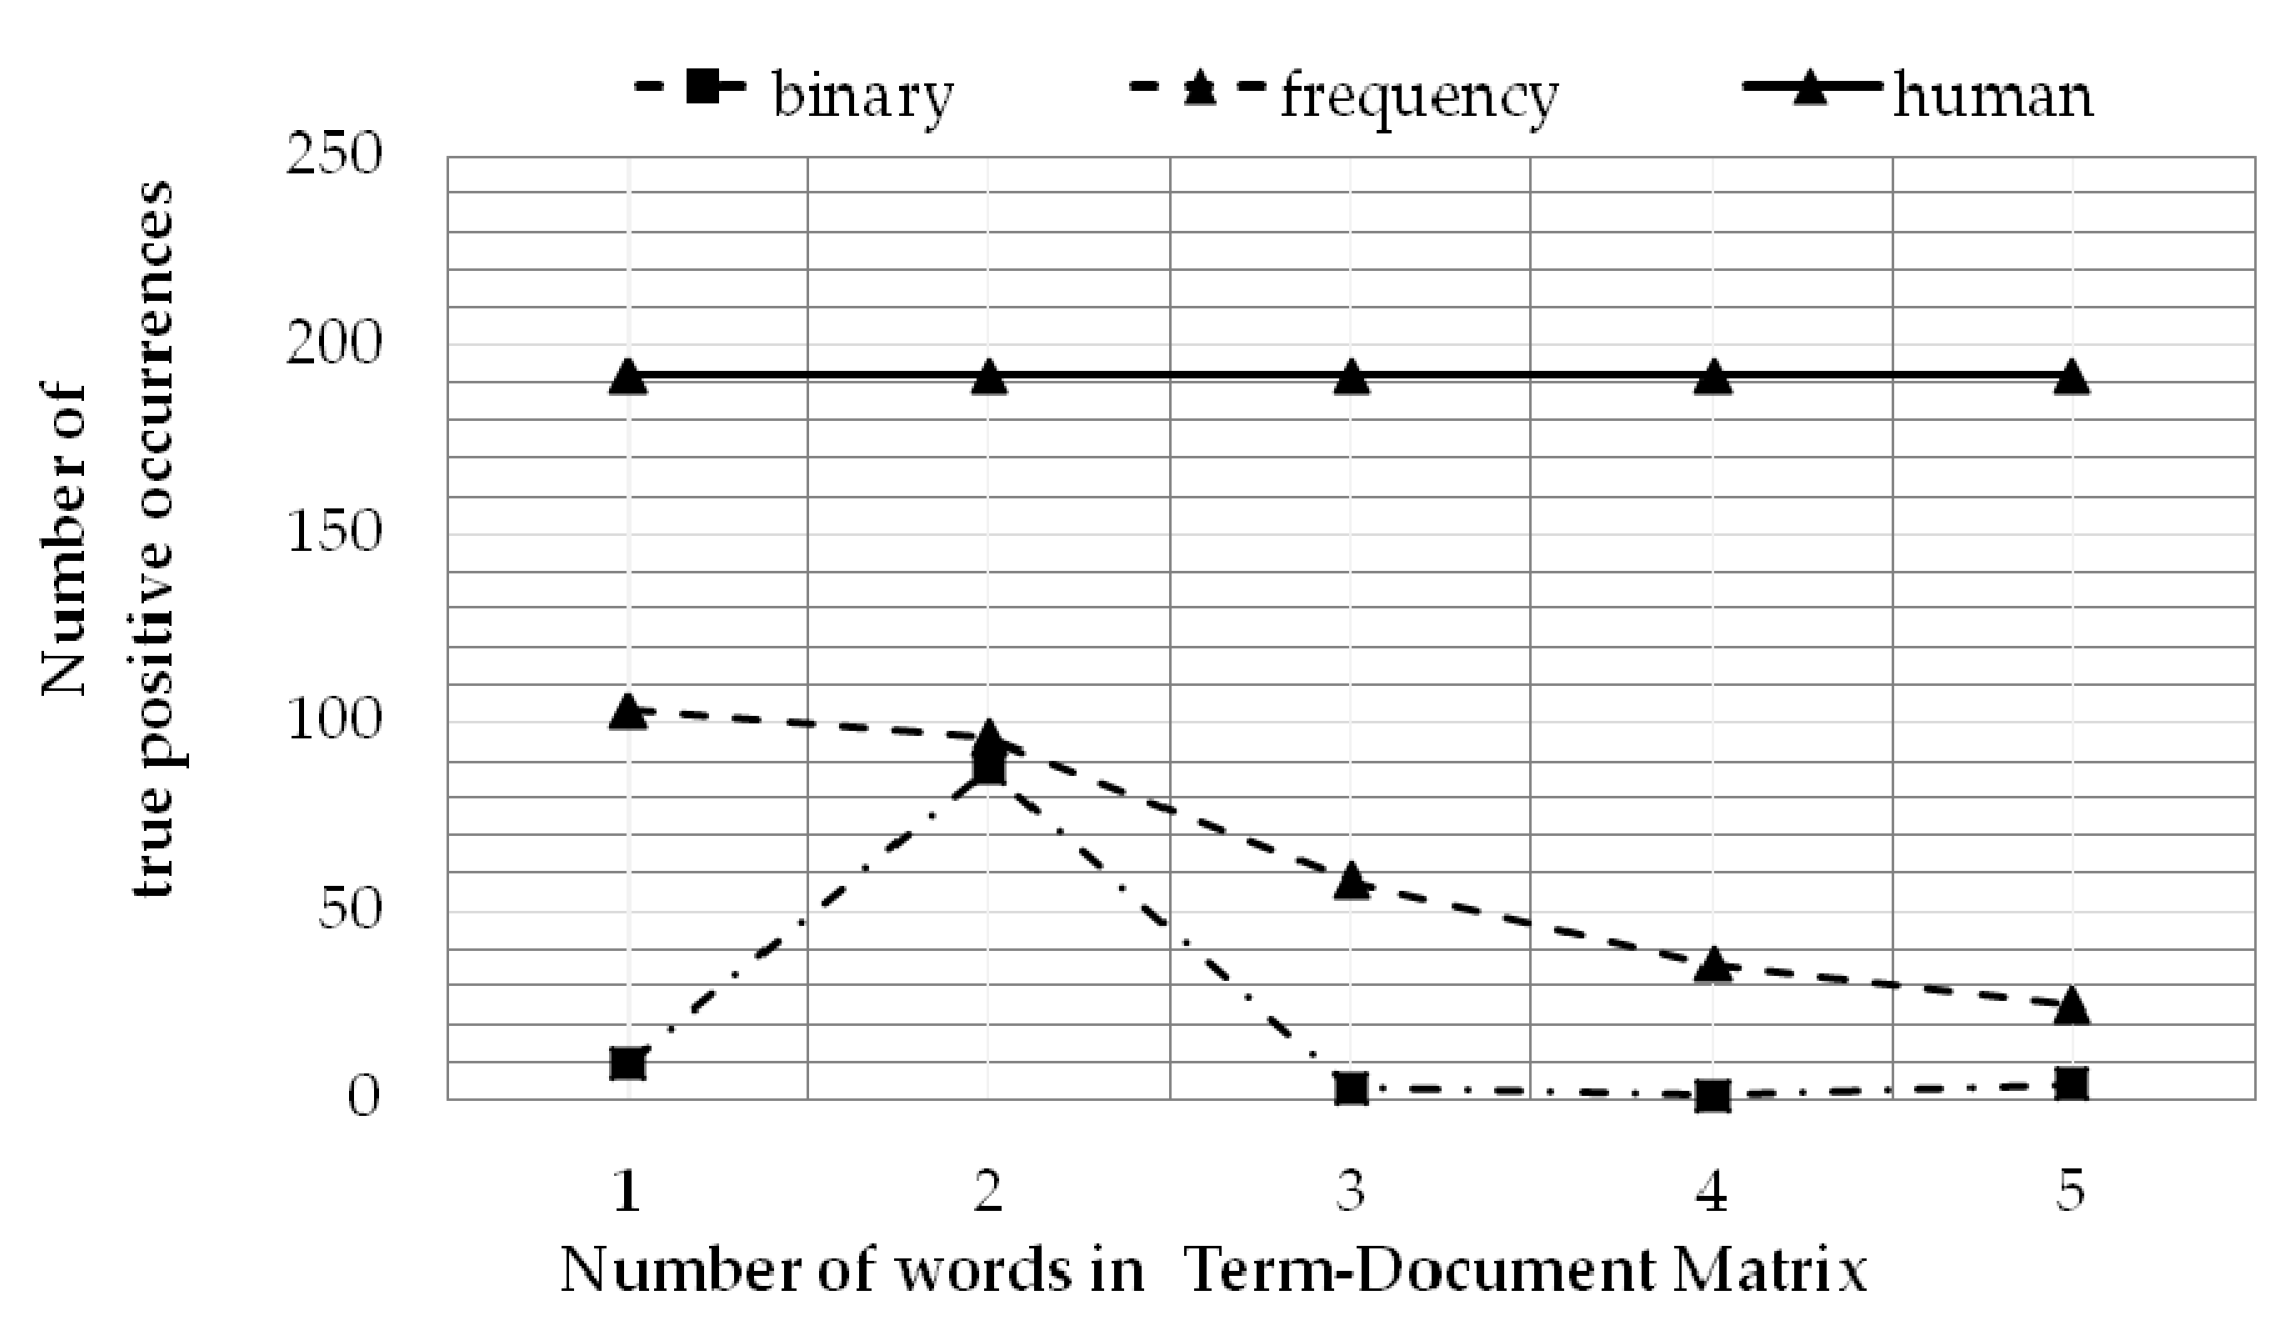
Compared with the binary occurrence in the term–document matrix definition, the frequency-based occurrence improved the accuracy by about 10% for precision, recall, and F-measure. The true positive value (88) in binary was slightly lower than the frequency method (103). Nevertheless, the most beneficiary fact in favoring the frequency method is that all the false detection values in binary method are much greater than the frequency method. Since the binary method only detects the presence or absence of the word in a paragraph, it is more prone to mistakes compared to detecting plagiarism based on the frequency of words in a paragraph.
The overall comparison of the human rater, binary method, and frequency method can be seen in
Figure 9. As expected, there are significant differences between the binary method and the frequency method in all term–document matrix sizes as well as in the best value obtained by both. Moreover, based on
Table 4 and
Table 5, the binary method performance is definitely worse than the frequency method in precision, recall and F-measure. These results led to the conclusion that representing the term–document matrix in frequency brought a significant improvement to the system’s accuracy.
5. Discussion
One of the greatest drawbacks to this system is the lack of a good translation dictionary; thus, a paragraph that should be judged as plagiarism is perceived differently after the translation process is executed. In order to improve translation quality, a better translation dictionary is needed—for example, using a licensed or paid Application Programming Interface (API), which has better standards and is able to perform a better translation process.
Development of the system can also be done by doing double evaluation. Double evaluation involves evaluating the tested paragraph compared to the reference paragraph and evaluating it again by rendering the reference paragraph as a tested paragraph and evaluating the tested paragraph as a reference paragraph. The indication of plagiarism can be determined if and only if both the results are indicated to be a plagiarism occurrence. It has been shown that this method increases the accuracy significantly (up to 85% for F-measure). However, to be able to do the double evaluation, an excellent translation dictionary is needed; this is because it is also necessary to translate the reference paragraph to Indonesian and the tested paragraph to English.
One possible further development is to more extensively examine the statistical properties of the data, providing the possibility of testing with other statistical methods. The development can be done by examining the data returned from the result of the plagiarism detection system—for example, by using the Jarque–Bera test, which tests the skewness and kurtosis of the data.
6. Conclusions
In conclusion, a decrease in the values of alpha and n positively impacts the relevance (recall) of the system, but it negatively impacts the precision of the system. Overall, the decline in the values of alpha and n negatively impacts the accuracy of the program plagiarism detection system, which is based on the LVQ algorithm. The LSA method can be used to assess similarities between two texts by comparing the length and calculating the angle between both matrices that result from the LSA operation. Both the Frobenius norm and angle (Cos α) are needed as the detection features after the LSA process. By using an appropriate combination of methods and parameters, the system achived the accuracy up to 65.98%. The increase of the term–document matrix size has been shown to result in a negative impact on the accuracy of LSA-based, cross-language plagiarism—even when it involves the Frobenius norm, slice, and pad when using LVQ processing. The best accuracy achieved is 87% with a document size of 6 words, and it reaches 0% (the worst) when it is increased to 25 words. Results on the term–document matrix construction strategy suggested that utilizing the frequency method (as opposed to the binary method) will improve the detection performance. For further system development, a better and standardized translation dictionary is needed to open other possibilities (such as double evaluation) in developing the system.


