3.2. Results of Static Tests
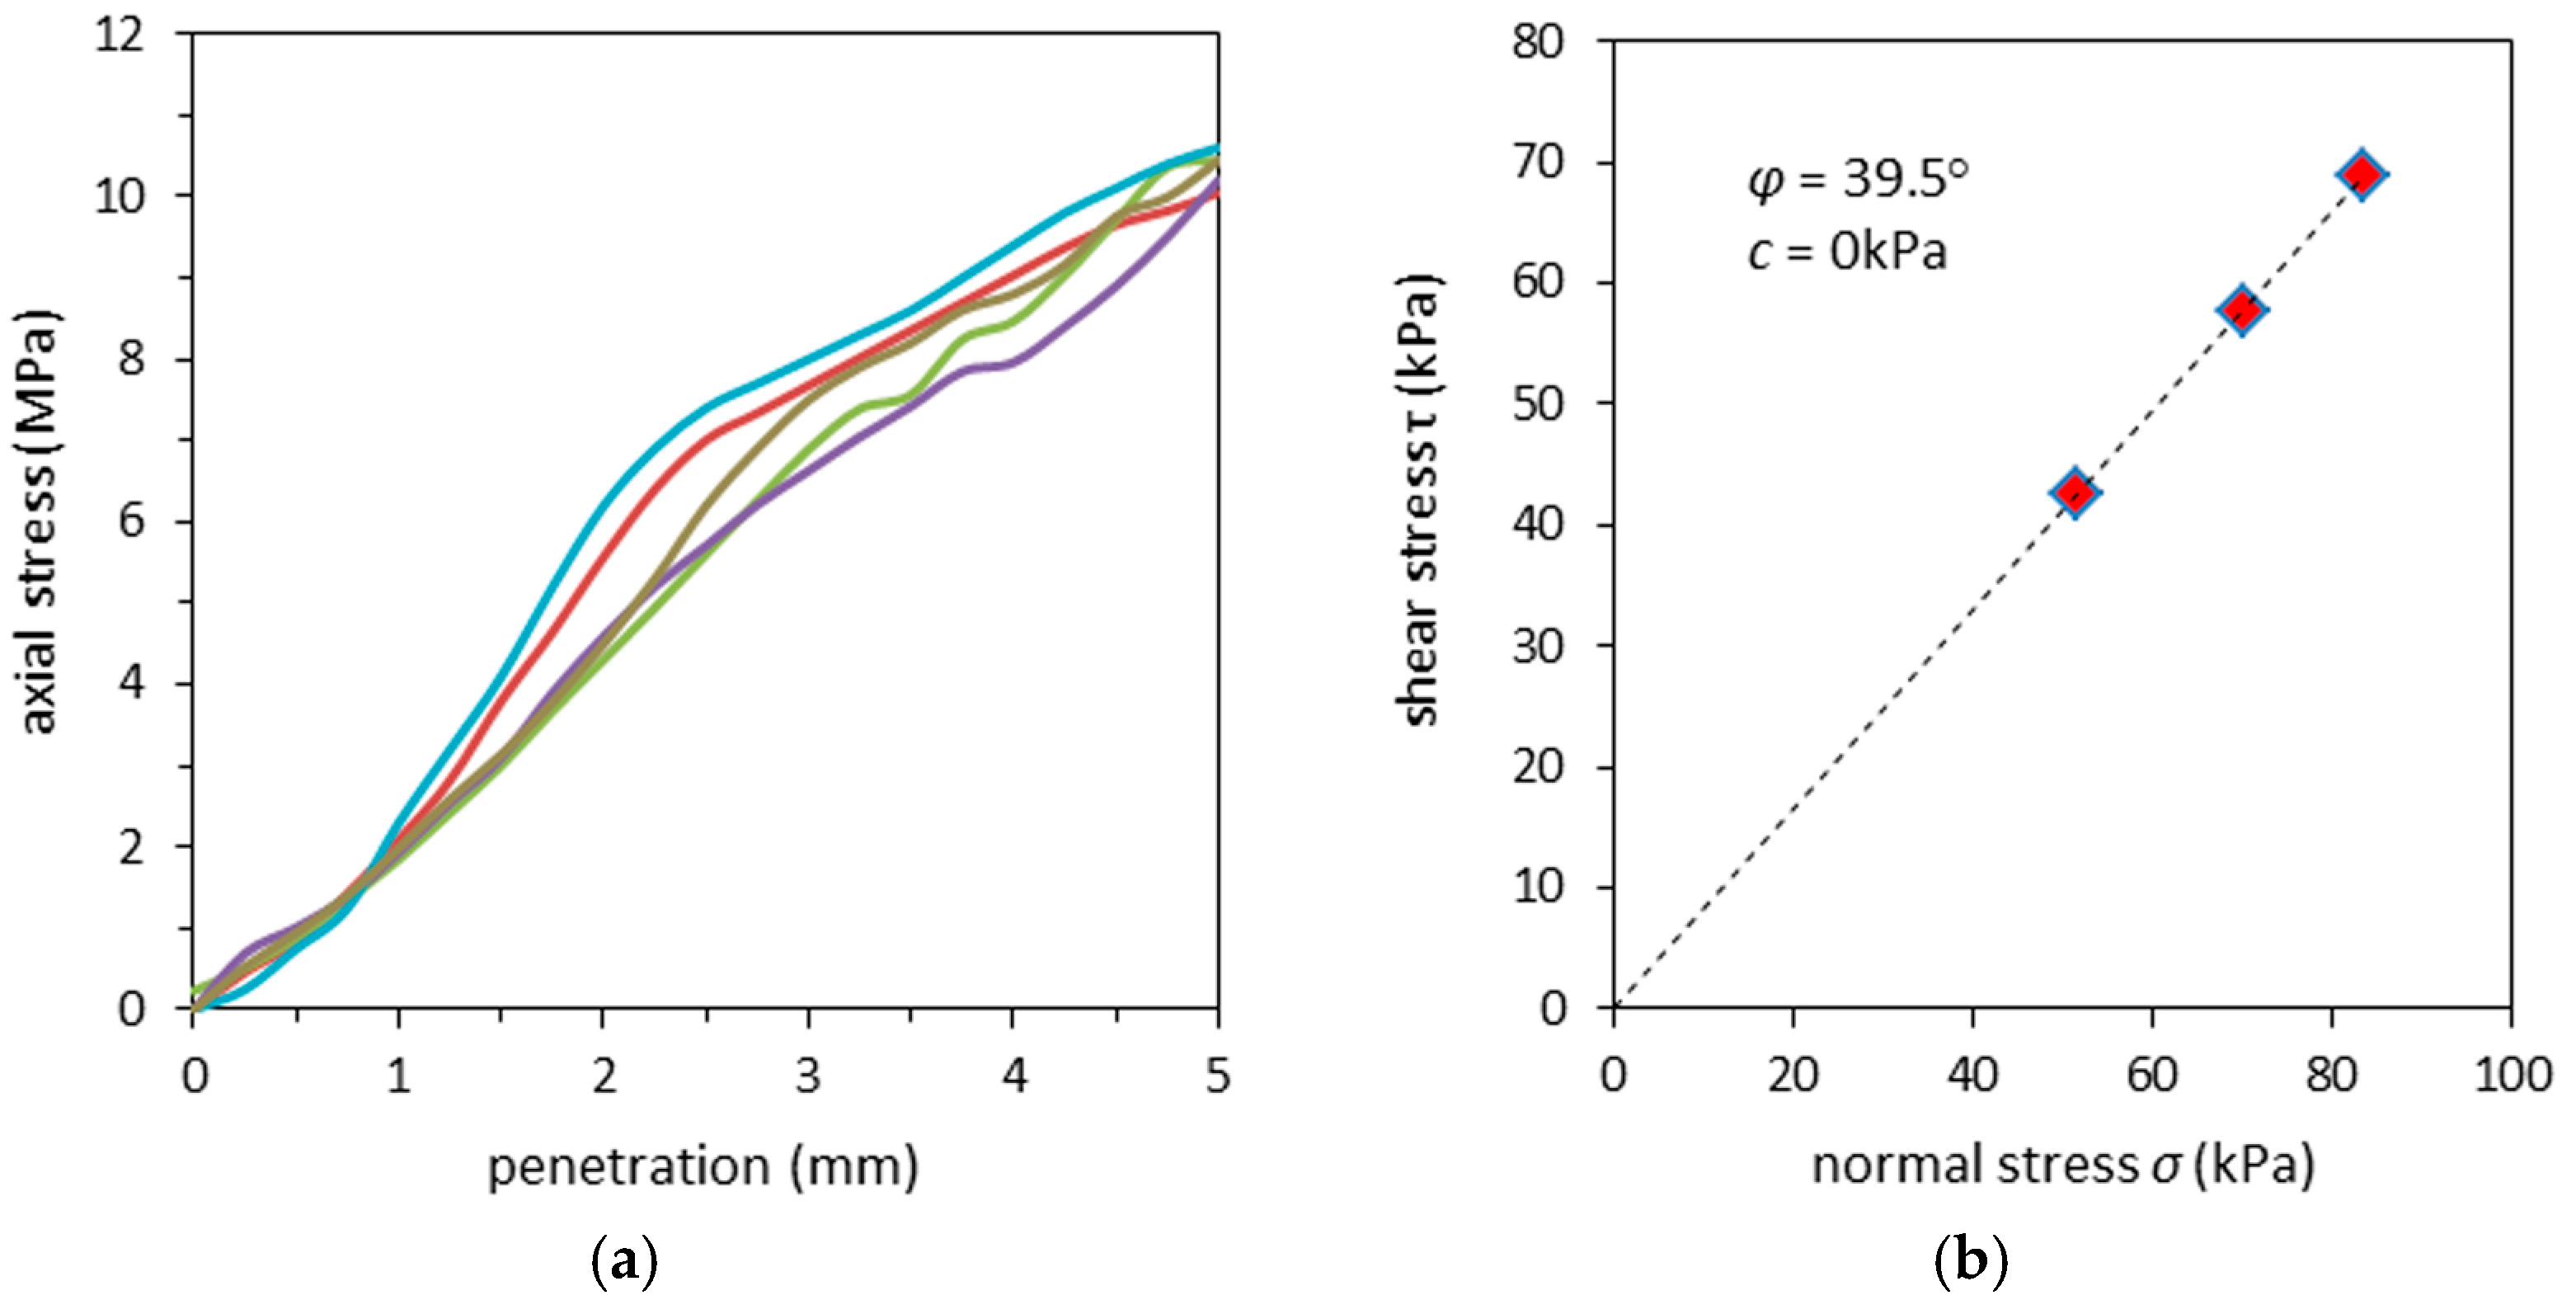
As a material with potential application in pavement engineering, RCAs are expected to have high CBR values. The Polish technical standards for motorways state that the CBR value for subgrade constructed from unbound aggregates should be greater than 80%. The CBR tests performed on the RCA during this study are presented in
Figure 3a. Experiments were carried out in samples with optimal moisture content. Results for plunger penetrations of 2.5 mm and 5 mm were calculated, ranging from 71.7% to 101.5% for 2.5 mm and 91.3% to 100.4% for 5 mm. Such range differences are attributed to grain crushing and a proper contact zone between the plunger and sample surface. Natural sandy gravels are characterized by CBR values equal to 71%, which places the RCA studied here in the lowest result range for subbase material [
31,
35].
The DST test were carried out trice under normal stress conditions of 51.5 kPa, 70.2 kPa and 83.5 kPa. The maximal shear stresses obtained under such conditions were equal to 42.6 kPa, 57.7 kPa and 69.0 kPa, respectively. Results are shown in
Figure 3b. The estimated friction angle
ϕ, obtained from the slope in the graphic (see
Figure 3b), was estimated at
ϕ = 39.5°. The tests did not allow one to obtain the cohesion parameter c. Friction angles and cohesion coefficients of natural aggregates with C
U = 6.6 and a grain size distribution similar to the RCAs studied here were previously found to be around
ϕ = 39.6° and
c = 0 (see [
36,
37]). Studies on sandy gravel subjected to triaxial compression led to the estimation of the friction angles in the range 39° <
ϕ < 48° to NAs, depending on the relative density changes during the consolidation step [
38].
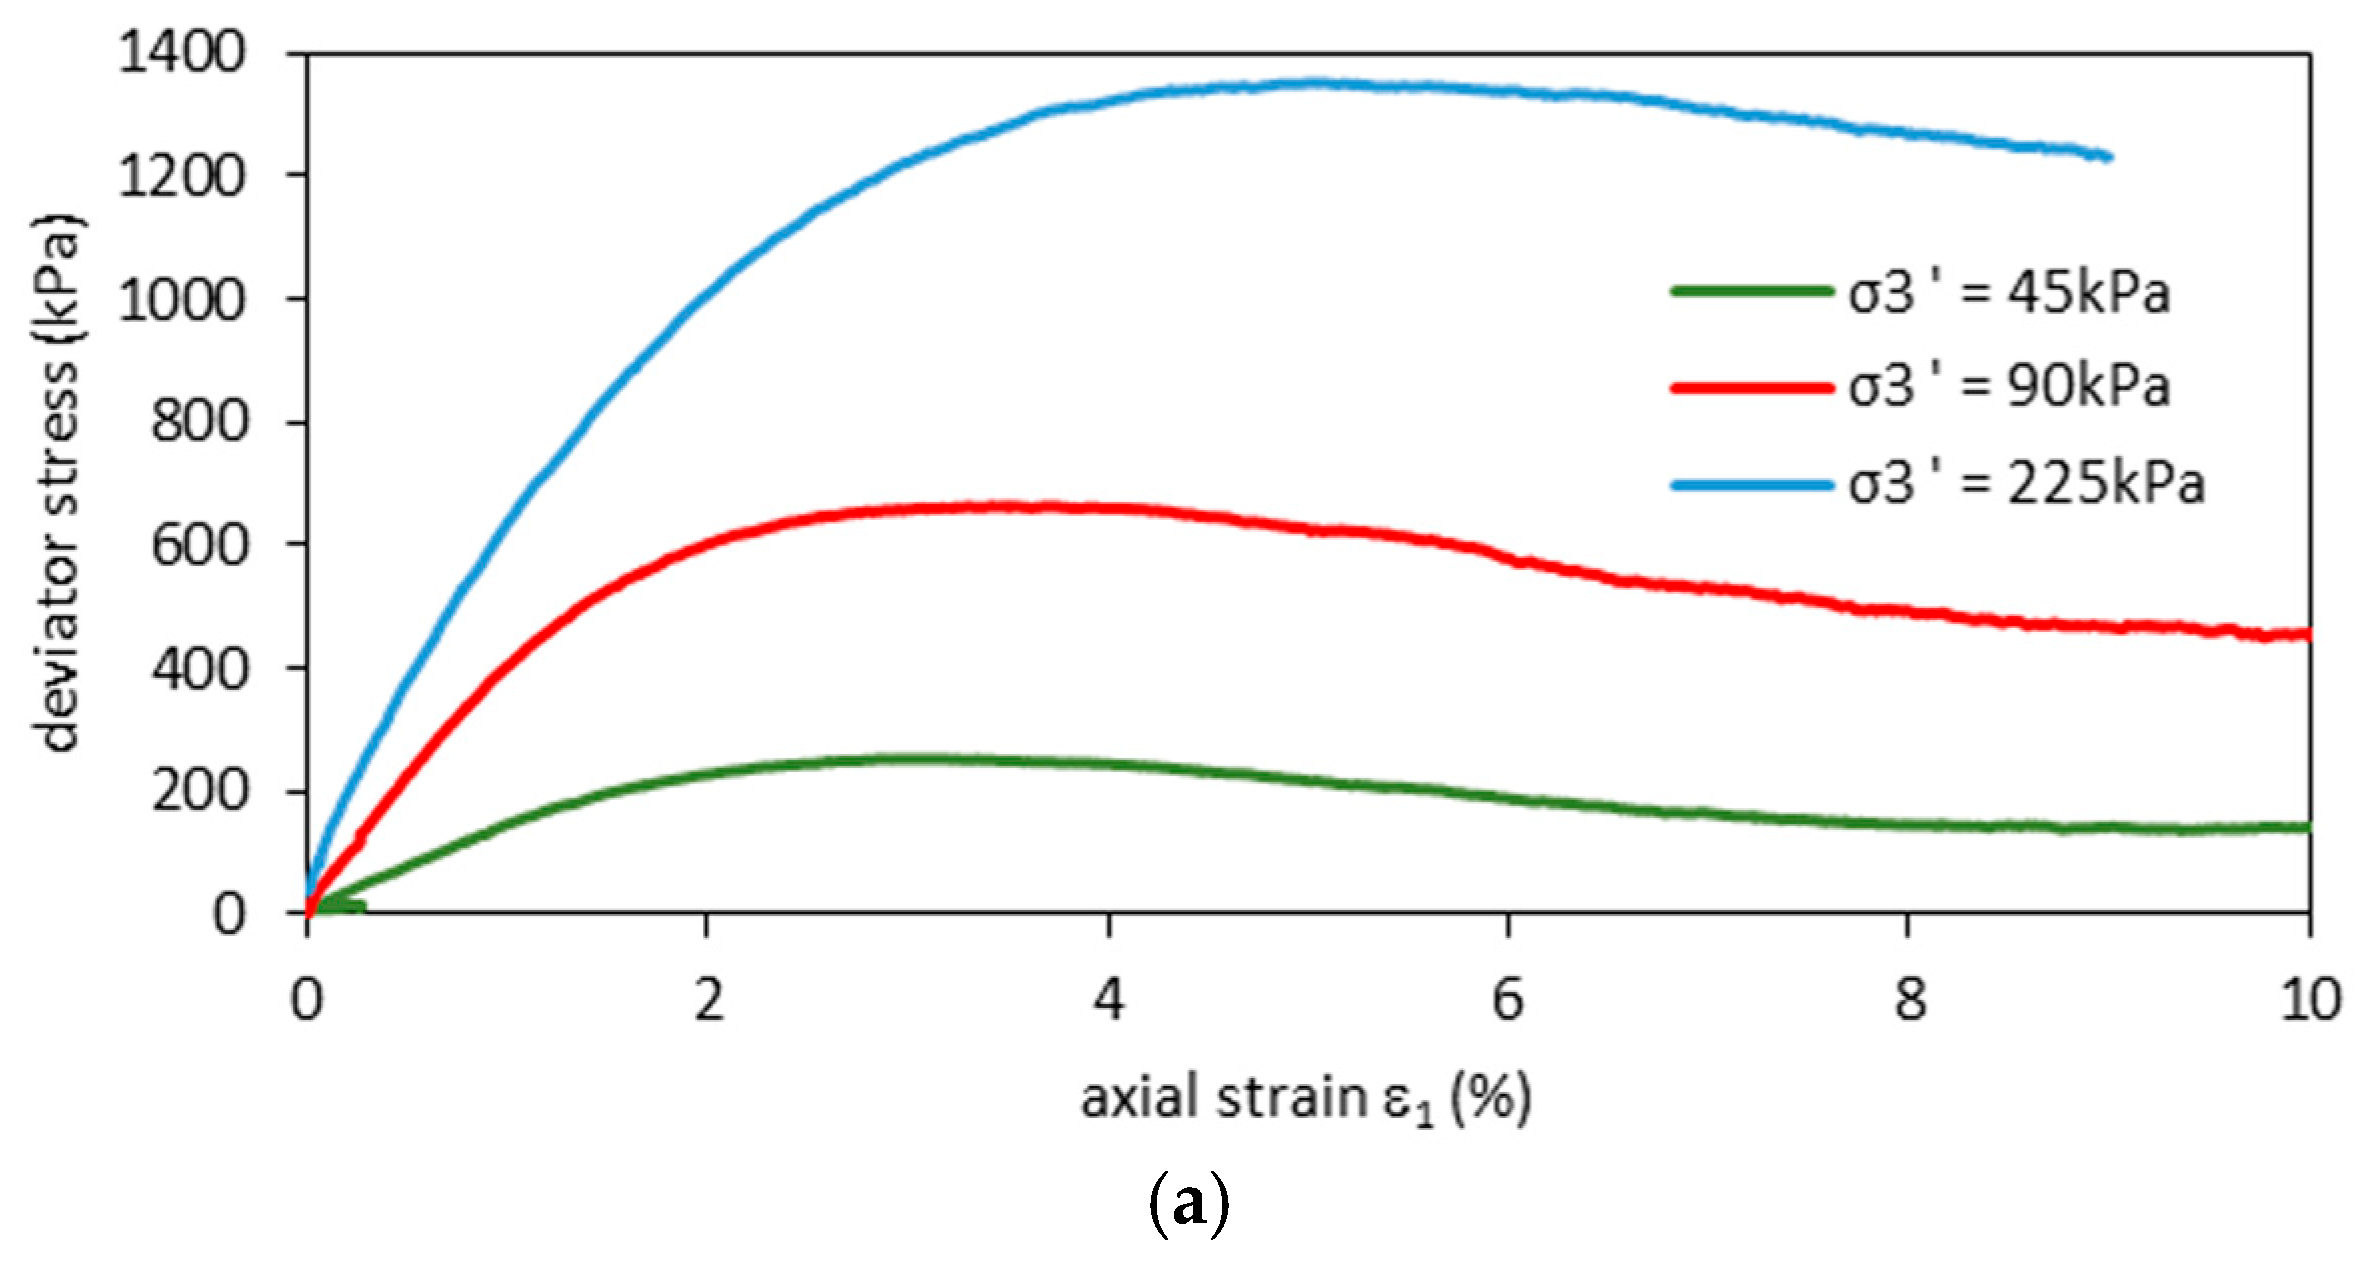
Static triaxial test results are presented in
Figure 4. Stress-strain curves are plotted in
Figure 4a and show similar behavior under different confining pressures. The deviator stresses reach maximal values at axial strains of, approximately, 2.9%, 3.4% and 4.3% for confining pressures of 45 kPa, 90 kPa and 225 kPa, respectively. These maximal values are defined as drained shear strength and are presented in
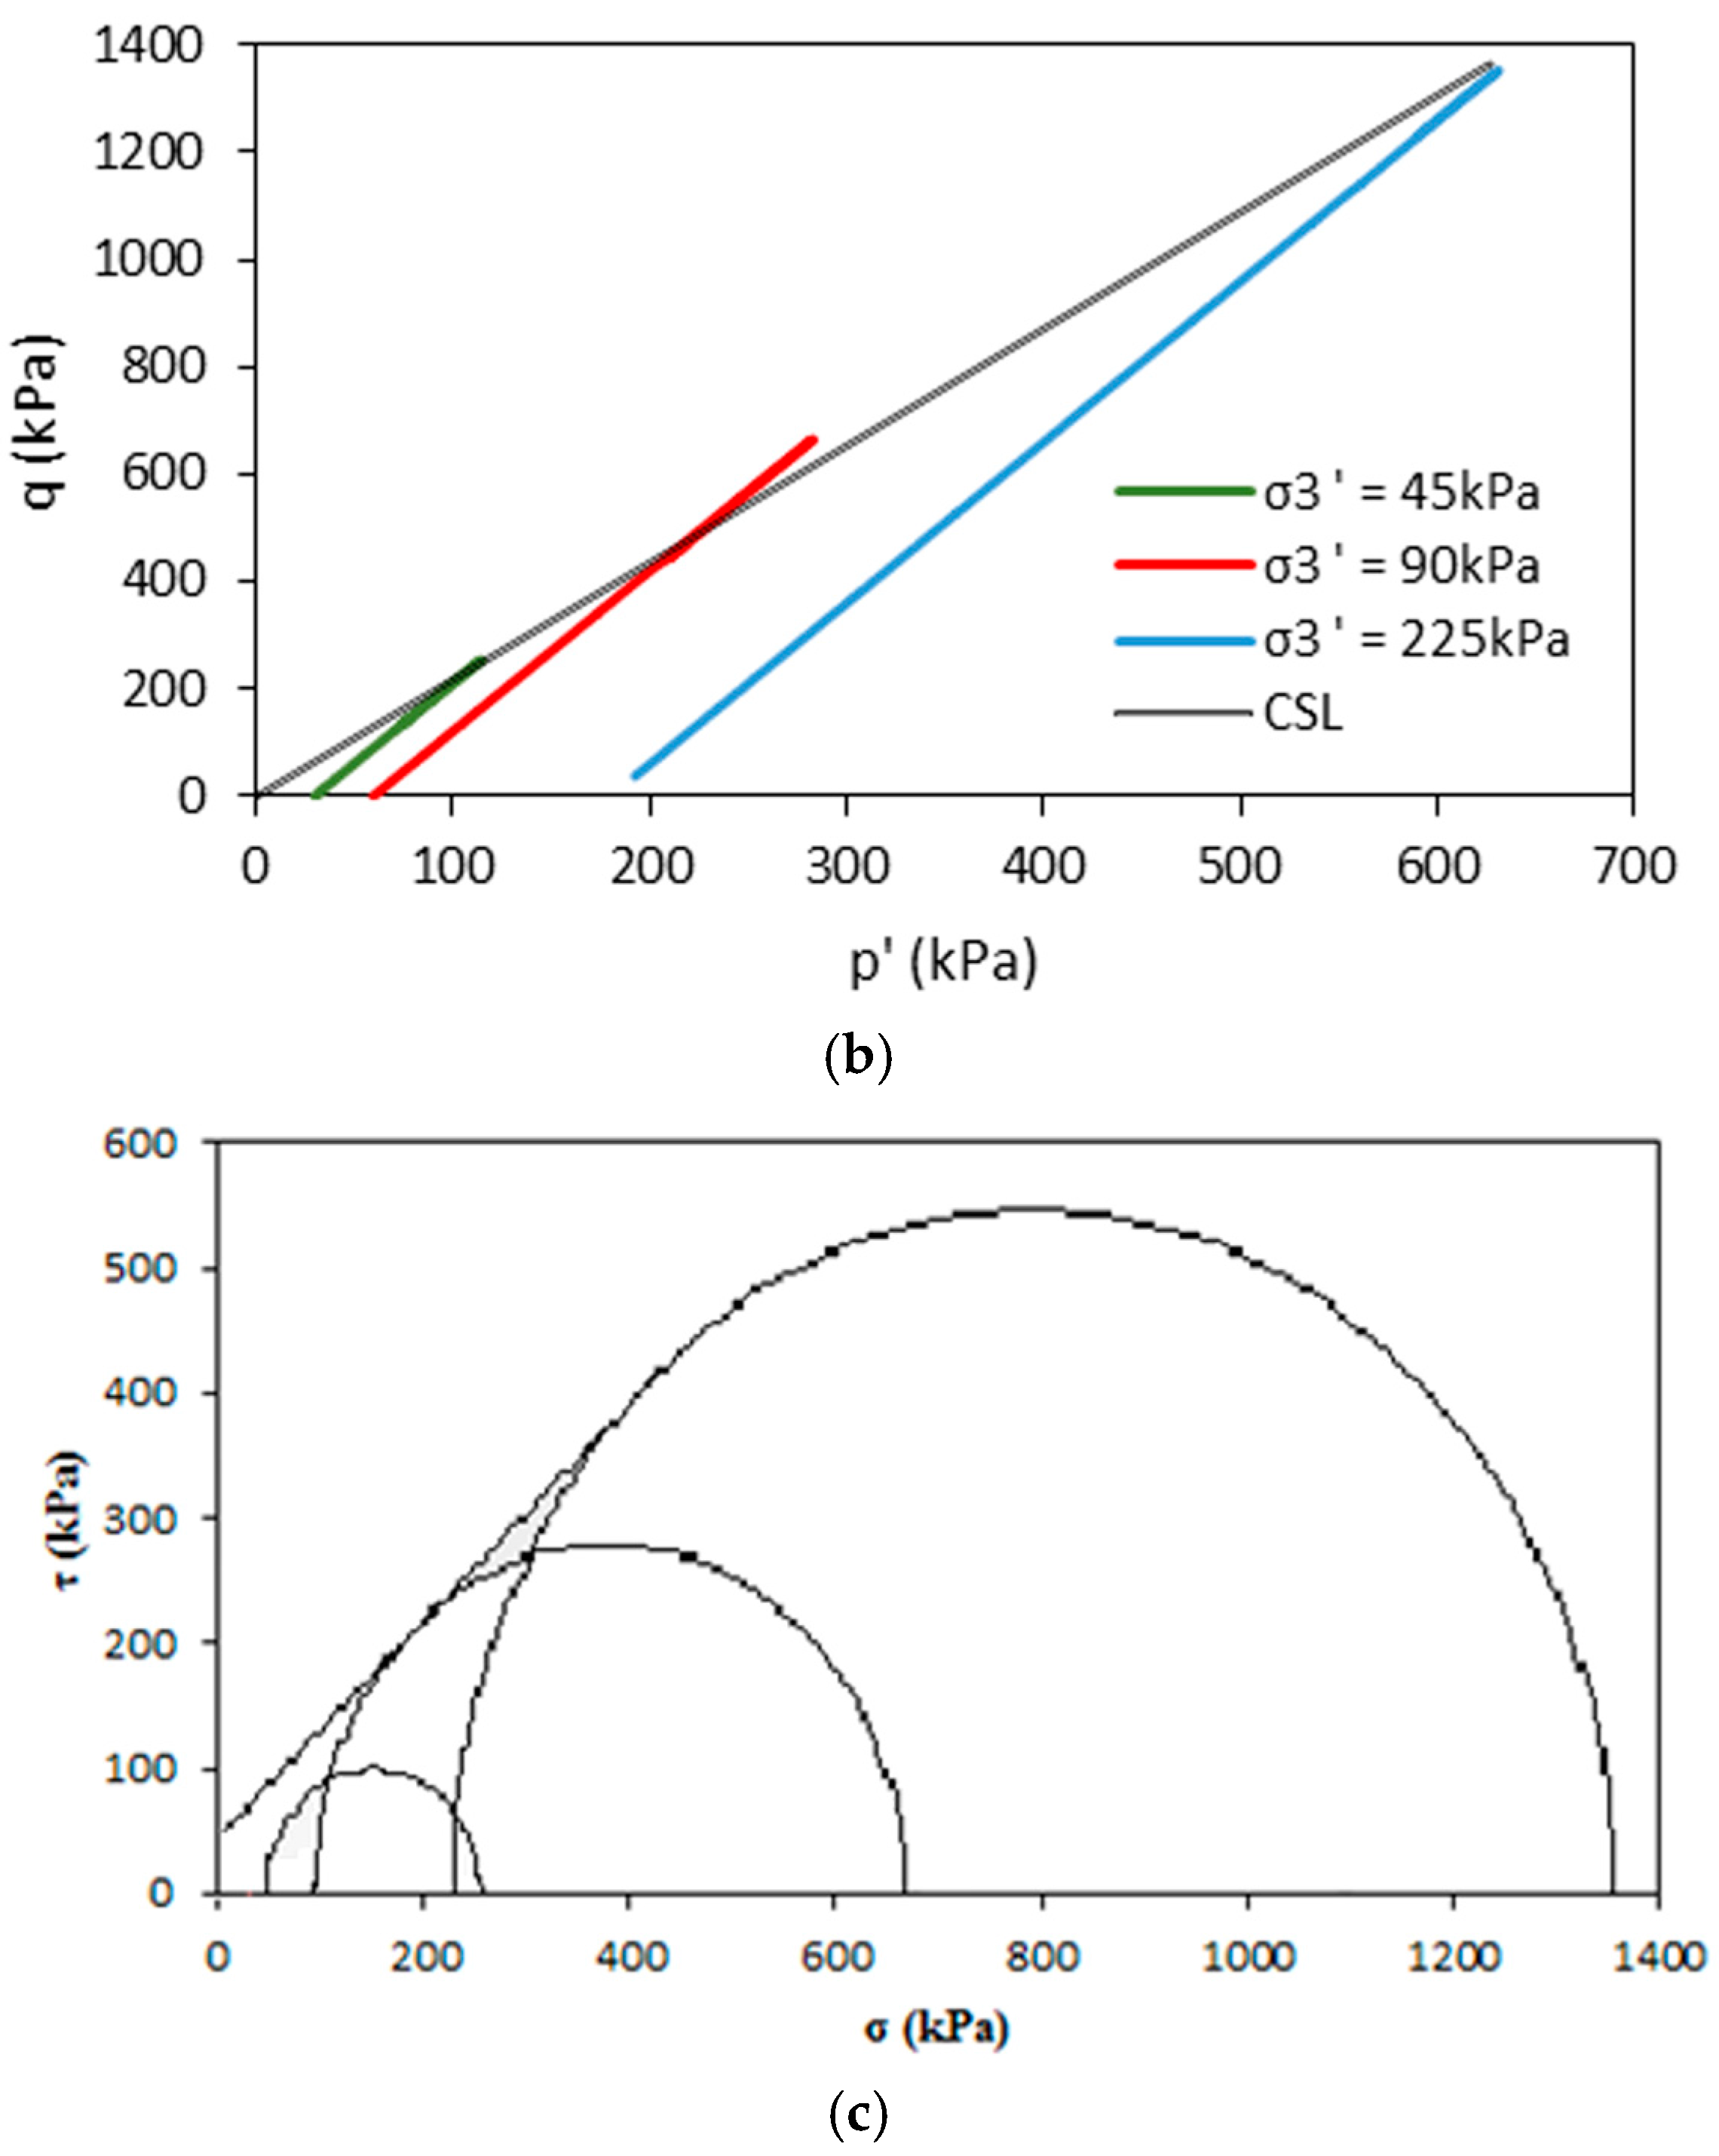
Table 2. It is seen in
Figure 4b that effective stress paths in drained conditions form a critical state line, which is characterized by a slope
M (
M =
qmax/p’ where
p’ = 1/3(
σ’1 + 2
σ3’) and
qmax = (
σ’1max −
σ3’)). Such a slope relates to the effective friction angle
ϕ’ according to
. The slope of the critical state lines in
Figure 4b amount to 2.17, which corresponds to a friction angle of 53°.
Coulomb–Mohr plots are presented in
Figure 4c. The analysis of these static triaxial tests allows independent estimation of the friction angles and apparent cohesion parameters at
ϕ’ = 42° and
c = 45 kPa, in accordance with previous studies [
38]. The differences between the results arising from the effective stress plot (
Figure 3b) and the Coulomb–Mohr analysis (
Figure 4c) happen due to the nonlinear results of triaxial tests. The RCA structure, which involves high roughness of the grain surface, undergoes higher friction forces at lower confining pressures. On the other hand, the soil density after consolidation increases together with the effective stress. A higher effective stress results in a lower impact of grain surface roughness, which creates uncertainties in the estimation of the sample’s mechanical parameters.
3.4. Cyclic Triaxial Test Results
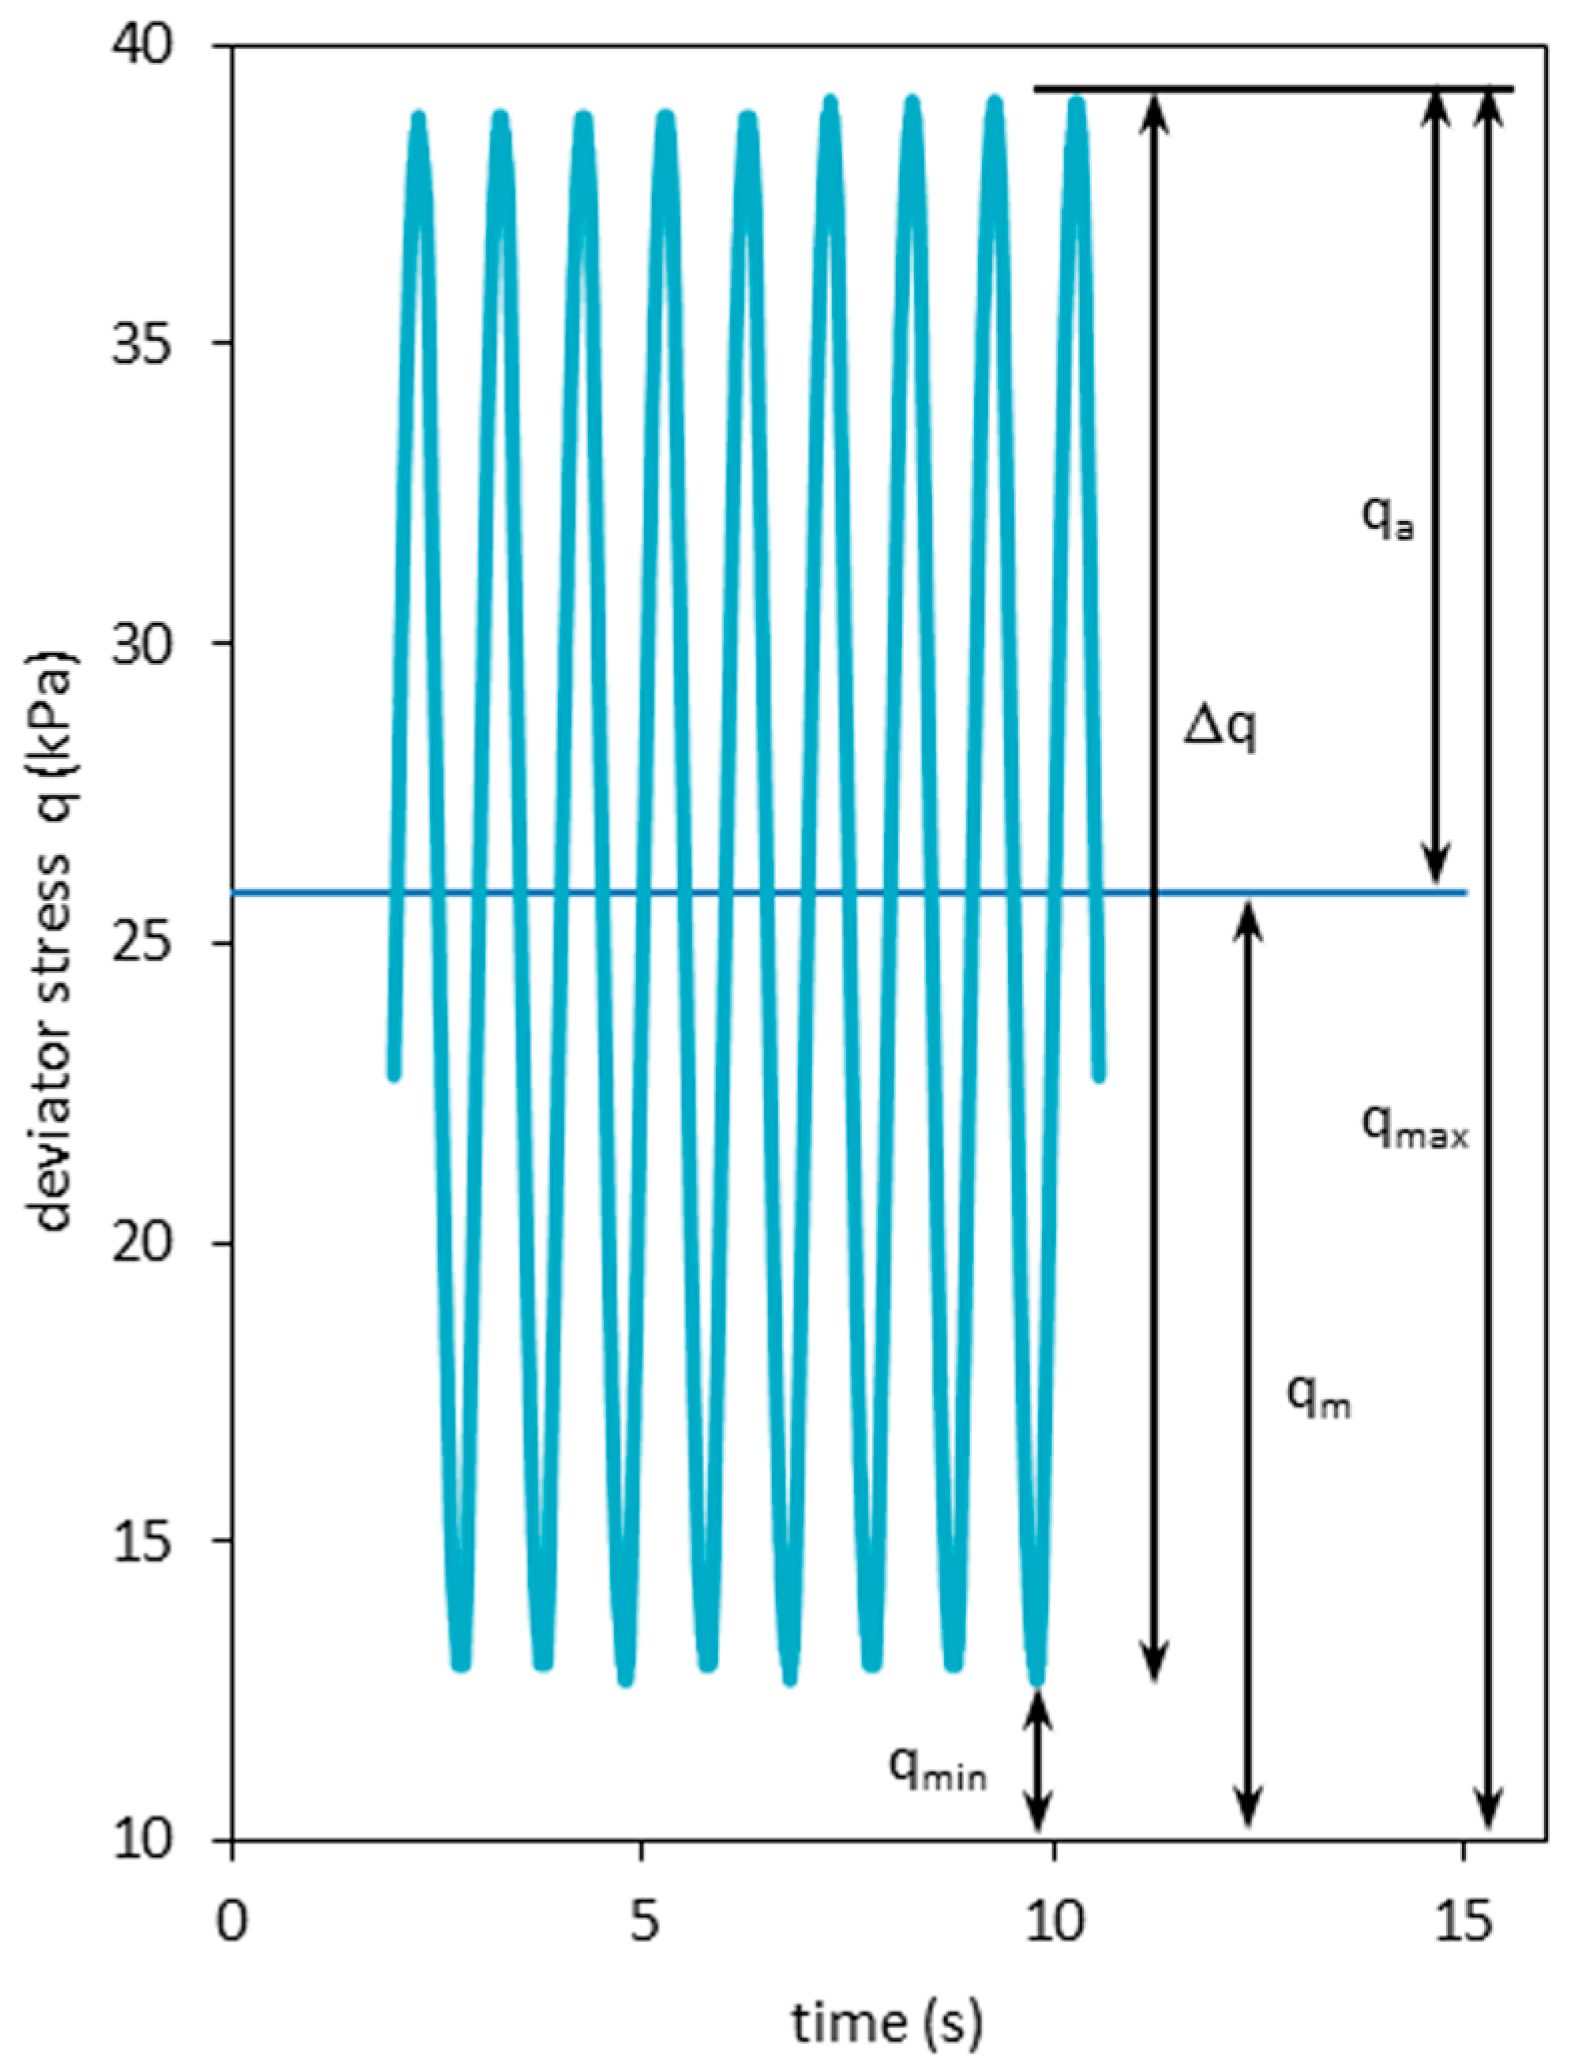
The cyclic triaxial tests were performed under a deviator stress
qmax = 38.8 kPa. DST results showed a friction angle
= 39.5°. Maximal deviator stresses
qmax were calculated from:
where
is the effective major axial stress and
corresponds to the effective minor axial stress value; in order to do so, Formula (1) can be rewritten to:
. The values obtained this way for
q were
q = 257.3 kPa (for
p’0 = 45 kPa) and
q = 314.6 kPa (for
p’0 = 90 kPa). The applied deviator stresses during cyclic loading tests were, therefore, a fraction of
qmax.
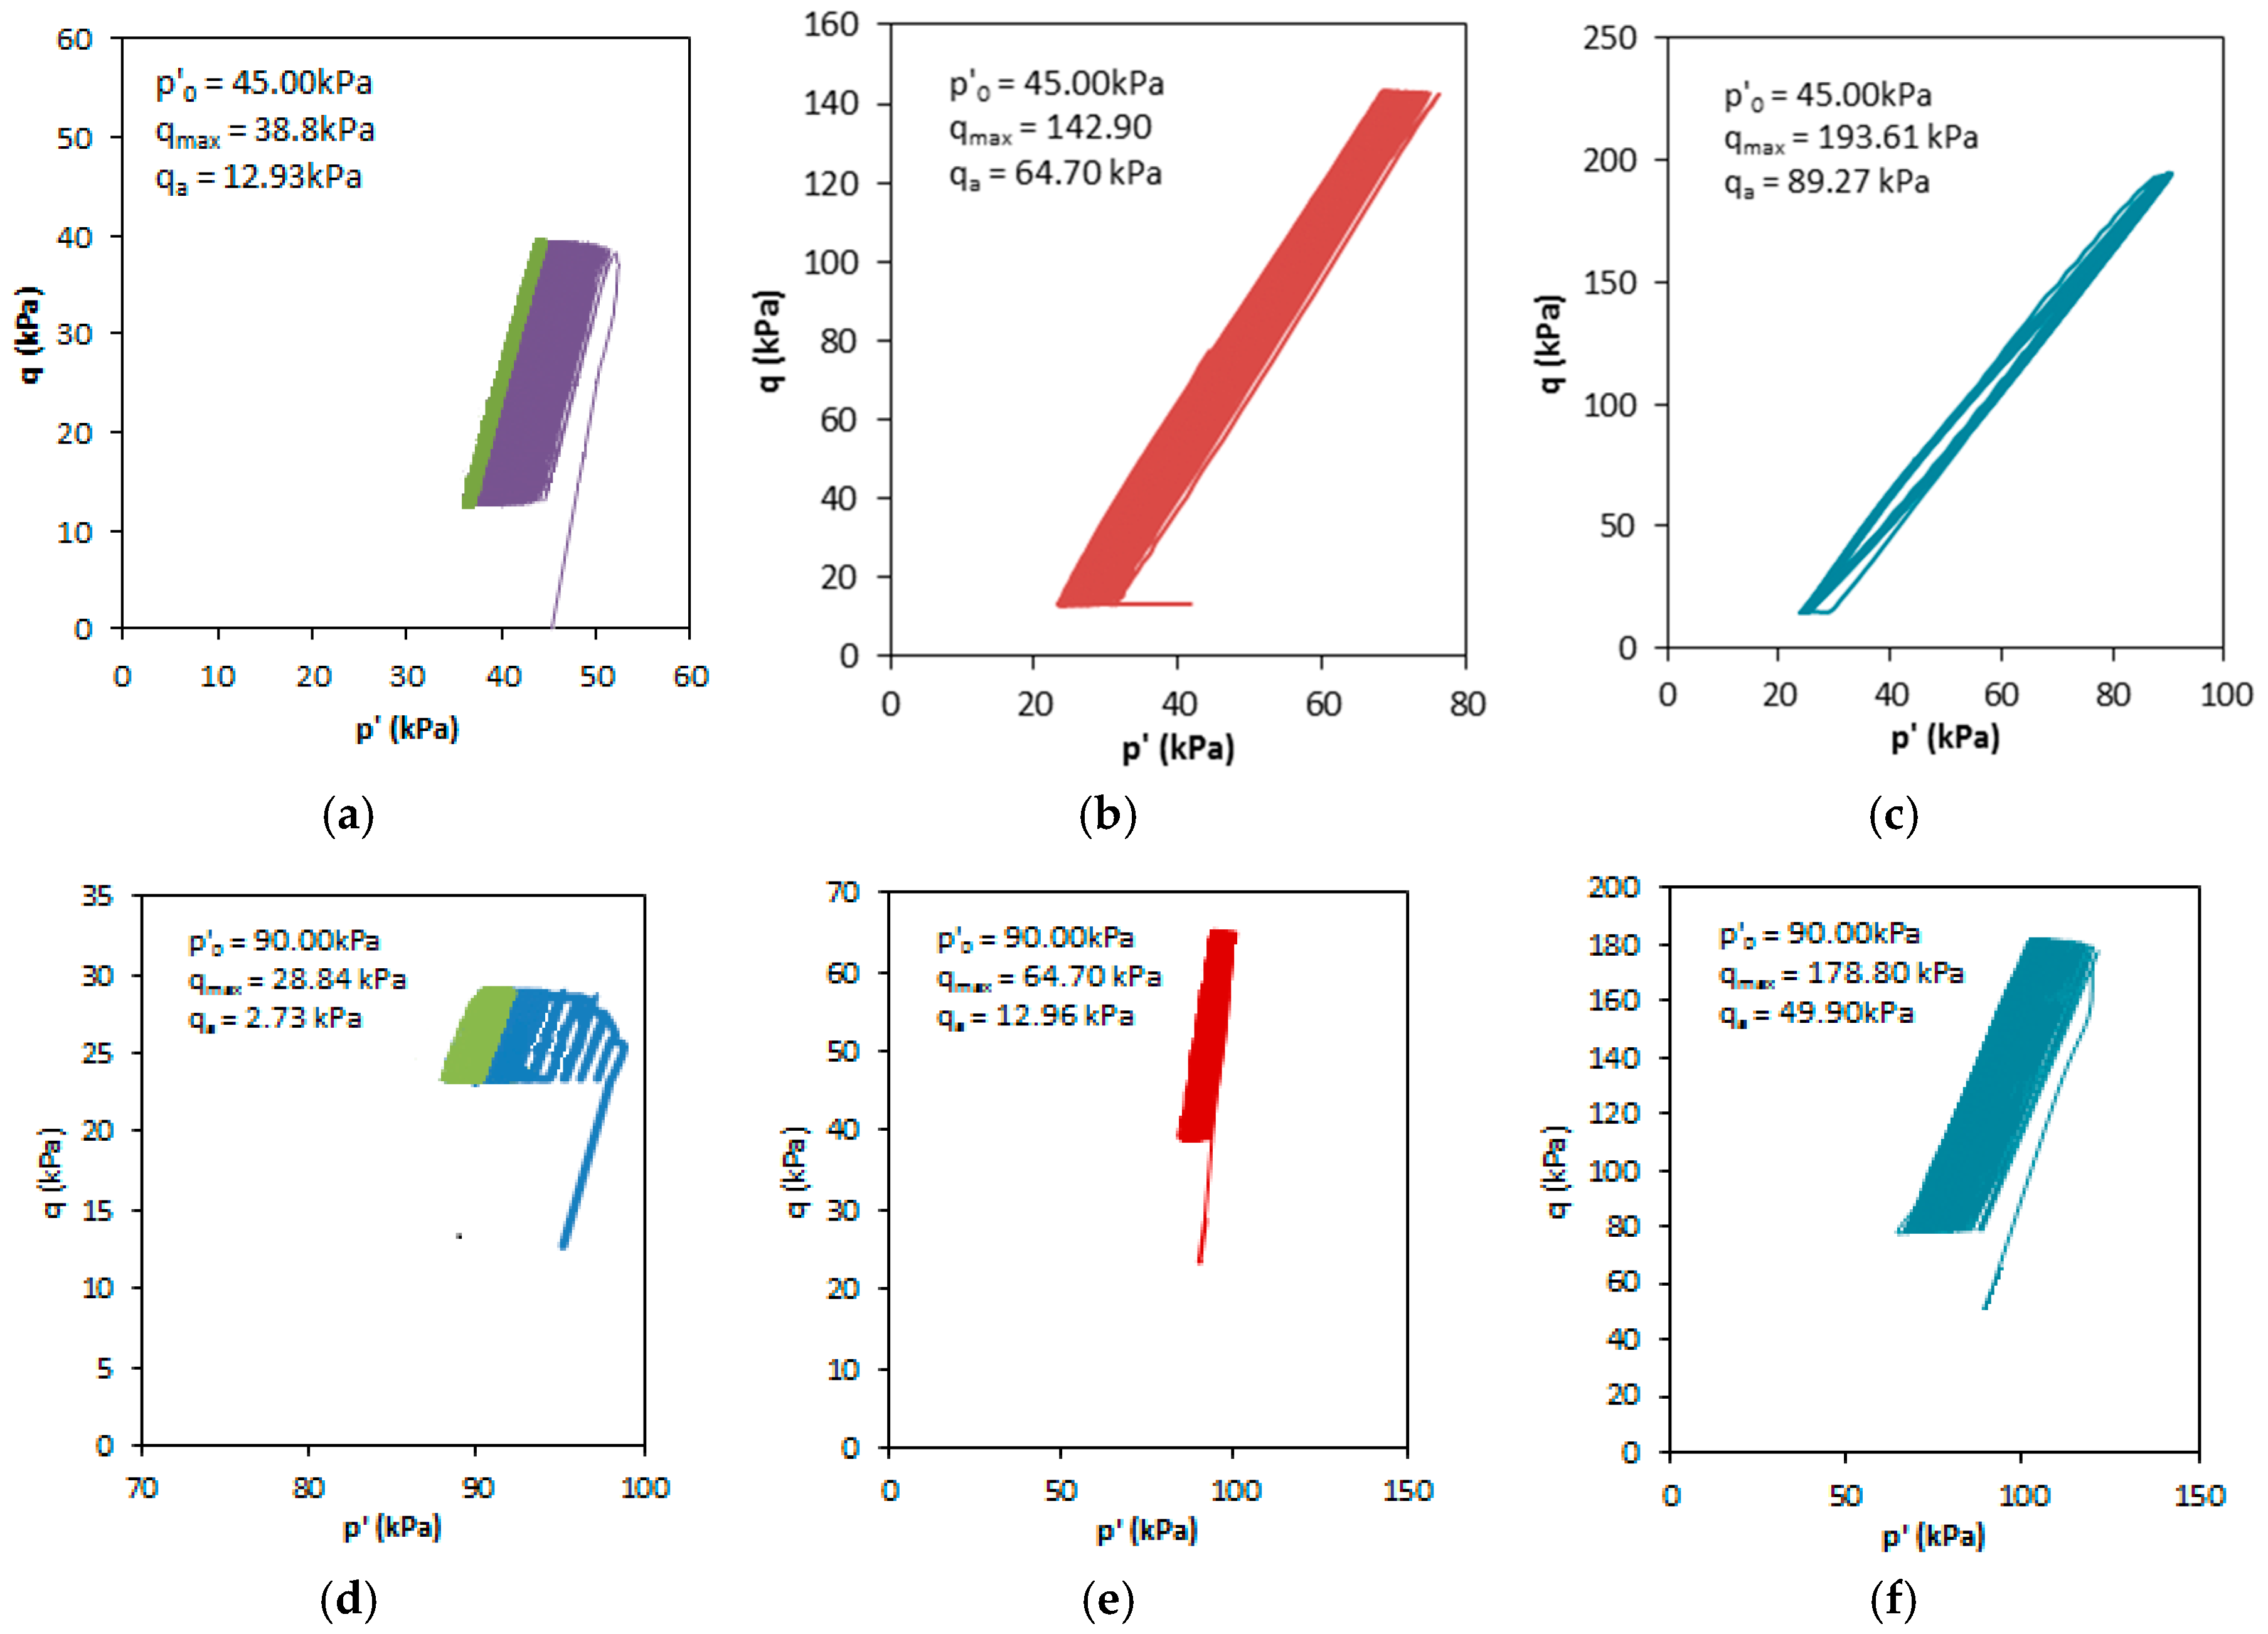
During the first test stage, which occurred for effective stress p’0 = 45 kPa, the maximal deviator stresses qmax were equal to 38.8 kPa, 142.9 kPa and 193.61 kPa. These values correspond to 15%, 55% and 75% of q (p’0 = 45 kPa), respectively. In the second loading stage, p’0 = 90 kPa, the maximal deviator stress qmax was equal to 28.84 kPa, 64.70 kPa and 178.79 kPa, corresponding to 10%, 20% and 57% of q (p’0 = 90 kPa), respectively.
Figure 7 shows the effective p’ stress paths obtained during each test. These plots clearly show different mean effective stress paths during cycling, providing a tool to analyze the stress-path evolution. Such evolution happens as a result of pore pressure generation, with particle crushing after numerous cycles causing a steady decrease of the excess pore pressure. This is observed as a slower increase of the effective stress path. In addition, the figures show that the maximal stress
qmax and the stress amplitude
qa are greatly affected by changes in
p’0.
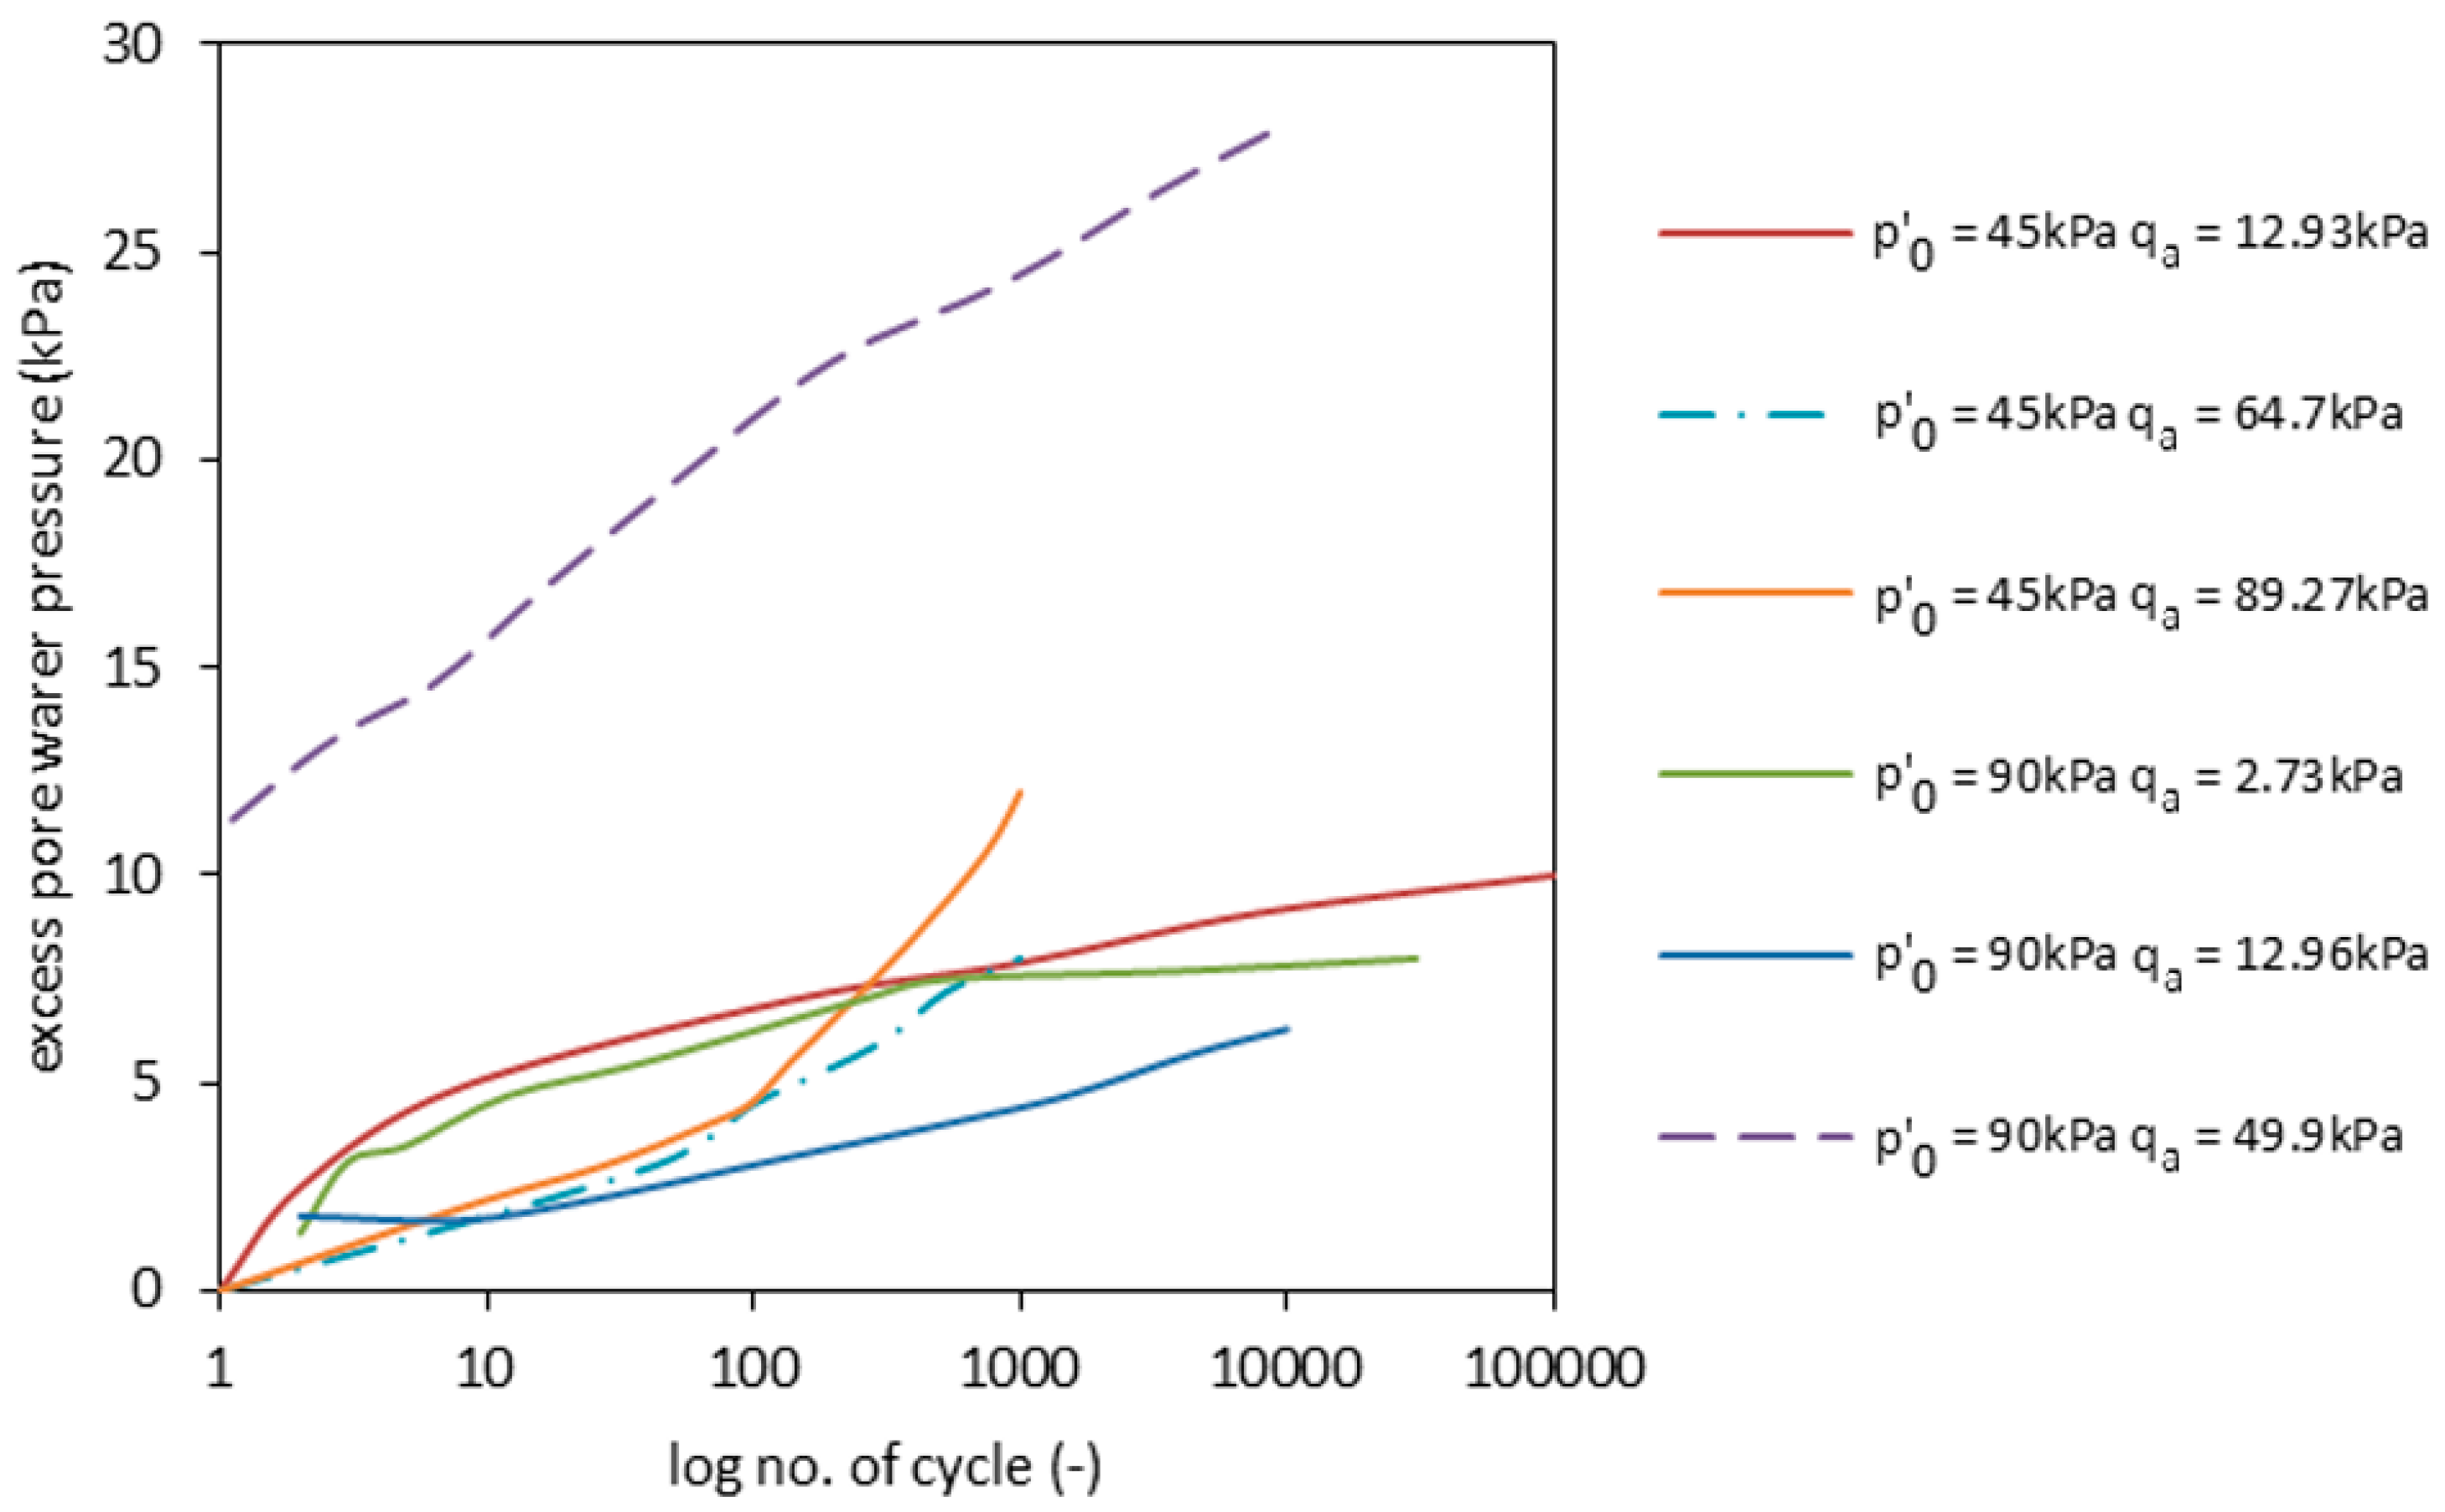
The experiments performed in undrained conditions lead to pore pressure generation. The pore pressure generation develops in the same scenario. At the beginning of each test, the excess pore water pressure rose, reaching stabilized values after approximately 100 cycles. After ca. 1000 cycles, the generation of pore pressure was constantly at low levels, in comparison with previous precedent runs. During undrained tests, the pore pressure was not expected to dissipate due to leakage. This happened because drainage was kept steady by pressure and volume controllers. However, experiments have shown otherwise (see
Figure 8). The observed dissipation may be attributed to grain breakage or, at the early stages of cyclic loading, to the typical internal porosity and high water adsorption of the material characteristics for RCAs. When high stress deviators and stress amplitudes were applied, the pore pressure evolved in a different manner. The first few cycles lead to high pore pressure generation, which remained constant. This is seen in
Figure 8.
In particular, for the test with
p’0 = 45 kPa and
qmax = 38.8 kPa, the excess pore pressure rose slowly and stabilized after the 10th cycle. The same was observed for Test 2.1 (see
Table 1 and
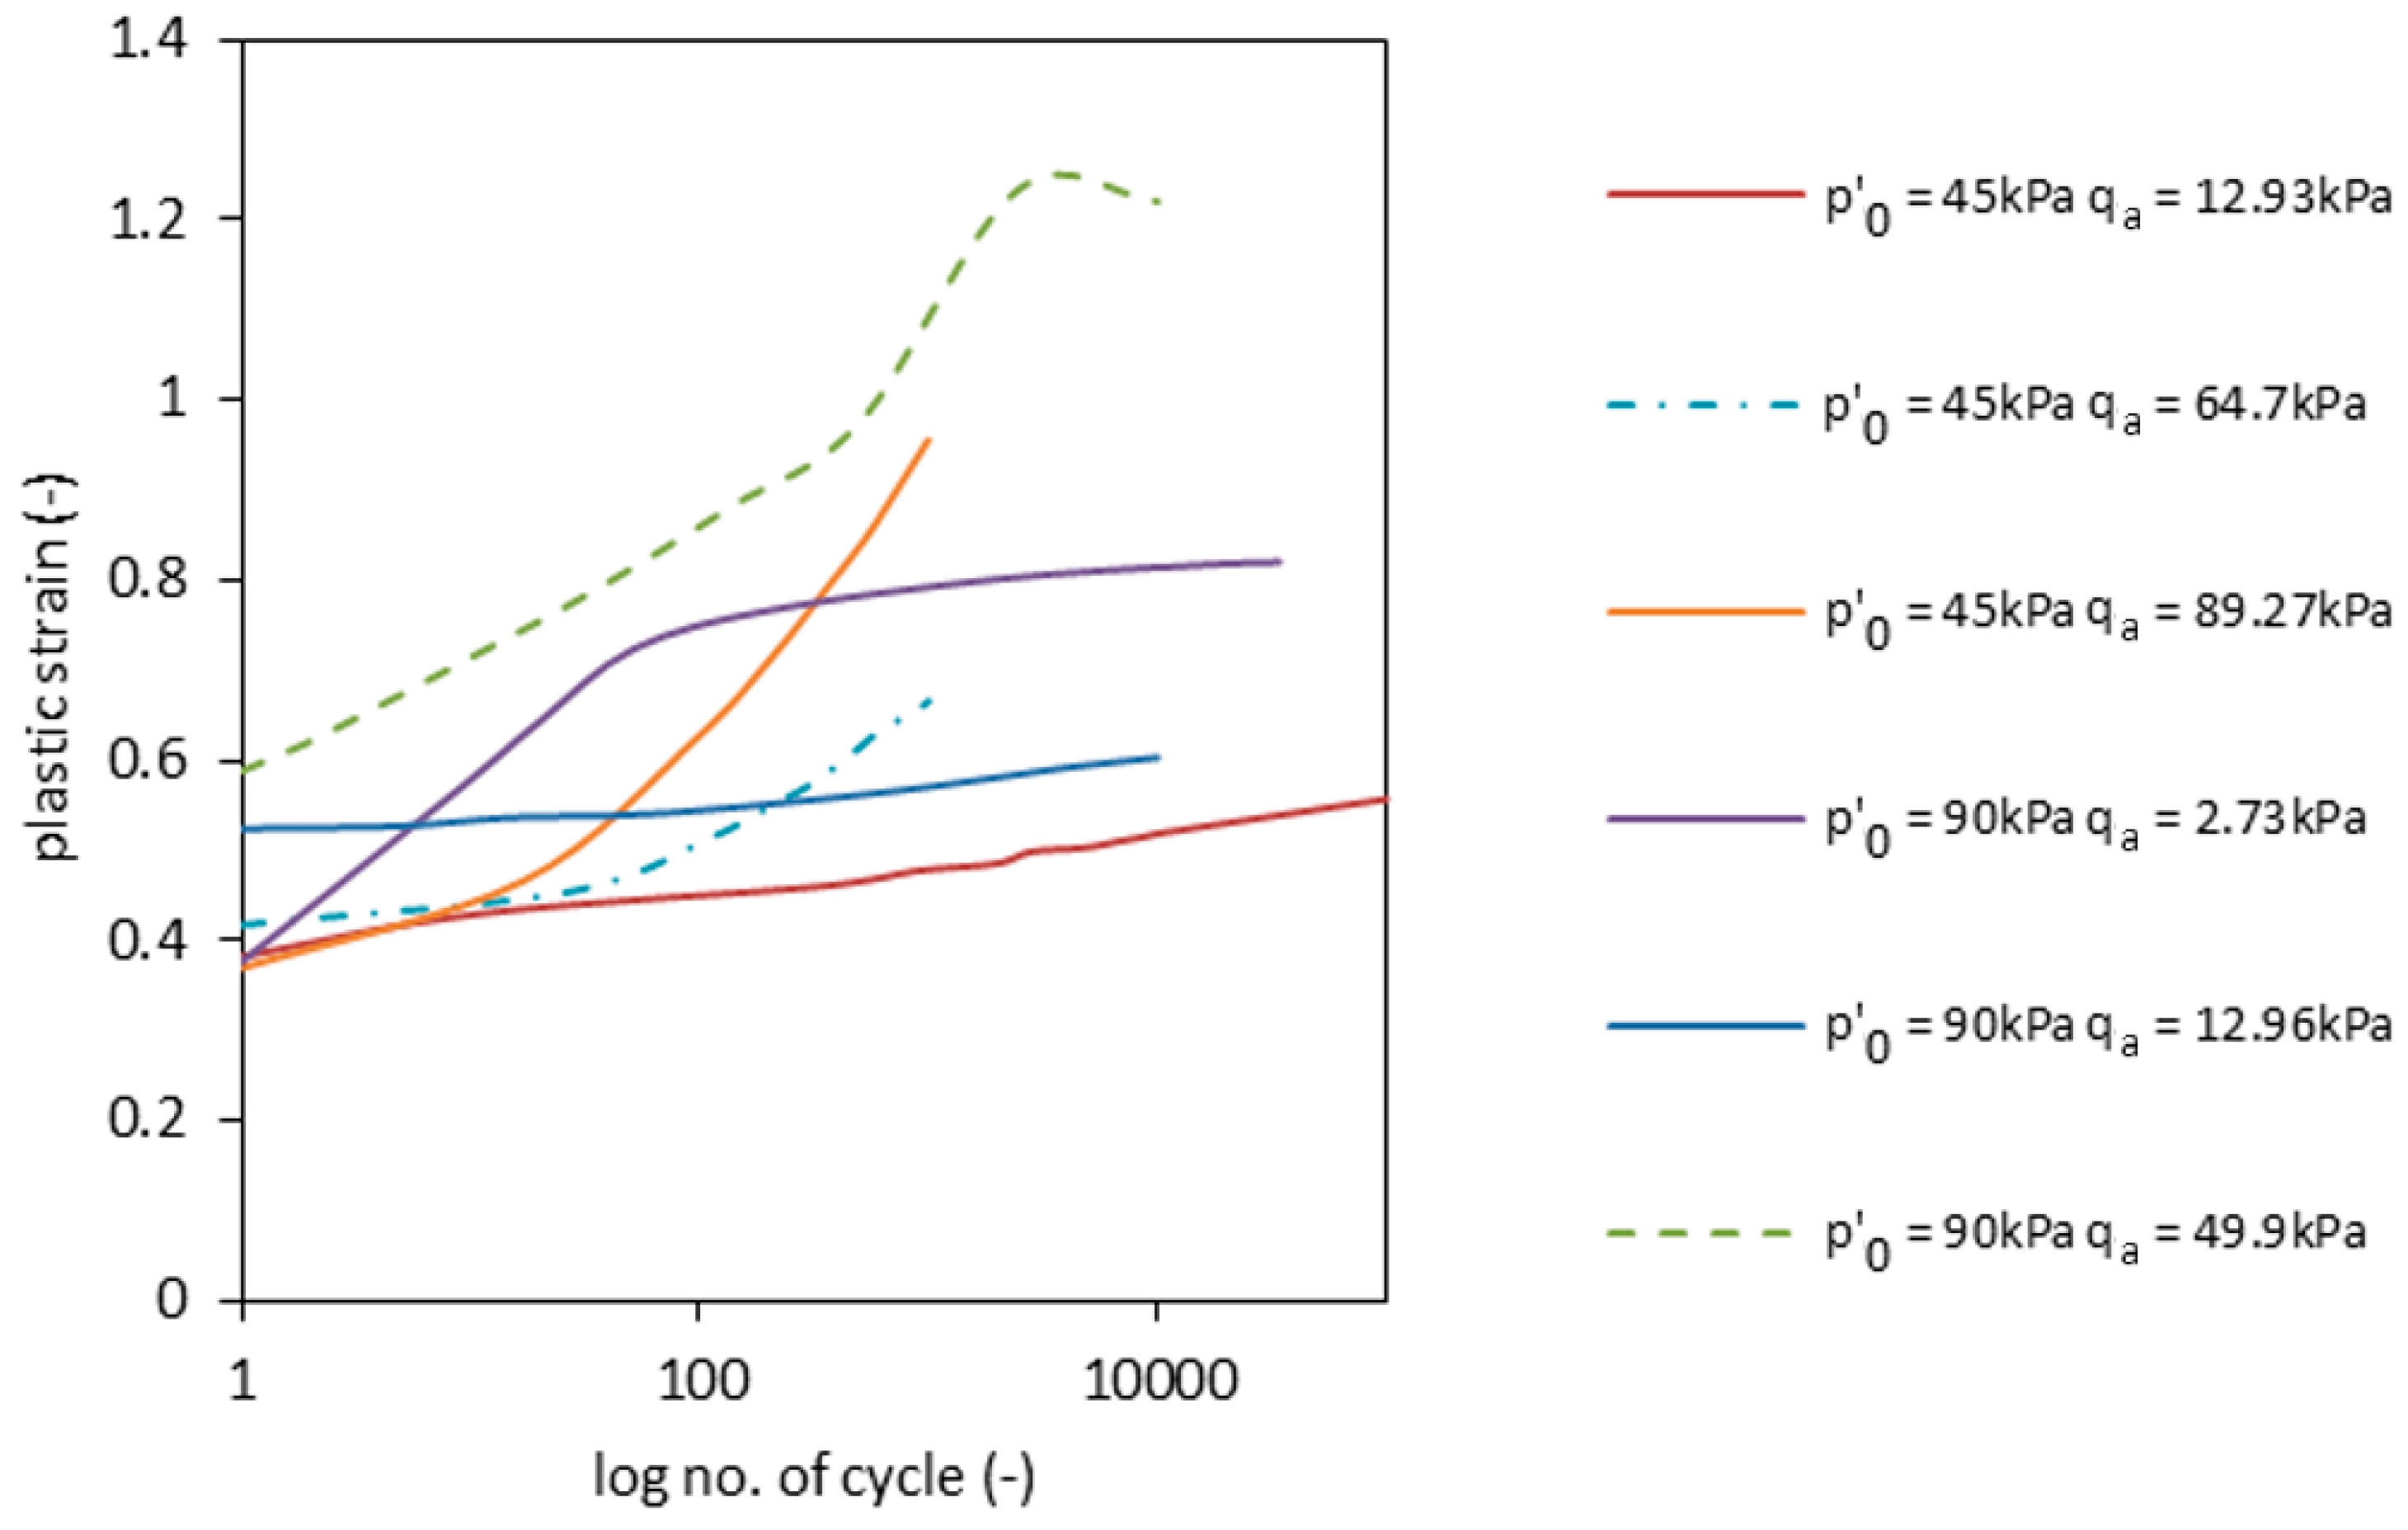
Figure 8). During Tests 1.2 and 2.2, the pore pressure rose in two stages, as it did during Tests 1.1 and 2.1 (the former after the 10th cycle and the latter after the 100th cycle). However, after the 100th cycle, the velocity of pore pressure decreased slower in these tests. This can be caused by the existence of a threshold deviator stress, under which the pore pressure stabilizes itself. Nevertheless, indirect conclusions can be drawn from the analysis of the accumulation of plastic strains, which are presented in
Figure 9.
The permanent strain accumulation in Tests 1.1, 2.1 and 2.2 follows the same pattern after the 100th repetition. This allows the conclusion that plastic strains are lower for smaller deviator stress amplitudes qa. The first 100 cycles, which correspond to a process of compaction and grain movement, present a different pattern of plastic strain generation. A possible explanation for this fact lies in how the consolidation process was conducted. Although anisotropic consolidation, which represents a natural sedimentation environment, represents conditions found in nature, the artificial grains in RCAs may be acting differently when compared to natural aggregates.
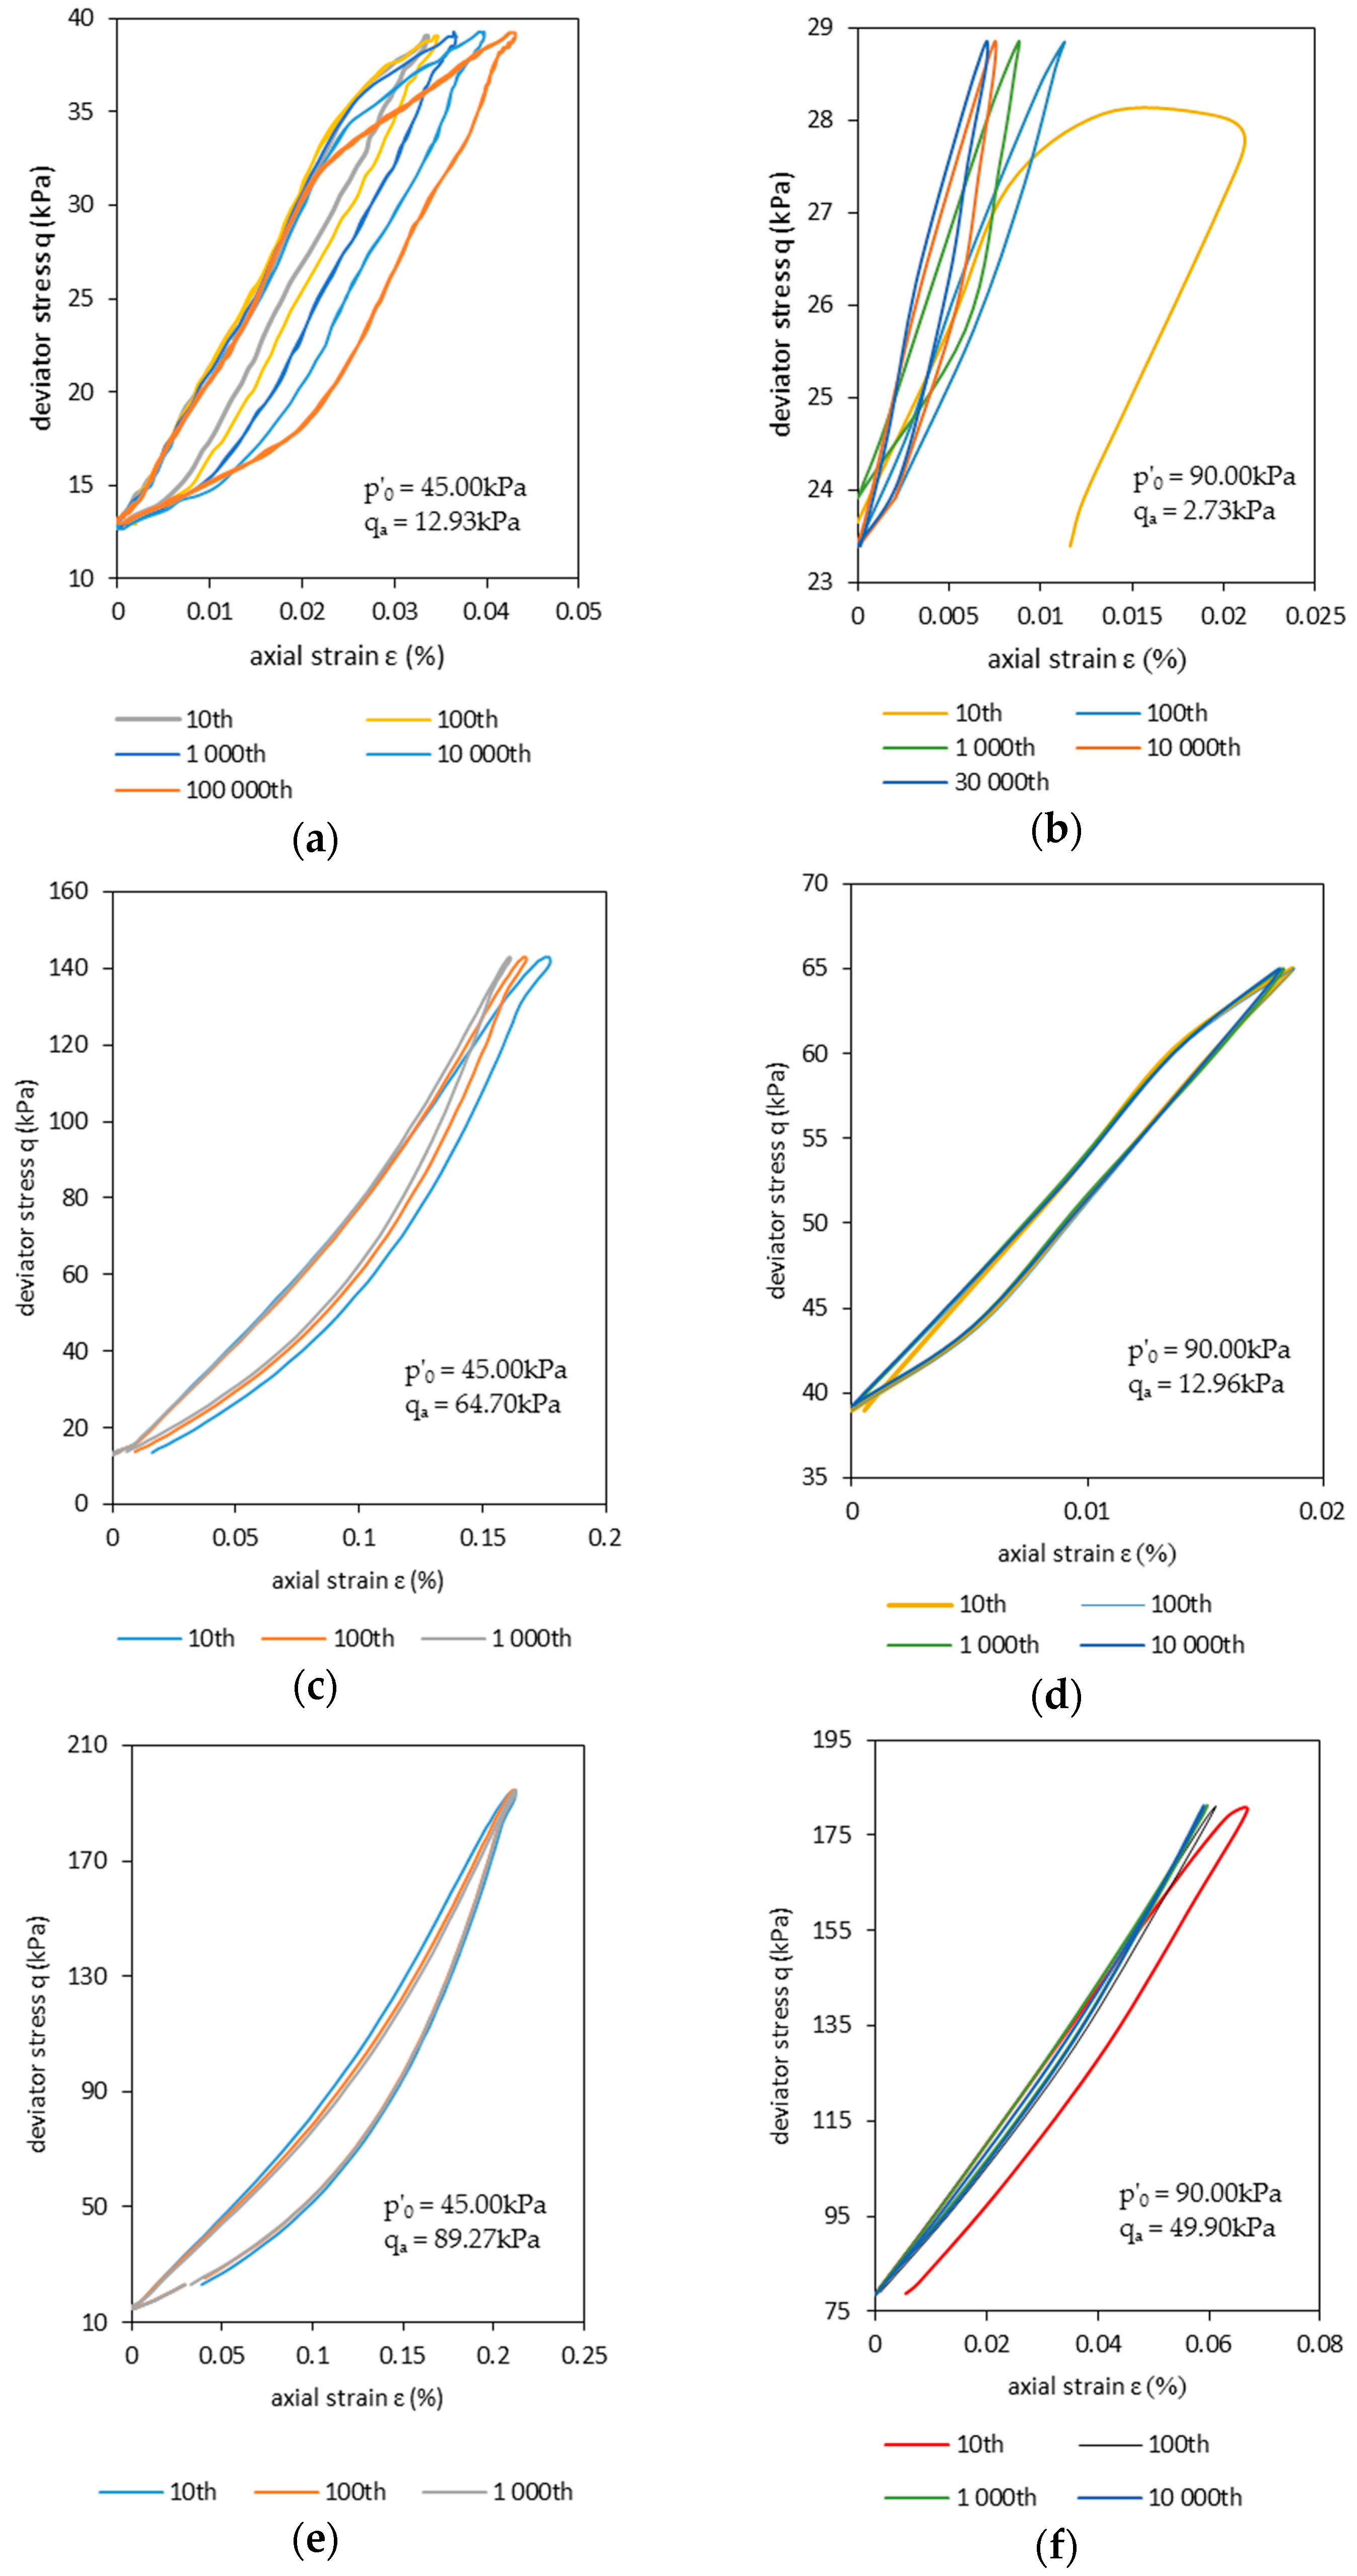
In order to show the development of plastic strain during cyclical loading, selected cycles of the strain-stress chart are plotted in
Figure 10. The effects of degradation in the soil properties are more evident in
Figure 10a. For subsequent cycles, the stress-strain hysteresis inclination (the slope of the line connecting both ends of the hysteresis loop) is reduced. This means a decrease of sample stiffness. The degradation process starts after the plastic hardening. The plastic hardening stops when no further plastic strains are observed in one cycle. During the test, the area of the hysteresis loop was also quantified. Its increase demonstrates the occurrence of degradation (see
Figure 10e).
In
Figure 10b, the high plastic strain accumulation in the first few cycles is shown. These strains are observed even after the development of the unloading phase. However, after 10
5 cycles, the plastic strains during cycling vanished. In the absence of plastic strains, the excess pore pressure generation also stops. This suggests that, in undrained conditions, the development of plastic axial strain is greatly influenced by the excess pore water pressure. The strain stress plots show that axial strain curves have similar shapes for the tests presented in
Figure 10c–f.
The lower value for the deviator amplitude
qa during Test 1.1 resulted in lower residual values of axial strain in comparison with Tests 1.2 and 1.3. For example, the values of permanent axial strain during the 1000th cycle (
Figure 10e) were, approximately, 2.0- and 1.4-times smaller in Test 1.1 when compared to Tests 1.3 and 1.2, respectively. The effect of confining pressures is also clear from the results, with confining pressures conditioning the RCA sample to a much stiffer response to cyclical loading.
Total strains showed overall lower values for higher maximal deviator stresses
qmax. Deviator stress amplitude
qa also has an impact on the RCA sample behavior, with lower
qa values accounting for lower total axial strains. However, the impact of
qa on plastic strain development seems to be insensitive to effective stress
p’0 and maximal axial stress
qmax. This can be clearly observed in
Figure 9 and when comparing
Figure 10b with
Figure 10d and
Figure 10c with
Figure 10f.
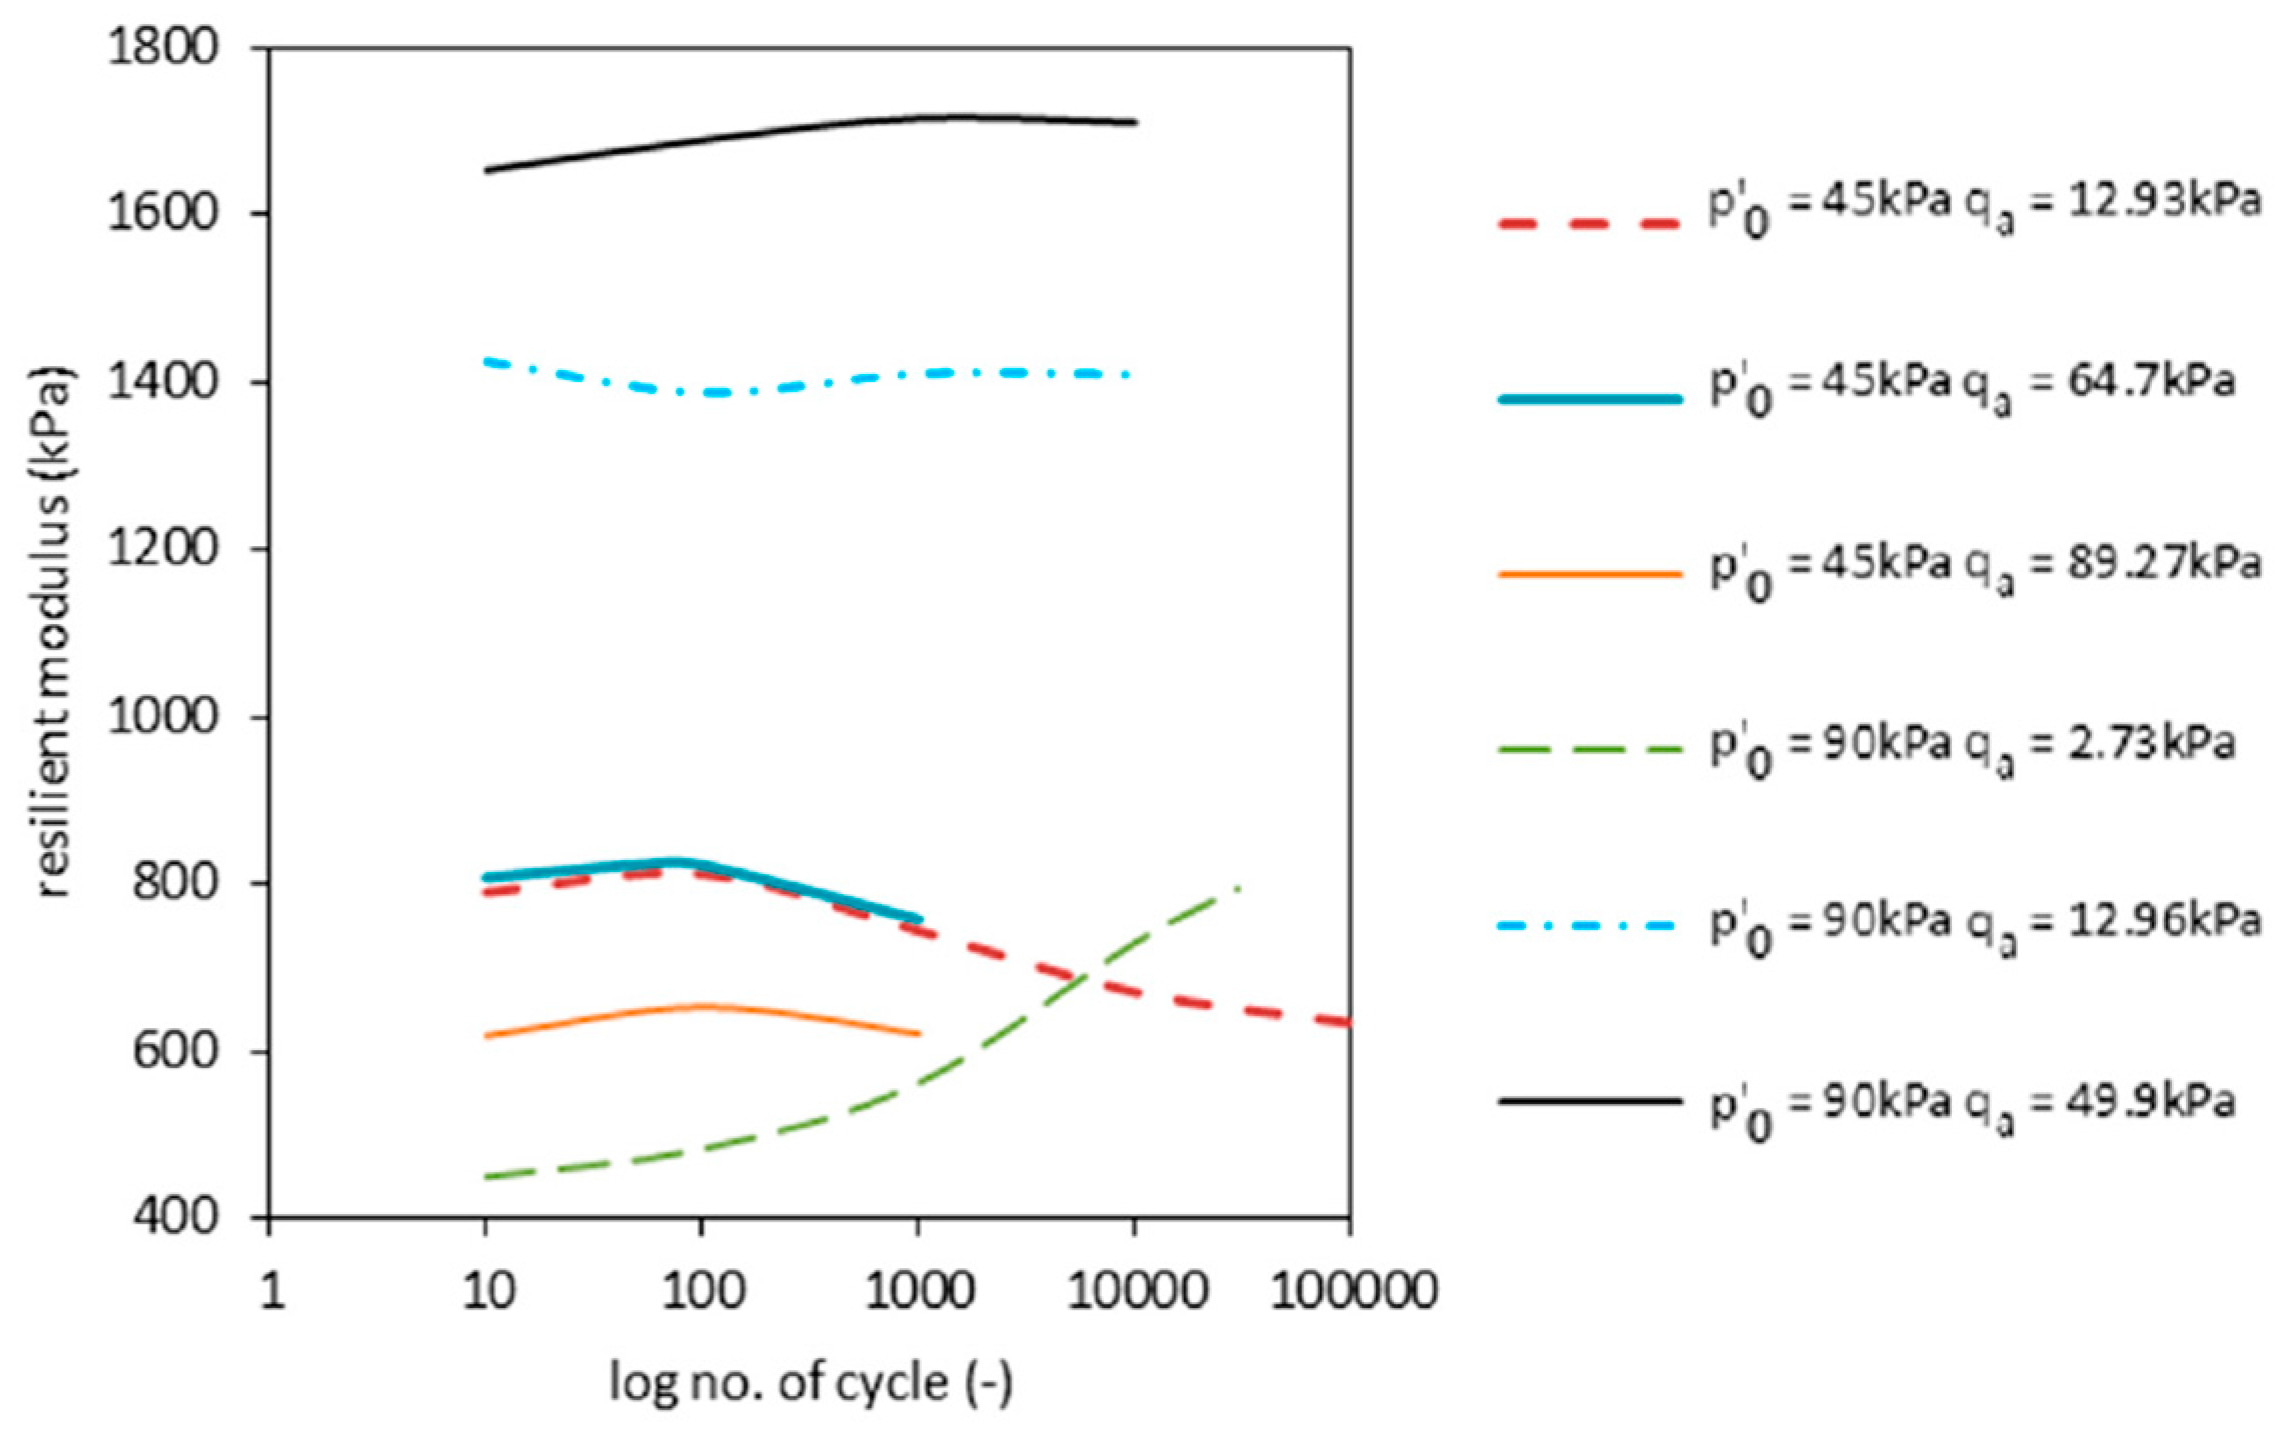
The resilient modulus
Mr, which describes the elastic (or resilient) strain during the unloading phase in one cycle of the loading test, was calculated, for all three tests, according to:
In Equation (3), stands for the stress difference of cyclic stress (Δq = qmax − qmin) and for the resilient strain.
Calculated values for
Mr are presented in
Figure 11 and included in
Table 4. In it, the maximal value obtained for
Mr was max(
Mr) = 1715 kPa. The decrease of
Mr is characterized by the reduction of the slope in stress-strain (
q(
)) charts. The occurrence of stiffness degradation can be observed by using the
Mr development plot over the number of cycles. The decrease of the resilient modulus stands for inclination growth towards the X axis on the stress-strain chart. This statement is only valid when no plastic strains occurs. The phenomena of plastic strain abation can be observed after the plastic hardening process. The decrease of
Mr after plastic hardening (approximately 10
2 to 10
3 cycles) happens due the degradation of the RCA stiffness. This was observed in all tests, except for 2.1. In the latter case (
Figure 11, green dashed line), hardening still occurs after 3 × 10
4 cycles. This process leads to RCA compaction, resulting in the increase of
Mr. It is expected that, for a large enough number of cycles, maximal compaction will occur akin to the remaining curves shown here. At this point,
Mr is expected to reach its highest value, after which the degradation phenomena should take place.
Calculations on the plastic strain accumulation
led to the estimation of the function describing the permanent strain growth as a function of the number of cycles. The function was of the type:
where
A and
b are constants of the function estimated on the basis of the 100th cycle, during which no excessive plastic strain was observed, while
N stands for the number of cycles. The details concerning constants
A and
b are presented in
Table 5.
The plastic strain development depends on the maximal deviator stress at failure
qf max (see
Table 2). The coefficients
A and
b can be calculated from
qf max (obtained from the static triaxial tests), stress characteristic parameters and confining pressures.
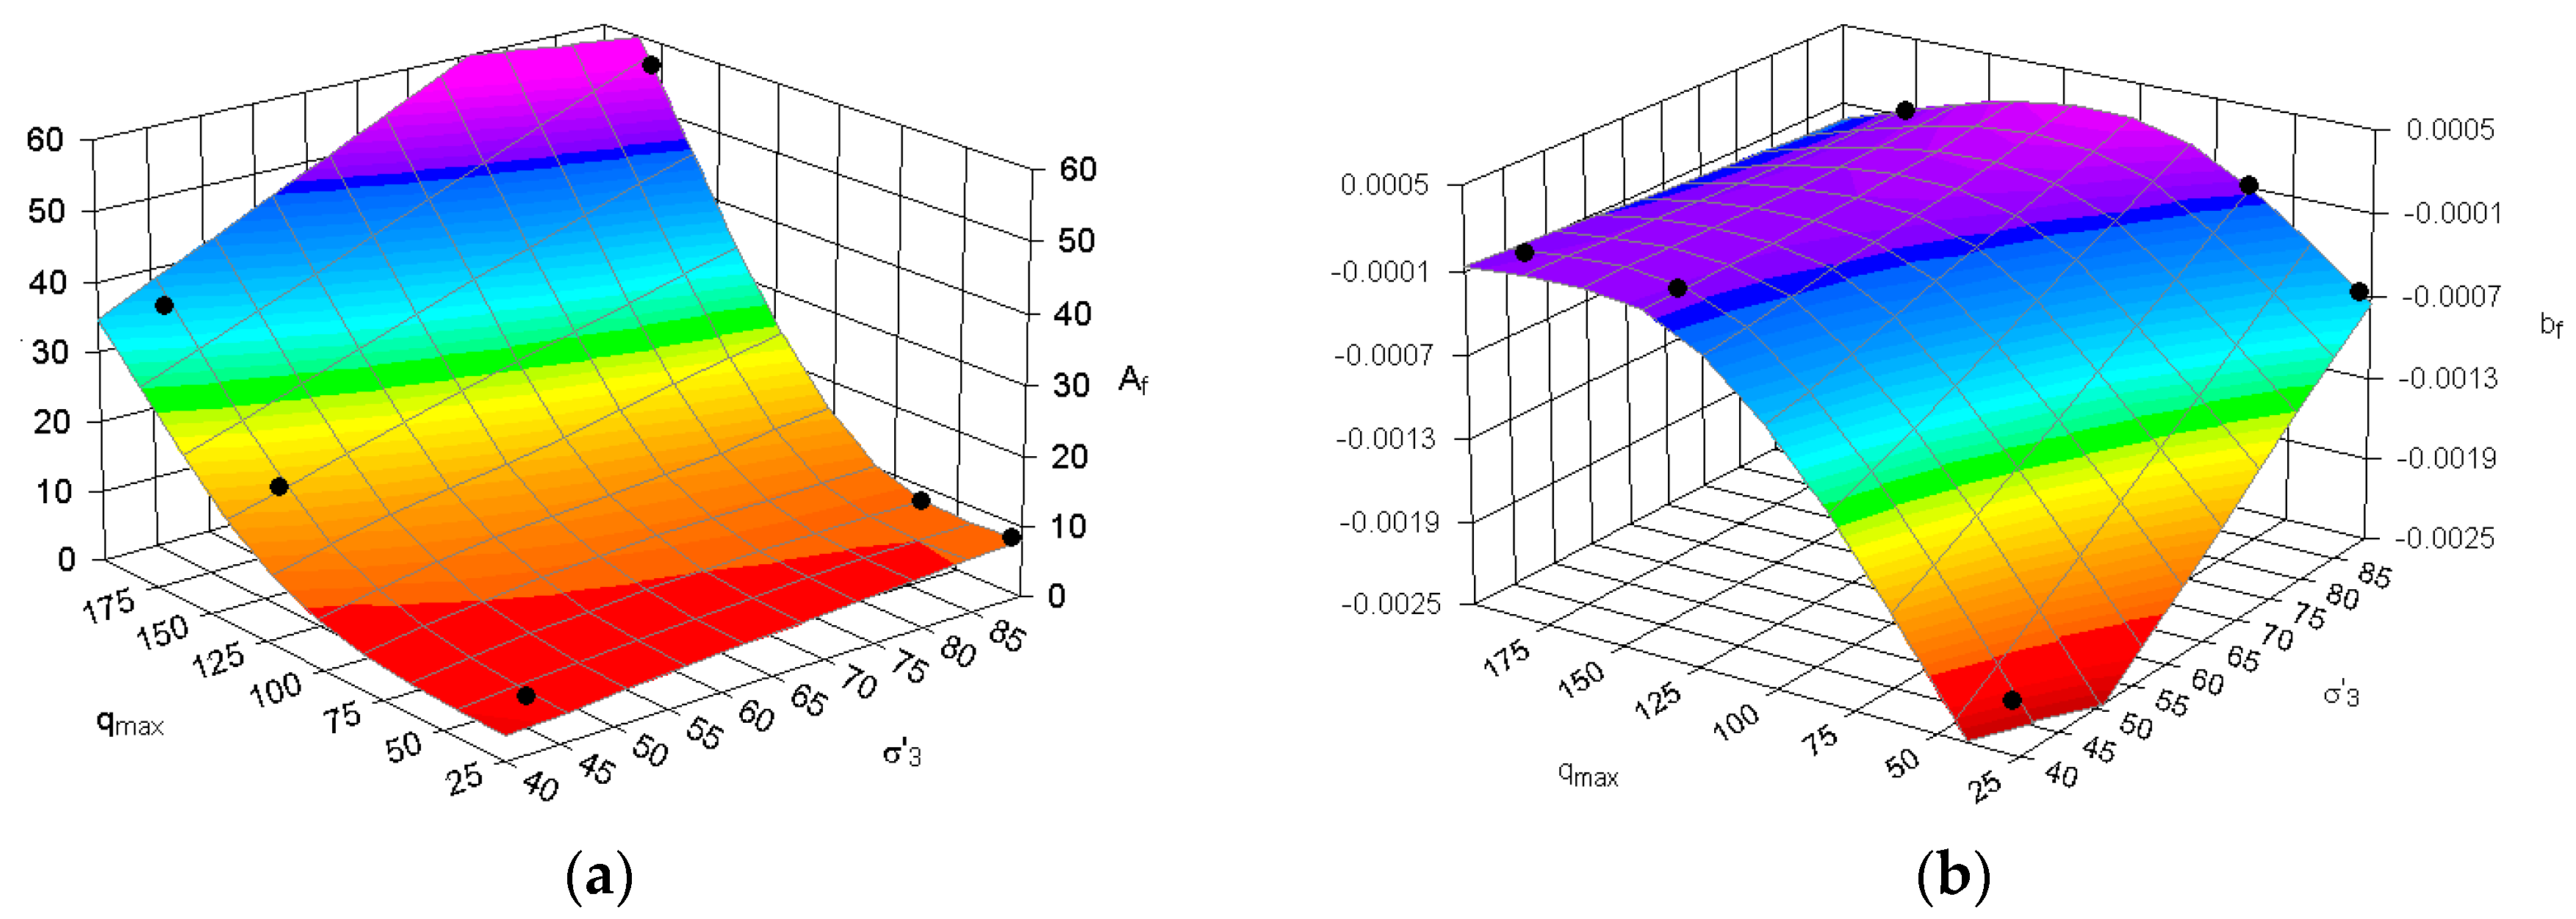
The relation between
A and
qf max is governed by the
Af parameter, which is given by:
The right-hand side for Equation (4) can be expanded as:
where the coefficients
to
are free parameters:
= 6.349408224;
= −15.0083947;
= −0.06046039;
= 0.002098017; and
= −0.00033319. The
R2 value for Equation (5) equals 0.999. A plot of Equation (5) with its corresponding experimental data is shown in
Figure 12a.
The parameter b
f relates to
,
and
according to:
with
bf given by:
In Equation (7),
to
are constants:
= 0.005293425;
= −0.4813725;
= 12.19047619;
= −0.17492899; and
= −3.099584519. The
R2 value for Equation (5) equals 0.747. A plot of Equation (7) with its corresponding experimental data is shown in
Figure 12b.
The functions describing
presented
R2 higher than 0.98 for all corresponding experiments (see
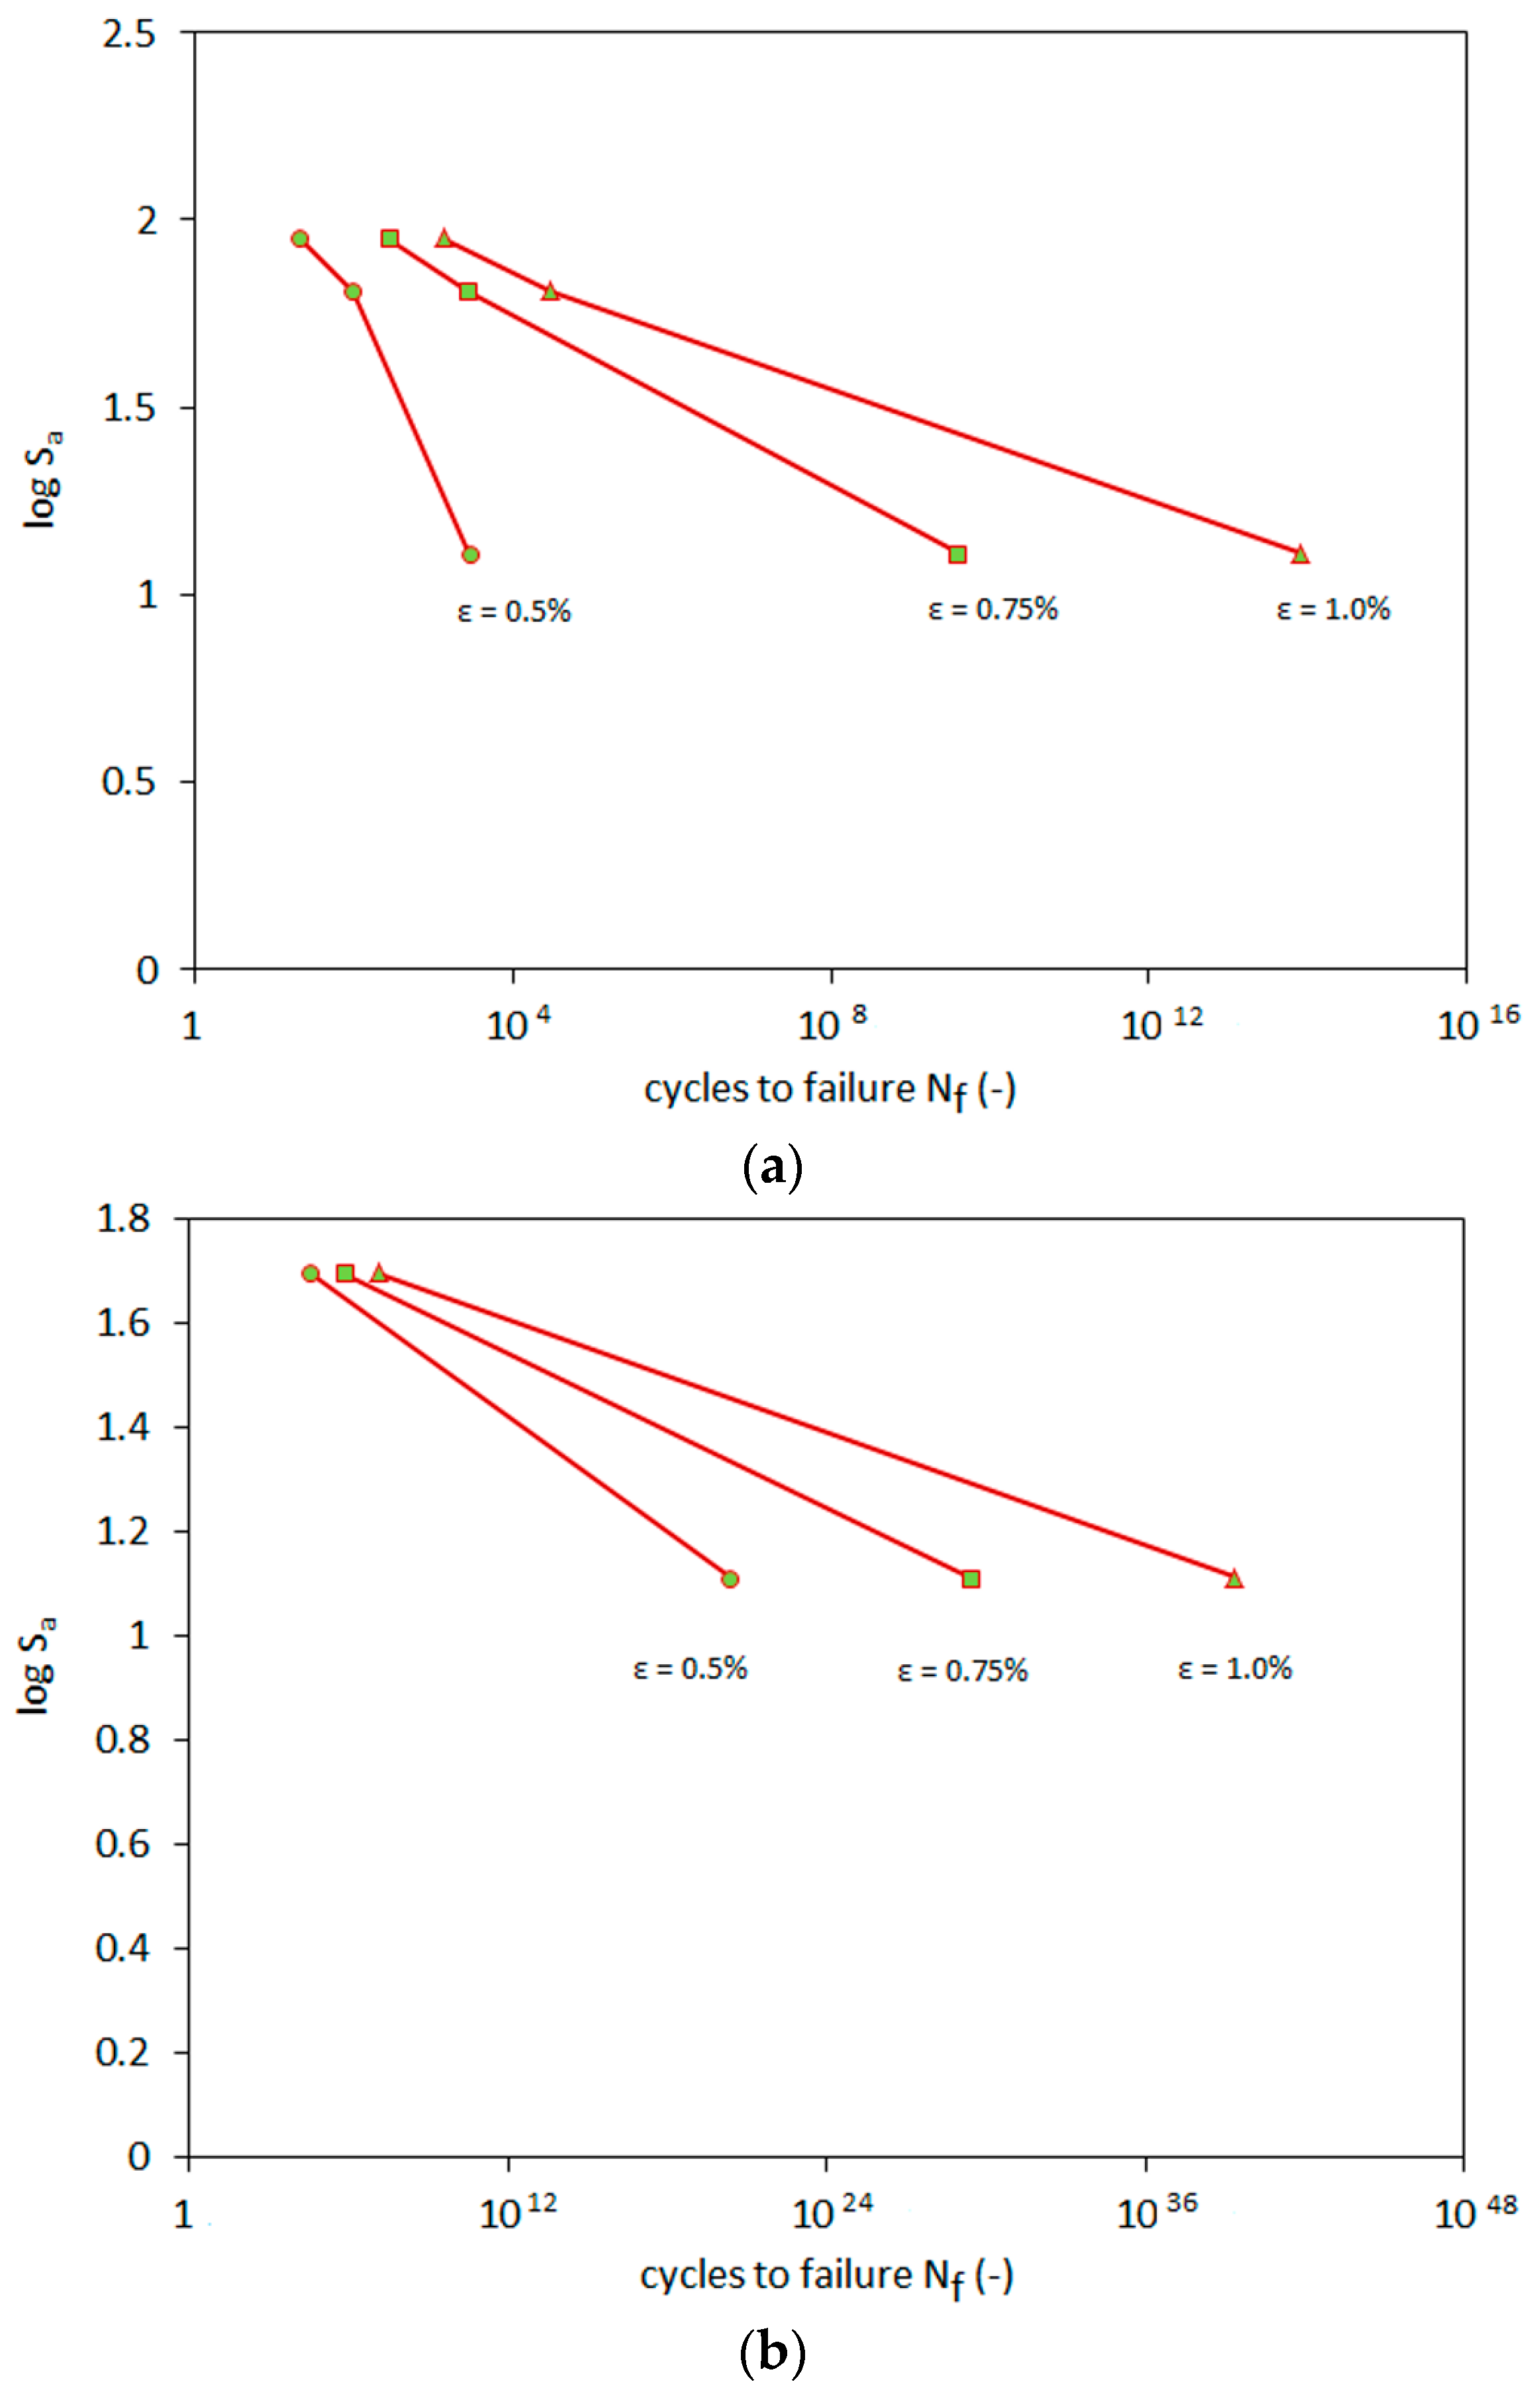
Table 5). The calculations of plastic strain were later employed to calculate the number of cycles until the failure (
Nf), which represents the largest strain predicted to occur in a designed structure. These results formed the basis of the stress-life method in the Wohler S-N diagram. The S-N diagram shows the stress amplitude
Sa as a function of the number of cycles, until the occurrence of the failure at
Nf. Results are presented in
Figure 13.
The plot of the S-N relationship in a log-log scale clearly indicates the power relationship of this characteristic, which can be observed as a straight line in
Figure 13. This phenomenon refers to the Basquin proposition of the log-log strain line in the S-N relationship, confirming this phenomenon.
The S-N relation is well described by:
with
C and
d adjustable free parameters. Their values for all tests are shown in
Table 6.
The results of the calculations show that the increase of the allowed design strains also raises the number of fatigue cycles. During the first phases of loading, plastic strain accumulations become more prominent. This results in earlier cycles having greater impact on the fatigue criterion. Therefore, the RCA material should be preloaded numerous times by the maximal designed stress during the project-building phase. This should prevent major plastic strains at the beginning of the exploitation phase of the construction. The RCA behaves in accordance with the Basquin law. The characteristic ‘knee’, which can be observed in other materials, was not observed during the RCA tests.


