
Comparison of Ductile-to-Brittle Transition Behavior in Two Similar Ferritic Oxide Dispersion Strengthened Alloys


Abstract
:
1. Introduction
2. Materials and Experimental Procedure
2.1. Materials
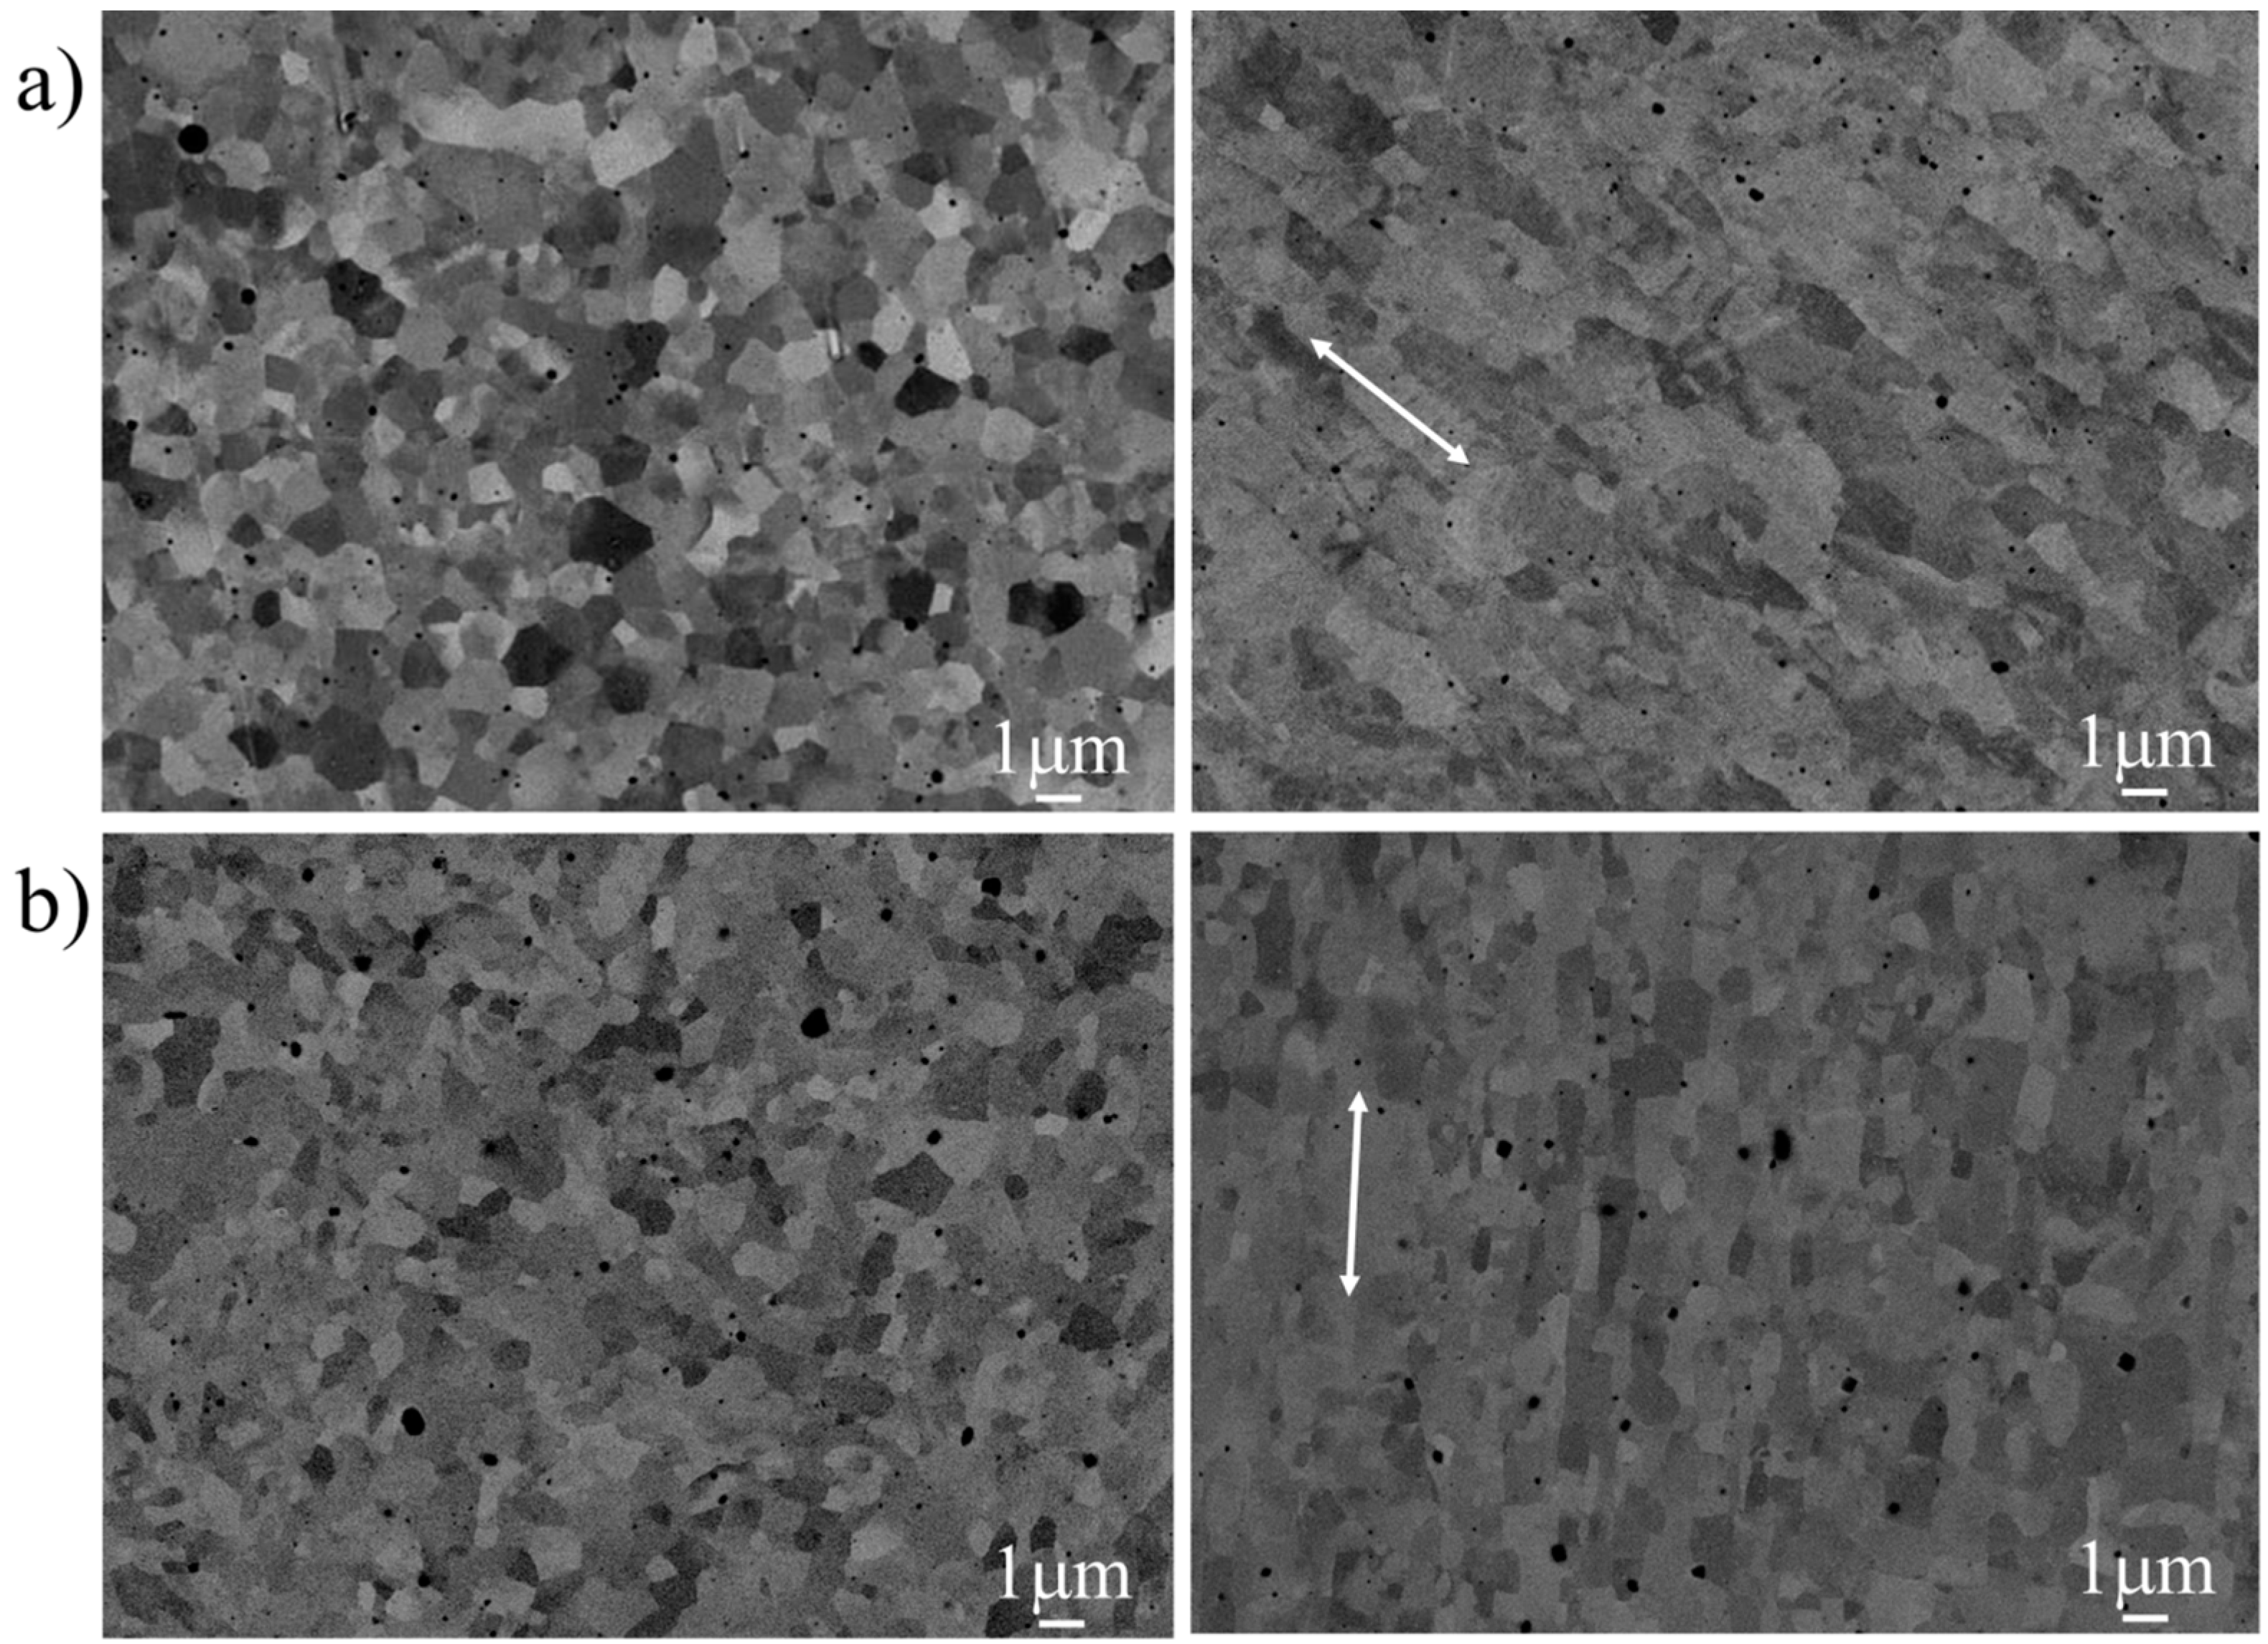
2.2. Microstructure
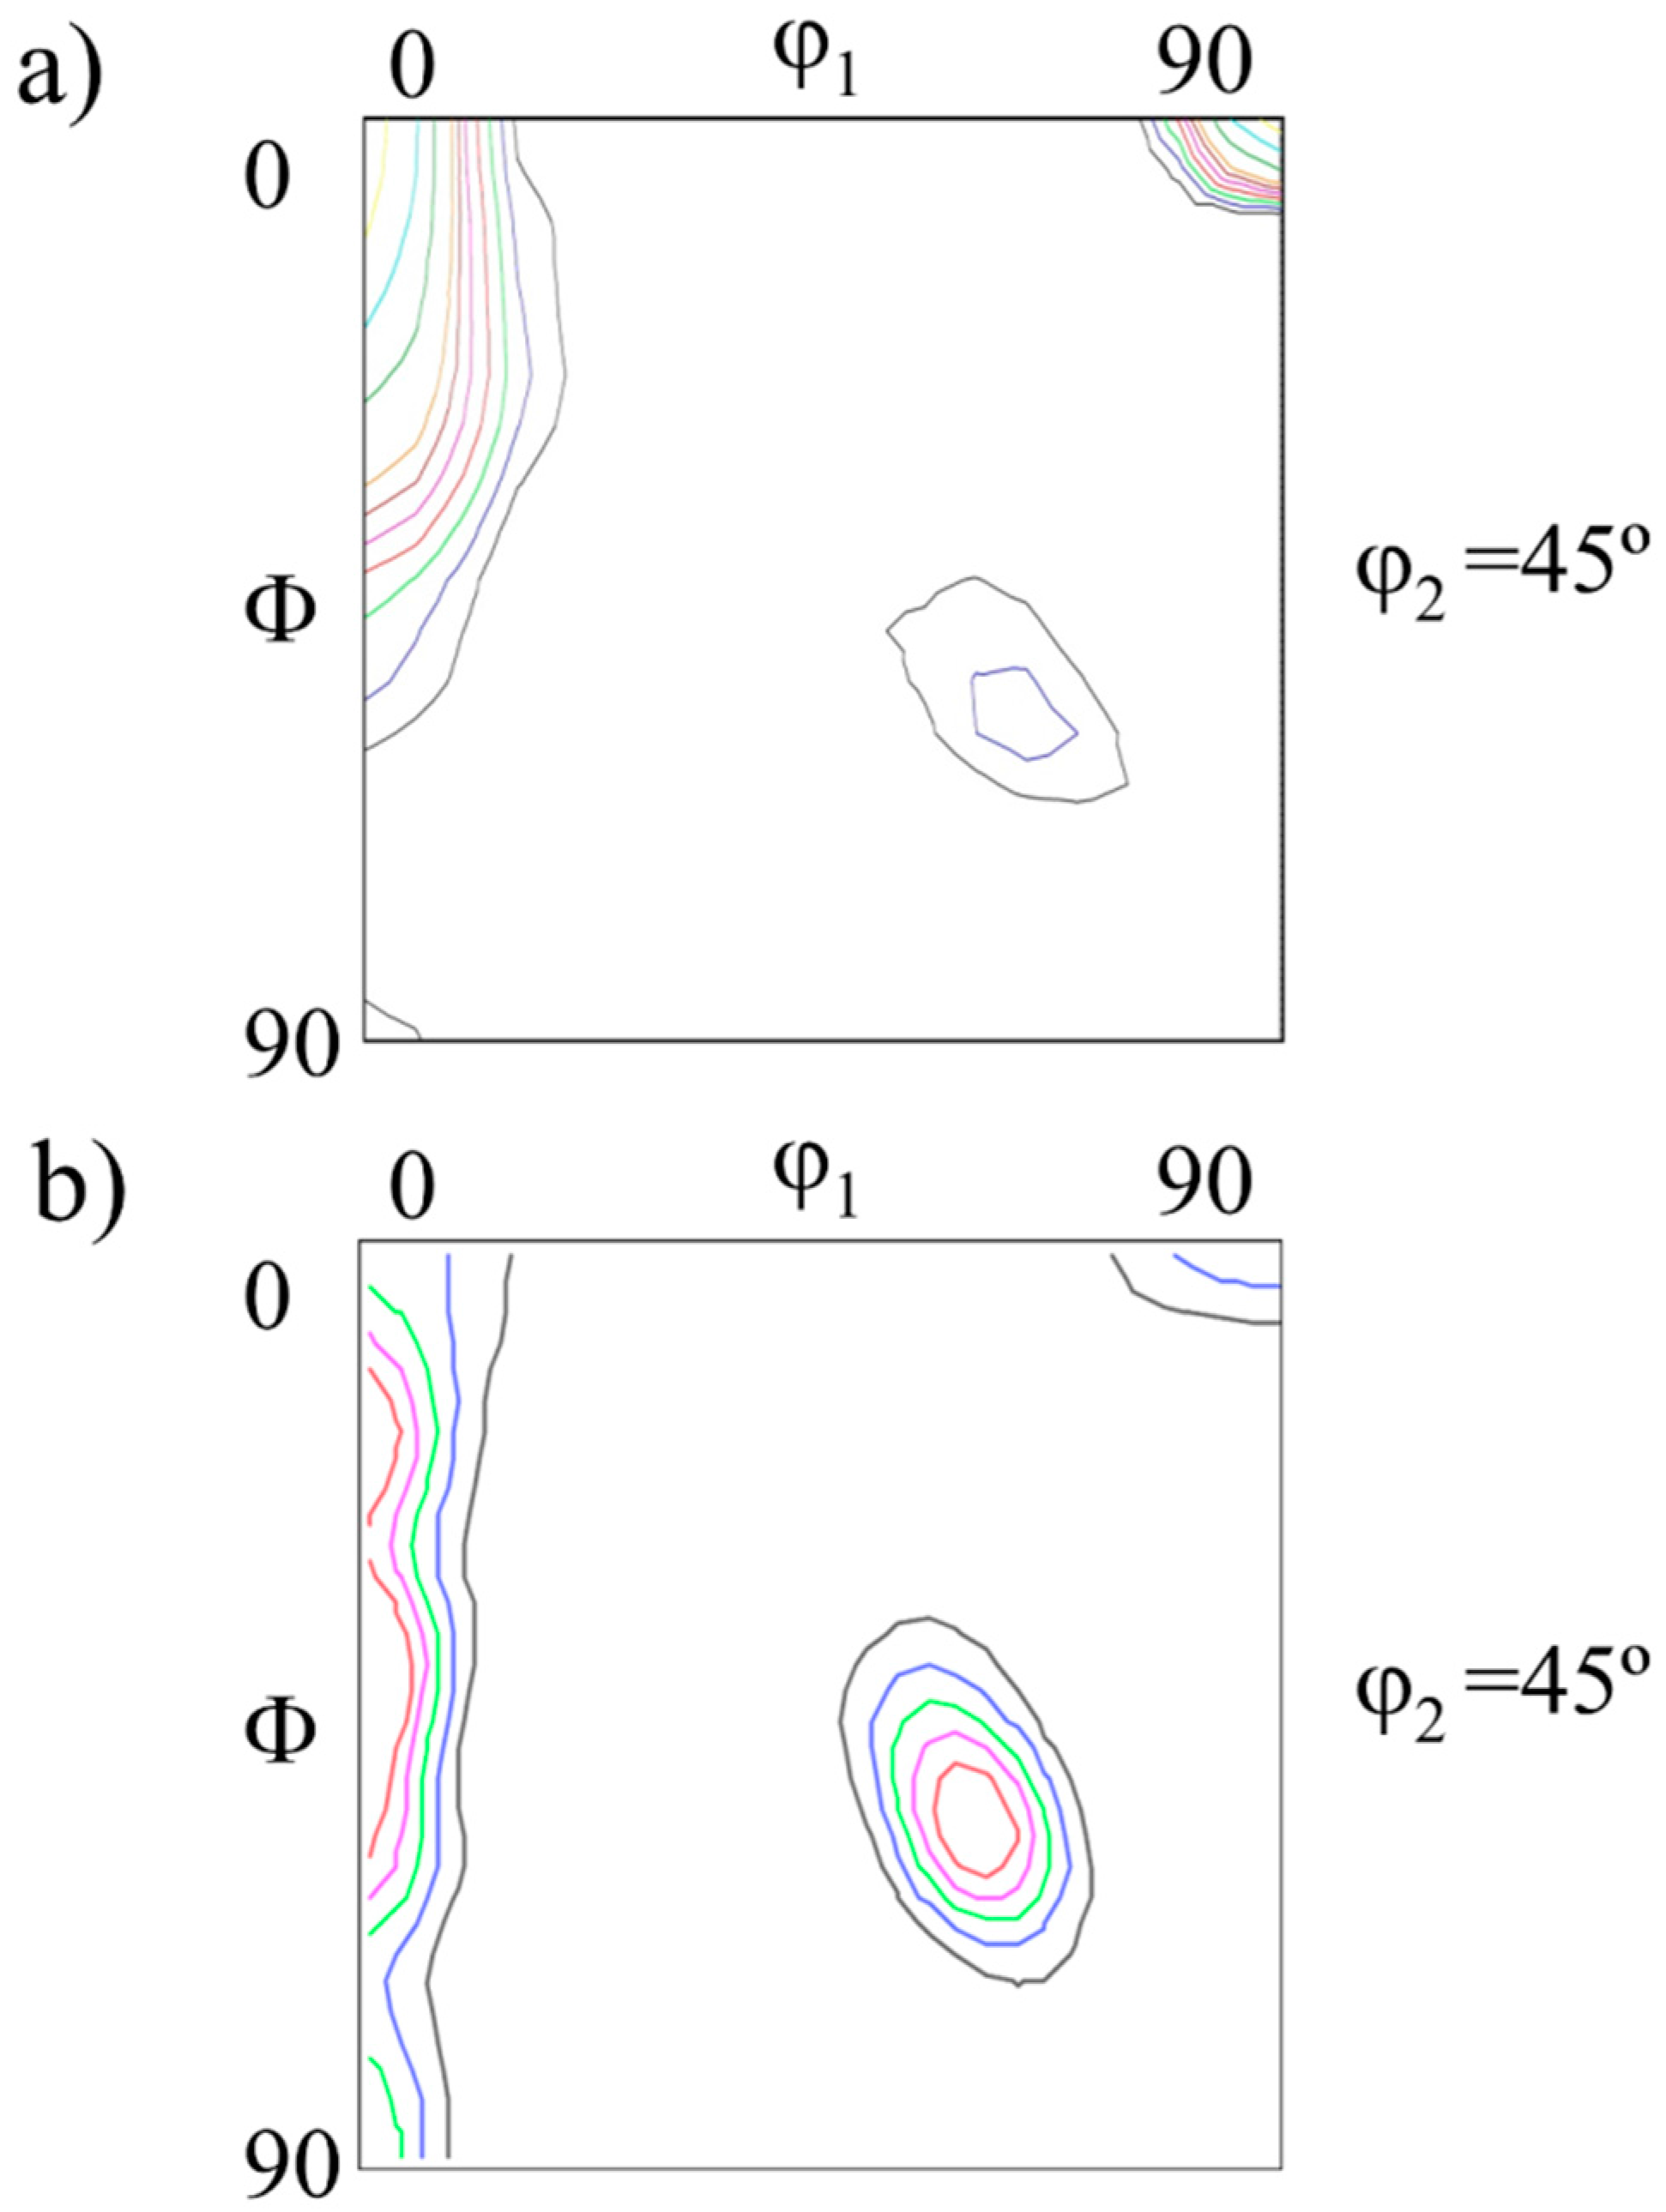
2.3. Texture
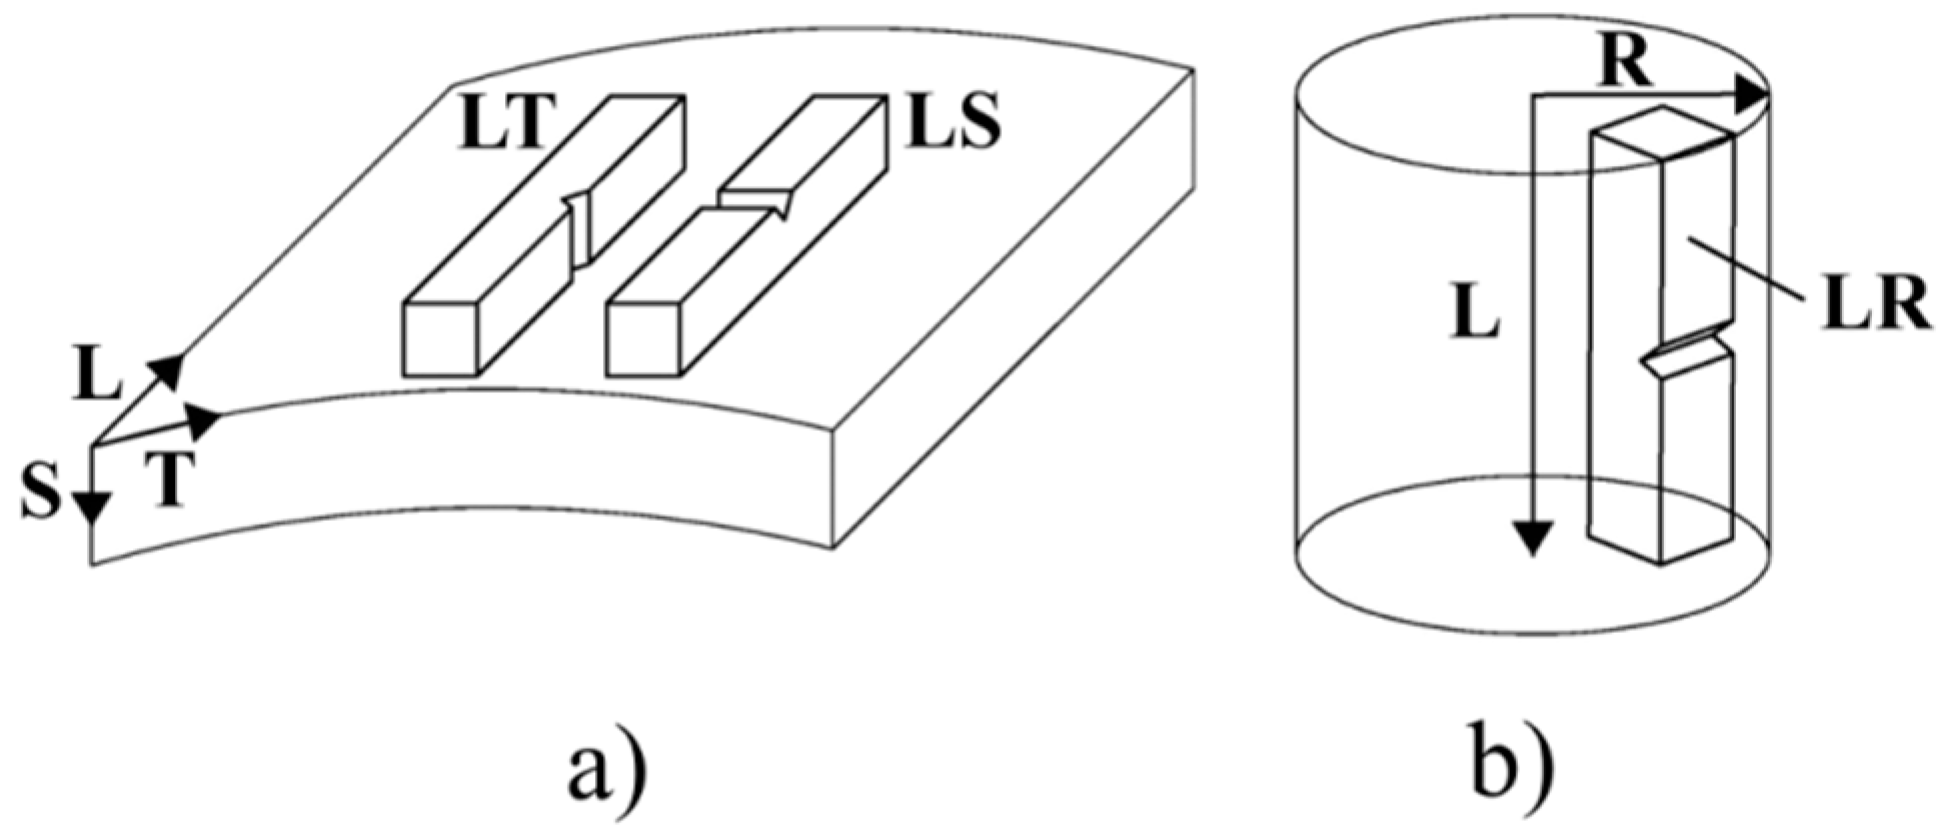
2.4. Mechanical Testing
3. Experimental Results
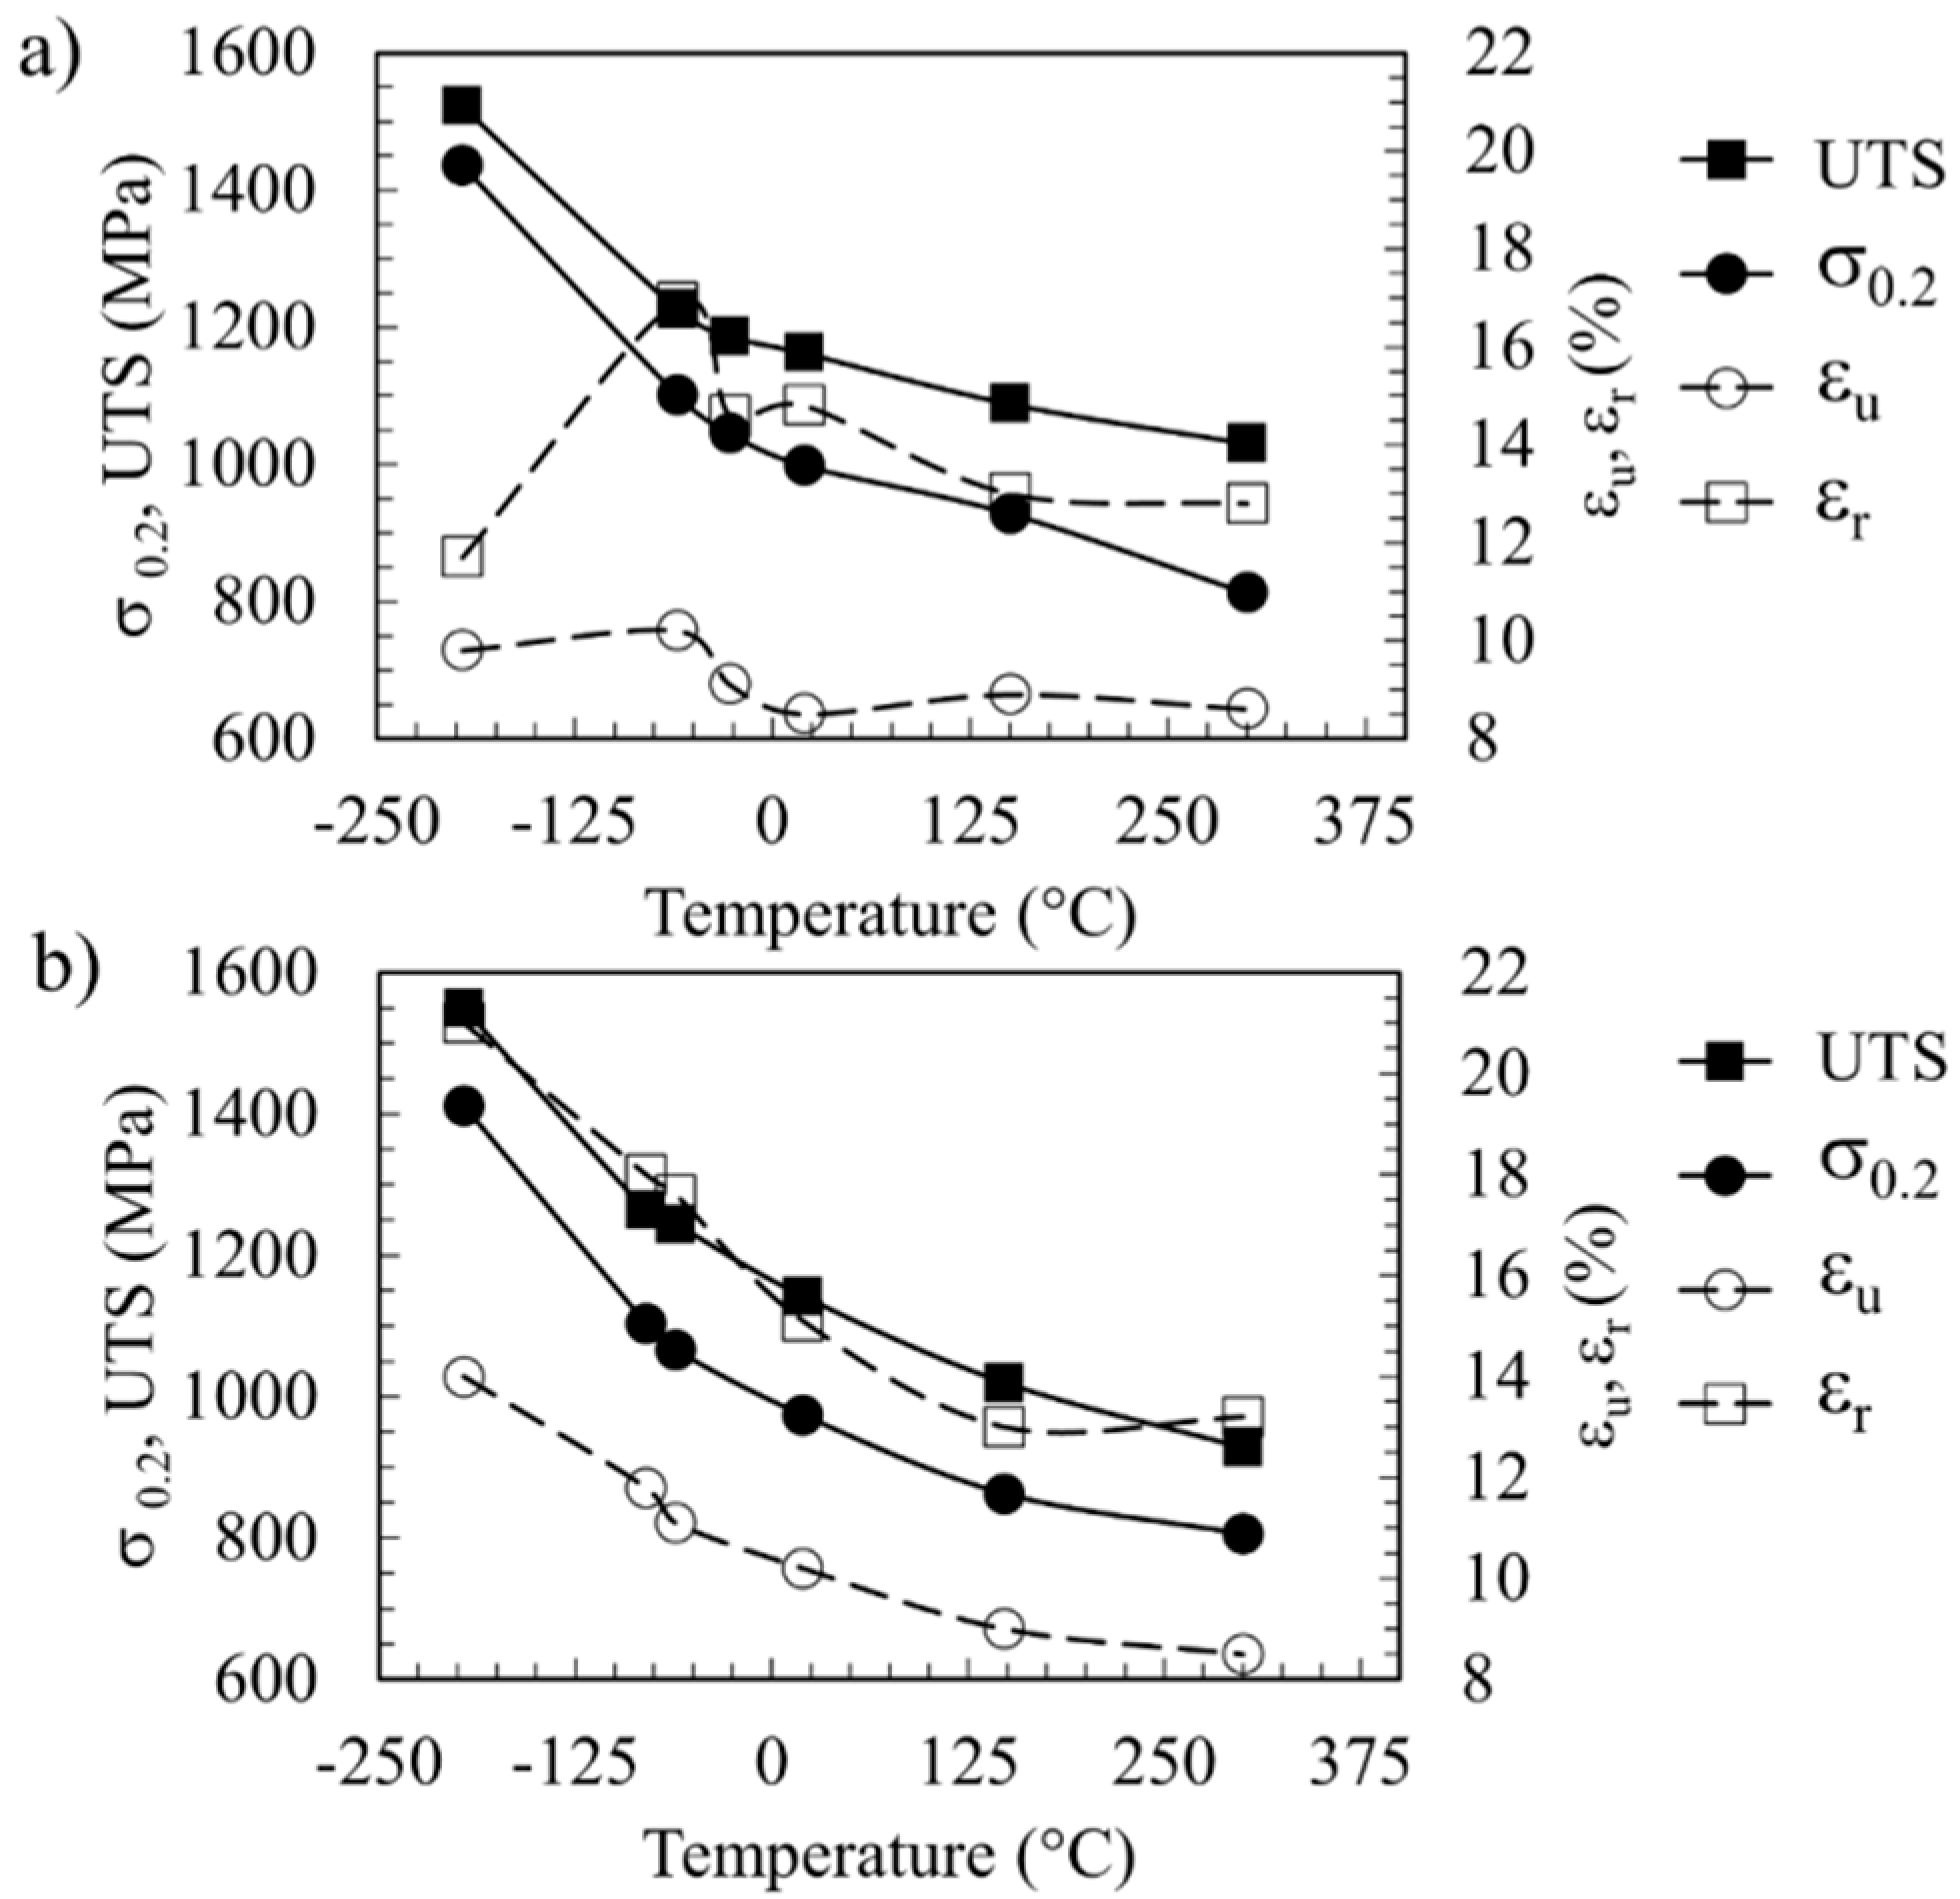
3.1. Tensile Tests
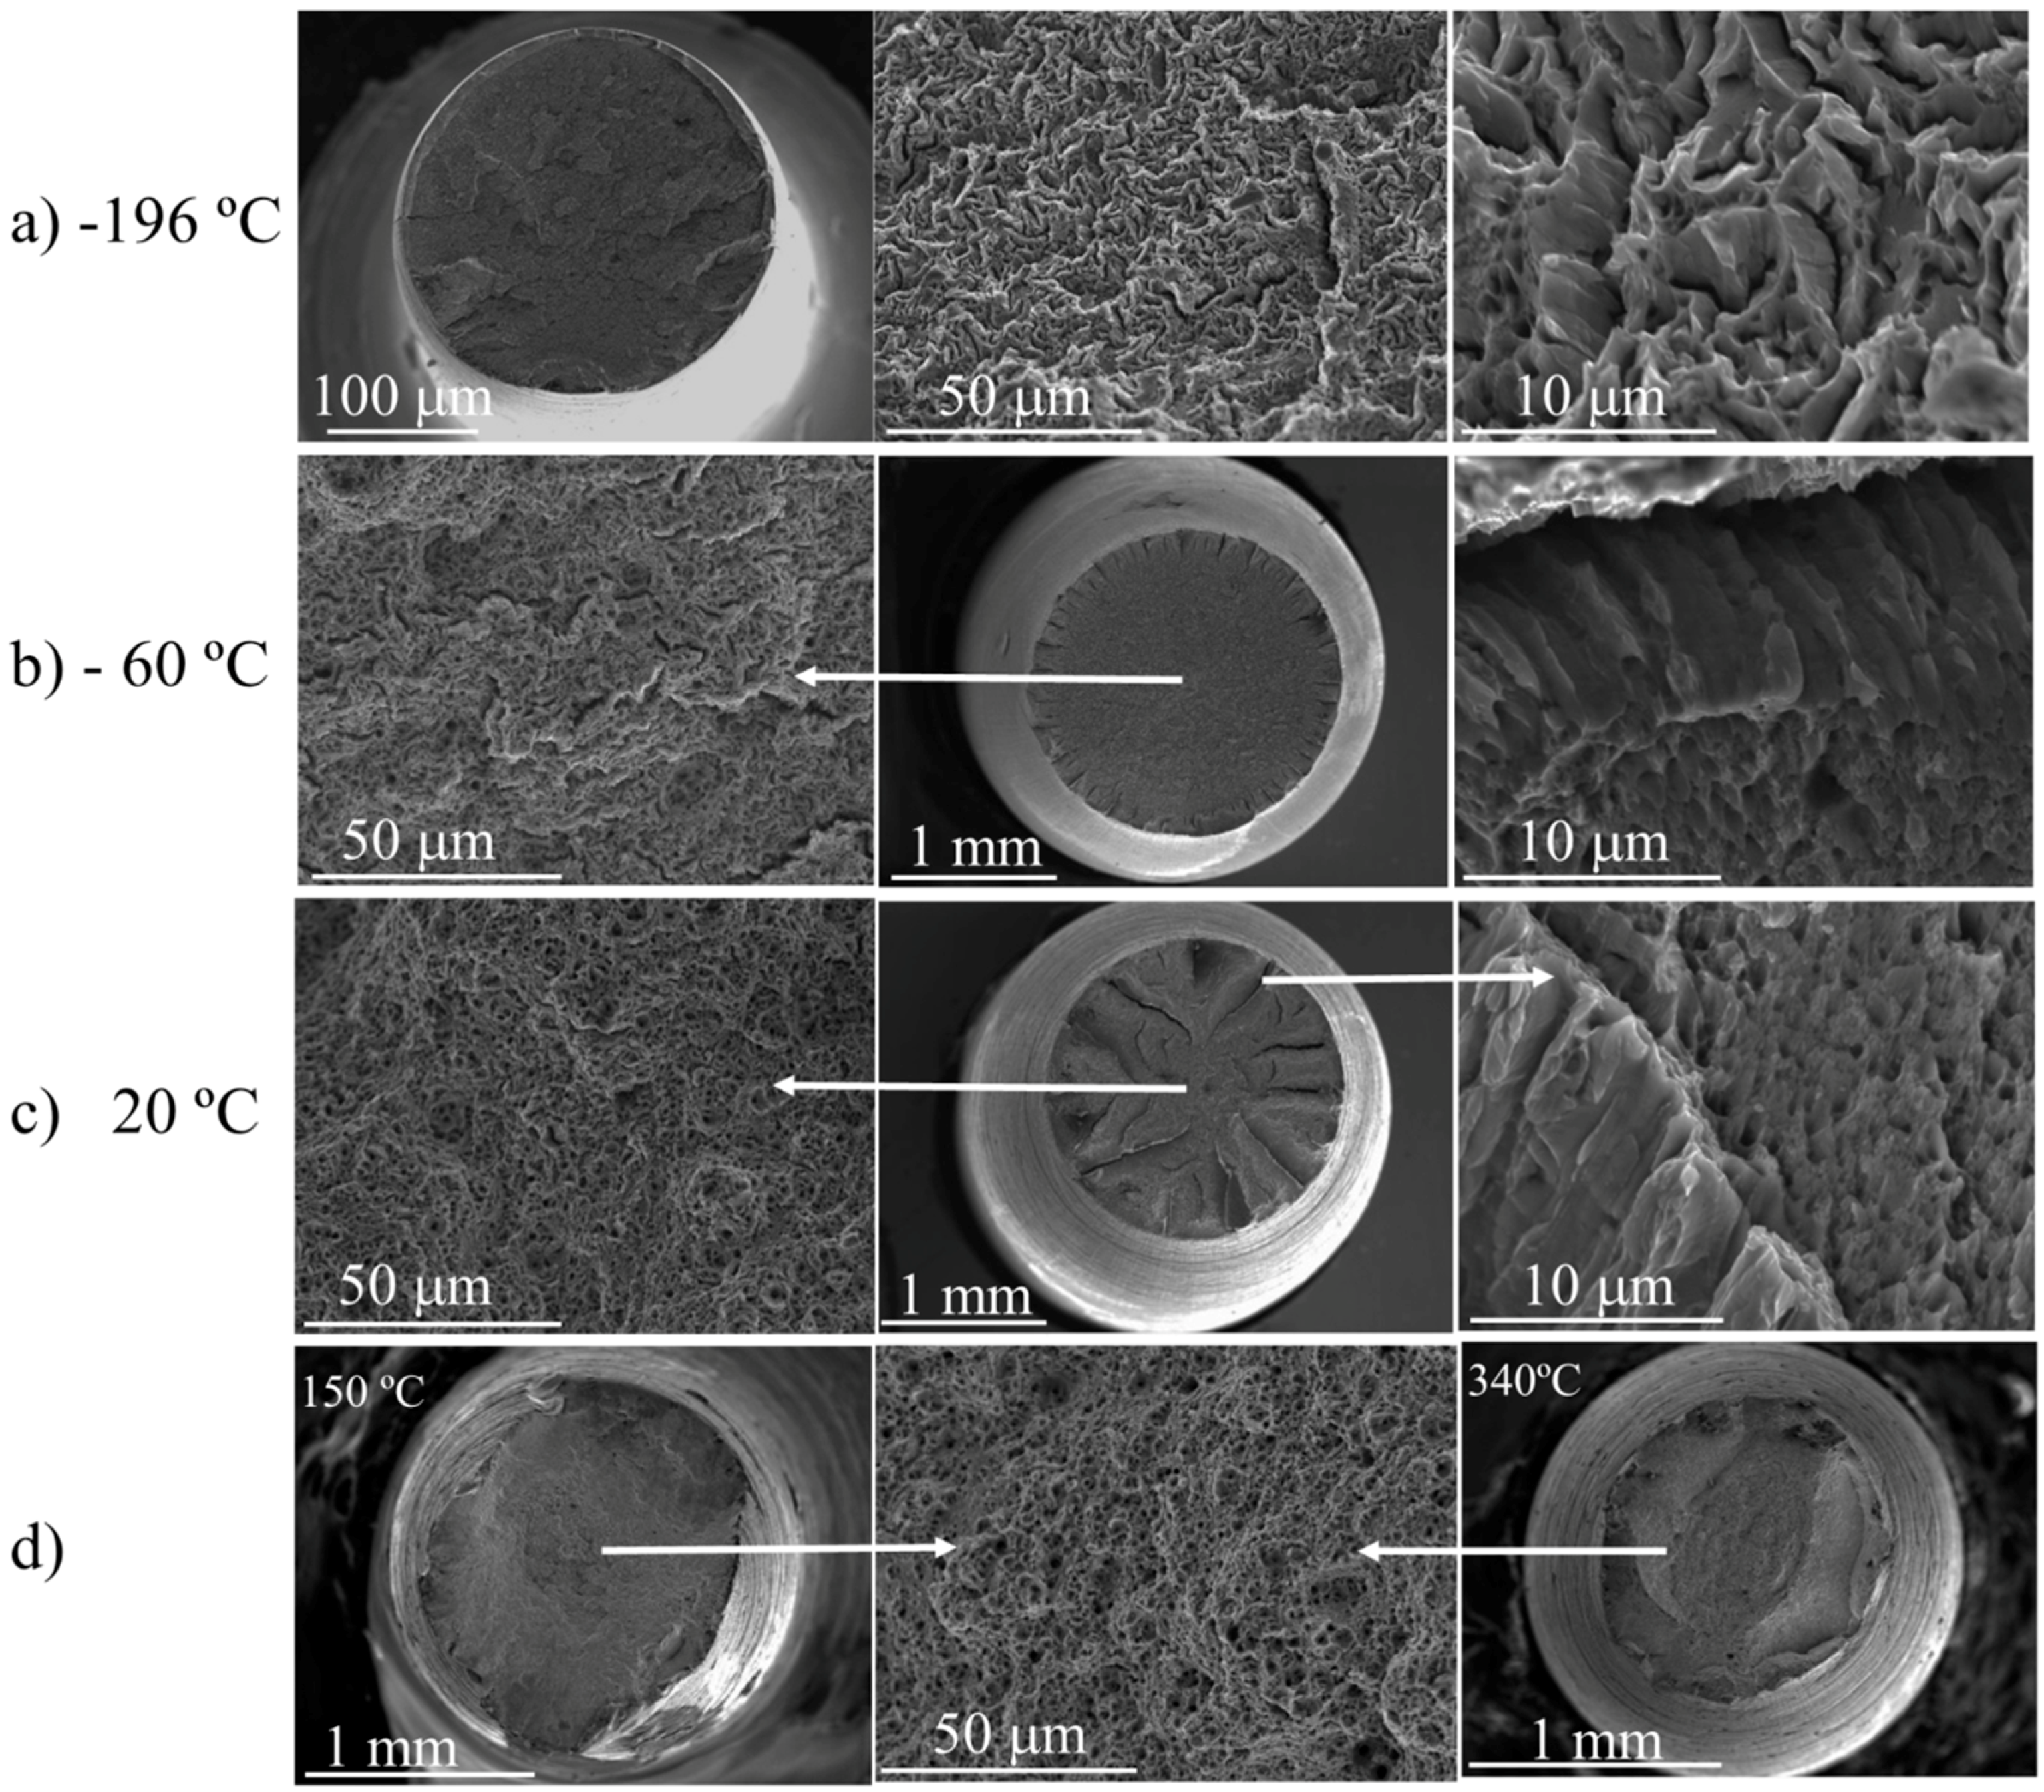
Fracture Analysis of Tensile Specimens
3.2. Charpy Impact Tests
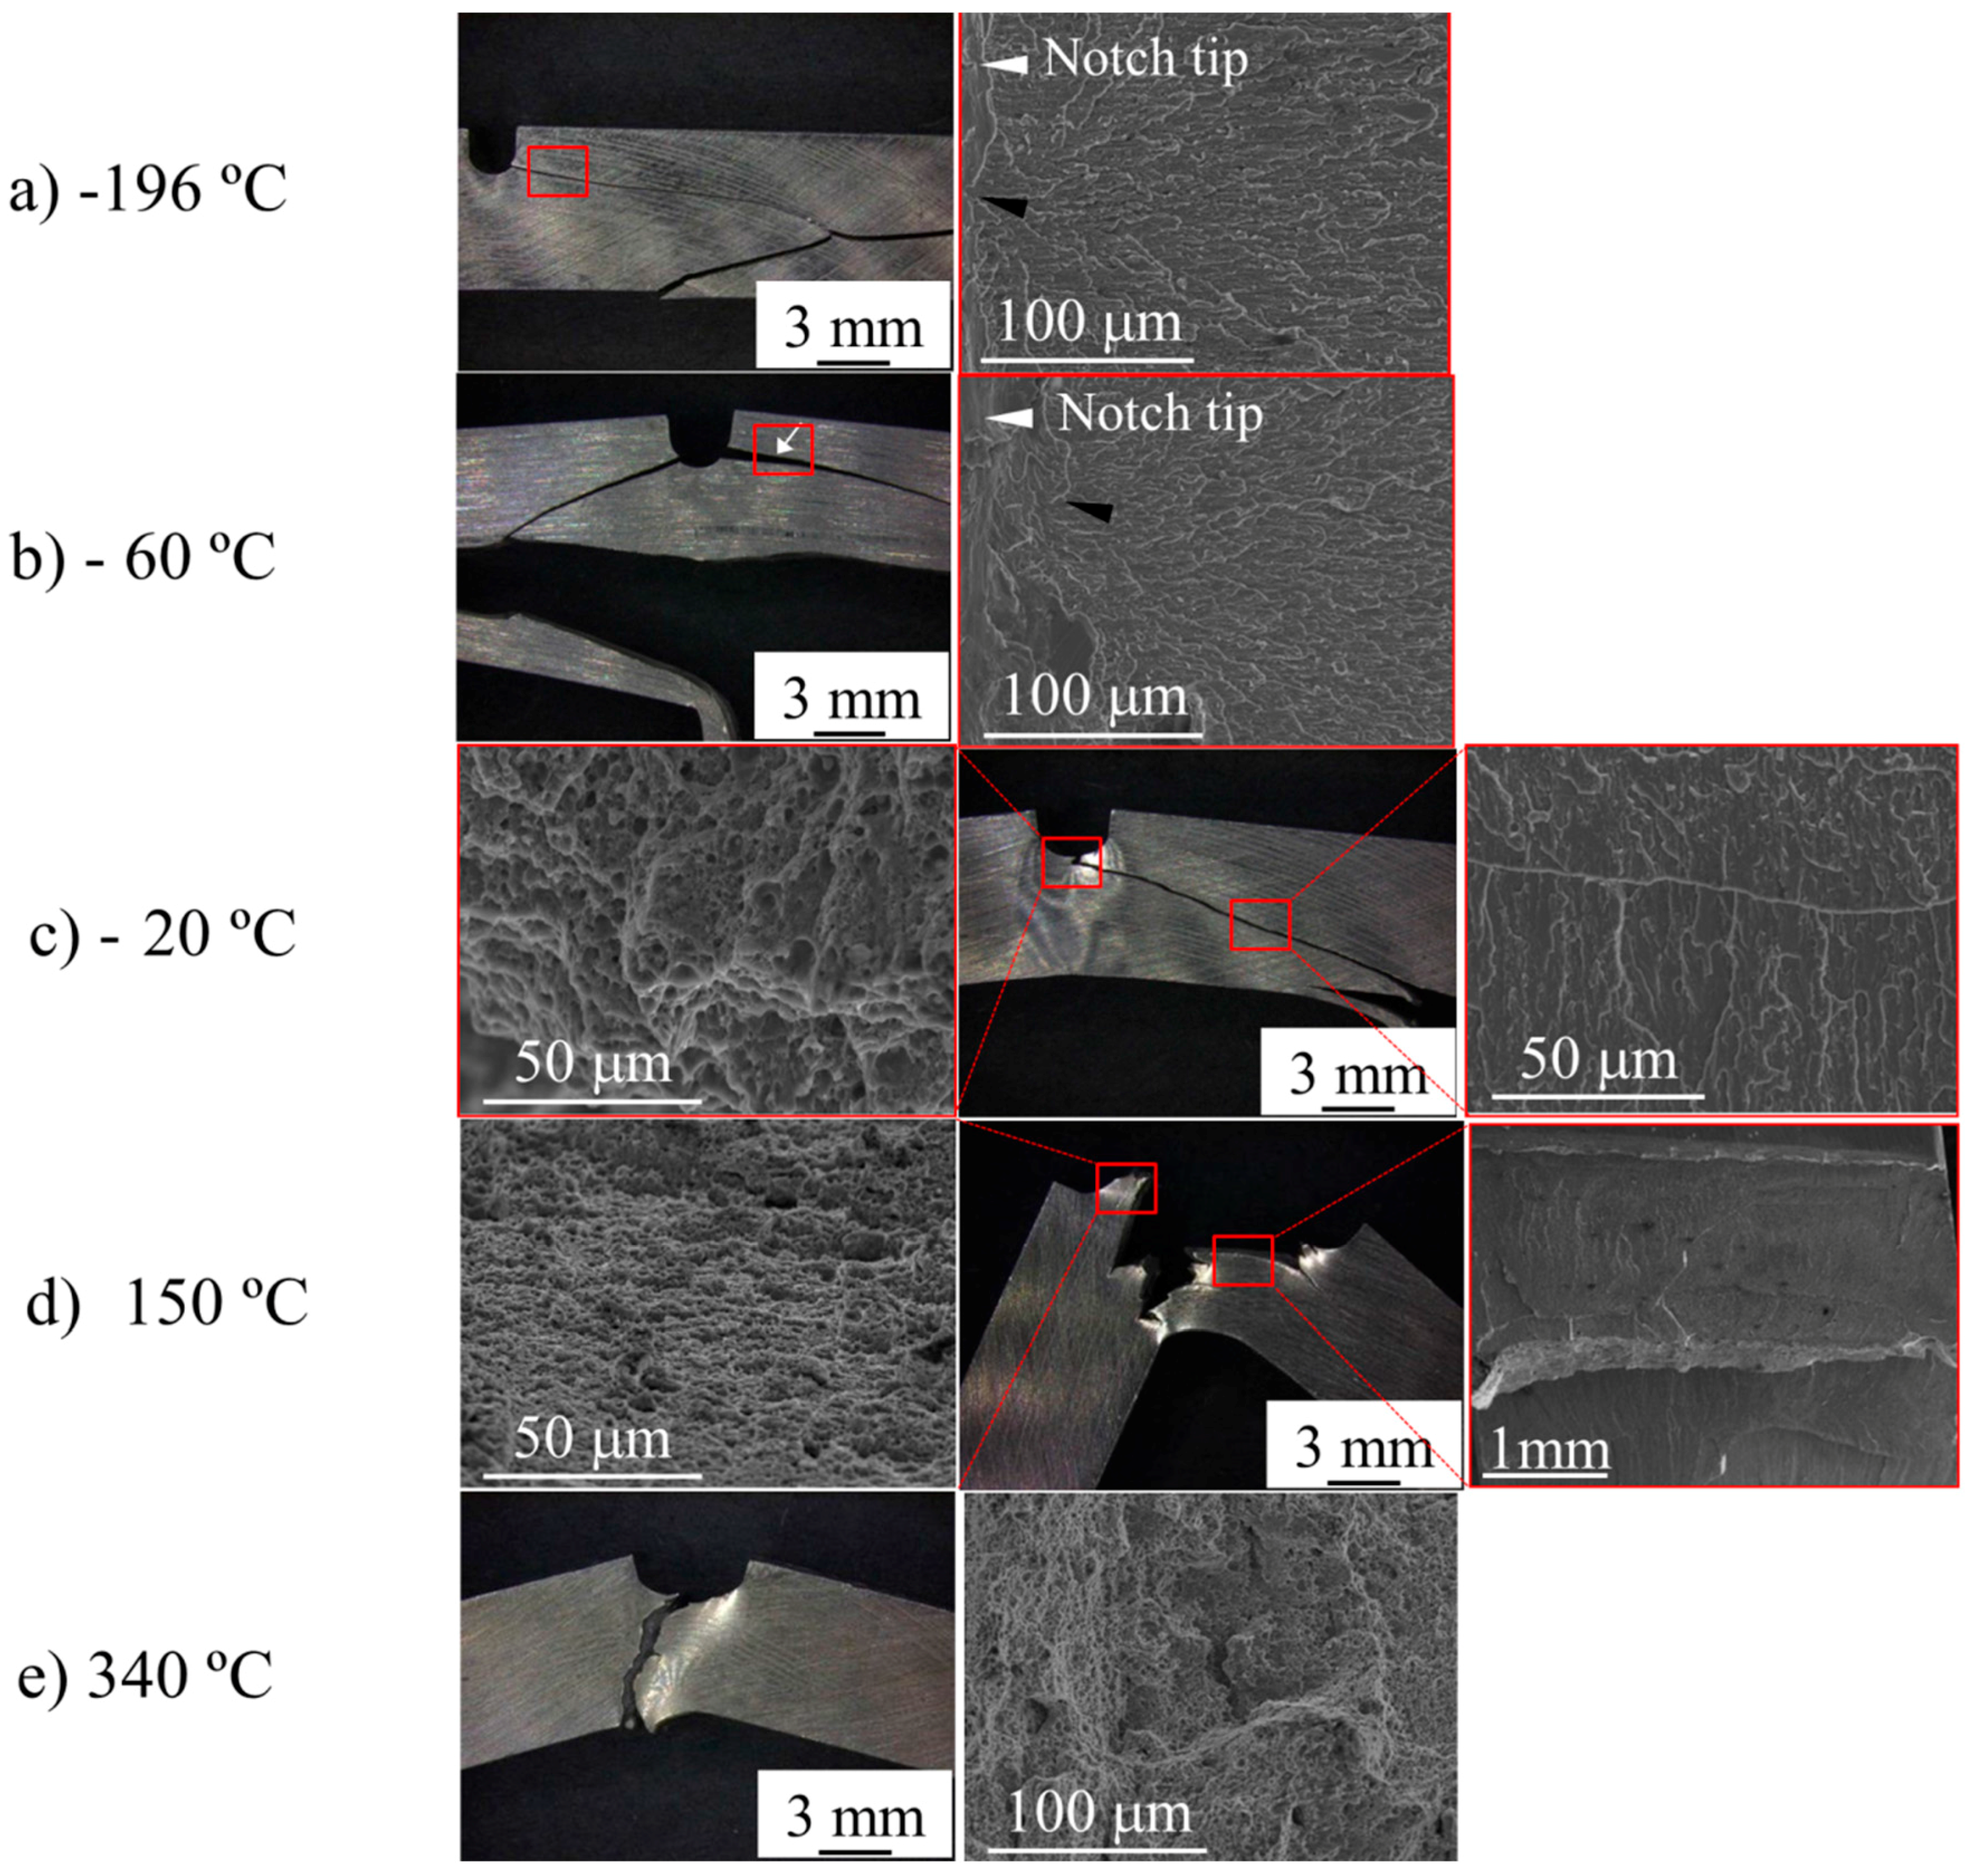
3.2.1. Fracture Analysis of Tested Charpy Impact Specimens
LT Specimens of PM2000 Alloy
LS specimens of PM2000 Alloy
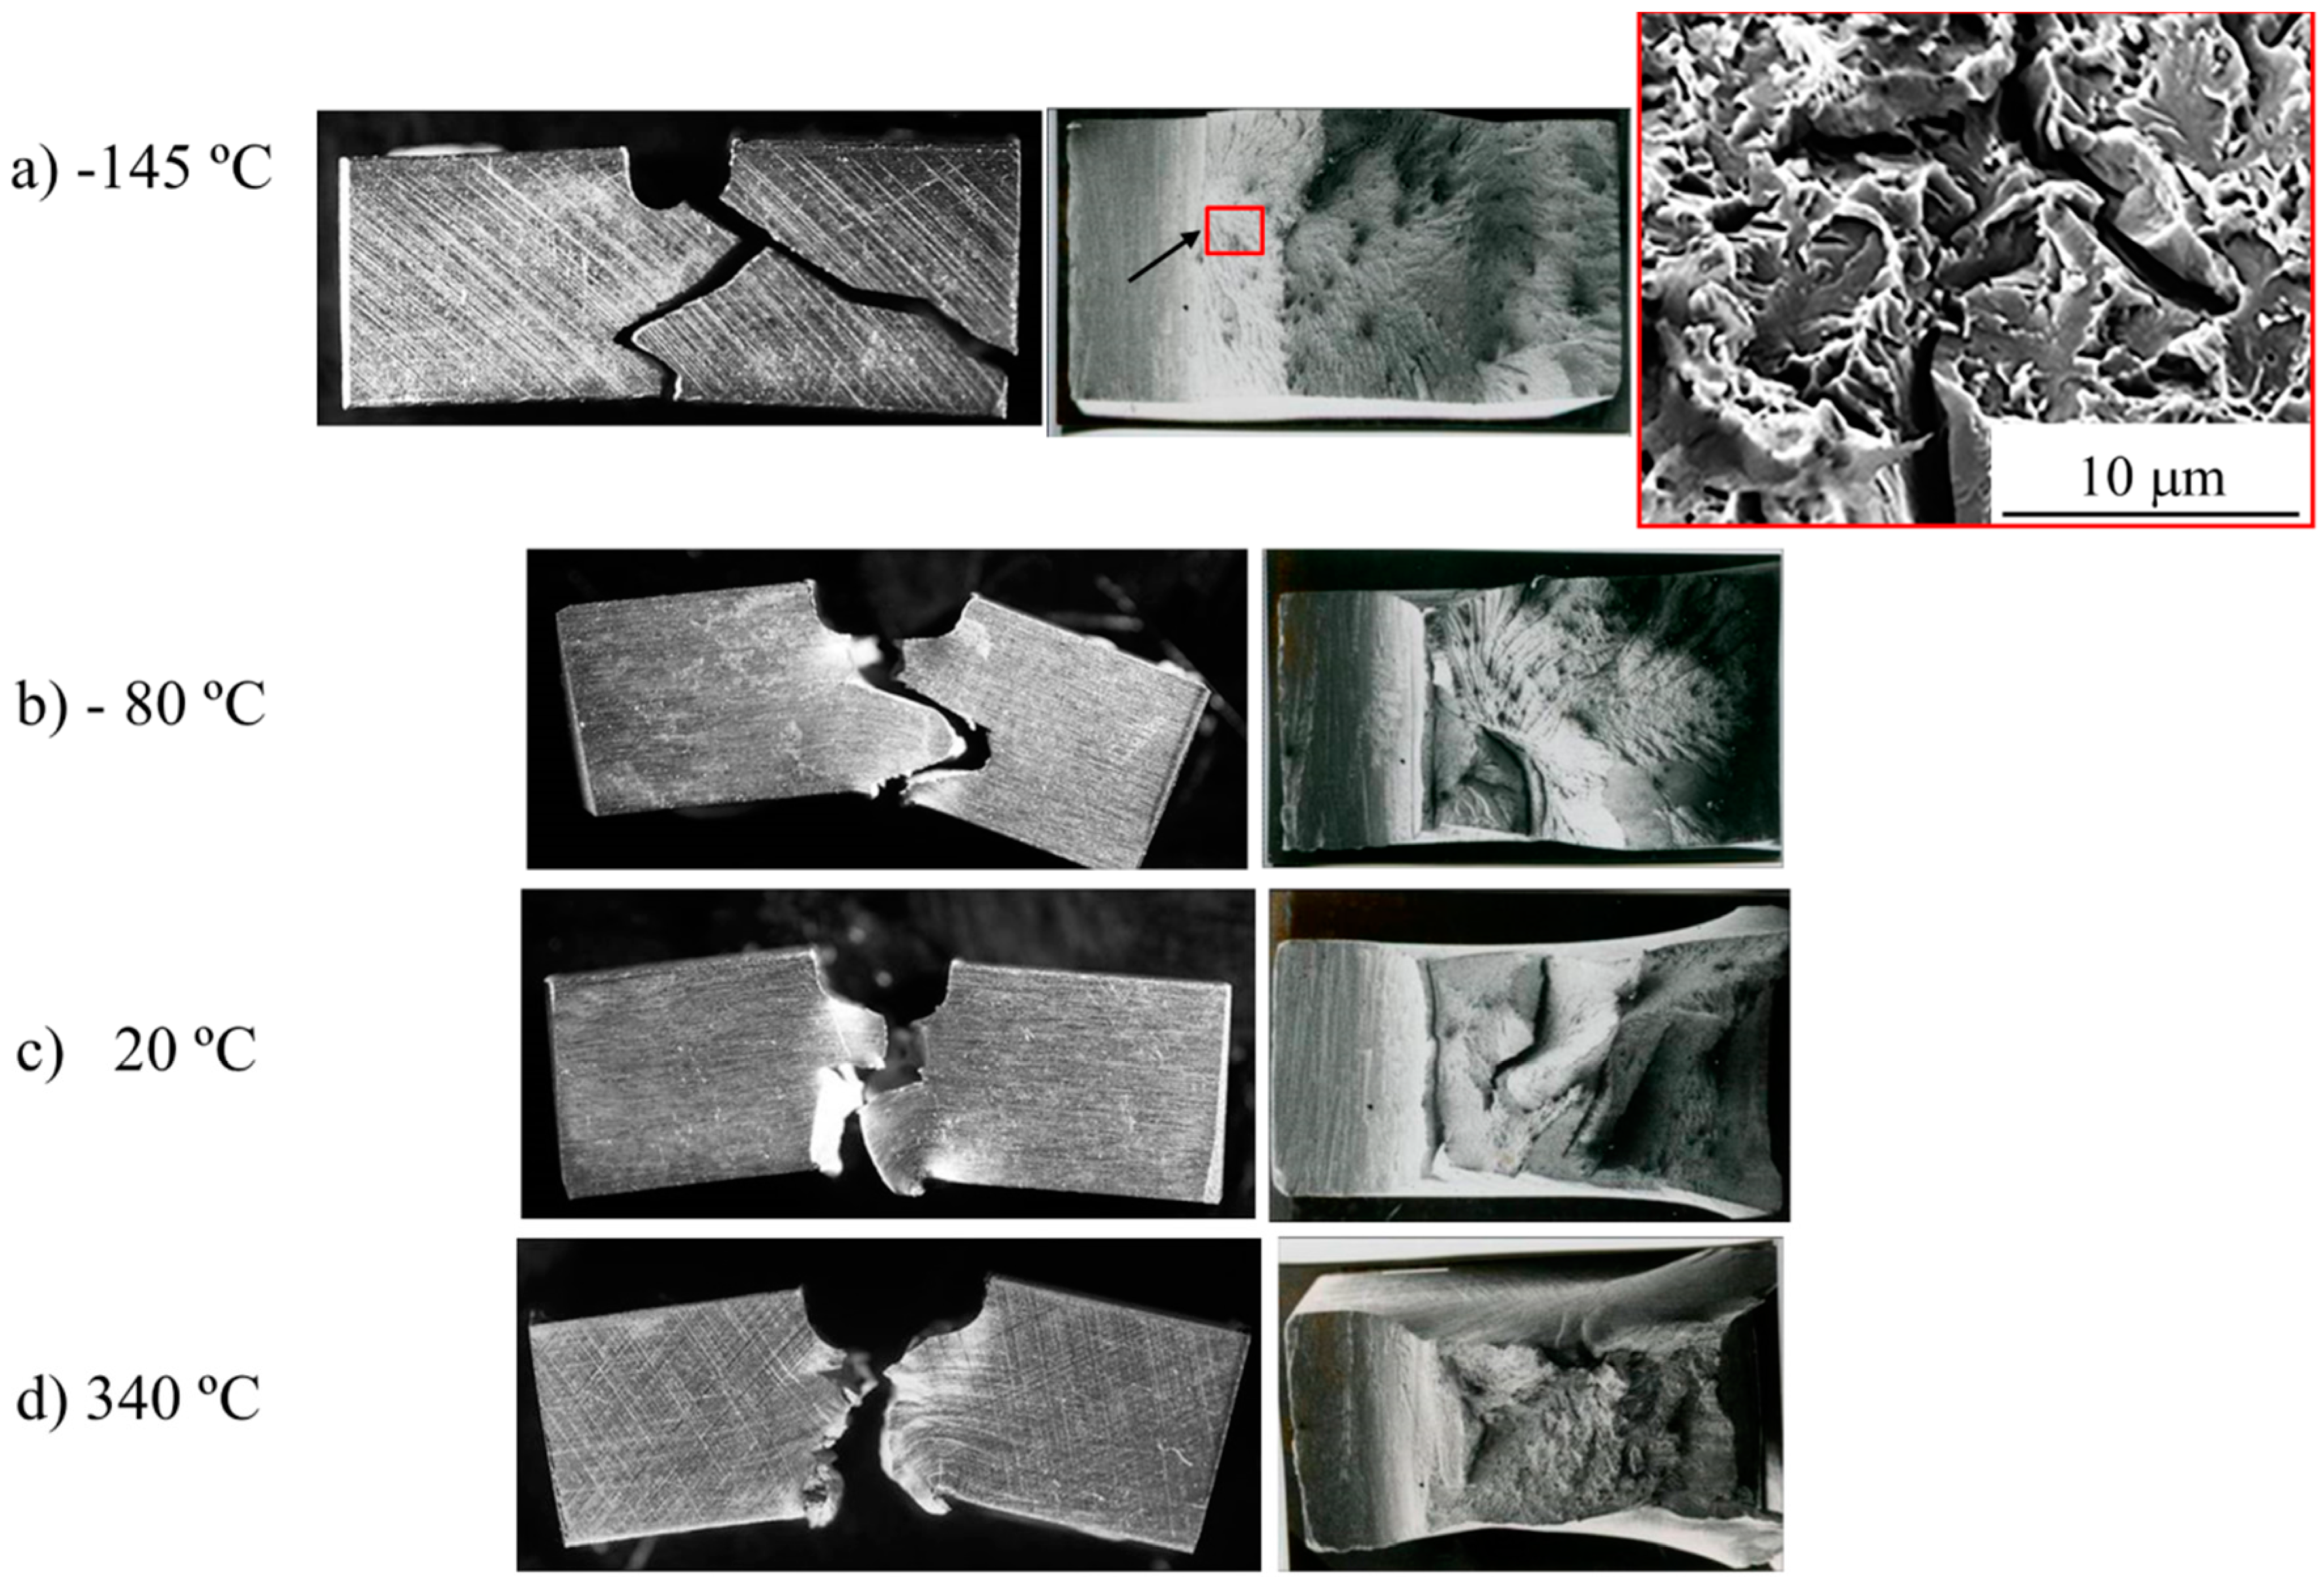
MA956 Alloy
4. Discussion
4.1. Chemical Composition
4.2. Texture
5. Conclusions
- Hot-extrusion and hot-rolling manufacturing routes do not induce significant differences in the as-received microstructure, but do cause slight changes in the homogeneity of the texture and oxide distribution. Such differences do not indicate meaningful changes in the tensile properties of both MA 956 and PM 2000 ODS ferritic stainless steels, but significant changes in the DBTT and USE.
- Despite the higher (C + N) content of the MA956 alloy (0.032%) than that of the PM2000 alloy (0.013%), which should cause DBTT(MA956) > DBTT(PM2000) and USE(MA956) < USE(PM2000), the opposite tendency is observed.
- This apparent contradiction could be explained on the basis of the particular texture in the as-received conditions of the two alloys. The MA956 alloy is transversely isotropic because of axisymmetric forming during the extrusion processing, whereas in the PM2000 alloy during the rolling processing, the tangential and radial directions become parallel to the <110> and <100> directions, respectively, with a strong {001}<110> component. That is, the (100) crystallographic plane parallel to the tube surface. Therefore, for LT notched specimens of the PM2000 alloy—in which the fracture advances in the “crack divider” mode—the delaminations cause a decrease in both the DBTT and USE with respect to those of monolithic material. However, for LS-notched specimens—in which the fracture advances in the “crack arrester” mode—the delaminations cause a decrease in the DBTT and an increase in the USE, although a convergence of the USE was observed at high temperatures.
Acknowledgments
Author Contributions
Conflicts of Interest
References
- Kishimoto, H.; Kasada, R.; Kimura, A.; Inoue, M.; Okuda, T.; Abe, F.; Ohnuki, S.; Fujisawa, T. Super Ods Steels r&d for Fuel Cladding of Next Generation Nuclear Systems 8; Ion Irradiation Effects at Elevated Temperatures. In Proceeding of the International Congress on Advances in Nuclear Power Plants, Tokyo, Japan, May 2009; ICAPP: Tokyo, Japan, 2009. [Google Scholar]
- Altstadt, E.; Serrano, M.; Houska, M.; García-Junceda, A. Effect of anisotropic microstructure of a 12cr-ods steel on the fracture behaviour in the small punch test. Mater. Sci. Eng. A 2016, 654, 309–316. [Google Scholar] [CrossRef]
- Hilger, I.; Boulnat, X.; Hoffmann, J.; Testani, C.; Bergner, F.; De Carlan, Y.; Ferraro, F.; Ulbricht, A. Fabrication and characterization of oxide dispersion strengthened (ods) 14cr steels consolidated by means of hot isostatic pressing, hot extrusion and spark plasma sintering. J. Nucl. Mater. 2016, 472, 206–214. [Google Scholar] [CrossRef]
- Serrano, M.; Hernández-Mayoral, M.; García-Junceda, A. Microstructural anisotropy effect on the mechanical properties of a 14cr ods steel. J. Nucl. Mater. 2012, 428, 103–109. [Google Scholar] [CrossRef]
- Gessinger, G.H.; Mercier, O. Mechanical properties and damping behaviour of an oxide-dispersion-strengthened ferritic steel ma 956. Powder Metall. Int. 1978, 10, 202–204. [Google Scholar]
- Franciosi, P. Glide mechanisms in b.C.C. Crystals: An investigation of the case of α-iron through multislip and latent hardening tests. Acta. Metallurgica 1983, 31, 1331–1342. [Google Scholar] [CrossRef]
- Ukai, S.; Harada, M.; Okada, H.; Inoue, M.; Nomura, S.; Shikakura, S.; Nishida, T.; Fujiwara, M.; Asabe, K. Tube manufacturing and mechanical properties of oxide dispersion strengthened ferritic steel. J. Nucl. Mater. 1993, 204, 74–80. [Google Scholar] [CrossRef]
- Lindau, R.; Möslang, A.; Schirra, M.; Schlossmacher, P.; Klimenkov, M. Mechanical and microstructural properties of a hipped rafm ods-steel. J. Nucl. Mater. 2002, 307–311, 769–772. [Google Scholar] [CrossRef]
- Klimenkov, M.; Lindau, R.; Möslang, A. New insights into the structure of ods particles in the ods-eurofer alloy. J. Nucl. Mater. 2009, 386–388, 553–556. [Google Scholar] [CrossRef]
- Olier, P.; Bougault, A.; Alamo, A.; de Carlan, Y. Effects of the forming processes and y2o3 content on ods-eurofer mechanical properties. J. Nucl. Mater. 2009, 386–388, 561–563. [Google Scholar] [CrossRef]
- Alinger, M.J.; Odette, G.R.; Lucas, G.E. Tensile and fracture toughness properties of ma957: Implications to the development of nanocomposited ferritic alloys. J. Nucl. Mater. 2002, 307–311, 484–489. [Google Scholar] [CrossRef]
- Cizek, P.; Wynne, B.P. A mechanism of ferrite softening in a duplex stainless steel deformed in hot torsion. Mater. Sci. Eng. A 1997, 230, 88–94. [Google Scholar] [CrossRef]
- Capdevila, C.; Chen, Y.L.; Lassen, N.C.K.; Jones, A.R.; Bhadeshia, H.K.D.H. Heterogeneous deformation and recrystallisation of iron base oxide dispersion strengthened pm2000 alloy. Mater. Sci. Technol. 2001, 17, 693–699. [Google Scholar]
- Capdevila, C.; Miller, U.; Jelenak, H.; Bhadeshia, H.K.D.H. Strain heterogeneity and the production of coarse grains in mechanically alloyed iron-based PM2000 alloy. Mater. Sci. Eng. A 2001, 316, 161–165. [Google Scholar] [CrossRef]
- Chao, J.; Capdevila, C.; Serrano, M.; Garcia-Junceda, A.; Jimenez, J.A.; Pimentel, G.; Urones-Garrote, E. Notch impact behavior of oxide-dispersion-strengthened (ods) fe20cr5al alloy. Metall. Mat. Trans. A Phys. Metall. Mat. Sci. 2013, 44, 4581–4594. [Google Scholar] [CrossRef]
- Hupalo, M.F.; Terada, M.; Kliauga, A.M.; Padilha, A.F. Microstructural characterization of incoloy alloy ma 956. Materialwis. Werkstofftech. 2003, 34, 505–508. [Google Scholar] [CrossRef]
- Czyrska-Filemonowicz, A.; Wróbel, M.; Dubiel, B.; Ennis, P.J. Transmission electron microscopy study of dislocation-dispersoid interaction in deformed incoloy ma956. Scr. Metall. Mater. 1995, 32, 331–335. [Google Scholar] [CrossRef]
- Astm e399–90. Annual Book of Astm Standards; American Society for Testing and Materials: Warrendale, PA, USA, 2011; pp. 502–534. [Google Scholar]
- Embury, J.D.; Petch, N.J.; Wraith, A.E.; Wright, E.S. Fracture of mild steel laminates. Trans. Metall. Soc. Aime 1967, 239, 114. [Google Scholar]
- Chen, M.Y.; Linkens, D.A.; Bannister, A. Numerical analysis of factors influencing charpy impact properties of tmcr structural steels using fuzzy modelling. Mater. Sci. Technol. 2004, 20, 627–633. [Google Scholar] [CrossRef]
- Joo, M.S.; Suh, D.W.; Bae, J.H.; Bhadeshia, H.K.D.H. Role of delamination and crystallography on anisotropy of charpy toughness in api-x80 steel. Mater. Sci. Eng. A-Struct. Mater. Prop. Microstruct. Process. 2012, 546, 314–322. [Google Scholar] [CrossRef]
- Moskovic, R.; Windle, P.L.; Smith, A.F. Modeling charpy impact energy property changes using a bayesian method. Metall. Mater. Trans. A-Phys. Metall. Mater. Sci. 1997, 28, 1181–1193. [Google Scholar] [CrossRef]
- Chao, J.; Capdevila, C. Anisotropy in mechanical properties and fracture behavior of an oxide dispersion Fe20Cr5Al alloy. Metall. Mater. Trans. A-Phys. Metall. Mater. Sci. 2014, 45A, 3767–3780. [Google Scholar] [CrossRef]
- Cottrell, A.H. The 1958 institute of metals division lecture—Theory of brittle fracture in steel and similar metals. Trans. Am. Inst. Min. Metall. Eng. 1958, 212, 192–203. [Google Scholar]
- Petch, N.J. The ductile-brittle transition in the fracture of alpha-iron. 1. Philos. Mag. 1958, 3, 1089–1097. [Google Scholar] [CrossRef]
- Grubb, J.F.; Wright, R.N. Role of C and N in the brittle-fracture of Fe-26 Cr. Metall. Trans. A-Phys. Metall. Mater. Sci. 1979, 10, 1247–1255. [Google Scholar] [CrossRef]
- Stoloff, N.S. Fatigue and Fracture of High Temperature Intermetallics; TMS: Warrendale, PA, USA, 1996; pp. 195–207. [Google Scholar]
- Tang, N.Y.; Plumtree, A. Cavity nucleation in creep. Scr. Metall. 1984, 18, 1045–1049. [Google Scholar] [CrossRef]
- Gil Sevillano, J.; Alkorta, J.; Gonzalez, D.; Van Petegem, S.; Stuhr, U.; Van Swygenhoven, H. In situ neutron diffraction study of internal micro-stresses developed by plastic elongation in <110> textured bcc wires. Adv. Eng. Mater. 2008, 10, 951–954. [Google Scholar] [CrossRef]
- Hosford, W.F. Microstructural changes during deformation of (011) fiber-textured metals. Trans. Metall. Soc. Aime 1964, 230, 12–15. [Google Scholar]


| Material | Chemical Composition (wt. %) | |||||||
|---|---|---|---|---|---|---|---|---|
| C | Si | Mn | P | S | Cr | Al | Ti | |
| PM2000 | <0.01 | 0.095 | 0.037 | <0.02 | <0.005 | 18.60 ± 0.08 | 5.2 ± 0.1 | 0.54 |
| MA956 | <0.012 | 0.12 | 0.097 | <0.02 | 0.007 | 19.33 ± 0.08 | 4.7 ± 0.1 | 0.44 |
| Material | Chemical Composition (wt. %) | |||||||
| Co | Ni | Cu | O | Y | N | Y2O3(*) | ||
| PM2000 | 0.039 | 0.03 | 0.015 | 0.091 ± 0.02 | 0.391 | 0.5 | ||
| MA956 | 0.066 | 0.101 | 0.021 | 0.108 ± 0.015 | 0.376 | 0.0200 ± 0.0015 | 0.5 | |
| Grains | Dispersoids | ||||||
|---|---|---|---|---|---|---|---|
| Material | Deff (T–S) (μm) | l (LS) (μm) | GAR | Size nm | λavg nm | fvol % | Texture |
| PM2000 | 0.7 | 1.6 | 2.3 | 19 | 121 | 1.1 | (100) [100] |
| MA956 | 0.7 | 0.9 | 1.4 | 16 [8] | 180 [8] | 1.3 [8] | α-fiber <110>‖ED |
| Material | LSE (J) | DBTT (°C) | USE (J) |
|---|---|---|---|
| PM2000-LT | 1.0 | −30 | 16.5 |
| PM200-LS | 3.0 | −30 | 28 (*) |
| MA956 | 1.5 | −60 | 27 (*) |
© 2016 by the authors; licensee MDPI, Basel, Switzerland. This article is an open access article distributed under the terms and conditions of the Creative Commons Attribution (CC-BY) license (http://creativecommons.org/licenses/by/4.0/).
Share and Cite
Chao, J.; Rementeria, R.; Aranda, M.; Capdevila, C.; Gonzalez-Carrasco, J.L. Comparison of Ductile-to-Brittle Transition Behavior in Two Similar Ferritic Oxide Dispersion Strengthened Alloys. Materials 2016, 9, 637. https://doi.org/10.3390/ma9080637
Chao J, Rementeria R, Aranda M, Capdevila C, Gonzalez-Carrasco JL. Comparison of Ductile-to-Brittle Transition Behavior in Two Similar Ferritic Oxide Dispersion Strengthened Alloys. Materials. 2016; 9(8):637. https://doi.org/10.3390/ma9080637
Chicago/Turabian StyleChao, Jesus, Rosalia Rementeria, Maria Aranda, Carlos Capdevila, and Jose Luis Gonzalez-Carrasco. 2016. "Comparison of Ductile-to-Brittle Transition Behavior in Two Similar Ferritic Oxide Dispersion Strengthened Alloys" Materials 9, no. 8: 637. https://doi.org/10.3390/ma9080637