
Preparation and Characterization of Polyvinyl Alcohol-Chitosan Composite Films Reinforced with Cellulose Nanofiber


Abstract
:1. Introduction
2. Results and Discussion
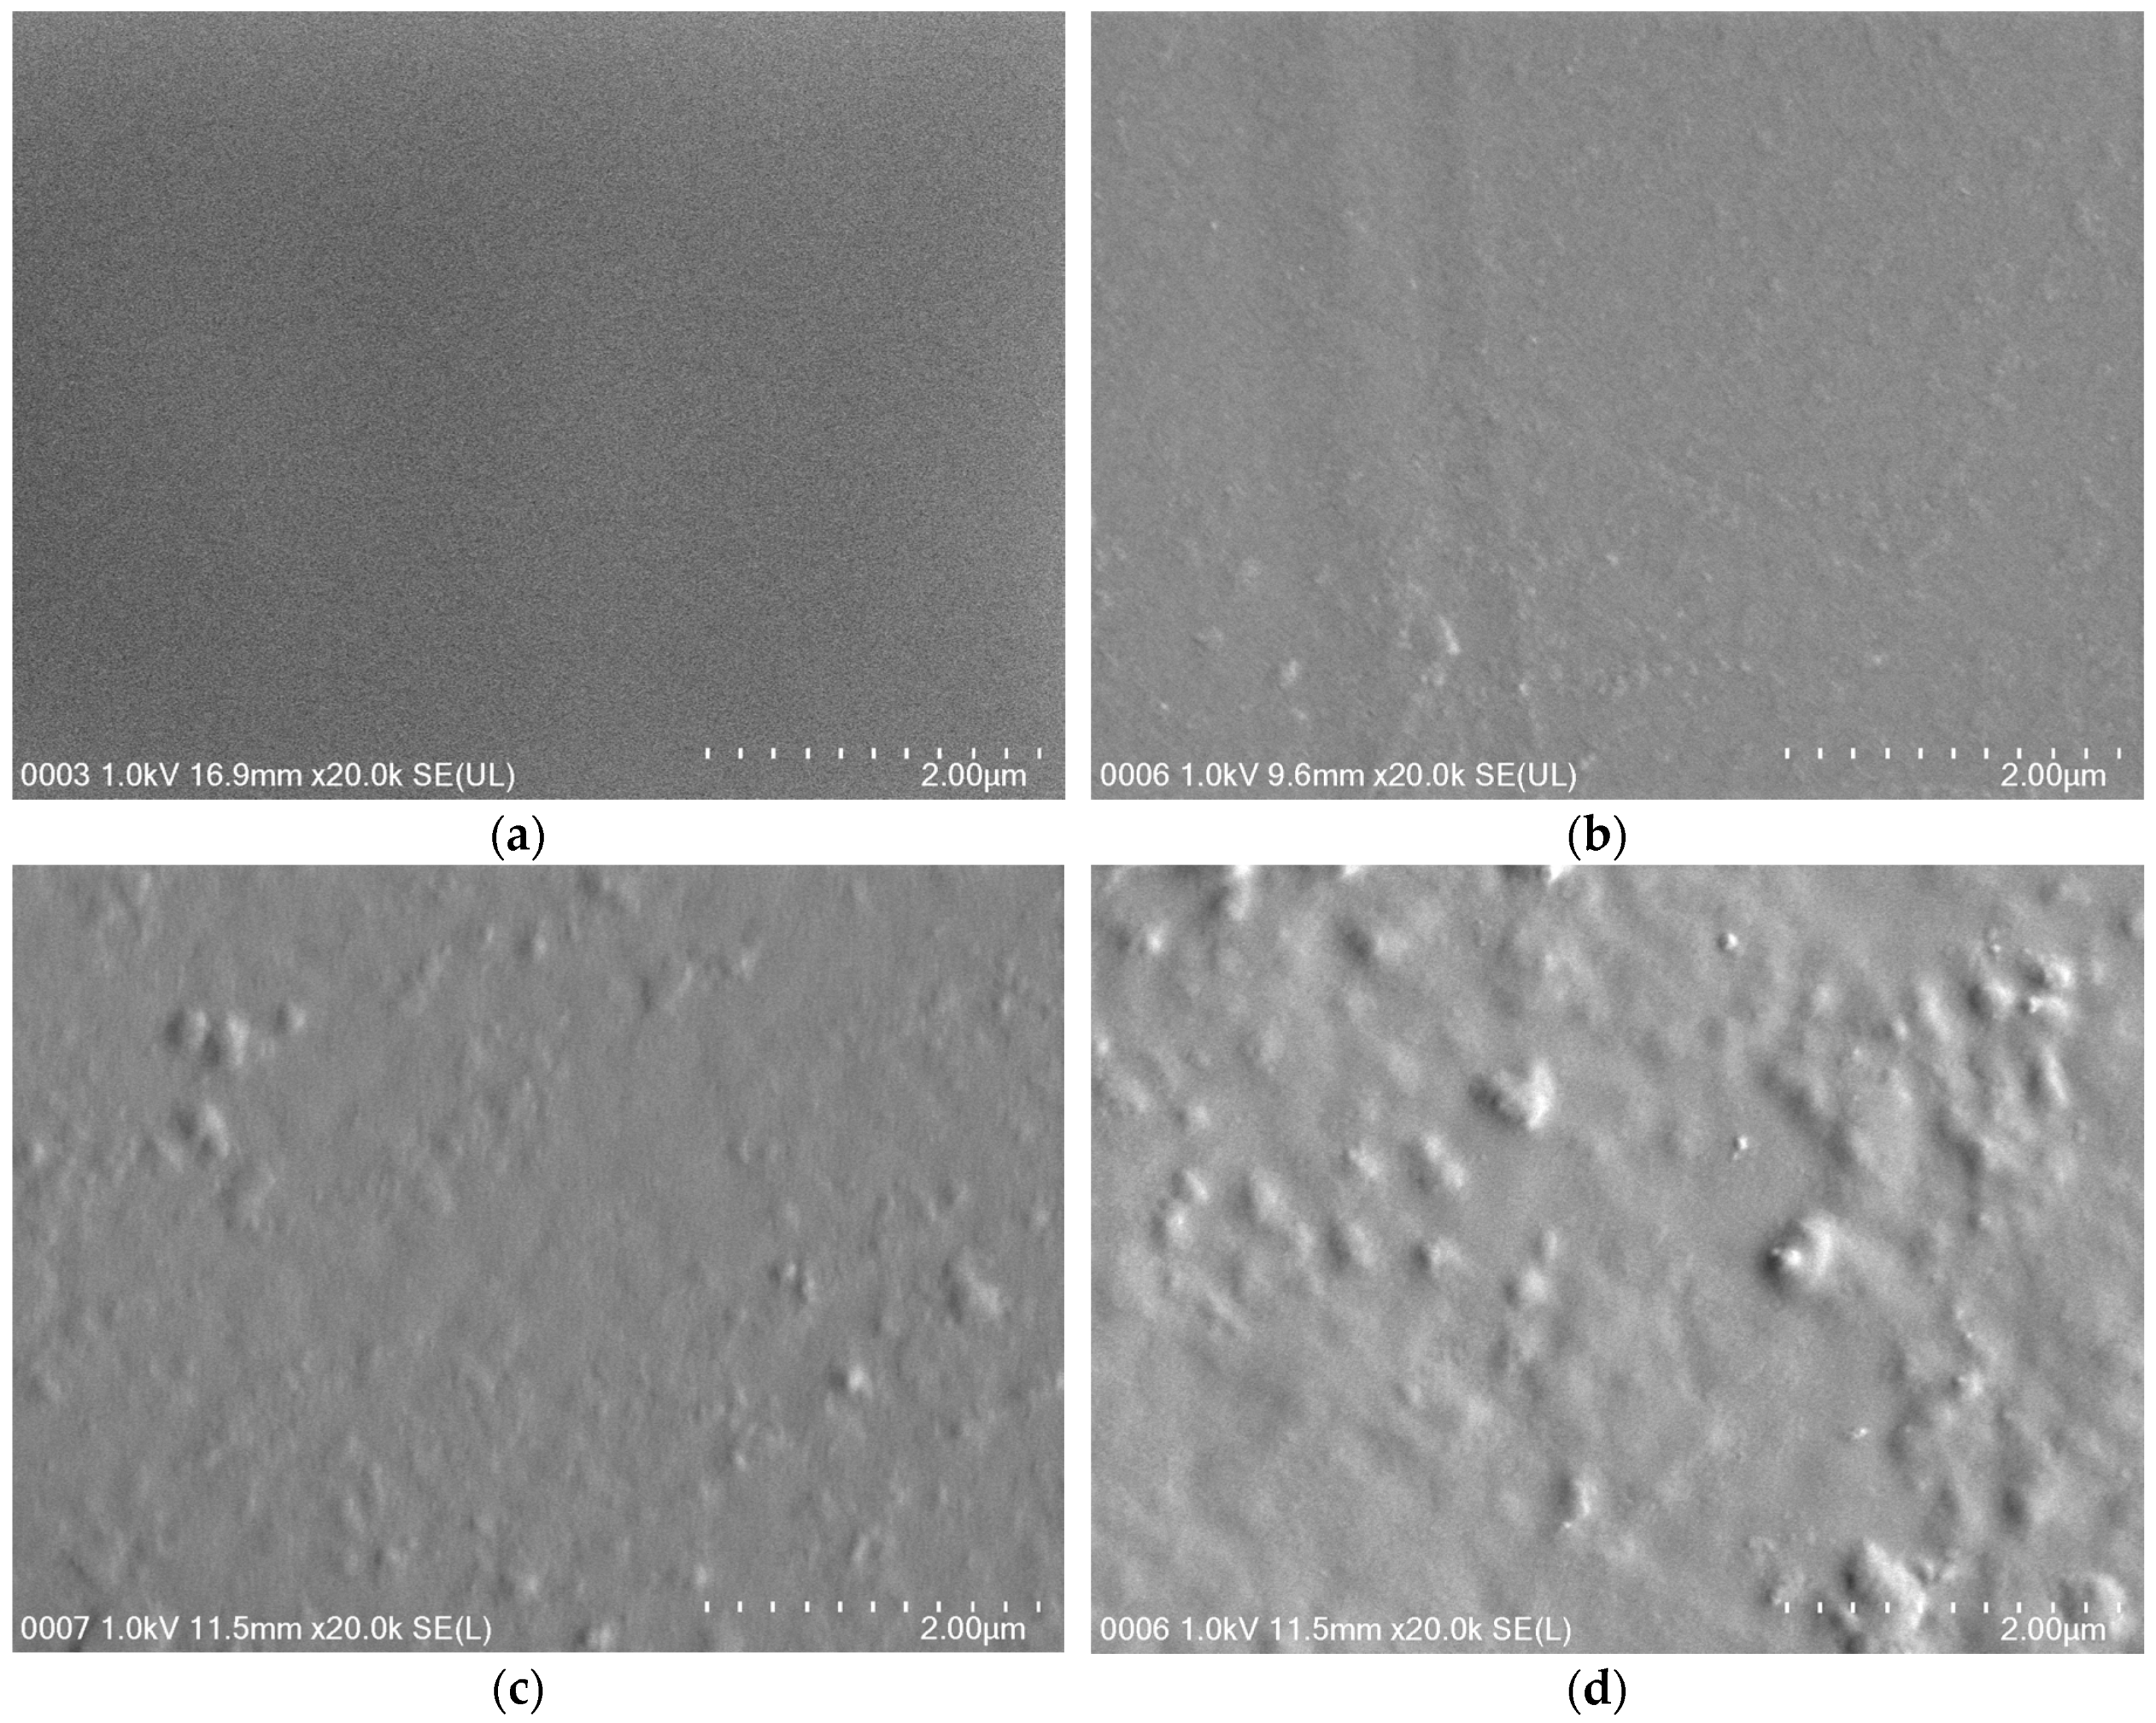
2.1. FESEM
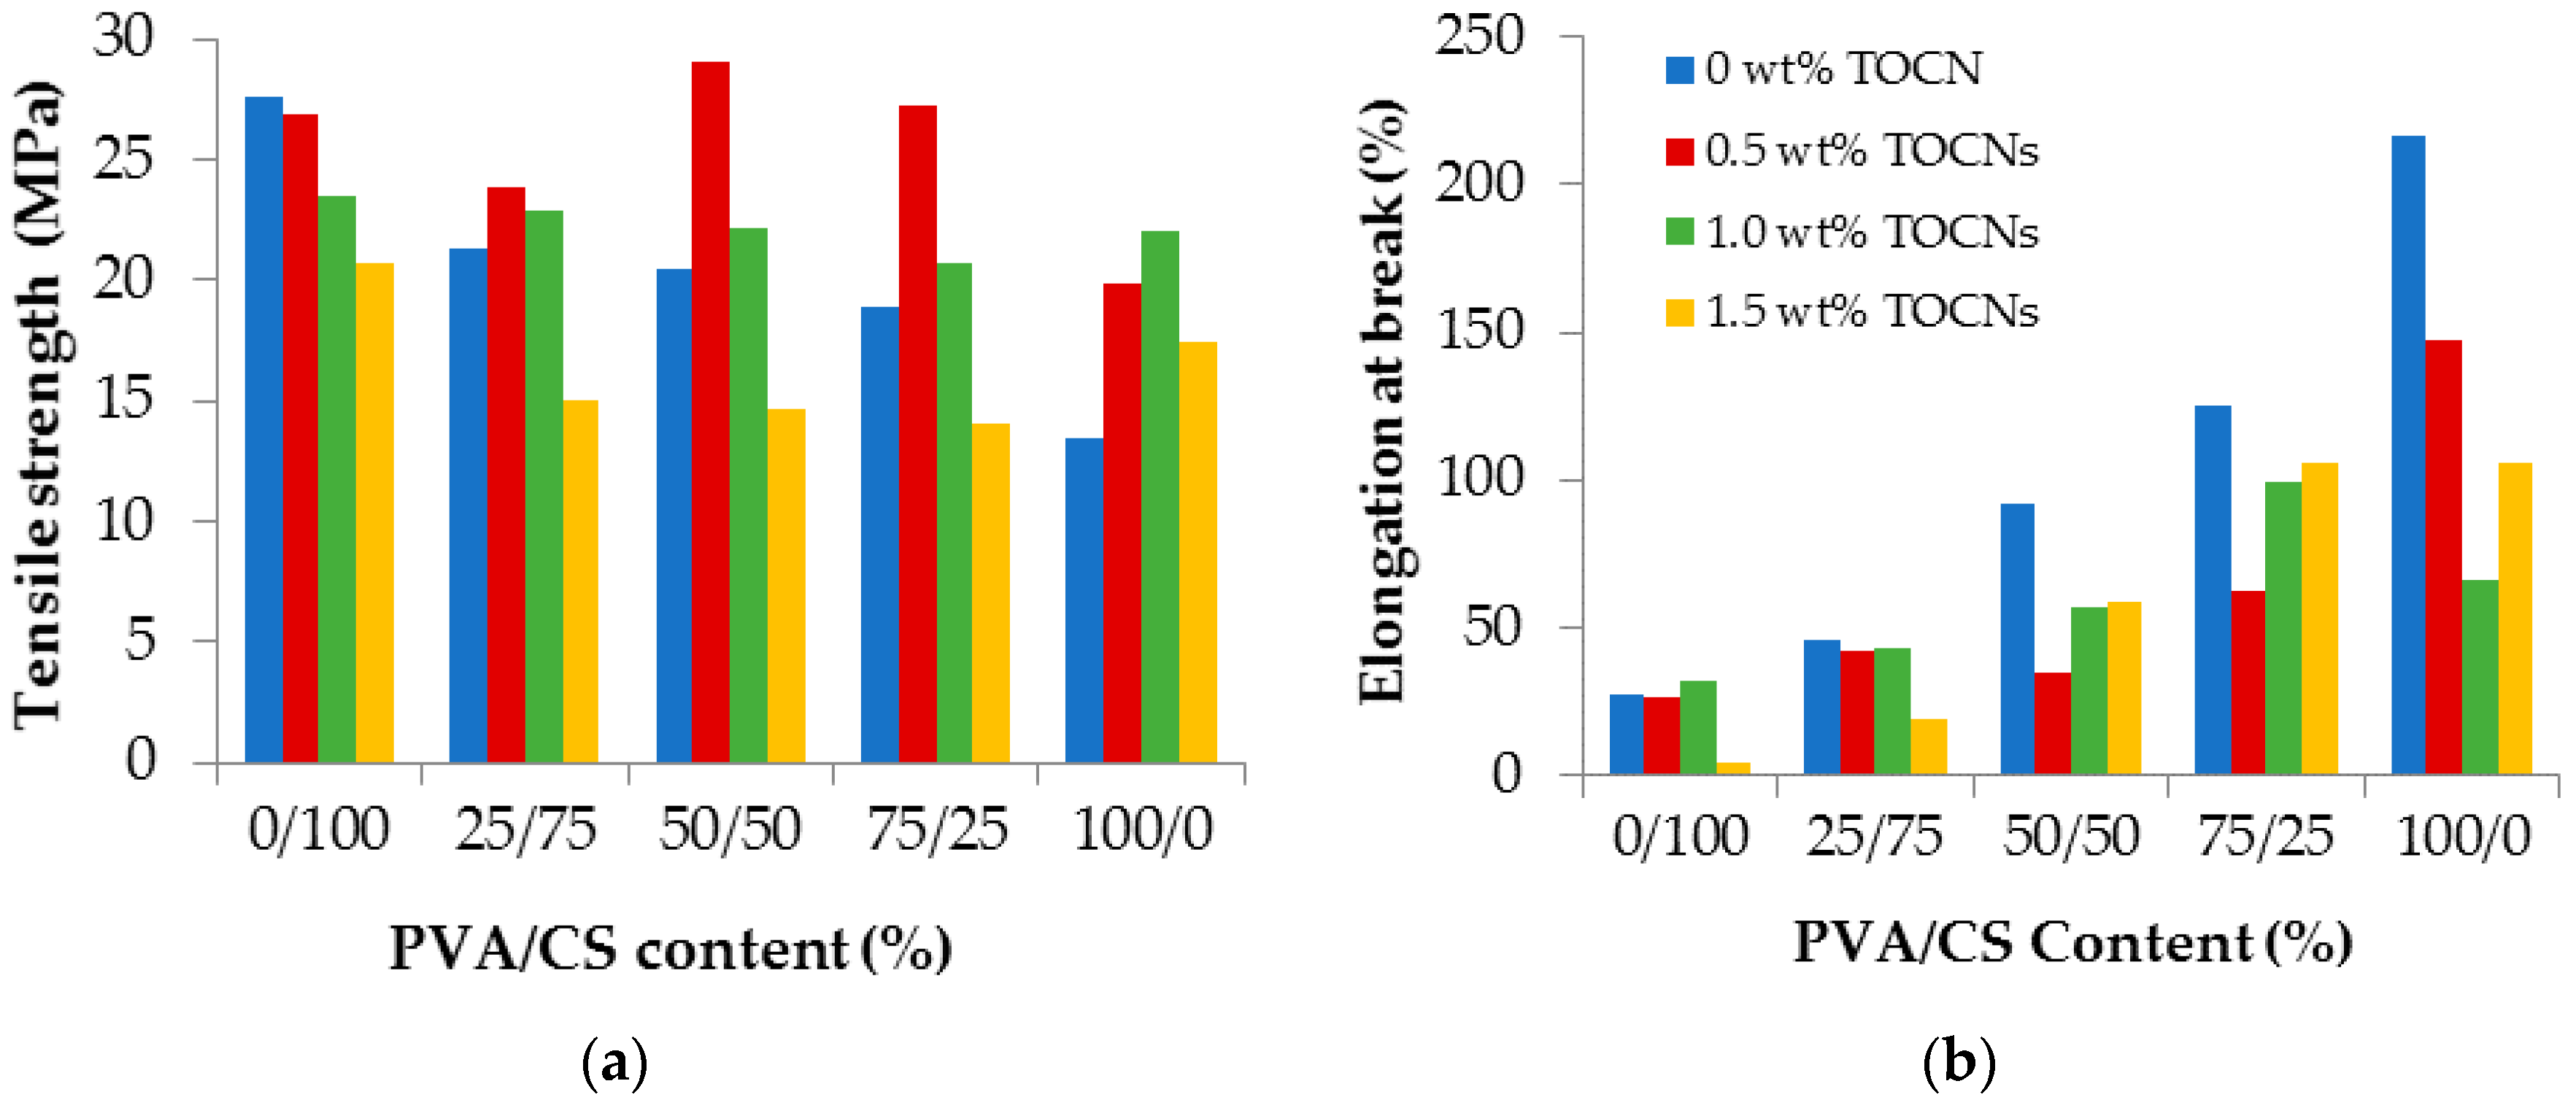
2.2. Tensile Properties
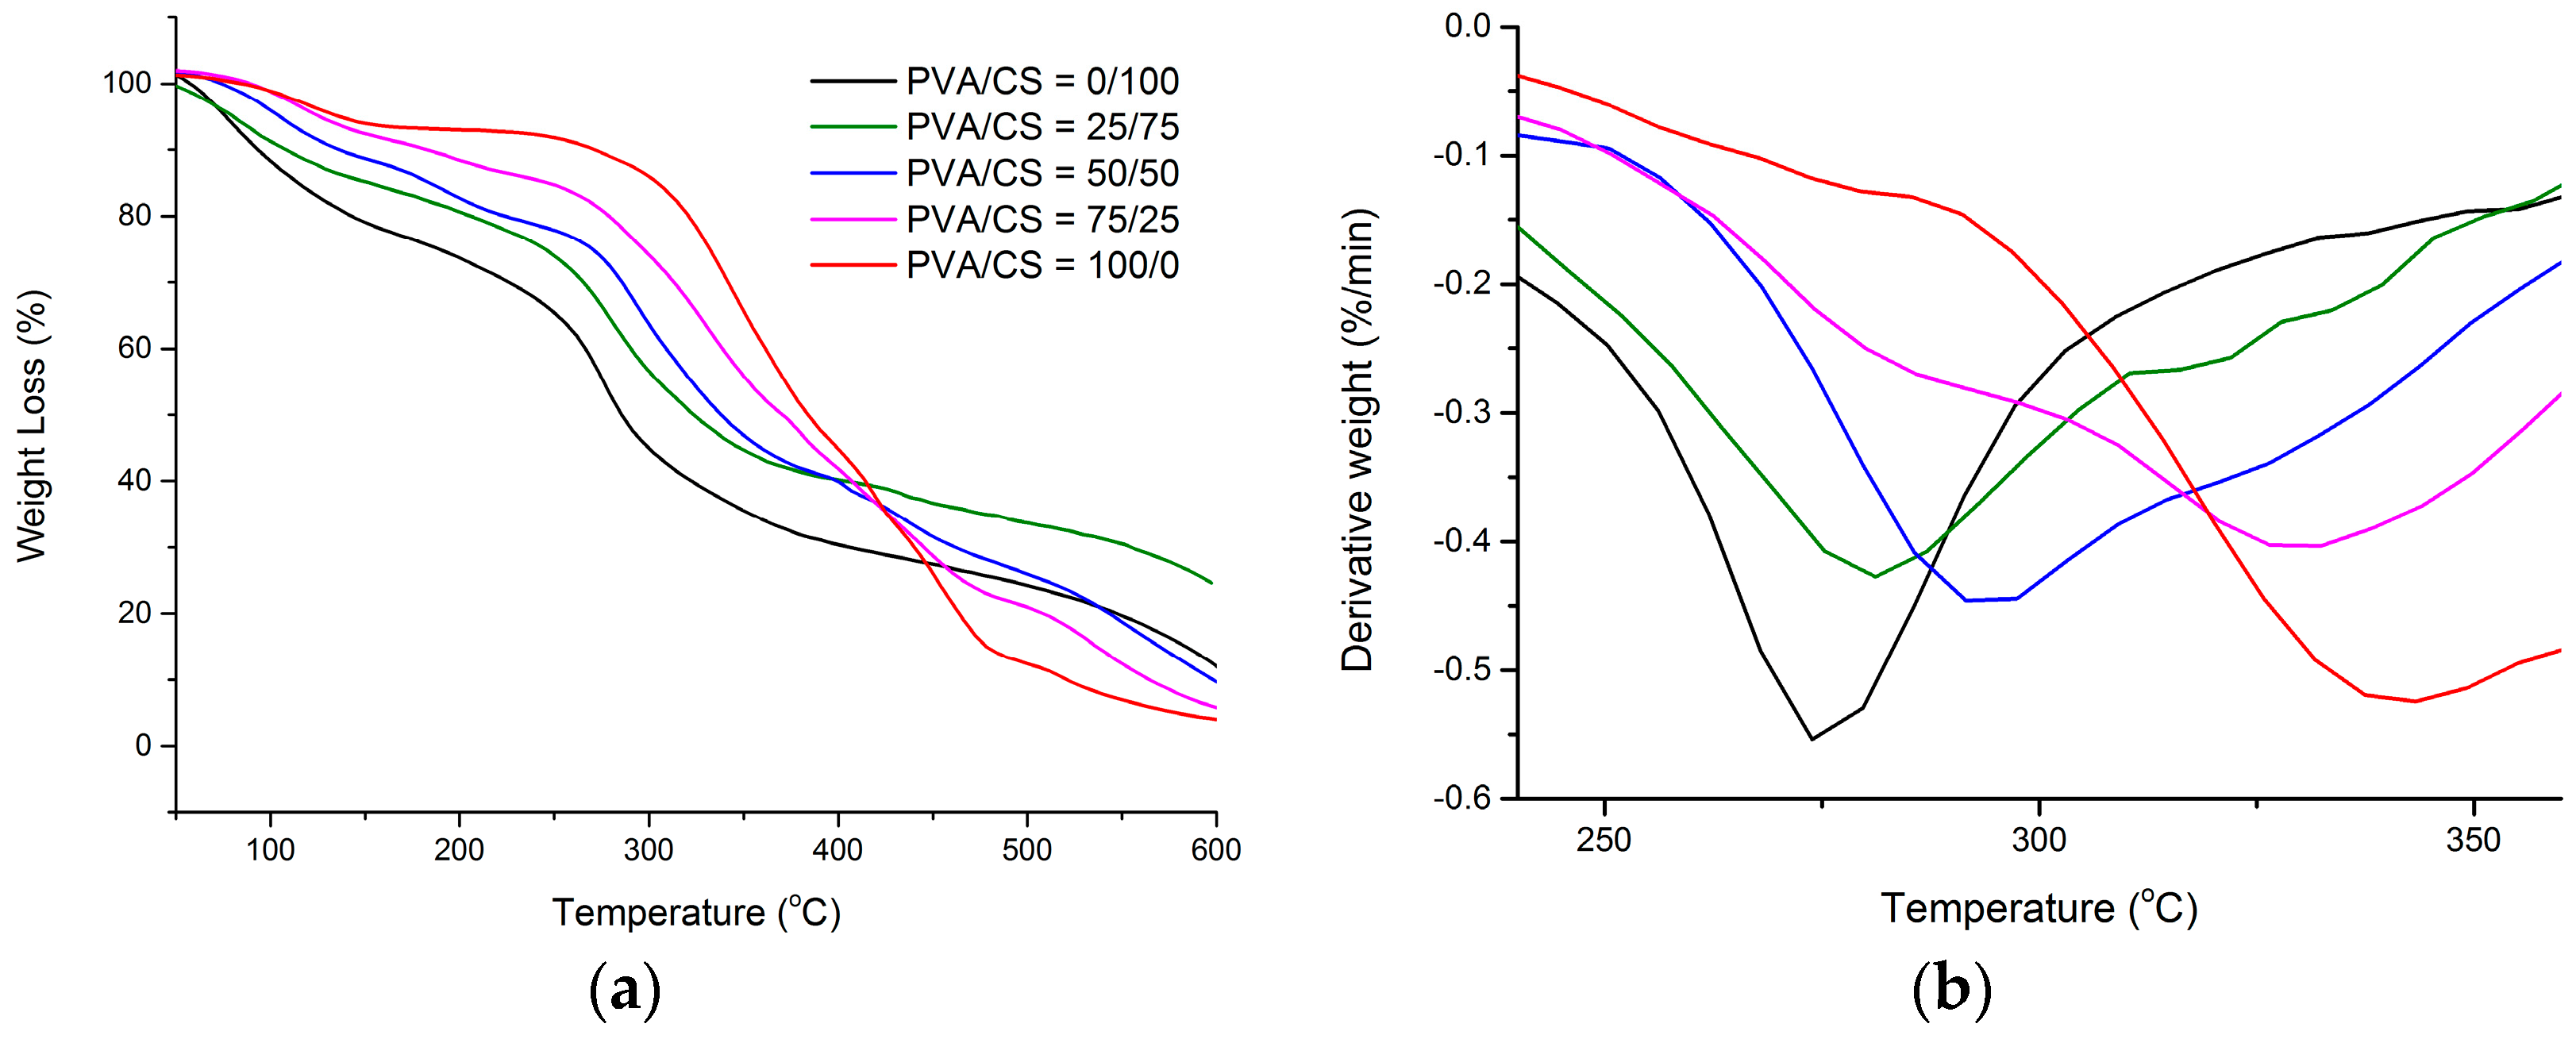
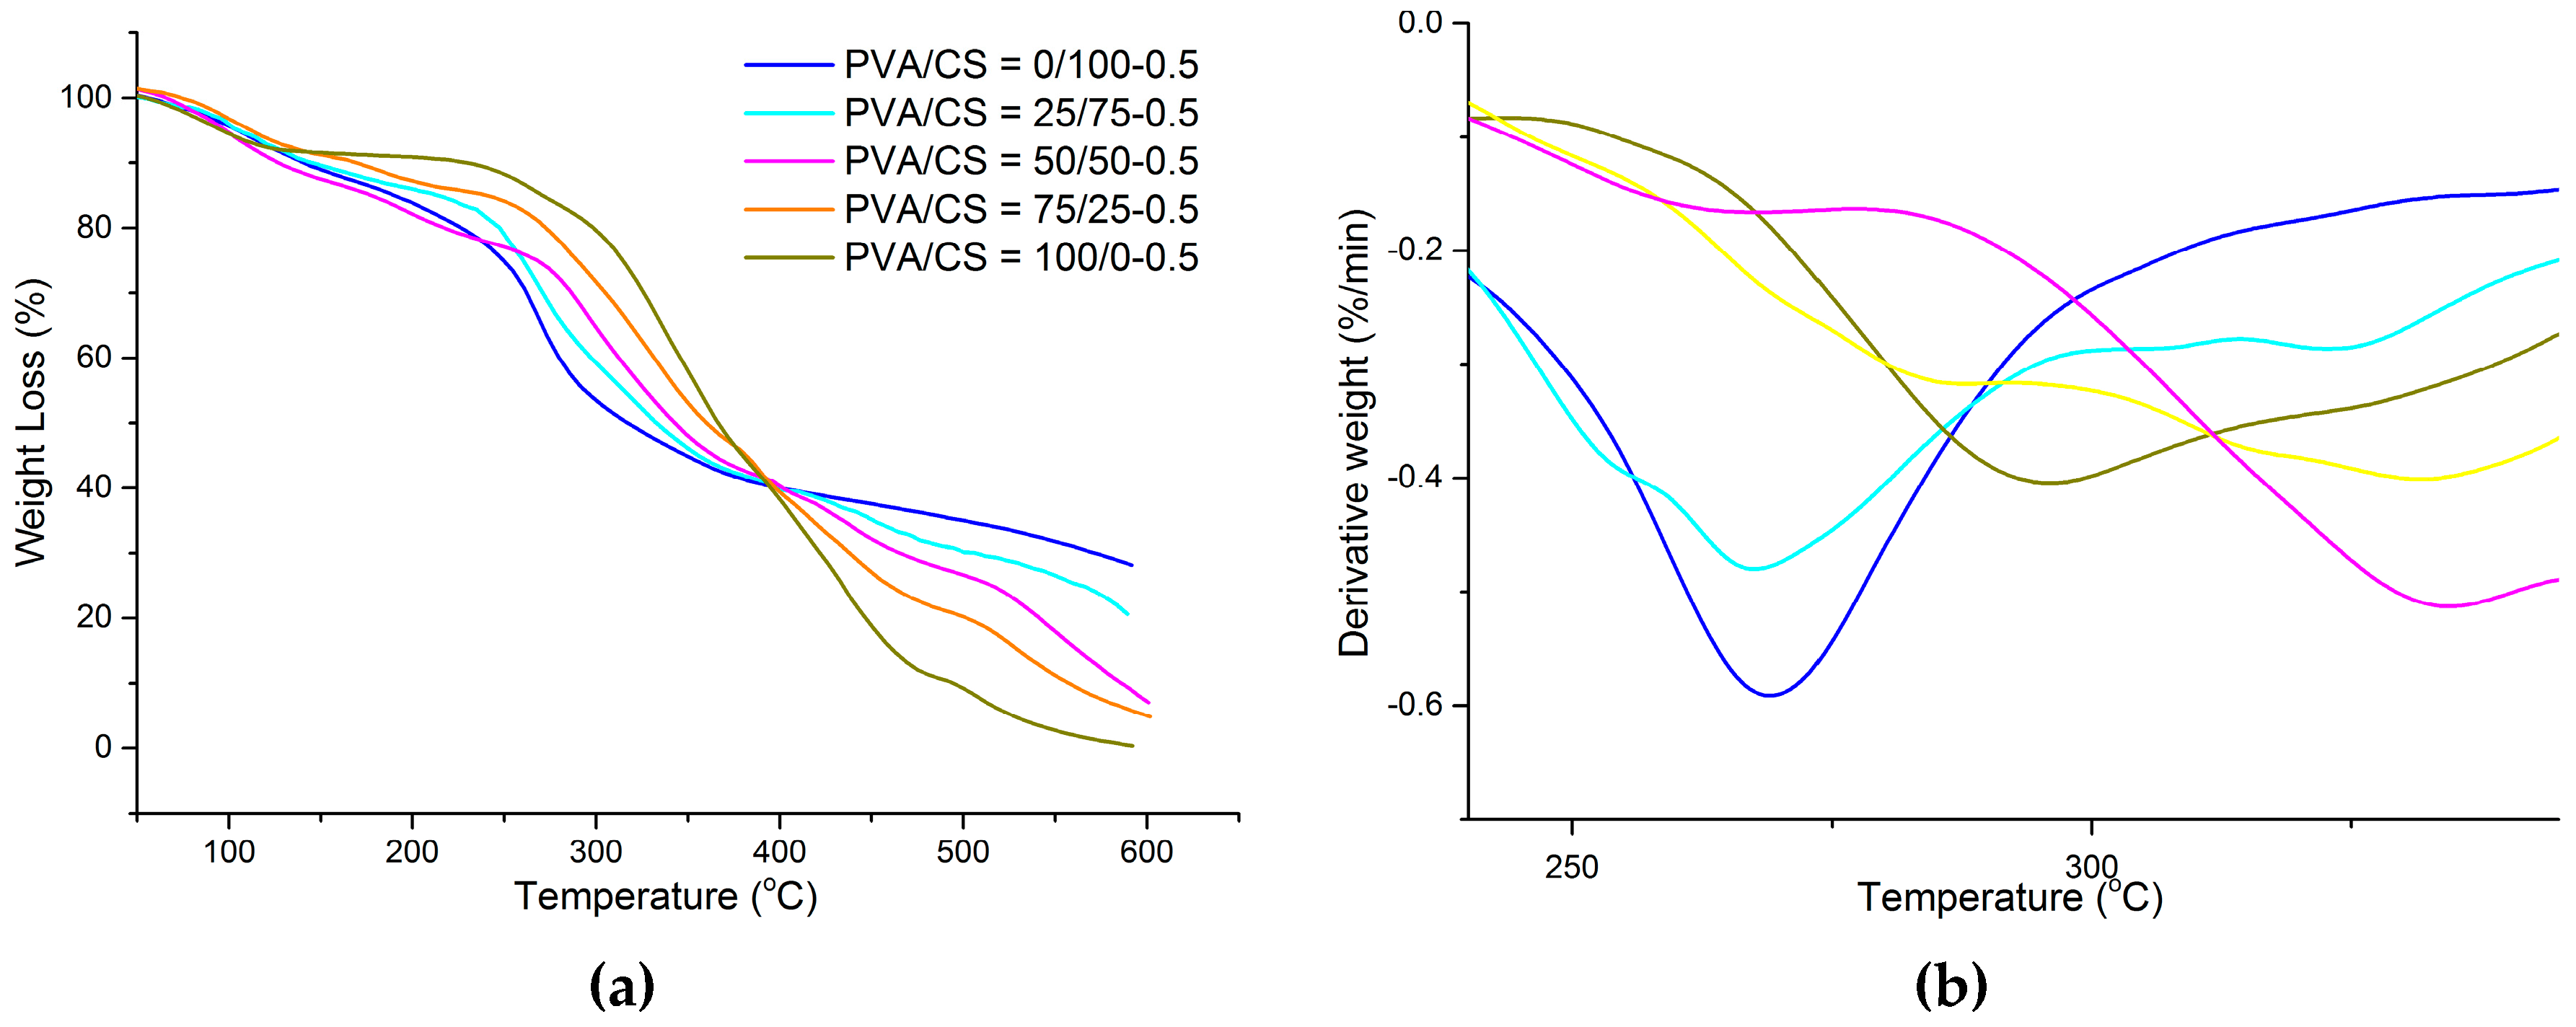
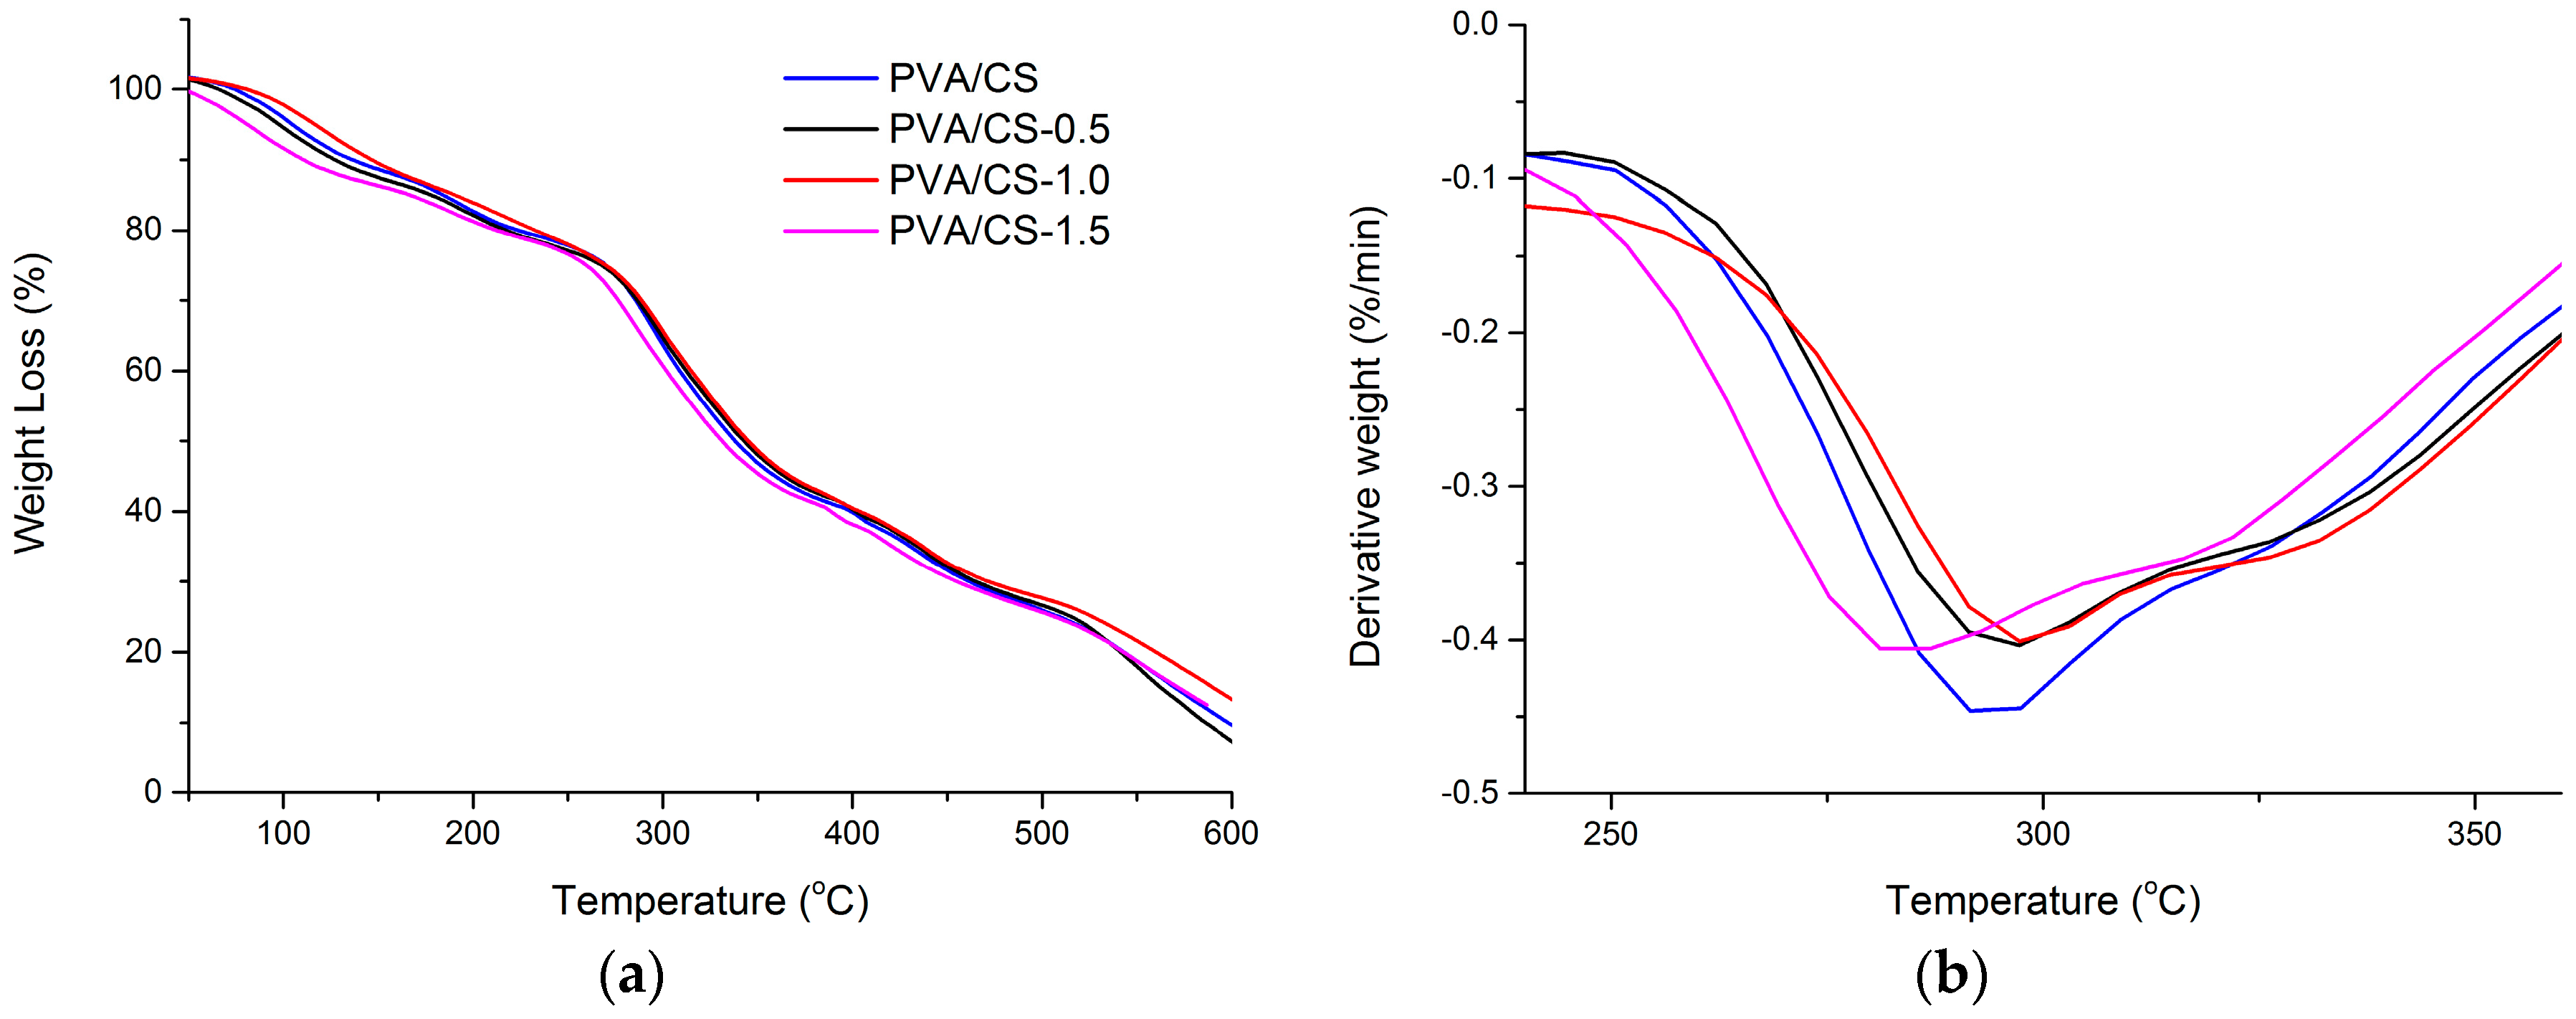
2.3. TGA and DTG
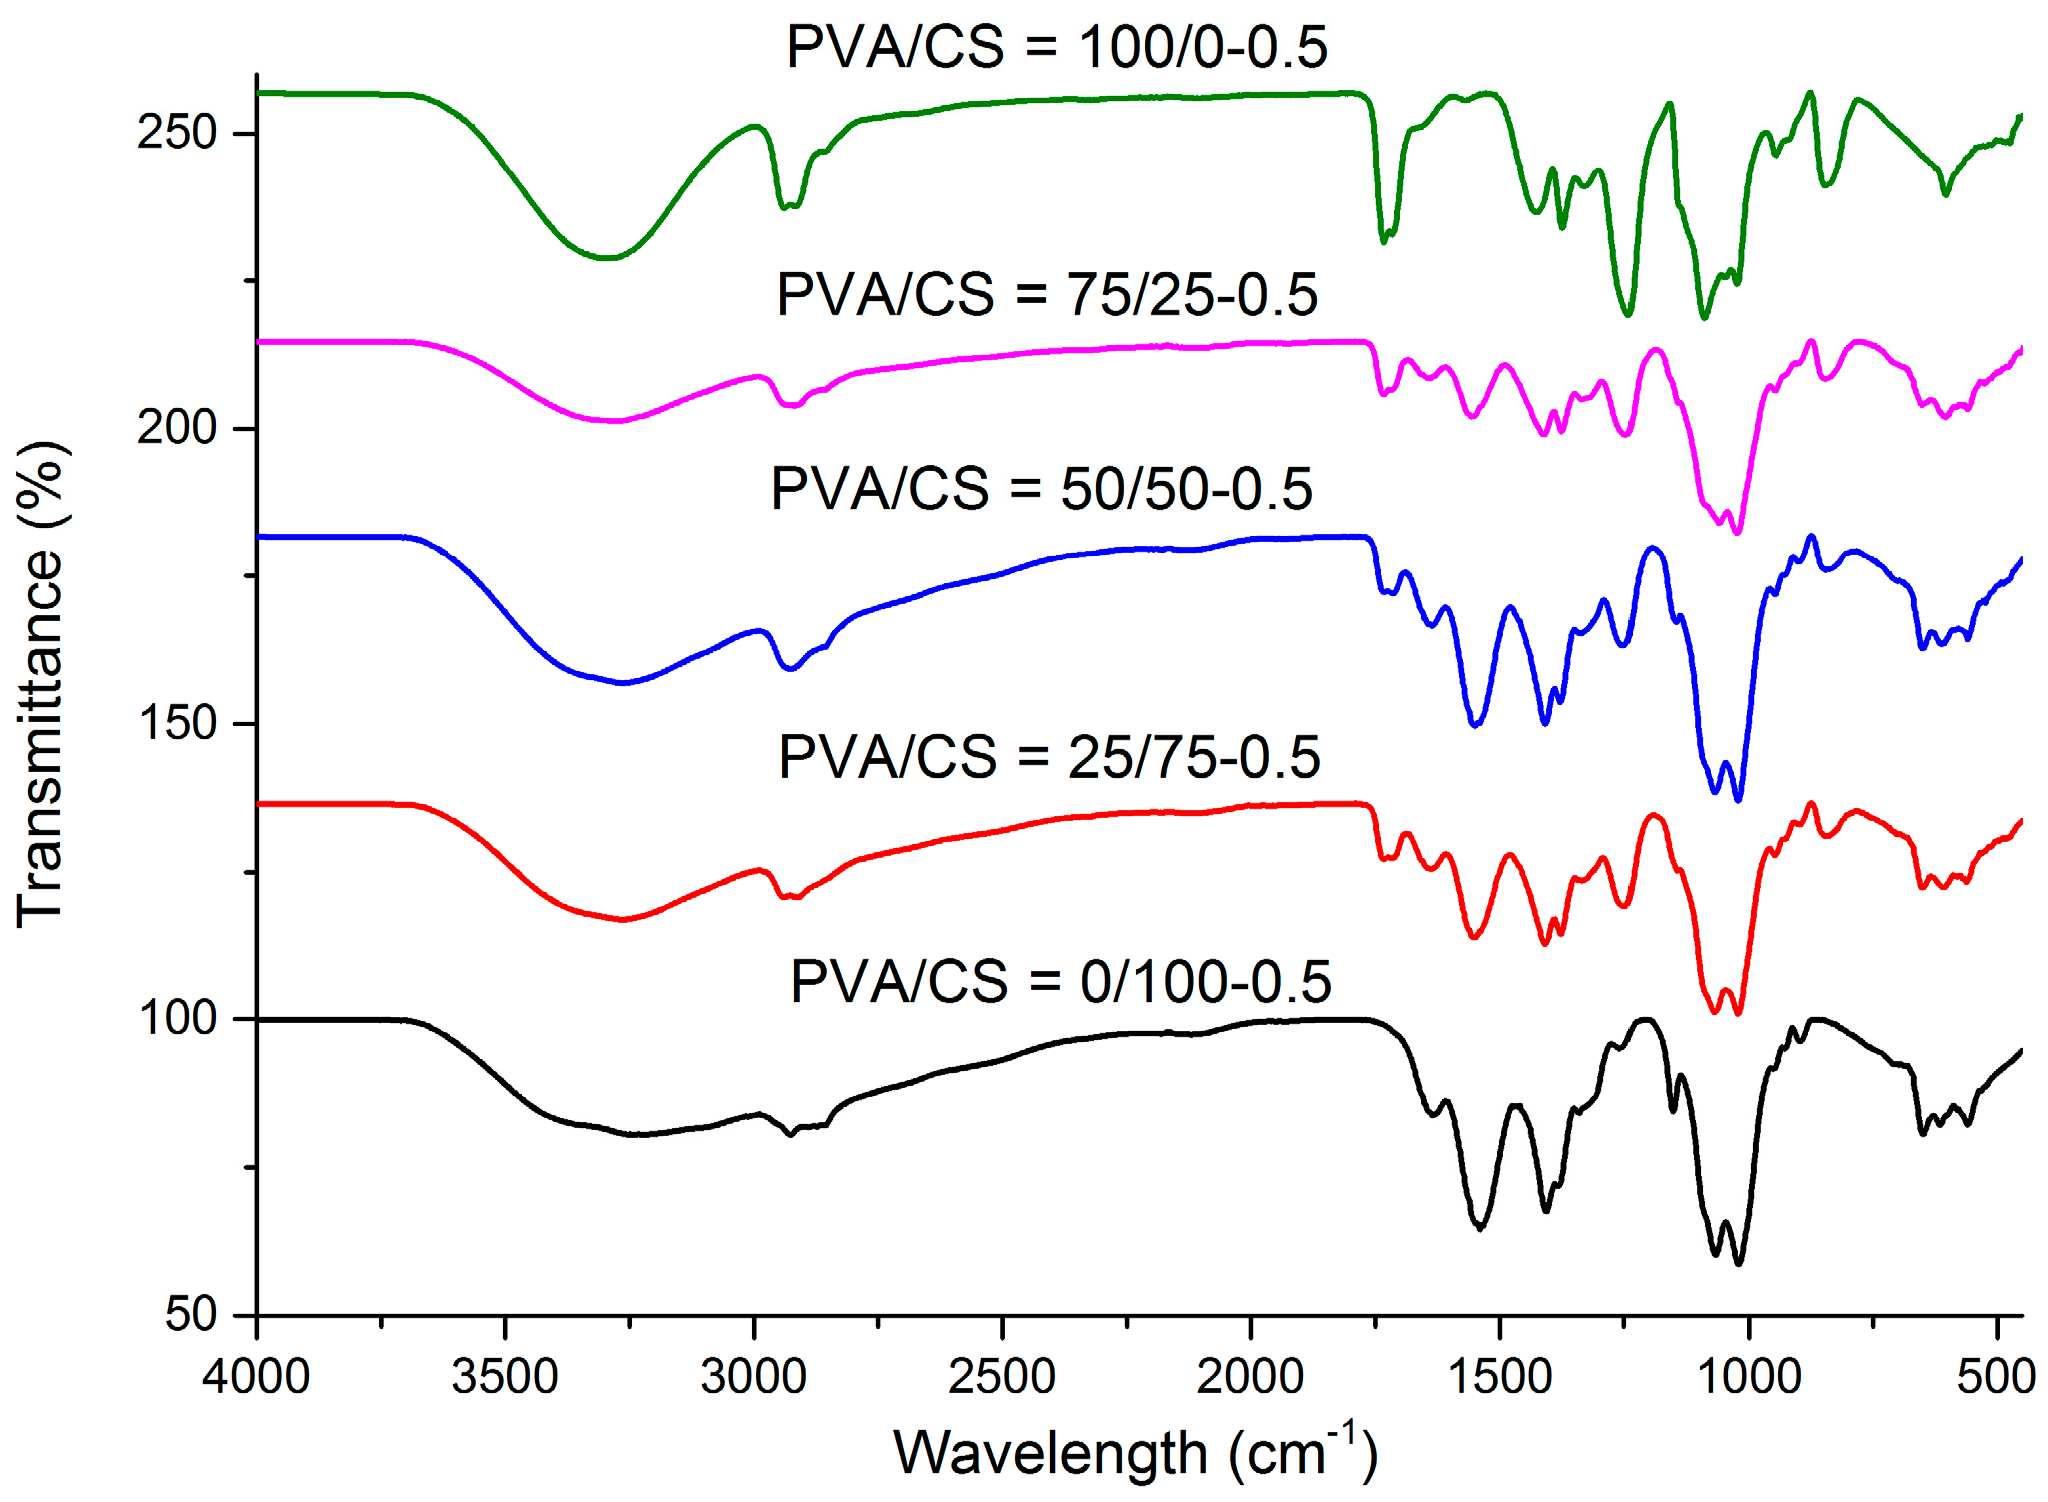
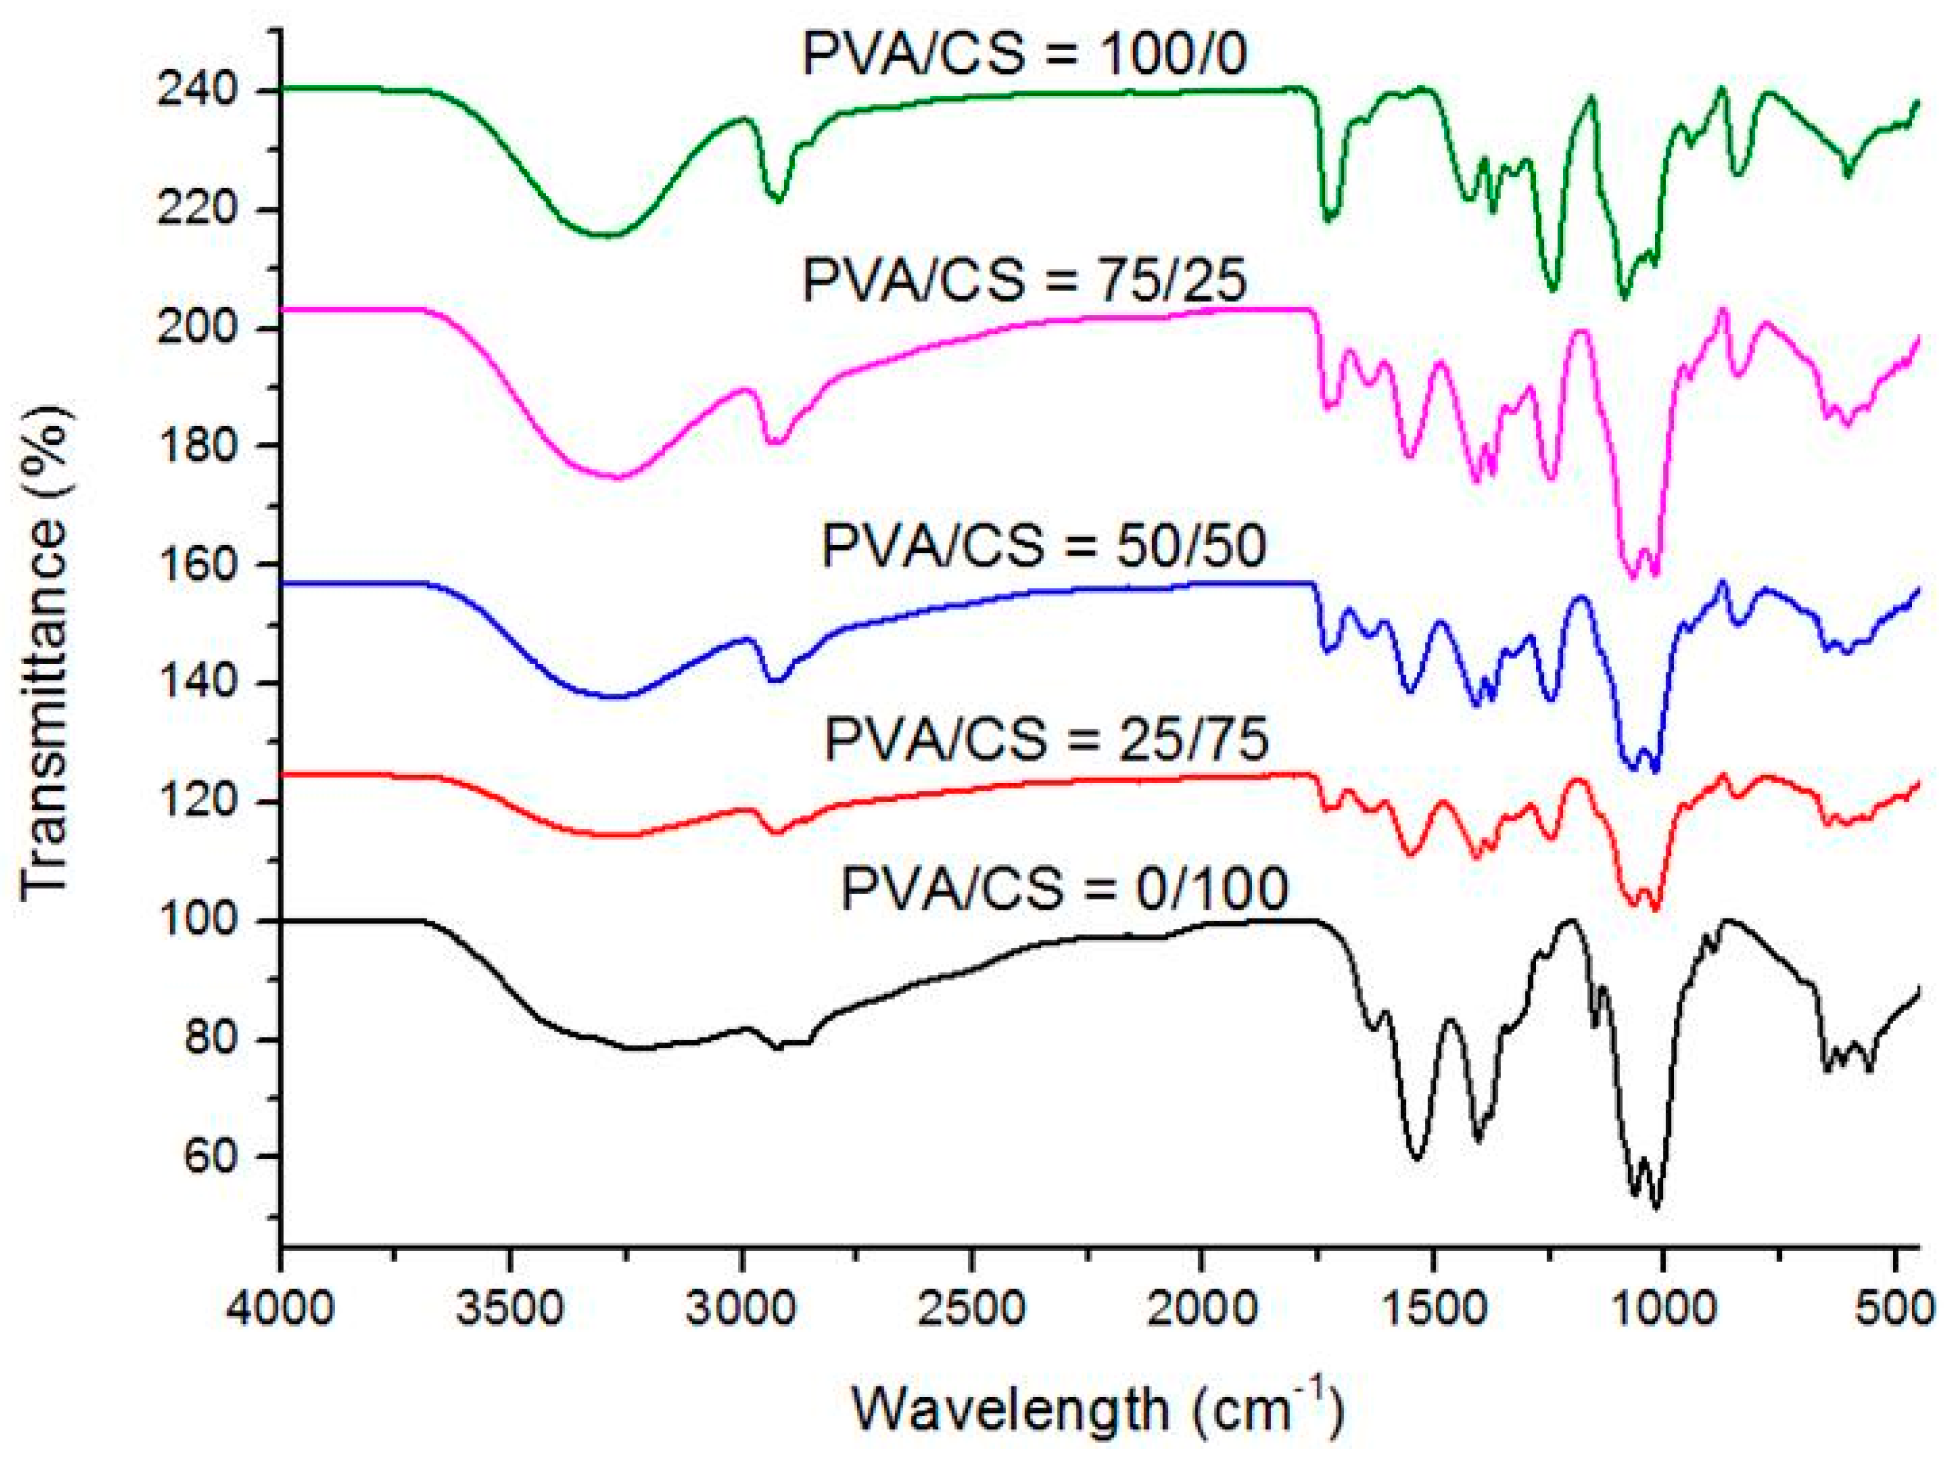
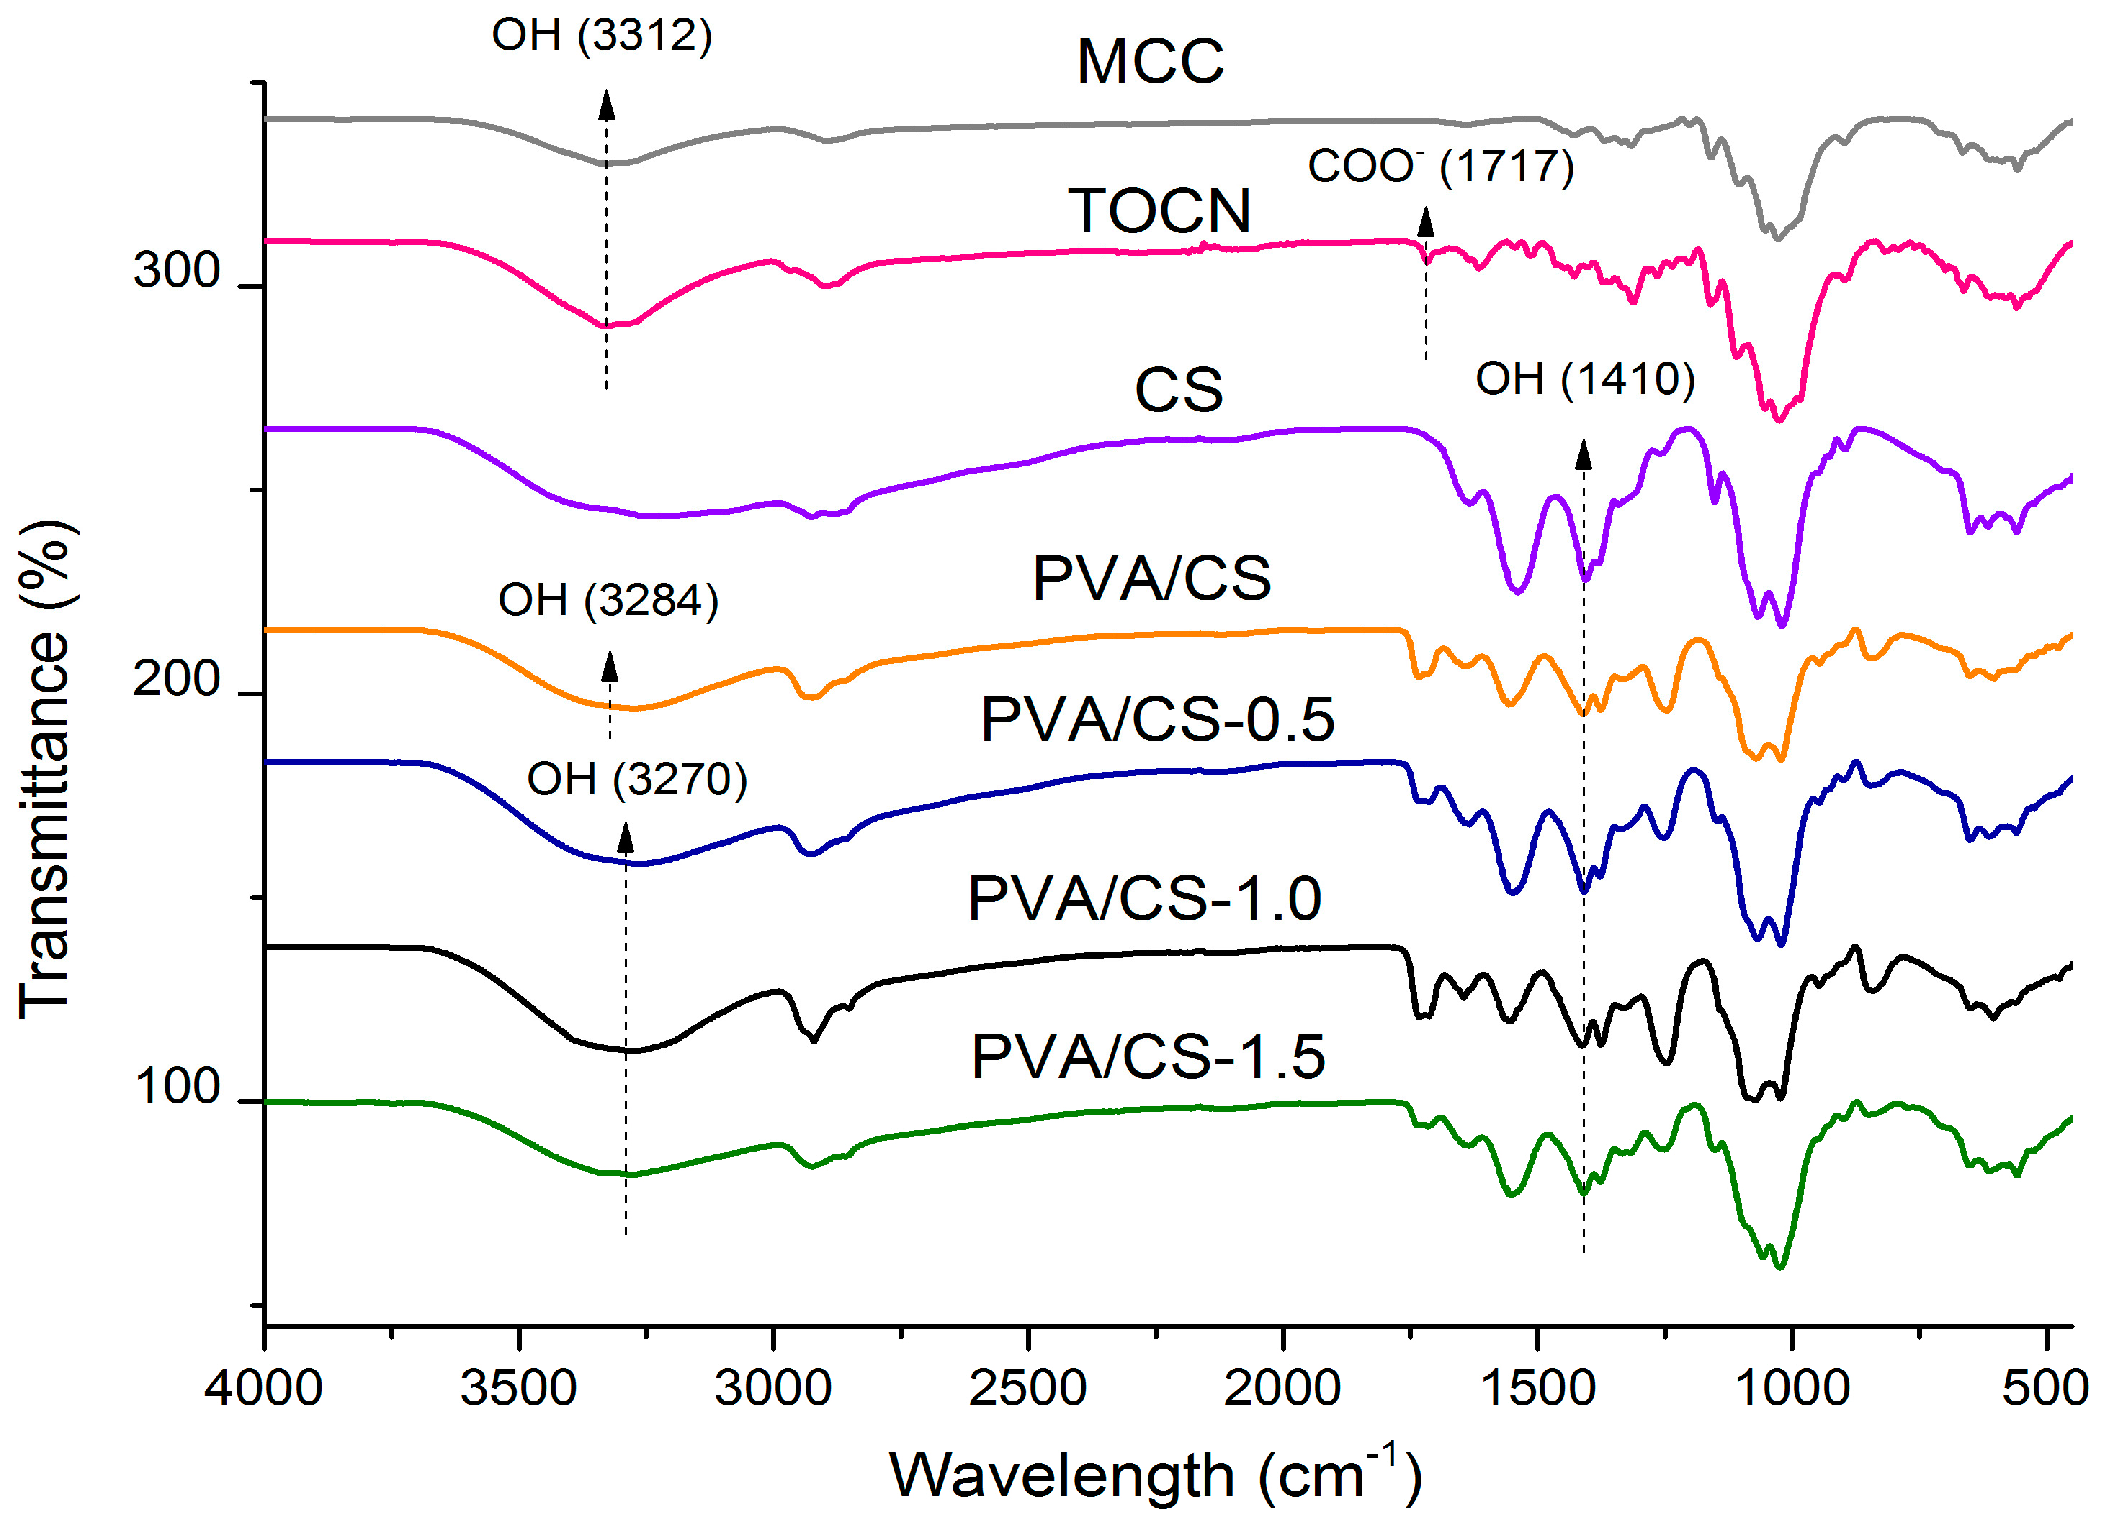
2.4. FTIR
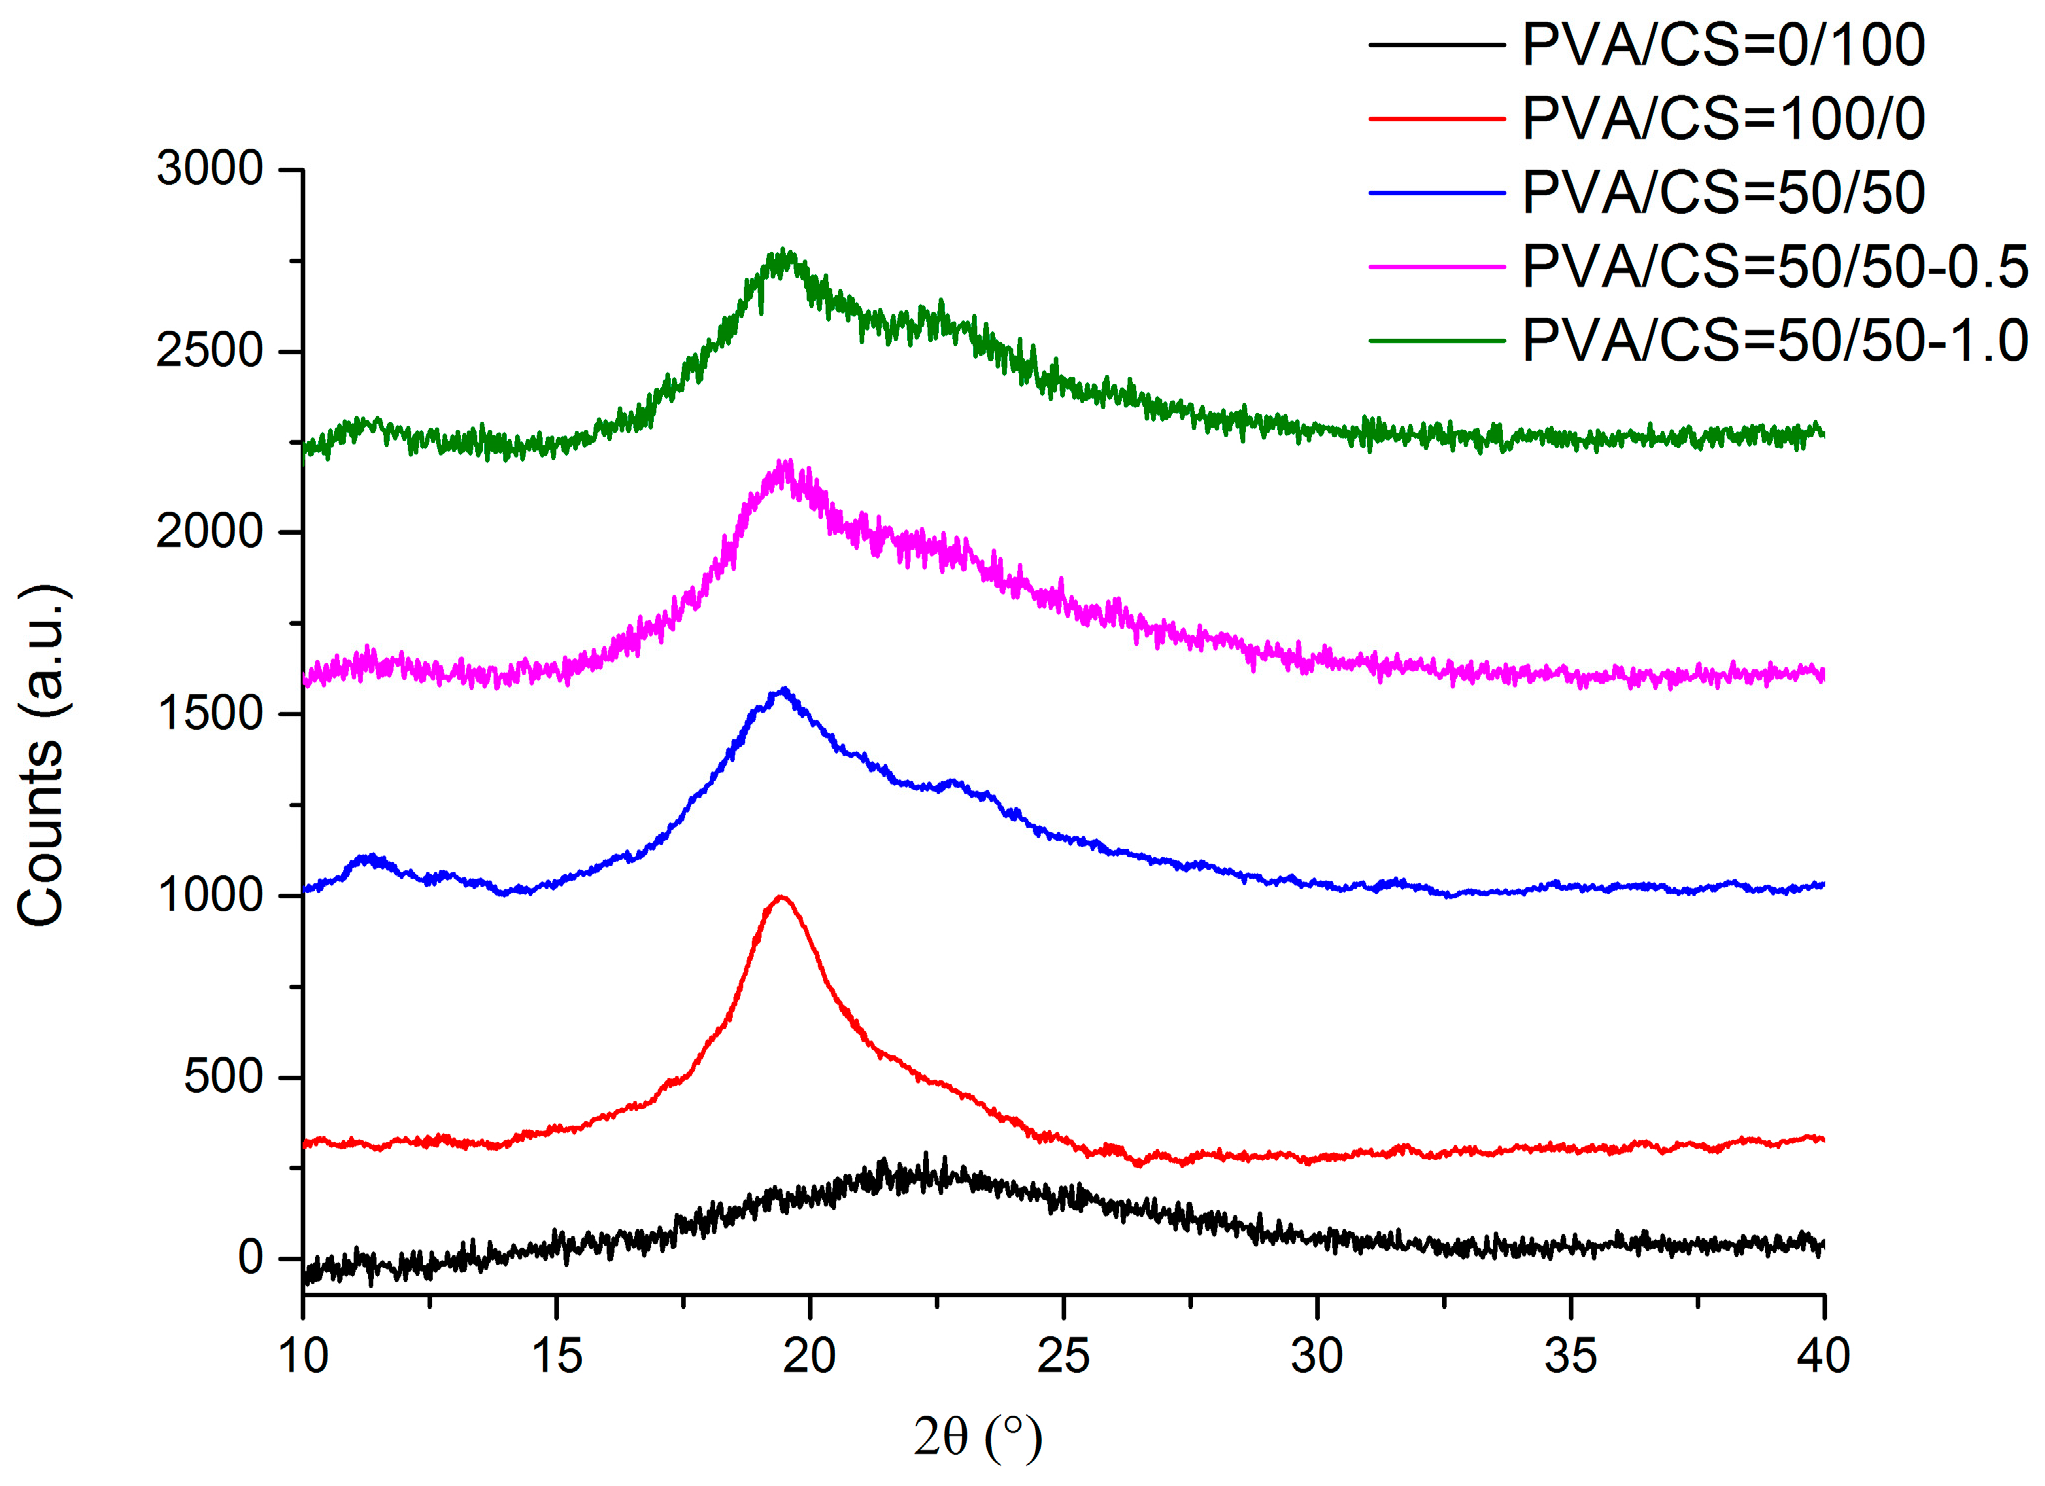
2.5. XRD
3. Materials and Methods
3.1. Materials and Chemicals
3.2. Preparation of TEMPO-Mediated Oxidized Cellulose
3.3. Preparation of TEMPO-mediated Oxidized Cellulose Nanofiber (TOCN)
3.4. Preparation of Bio-nanocomposite Films
3.5. Characterization
3.5.1. Morphology of Films
3.5.2. Tensile Properties of Films
3.5.3. TGA Analysis of Films
3.5.4. FTIR Analysis of Films
3.5.5. XRD Analysis of Films
4. Conclusions
Acknowledgments
Author Contributions
Conflicts of Interest
Abbreviations
| CNF | Cellulose nanofiber |
| CNW | Cellulose nanowhisker |
| CS | Chitosan |
| DTG | Derivative thermogravimetic analysis |
| %E | Elongation at break |
| FESEM | Field emission scanning electron microscopy |
| FTIR | ourier transform infra-red |
| MCC | Microcrystalline cellulose |
| PVA | Polyvinyl alcohol |
| Tmax | Maximum point of degradation |
| Tonset | Onset temperature |
| TGA | Thermogravimetric analysis |
| TOCN | TEMPO-mediated oxidized cellulose nanofiber |
| TS | Tensile strength |
| XRD | X-ray diffraction |
References
- Fortunati, E.; Peltzer, M.; Armentano, I.; Torre, L.; Jimenez, A.; Kenny, J.M. Effects of modified cellulose nanocrystals on the barrier and migration properties of pla nano-biocomposites. Carbohydr. Polym. 2012, 90, 948–956. [Google Scholar] [CrossRef] [PubMed]
- Goffin, A.L.; Raquez, J.M.; Duquesne, E.; Siqueira, G.; Habibi, Y.; Dufresne, A.; Dubois, P. From interfacial ring-opening polymerization to melt processing of cellulose nanowhisker-filled polylactide-based nanocomposites. Biomacromolecules 2011, 12, 2456–2465. [Google Scholar] [CrossRef] [PubMed]
- Kanmani, P.; Rhim, J.W. Properties and characterization of bionanocomposite films prepared with various biopolymers and zno nanoparticles. Carbohydr. Polym. 2014, 106, 190–199. [Google Scholar] [CrossRef] [PubMed]
- Rhim, J.W.; Ng, P.K. Natural biopolymer-based nanocomposite films for packaging applications. Crit. Rev. Food Sci. Nutr. 2007, 47, 411–433. [Google Scholar] [CrossRef] [PubMed]
- Rodríguez-González, C.; Martínez-Hernández, A.L.; Castaño, V.M.; Kharissova, O.V.; Ruoff, R.S.; Velasco-Santos, C. Polysaccharide nanocomposites reinforced with graphene oxide and keratin-grafted graphene oxide. Ind. Eng. Chem. Res. 2012, 51, 3619–3629. [Google Scholar] [CrossRef]
- van den Broek, L.A.; Knoop, R.J.; Kappen, F.H.; Boeriu, C.G. Chitosan films and blends for packaging material. Carbohydr. Polym. 2015, 116, 237–242. [Google Scholar] [CrossRef] [PubMed]
- Dash, M.; Chiellini, F.; Ottenbrite, R.M.; Chiellini, E. Chitosan—A versatile semi-synthetic polymer in biomedical applications. Prog. Polym. Sci. 2011, 36, 981–1014. [Google Scholar] [CrossRef]
- Bonilla, J.; Fortunati, E.; Atarés, L.; Chiralt, A.; Kenny, J.M. Physical, structural and antimicrobial properties of poly vinyl alcohol-chitosan biodegradable films. Food Hydrocoll. 2014, 35, 463–470. [Google Scholar] [CrossRef]
- Klemm, D.; Heublein, B.; Fink, H.P.; Bohn, A. Cellulose: Fascinating biopolymer and sustainable raw material. Angew. Chem. 2005, 44, 3358–3393. [Google Scholar] [CrossRef] [PubMed]
- Fernandes, S.C.M.; Freire, C.S.R.; Silvestre, A.J.D.; Pascoal Neto, C.; Gandini, A.; Berglund, L.A.; Salmén, L. Transparent chitosan films reinforced with a high content of nanofibrillated cellulose. Carbohydr. Polym. 2010, 81, 394–401. [Google Scholar] [CrossRef]
- Parparita, E.; Cheaburu, C.N.; Vasile, C. Morphological, thermal and rheological characterization of polyvinyl alcohol/chitosan blends. Cellul. Chem. Technol. 2012, 46, 571–581. [Google Scholar]
- Azman, H.; Mat, U.W.; Ching, Y.C. Mechanical and morphological properties of PP/NR/LLDPE ternary blend - Effect of HVA-2. Polym. Test. 2003, 22, 281–290. [Google Scholar]
- Song, Z.; Xiao, H.; Zhao, Y. Hydrophobic-modified nano-cellulose fiber/pla biodegradable composites for lowering water vapor transmission rate (wvtr) of paper. Carbohydr. Polym. 2014, 111, 442–448. [Google Scholar] [CrossRef] [PubMed]
- Mohd, A.C.M.; Ching, Y.C.; Luqman, C.A.; Poh, S.C.; Chuah, C.H. Review of bionanocomposite coating films and their applications. Polymers 2016, 8, 246. [Google Scholar] [CrossRef]
- Nurfatimah, B.; Ching, Y.C.; Luqman, C.A.; Chantara, T.R.; Azowa, N. Effect of methyl methacrylate grafted kenaf on mechanical properties of polyvinyl chloride/ethylene vinyl acetate composites. Compos. Part A 2014, 63, 45–50. [Google Scholar]
- Tan, B.K.; Ching, Y.C.; Poh, S.C.; Abdullah, L.; Gan, S.N. A review of natural fiber reinforced poly(vinyl alcohol) based composites: Application and opportunity. Polymers 2015, 7, 2205–2222. [Google Scholar] [CrossRef]
- Srinivasa, P.C.; Ramesh, M.N.; Kumar, K.R.; Tharanathan, R.N. Properties and sorption studies of chitosan–polyvinyl alcohol blend films. Carbohydr. Polym. 2003, 53, 431–438. [Google Scholar] [CrossRef]
- Vidyalakshmi, K.; Rashmi, K.N.; Pramod Kumar, T.M.; Siddaramaiah. Studies on formulation and in vitro evaluation of pva/chitosan blend films for drug delivery. J. Macromol. Sci. Part A 2004, 41, 1115–1122. [Google Scholar] [CrossRef]
- Lewandowska, K. Miscibility and thermal stability of poly(vinyl alcohol)/chitosan mixtures. Thermochim. Acta 2009, 493, 42–48. [Google Scholar] [CrossRef]
- Pandey, J.K.; Chu, W.S.; Kim, C.S.; Lee, C.S.; Ahn, S.H. Bio-nano reinforcement of environmentally degradable polymer matrix by cellulose whiskers from grass. Compos. Part B Eng. 2009, 40, 676–680. [Google Scholar] [CrossRef]
- Fujisawa, S.; Okita, Y.; Fukuzumi, H.; Saito, T.; Isogai, A. Preparation and characterization of tempo-oxidized cellulose nanofibril films with free carboxyl groups. Carbohydr. Polym. 2011, 84, 579–583. [Google Scholar] [CrossRef]
- Ching, Y.C.; Rahman, A.; Ching, K.Y.; Sukiman, N.L.; Cheng, H.C. Preparation and characterization of polyvinyl alcohol-based composite reinforced with nanocellulose and nanosilica. BioResources 2015, 10, 3364–3377. [Google Scholar] [CrossRef]
- Yee, Y.Y.; Ching, Y.C.; Rozali, S.; Hashim, N.A.; Singh, R. Preparation and characterization of poly (lactic acid)-based composite reinforced with oil palm empty fruit bunch fiber and nanosilica. BioResources 2016, 11, 2269–2286. [Google Scholar] [CrossRef]
- Ching, Y.C.; Nurehan, S. Effect of nanosilica filled polyurethane composite coating on polypropylene substrate. J. Nanomater. 2013. [Google Scholar] [CrossRef]
- Yong, K.C.; Ching, Y.C.; Afzan, M.; Lim, Z.K.; Chong, K.E. Mechanical and thermal properties of chemical treated oil palm empty fruit bunches fiber reinforced polyvinyl alcohol composite. J. Biobased Mater. Bioenergy 2015, 9, 231–235. [Google Scholar]
- Ng, T.S.; Ching, Y.C.; Awanis, N.; Ishenny, N.; Rahman, M.R. Effect of bleaching condition on thermal properties and UV-transmittance of PVA/cellulose biocomposites. Mater. Res. Innov. 2014, 18, 400–404. [Google Scholar] [CrossRef]
- Ching, Y.C.; Ershad, A.; Luqman, C.A.; Choo, K.W.; Yong, C.K.; Sabariah, J.J.; Chuah, C.H.; Liou, N.S. Rheological properties of cellulose nanocrystal-embedded polymer composites: a review. Cellulose 2016, 23, 1011–1030. [Google Scholar] [CrossRef]
- Rubentheren, V.; Thomas, A.W.; Ching, Y.C.; Praveena, N.; Erfan, S.; Christopher, F. Effects of heat treatment on chitosan nanocomposite film reinforced with nanocrystalline cellulose and tannic acid. Carbohydr. Polym. 2016, 140, 202–208. [Google Scholar] [CrossRef] [PubMed]
- Ching, Y.C.; Song, N.L.; Luqman, C.A.; Thomas, S.Y.C.; Azowa, I.; Chantara, T.R. Characterization of mechanical properties: Low-density polyethylene nanocomposite using nanoalumina particle as filler. J. Nanomater. 2012. [Google Scholar] [CrossRef]
- Khan, A.; Khan, R.A.; Salmieri, S.; Le Tien, C.; Riedl, B.; Bouchard, J.; Chauve, G.; Tan, V.; Kamal, M.R.; Lacroix, M. Mechanical and barrier properties of nanocrystalline cellulose reinforced chitosan based nanocomposite films. Carbohydr. Polym. 2012, 90, 1601–1608. [Google Scholar] [CrossRef] [PubMed]
- Li, Q.; Zhou, J.; Zhang, L. Structure and properties of the nanocomposite films of chitosan reinforced with cellulose whiskers. J. Polym. Sci. Part B Polym. Phys. 2009, 47, 1069–1077. [Google Scholar] [CrossRef]
- Mehrali, M.; Shirazi, F.S.; Mehrali, M.; Metselaar, H.S.C.; Kadri, N.A.B.; Osman, N.A.A. Dental implants from functionally graded materials. J. Biomed. Mater. Res. Part A 2013, 101, 3046–3057. [Google Scholar] [CrossRef] [PubMed]
- Zhuang, P.Y.; Li, Y.L.; Fan, L.; Lin, J.; Hu, Q.L. Modification of chitosan membrane with poly(vinyl alcohol) and biocompatibility evaluation. Int. J. Biol. Macromol. 2012, 50, 658–663. [Google Scholar] [CrossRef] [PubMed]
- Rueda, L.; Saralegui, A.; d’Arlas, B.F.; Zhou, Q.; Berglund, L.A.; Corcuera, M.; Mondragon, I.; Eceiza, A. Cellulose nanocrystals/polyurethane nanocomposites. Study from the viewpoint of microphase separated structure. Carbohydr. Polym. 2013, 92, 751–757. [Google Scholar] [CrossRef] [PubMed]
- Li, H.-Z.; Chen, S.-C.; Wang, Y.-Z. Preparation and characterization of nanocomposites of polyvinyl alcohol/cellulose nanowhiskers/chitosan. Compos. Sci. Technol. 2015, 115, 60–65. [Google Scholar] [CrossRef]
- Baharuddin, N.H.; Sulaiman, N.M.N.; Aroua, M.K. Removal of zinc and lead ions by polymer- enhanced ultrafiltration using unmodified starch as novel binding polymer. Int. J. Environ Sci. Technol. 2015, 12, 1825–1834. [Google Scholar] [CrossRef]
- Yusof, Y.; Illias, H.; Kadir, M. Incorporation of NH4Br in PVA-chitosan blend-based polymer electrolyte and its effect on the conductivity and other electrical properties. Ionics 2014, 20, 1235–1245. [Google Scholar] [CrossRef]
- El-Hefian, E.A.; Nasef, M.M.; Yahaya, A.H. Preparation and characterization of chitosan/poly (vinyl alcohol) blended films: Mechanical, thermal and surface investigations. J. Chem. 2011, 8, 91–96. [Google Scholar] [CrossRef]
- Wu, H.; Wan, Y.; Cao, X.; Wu, Q. Interlocked chitosan/poly (dl-lactide) blends. Mater. Lett. 2008, 62, 330–334. [Google Scholar] [CrossRef]
- Soni, B.; Schilling, M.W.; Mahmoud, B. Transparent bionanocomposite films based on chitosan and tempo-oxidized cellulose nanofibers with enhanced mechanical and barrier properties. Carbohydr. Polym. 2016, 151, 779–789. [Google Scholar] [CrossRef]
- El Miri, N.; Abdelouahdi, K.; Zahouily, M.; Fihri, A.; Barakat, A.; Solhy, A.; El Achaby, M. Bio-nanocomposite films based on cellulose nanocrystals filled polyvinyl alcohol/chitosan polymer blend. J. Appl. Polym. Sci. 2015, 132. [Google Scholar] [CrossRef]
- Naveen Kumar, H.M.P.; Prabhakar, M.N.; Venkata Prasad, C.; Madhusudhan Rao, K.; Ashok Kumar Reddy, T.V.; Chowdoji Rao, K.; Subha, M.C.S. Compatibility studies of chitosan/pva blend in 2% aqueous acetic acid solution at 30 °C. Carbohydr. Polym. 2010, 82, 251–255. [Google Scholar] [CrossRef]
- El-Hefian, E.A.; Nasef, M.M.; Yahaya, A.H. The preparation and characterization of chitosan/poly (vinyl alcohol) blended films. J. Chem. 2010, 7, 1212–1219. [Google Scholar] [CrossRef]
- Samuels, R.J. Solid state characterization of the structure of chitosan films. J. Polym. Sci. Polym. Phys. Ed. 1981, 19, 1081–1105. [Google Scholar] [CrossRef]
- Wang, S.-F.; Shen, L.; Zhang, W.-D.; Tong, Y.-J. Preparation and mechanical properties of chitosan/carbon nanotubes composites. Biomacromolecules 2005, 6, 3067–3072. [Google Scholar] [CrossRef] [PubMed]
- Abou-Zeid, R.E.; Hassan, E.A.; Bettaieb, F.; Khiari, R.; Hassan, M.L. Use of cellulose and oxidized cellulose nanocrystals from olive stones in chitosan bionanocomposites. J. Nanomater. 2015, 2015, 1–11. [Google Scholar] [CrossRef]
- Nakane, K.; Yamashita, T.; Iwakura, K.; Suzuki, F. Properties and structure of poly (vinyl alcohol)/silica composites. J. Appl. Polym. Sci. 1999, 74, 133–138. [Google Scholar] [CrossRef]
- Zheng, H.; Du, Y.; Yu, J.; Huang, R.; Zhang, L. Preparation and characterization of chitosan/poly (vinyl alcohol) blend fibers. J. Appl. Polym. Sci. 2001, 80, 2558–2565. [Google Scholar] [CrossRef]
- Azizi, S.; Ahmad, M.B.; Ibrahim, N.A.; Hussein, M.Z.; Namvar, F. Cellulose nanocrystals/zno as a bifunctional reinforcing nanocomposite for poly(vinyl alcohol)/chitosan blend films: Fabrication, characterization and properties. Int. J. Mol. Sci. 2014, 15, 11040–11053. [Google Scholar] [CrossRef] [PubMed]
- Bodin, A.; Ahrenstedt, L.; Fink, H.; Brumer, H.; Risberg, B.; Gatenholm, P. Modification of nanocellulose with a xyloglucan–rgd conjugate enhances adhesion and proliferation of endothelial cells: Implications for tissue engineering. Biomacromolecules 2007, 8, 3697–3704. [Google Scholar] [CrossRef] [PubMed]


| Sample | First Step | |
|---|---|---|
| Tonset (±5 °C) | Tmax (±5 °C) | |
| PVA/CS = 0/100 | 261 | 274 |
| PVA/CS = 25/75 | 267 | 281 |
| PVA/CS = 50/50 | 272 | 293 |
| PVA/CS = 75/25 | 278 | 329 |
| PVA/CS = 100/0 | 287 | 340 |
| Sample | TOCNs (wt %) | First Step | |
|---|---|---|---|
| Tonset (±5 °C) | Tmax (±5 °C) | ||
| PVA/CS = 0/100 | 0.5 | 241 | 267 |
| PVA/CS = 25/75 | 0.5 | 243 | 268 |
| PVA/CS = 50/50 | 0.5 | 273 | 296 |
| PVA/CS = 75/25 | 0.5 | 260 | 332 |
| PVA/CS = 100/0 | 0.5 | 253 | 334 |
| Sample | TOCNs (wt %) | First Step | |
|---|---|---|---|
| Tonset (±5 °C) | Tmax (±5 °C) | ||
| PVA/CS | 0 | 272 | 293 |
| PVA/CS/TOCNs | 0.5 | 273 | 296 |
| PVA/CS/TOCNs | 1.0 | 276 | 299 |
| PVA/CS/TOCNs | 1.5 | 260 | 284 |
© 2016 by the authors; licensee MDPI, Basel, Switzerland. This article is an open access article distributed under the terms and conditions of the Creative Commons Attribution (CC-BY) license (http://creativecommons.org/licenses/by/4.0/).
Share and Cite
Choo, K.; Ching, Y.C.; Chuah, C.H.; Julai, S.; Liou, N.-S. Preparation and Characterization of Polyvinyl Alcohol-Chitosan Composite Films Reinforced with Cellulose Nanofiber. Materials 2016, 9, 644. https://doi.org/10.3390/ma9080644
Choo K, Ching YC, Chuah CH, Julai S, Liou N-S. Preparation and Characterization of Polyvinyl Alcohol-Chitosan Composite Films Reinforced with Cellulose Nanofiber. Materials. 2016; 9(8):644. https://doi.org/10.3390/ma9080644
Chicago/Turabian StyleChoo, Kaiwen, Yern Chee Ching, Cheng Hock Chuah, Sabariah Julai, and Nai-Shang Liou. 2016. "Preparation and Characterization of Polyvinyl Alcohol-Chitosan Composite Films Reinforced with Cellulose Nanofiber" Materials 9, no. 8: 644. https://doi.org/10.3390/ma9080644