4.1. Workability
Table 3 shows the average of the Abrams cone slump results for each of the mixes.
Table 4 shows the (w/c) effective and it also gives the percentage of variation due to the use of FRCA for each concrete family (Δ
FRCA) and the percentage of variation due to the use of superplasticizers SP1 and SP2 with respect to the superplasticizer-free concrete (Δ
SP).
Table 4.
Effective w/c ratio of each of the concrete’s families and FRCA replacement ratios.
Table 4.
Effective w/c ratio of each of the concrete’s families and FRCA replacement ratios.
| Family | C0 | C1 | C2 |
|---|
| FRCA (%) | (w/c) Effective | ΔFRCA (%) | ΔSP (%) | (w/c) Effective | ΔFRCA (%) | ΔSP (%) | (w/c) Effective | ΔFRCA (%) | ΔSP (%) |
|---|
| 0 | 0.51 | 0.00 | 0.00 | 0.43 | 0.00 | −15.69 | 0.38 | 0.00 | −25.49 |
| 10 | 0.52 | 1.96 | 0.00 | 0.45 | 4.65 | −13.46 | 0.39 | 2.63 | −25.00 |
| 30 | 0.52 | 1.96 | 0.00 | 0.47 | 9.30 | −9.62 | 0.39 | 2.63 | −25.00 |
| 50 | 0.53 | 3.92 | 0.00 | 0.49 | 13.95 | −7.55 | 0.40 | 5.26 | −24.53 |
| 100 | 0.55 | 7.84 | 0.00 | 0.50 | 16.28 | −9.09 | 0.41 | 7.89 | −25.45 |
The use of superplasticizers reduced the effective (w/c) ratio for all replacement ratios of FNA with FRCA. The lowest values of (w/c)ef were achieved in concrete made with SP2. The (w/c)ef ratio increased with the use of FRCA for the three concrete families, which is explained by the greater angularity of the recycled particles and the need to use more water to achieve the same slump. Concrete made with SP1 reduced the (w/c)ef ratio with respect to RC0 concrete family between 15.7% and 9.09% for replacement rates of 0% and 100%, respectively, while concrete made with SP2 maintained a reduction in the (w/c)ef ratio of around 25% for every replacement ratio. This shows that SP1 lost effectiveness for increasing percentages of FRCA, while SP2 was impervious to that effect.
Similar results were obtained by Pereira
et al. [
14]. These authors attributed the loss of effectiveness of SP1 to the higher specific surface of cement present in concrete with FRCA, since these lignosulfonate-based superplasticizers act mainly by electrostatic repulsion onto the surface of the cement particles. On the other hand, the dispersion phenomenon in polycarboxylic acids superplasticizers (SP2) is mainly due to the steric hindrance effect, less affected by the surface of cement particles.
4.2. Bulk Density of Fresh Concrete
Table 5 shows the average of the bulk density of fresh concrete for each of the mixes and two columns with the effect of FRCA (Δ
FRCA) and of the superplasticizers (Δ
SP).
Table 5.
Fresh concrete density of each of the concrete’s families and FRCA replacement ratios.
Table 5.
Fresh concrete density of each of the concrete’s families and FRCA replacement ratios.
| Family | C0 | C1 | C2 |
|---|
| FRCA (%) | Density (kg/m3) | ΔFRCA (%) | ΔSP (%) | Density (kg/m3) | ΔFRCA (%) | ΔSP (%) | Density (kg/m3) | ΔFRCA (%) | ΔSP (%) |
|---|
| 0 | 2372.40 | 0.00 | 0.00 | 2438.80 | 0.00 | 2.80 | 2437.00 | 0.00 | 2.72 |
| 10 | 2361.90 | −0.44 | 0.00 | 2429.90 | −0.36 | 2.88 | 2431.30 | −0.23 | 2.94 |
| 30 | 2358.50 | −0.59 | 0.00 | 2417.80 | −0.86 | 2.51 | 2426.50 | −0.43 | 2.88 |
| 50 | 2318.70 | −2.26 | 0.00 | 2368.60 | −2.88 | 2.15 | 2391.20 | −1.88 | 3.12 |
| 100 | 2295.10 | −3.26 | 0.00 | 2347.40 | −3.75 | 2.28 | 2346.90 | −3.70 | 2.26 |
In all concrete families, density decreased when increasing the use of FRCA, which is justified by the lower density of the FRCA [
16].
For each replacement ratio, the concrete families made with SP1 and SP2 showed higher density than the superplasticizer-free family (C0). This is justified by the lower (w/c)ef ratio in concrete families C1 and C2, although the differences between C1 and C2 were small.
Most authors have shown that the density of concrete made without admixtures decreases linearly with the rate of recycled aggregates [
34,
44]. Pereira
et al. [
14] showed second-degree polynomial curves to explain the effect of replacement ratio on the relative density of FRCA-concrete.
4.3. Compressive Strength
Table 6 shows the average compressive strength at 28 days (f
cm) for each of the mixes and the values of Δ
FRCA and Δ
SP defined above.
For each of the concrete families (CO, C1 and C2), the compressive strength decreased for higher FRCA contents, except for concrete family C0 at 10% replacement ratio, which can be explained by the possible filler effect of the very fine broken particles from FRCA generated during the mixing process that offsets the higher porosity of the recycled aggregates [
45]. The compressive strength of the mix made with 100% replacement ratio fell around 17%, 29% and 20% relative to RC0, RC1 and RC2, respectively, which shows the greater sensibility of SP1 to the use of FRCA.
Table 6.
28-day compressive strength of each of the concrete’s families and FRCA replacement ratios.
Table 6.
28-day compressive strength of each of the concrete’s families and FRCA replacement ratios.
| Family | CO | C1 | C2 |
|---|
| FRCA (%) | Compressive Strength (MPa) | ΔFRCA (%) | ΔSP (%) | Compressive Strength (MPa) | ΔFRCA (%) | ΔSP (%) | Compressive Strength (MPa) | ΔFRCA (%) | ΔSP (%) |
|---|
| 0 | 49.37 | 0.00 | 0.00 | 66.79 | 0.00 | 35.29 | 80.64 | 0.00 | 63.33 |
| 10 | 51.17 | 3.65 | 0.00 | 63.86 | −4.39 | 24.80 | 77.41 | −3.99 | 51.29 |
| 30 | 47.21 | −4.38 | 0.00 | 61.65 | −7.69 | 30.60 | 71.73 | −11.04 | 51.95 |
| 50 | 43.53 | −11.83 | 0.00 | 58.73 | −12.06 | 34.94 | 69.31 | −14.05 | 59.23 |
| 100 | 41.20 | −16.54 | 0.00 | 47.36 | −29.10 | 14.93 | 64.72 | −19.74 | 57.07 |
For each replacement ratio, the use of superplasticizers increased compressive strength. This is due to the lower (w/c)
ef ratio of the mixes made with SP (
Table 4). It is significant that the concrete made with 100% FRCA and SP2 (C2.100) showed an increase in the compressive strength of 31.1% relative to the reference concrete (RC0) made with FNA only. This is justified because the (w/c)
ef ratio was 19.6% lower in C2.100 than RC0 (
Table 4).
Pereira
et al. [
14] found a lesser effect of FRCA on the compressive strength. These authors state that the total replacement of FNA with FRCA reduced 2.3%, 15.4% and 3.4% the compressive strength at 28 days for concrete made without SP, with SP1 and with SP2, respectively.
4.4. Water Absorption by Immersion
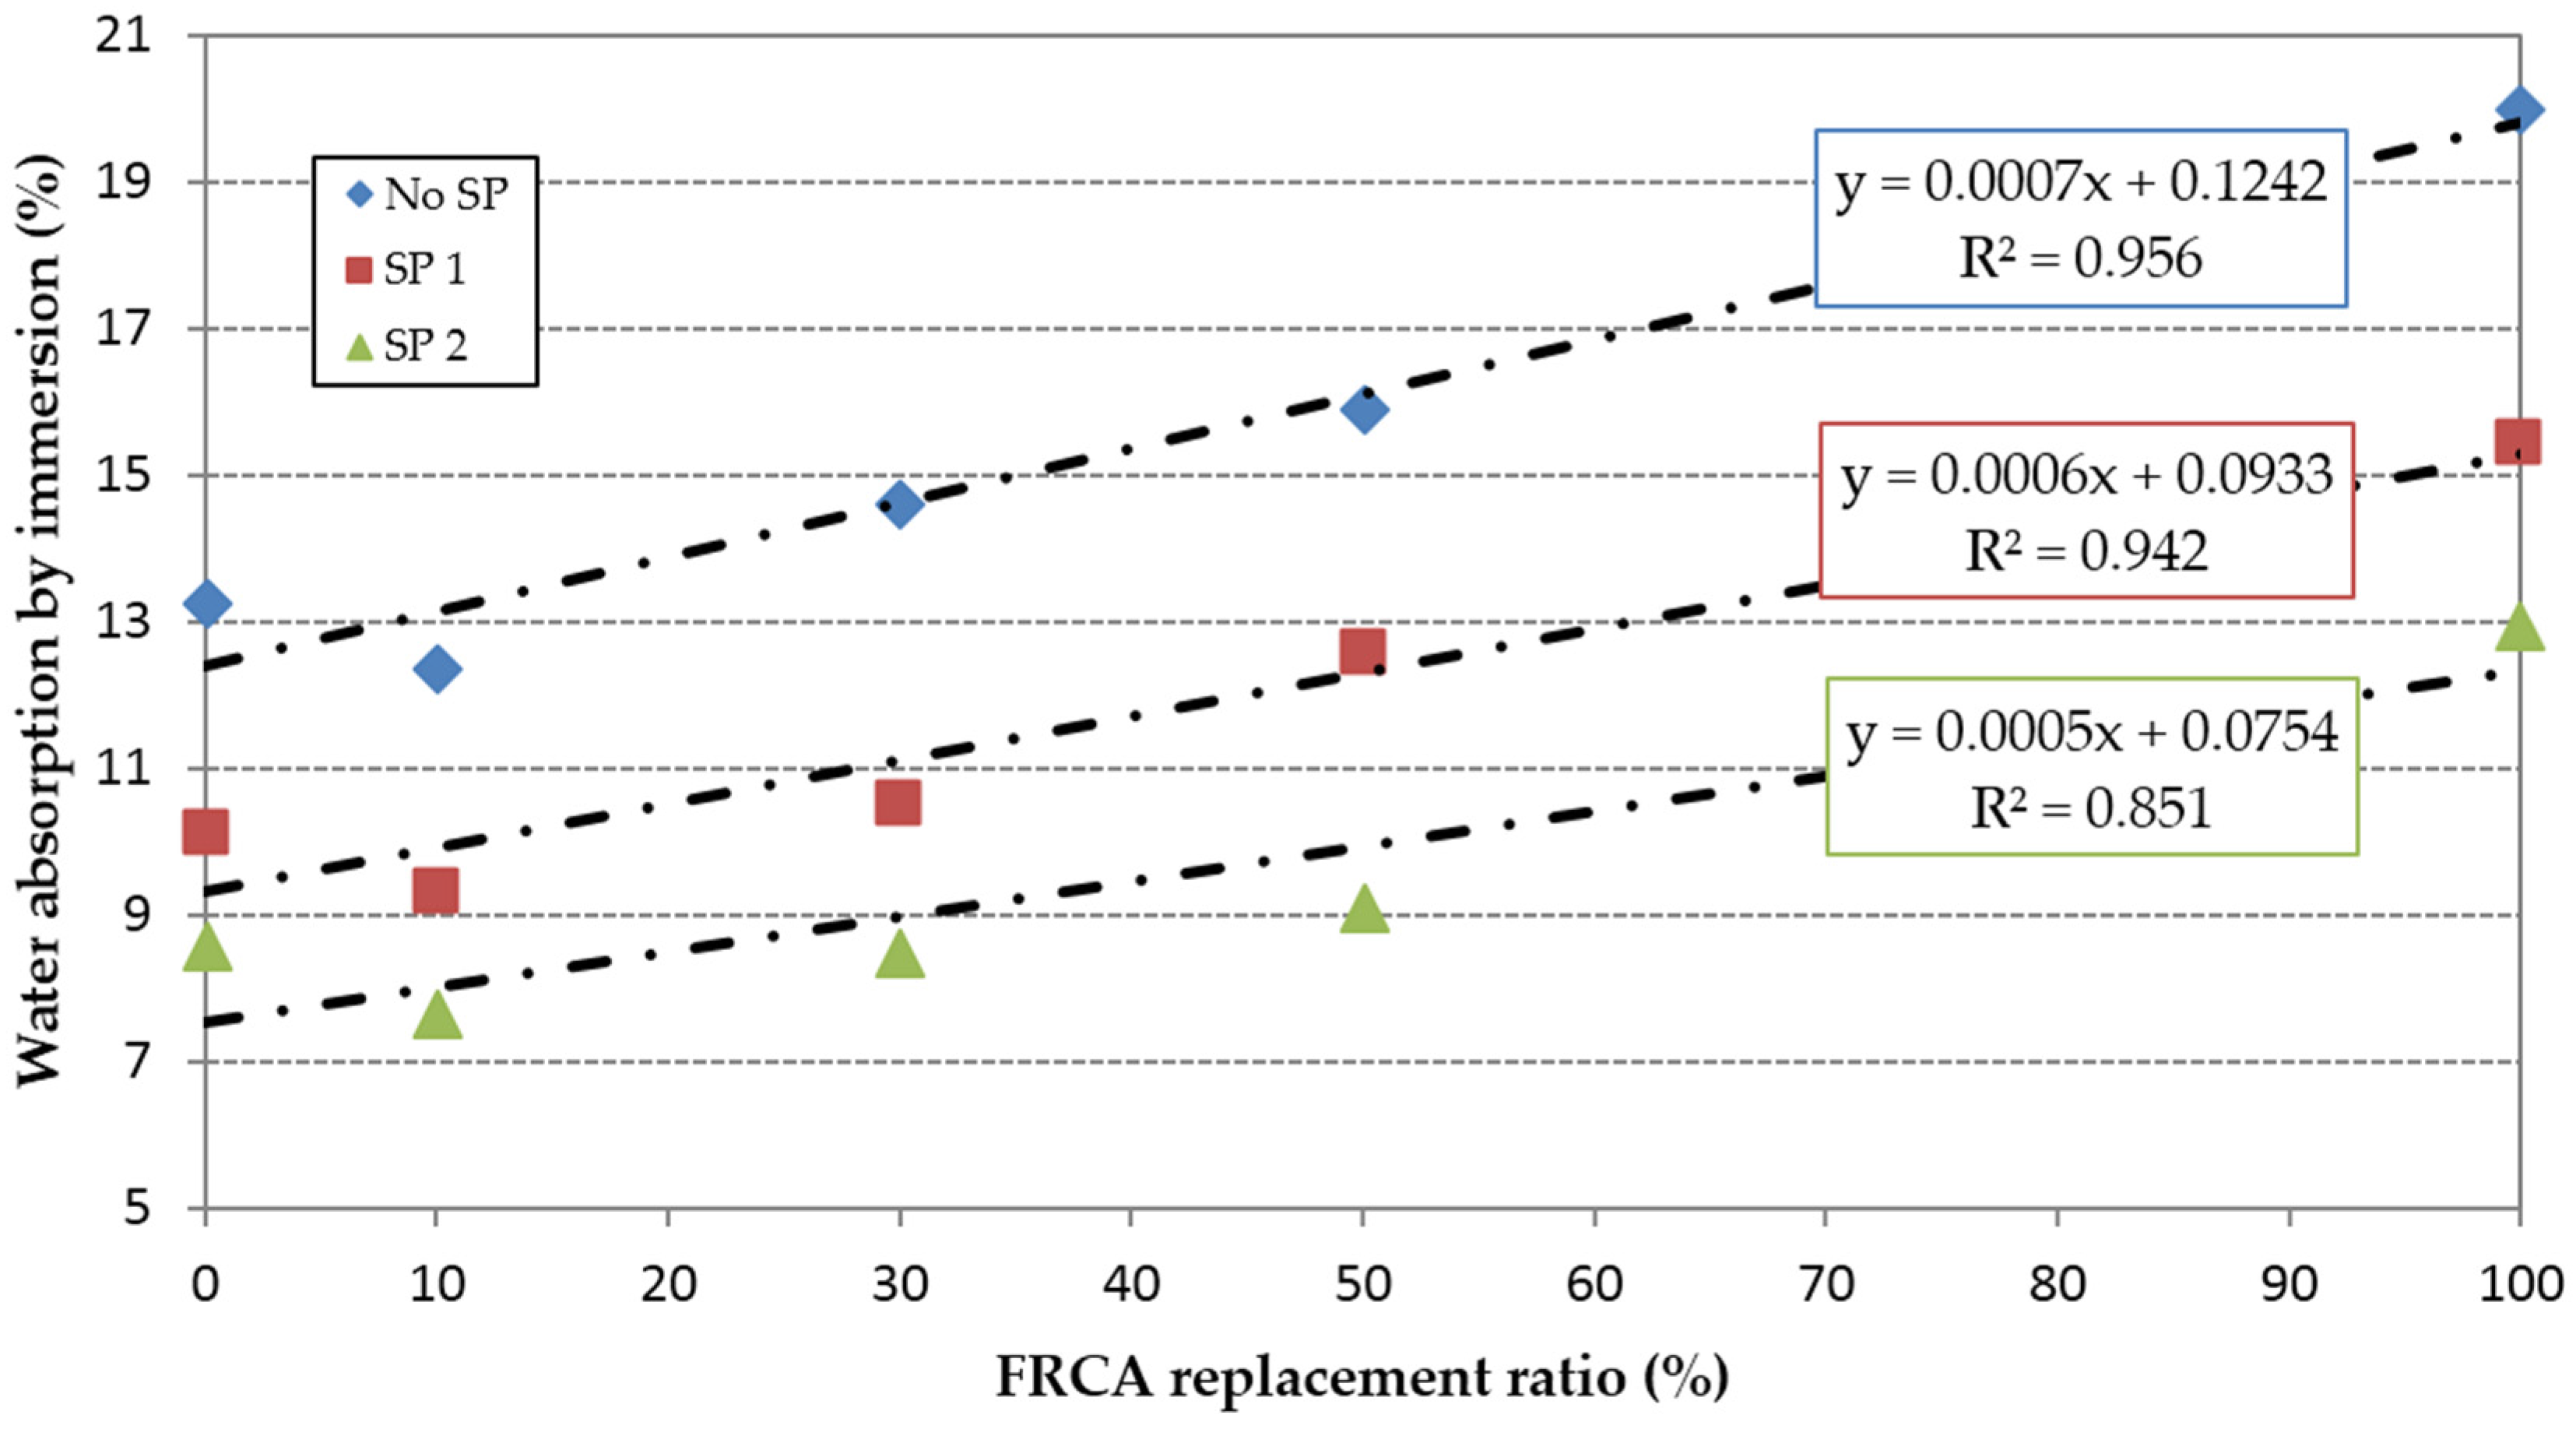
Figure 4 shows that water absorption by immersion increased linearly when the replacement ratio of FRCA increased in all concrete families. This is associated with the higher porosity of the mixes made with FRCA. One exception to this trend occurred for the 10% replacement ratio, which resulted in a decrease in the water absorption of 7%, 7.8% and 11.3% relative to the reference concrete mixes RC0, RC1 and RC2 respectively. This can be attributed to a filler effect of the broken particles from the FRCA during the mixing process that offsets the higher porosity of the recycled aggregates. The water absorption decreased between 21% and 28% in the concrete family made with SP1 and between 35% and 43% in the concrete family made with SP2. Concrete made with 100% replacement of FNA with FRCA and SP2 dropped the water absorption by immersion a 2.4% relative to the reference concrete (RC0), while increases of 16.3% were observed with the use of SP1.
Figure 4.
Water absorption by immersion.
Figure 4.
Water absorption by immersion.
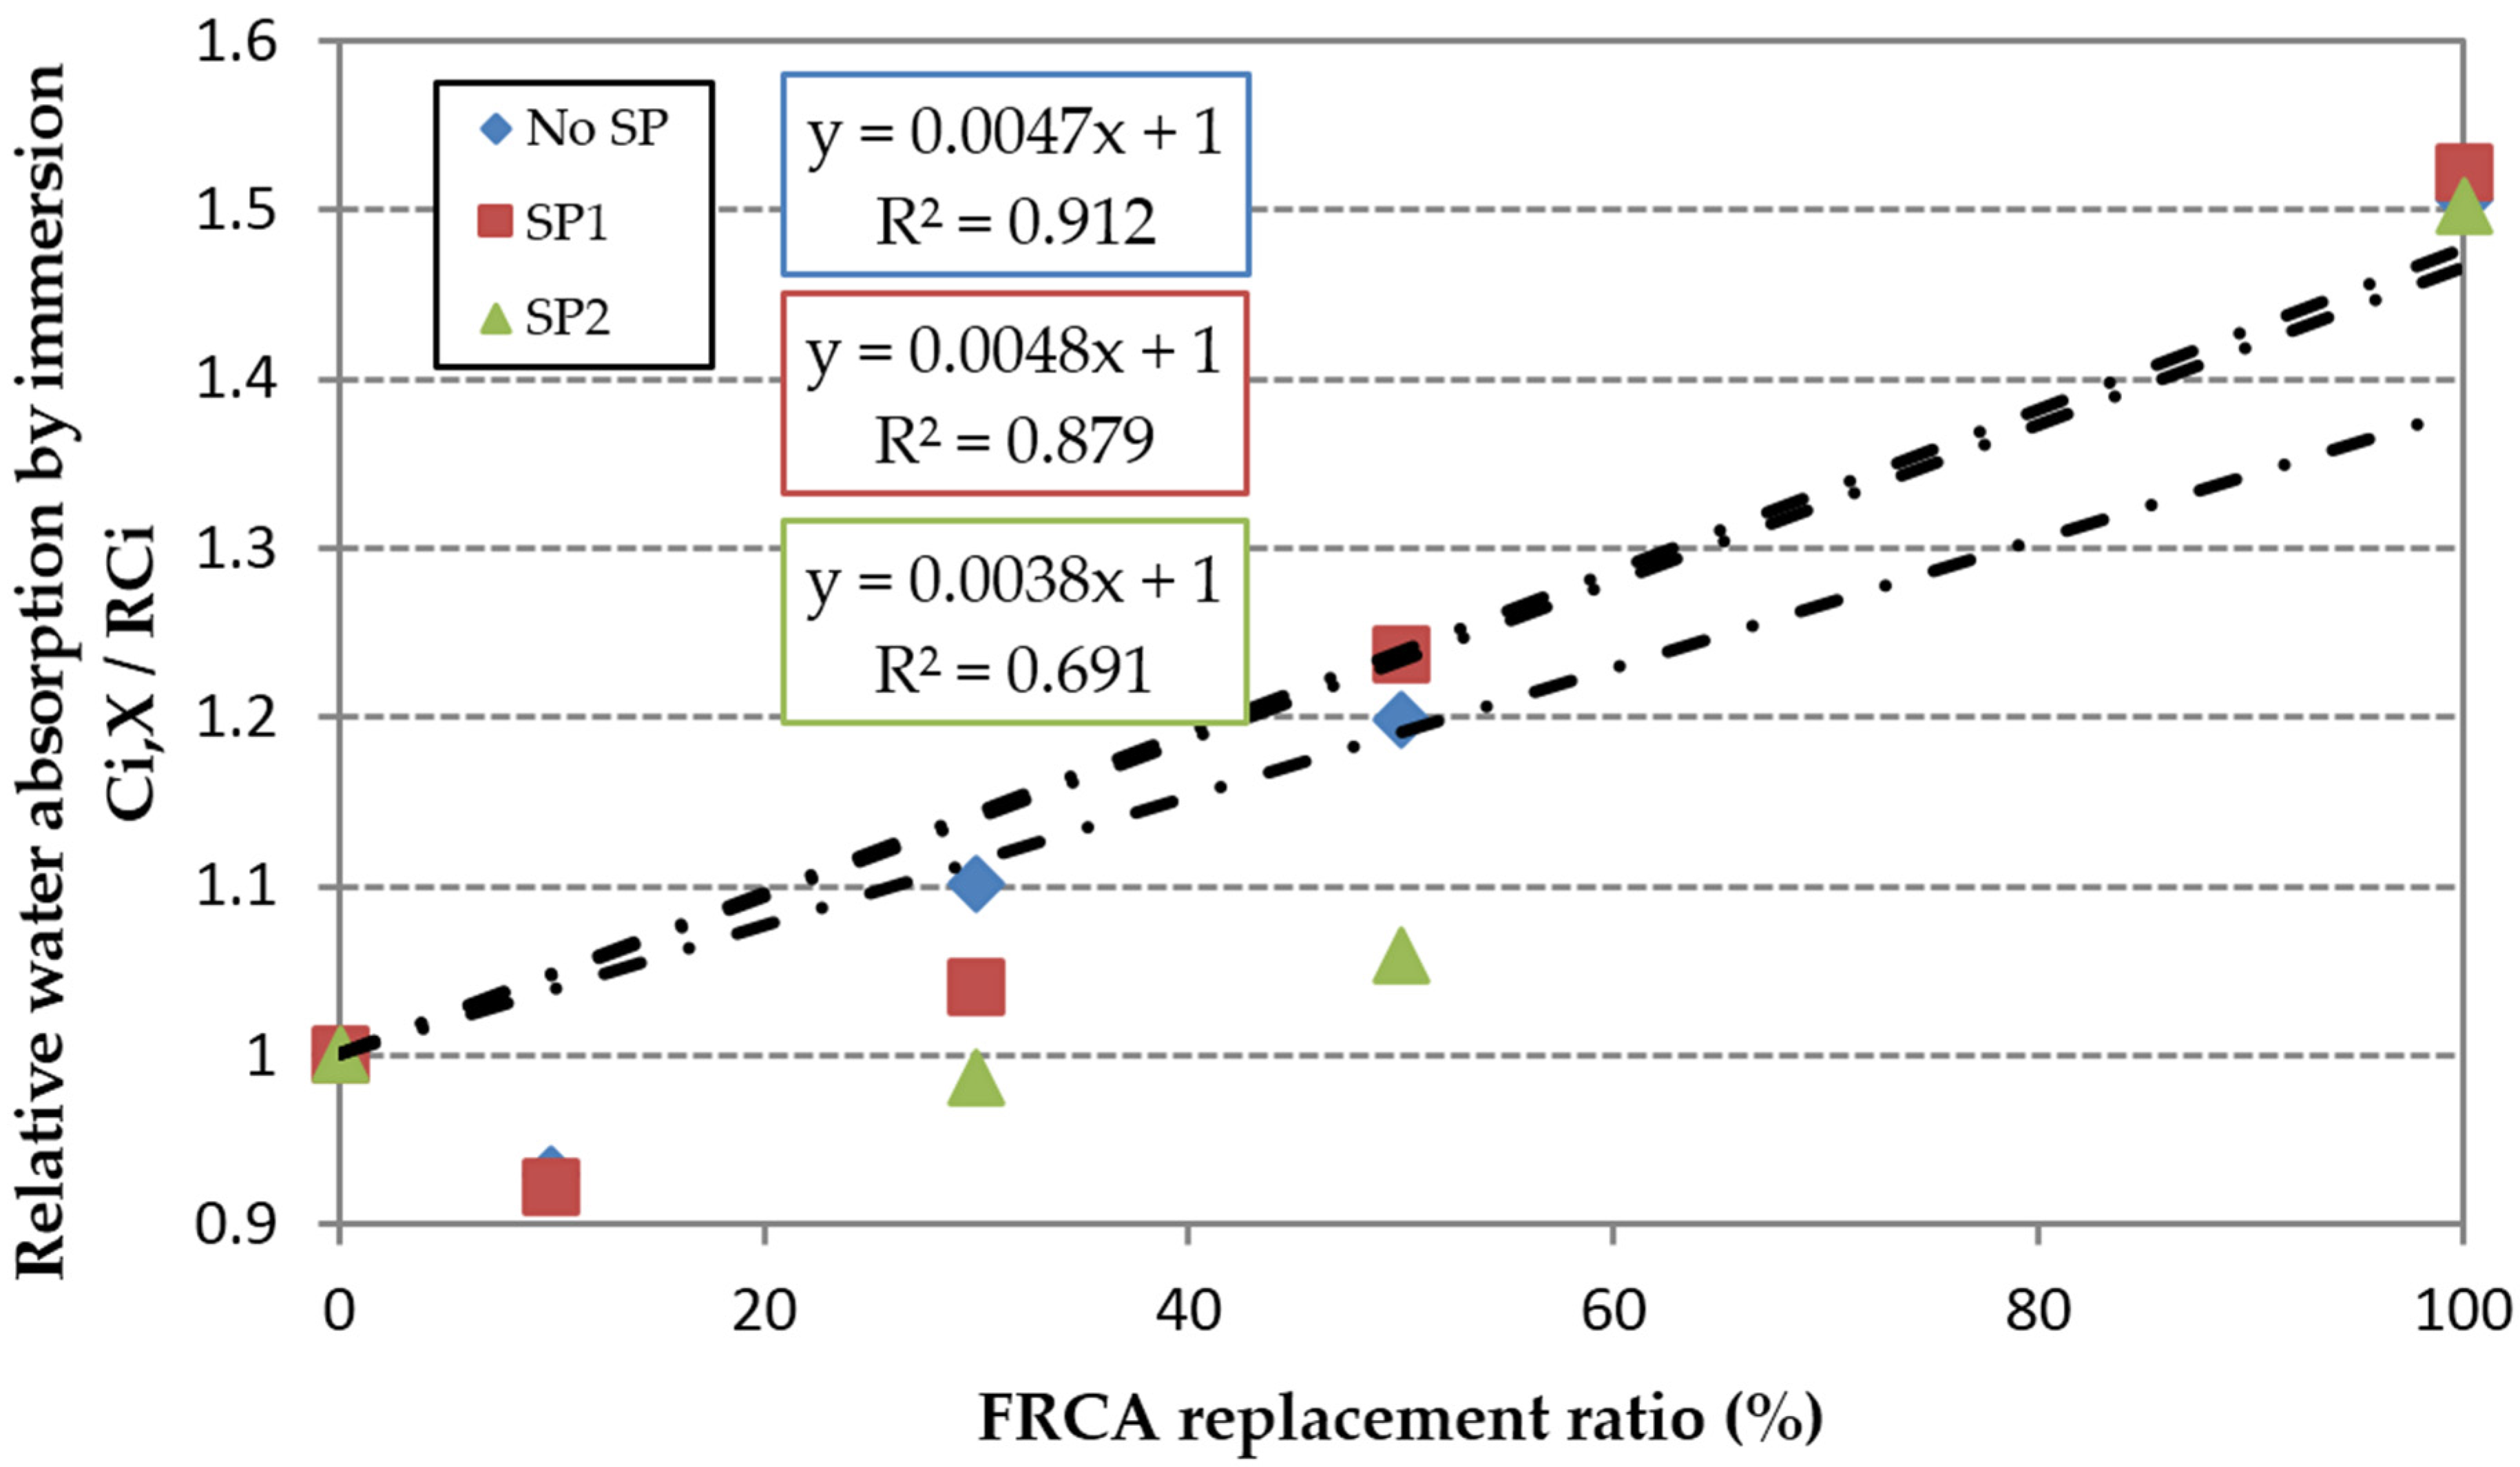
In relative terms the water absorption by immersion was similarly affected by the use of FRCA in the three families of concrete, since the slopes of the linear trends were very similar (
Figure 5); as can be seen, the linear trend when SP was used is not so clear.
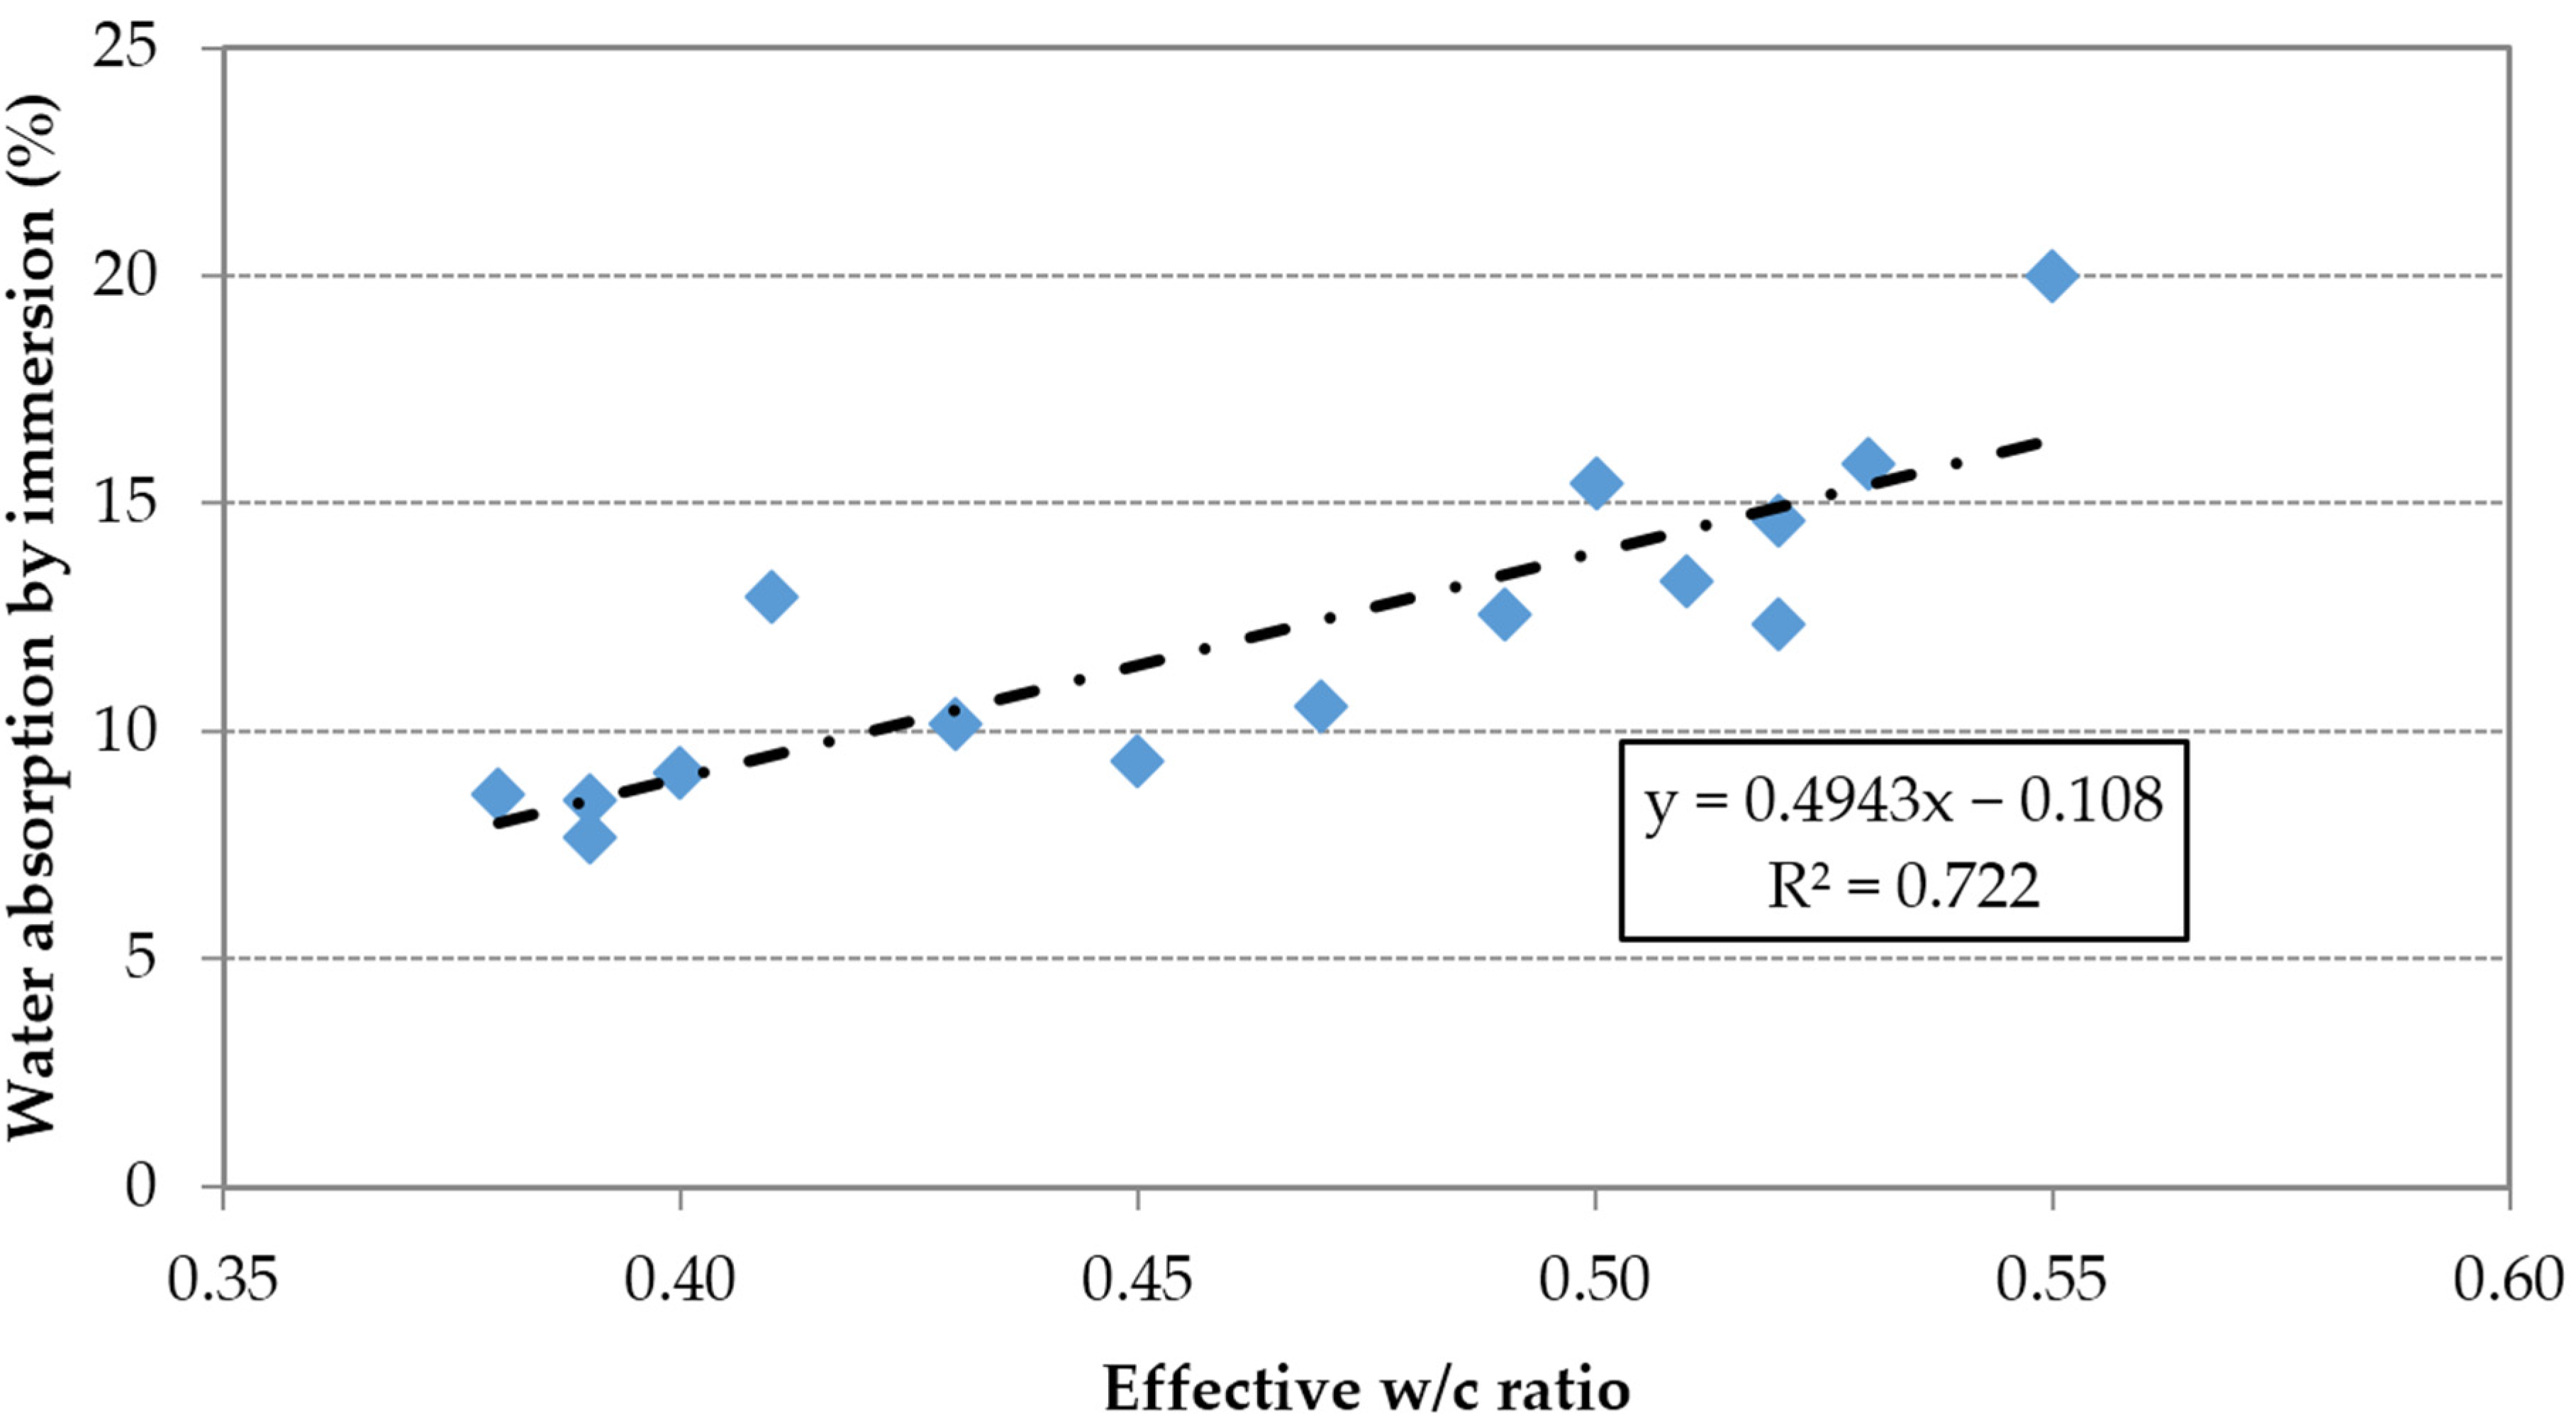
Using the results of the 15mixes, a direct relationship between water absorption by immersion and effective w/c ratio can be observed (
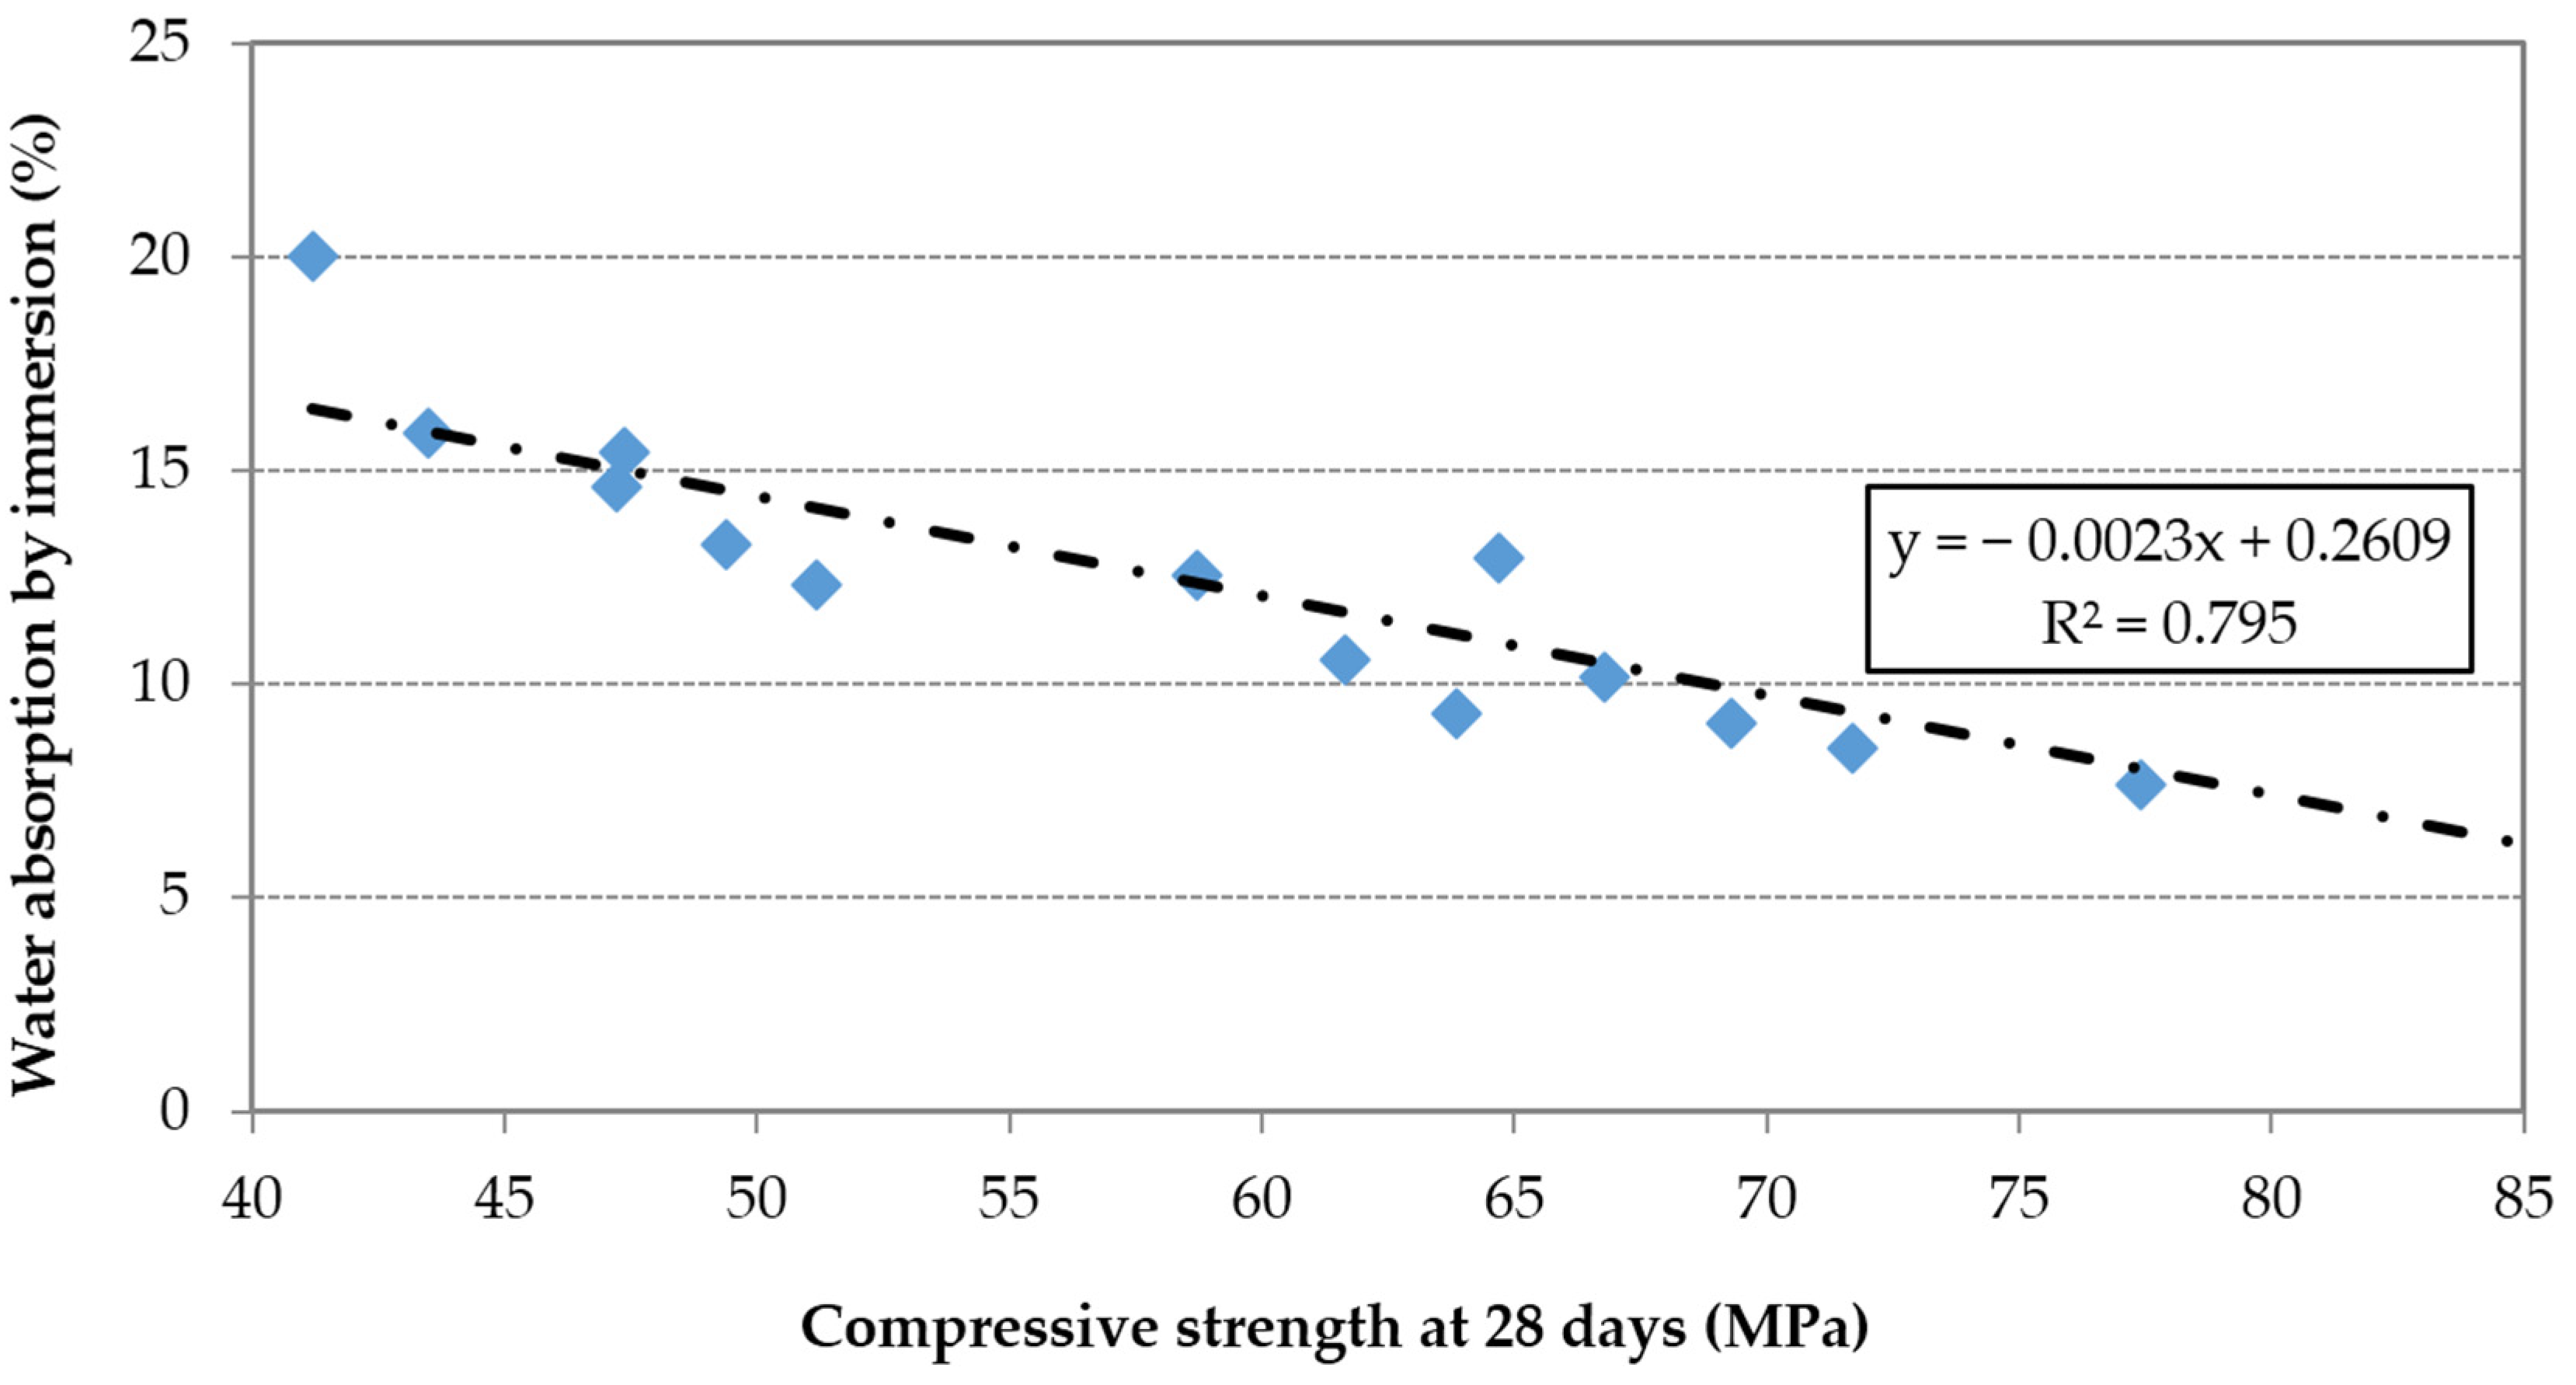
Figure 6). Furthermore, this property was inversely proportional to the compressive strength (
Figure 7).
Figure 5.
Influence of FRCA replacement ratio on the relative water absorption by immersion.
Figure 5.
Influence of FRCA replacement ratio on the relative water absorption by immersion.
Figure 6.
Water absorption by immersion vs. effective w/c ratio.
Figure 6.
Water absorption by immersion vs. effective w/c ratio.
Figure 7.
Water absorption by immersion vs. 28-day compressive strength.
Figure 7.
Water absorption by immersion vs. 28-day compressive strength.
According to the literature review, manufacturing of concrete made with FRCA without admixtures or conventional superplasticizers significantly increased the water absorption by immersion parameter [
12,
22]. So, in view of the results obtained, it is possible to make structural concrete with FRCA and high-performance superplasticizer maintaining the water absorption by immersion values. This is an unprecedented result in the literature.
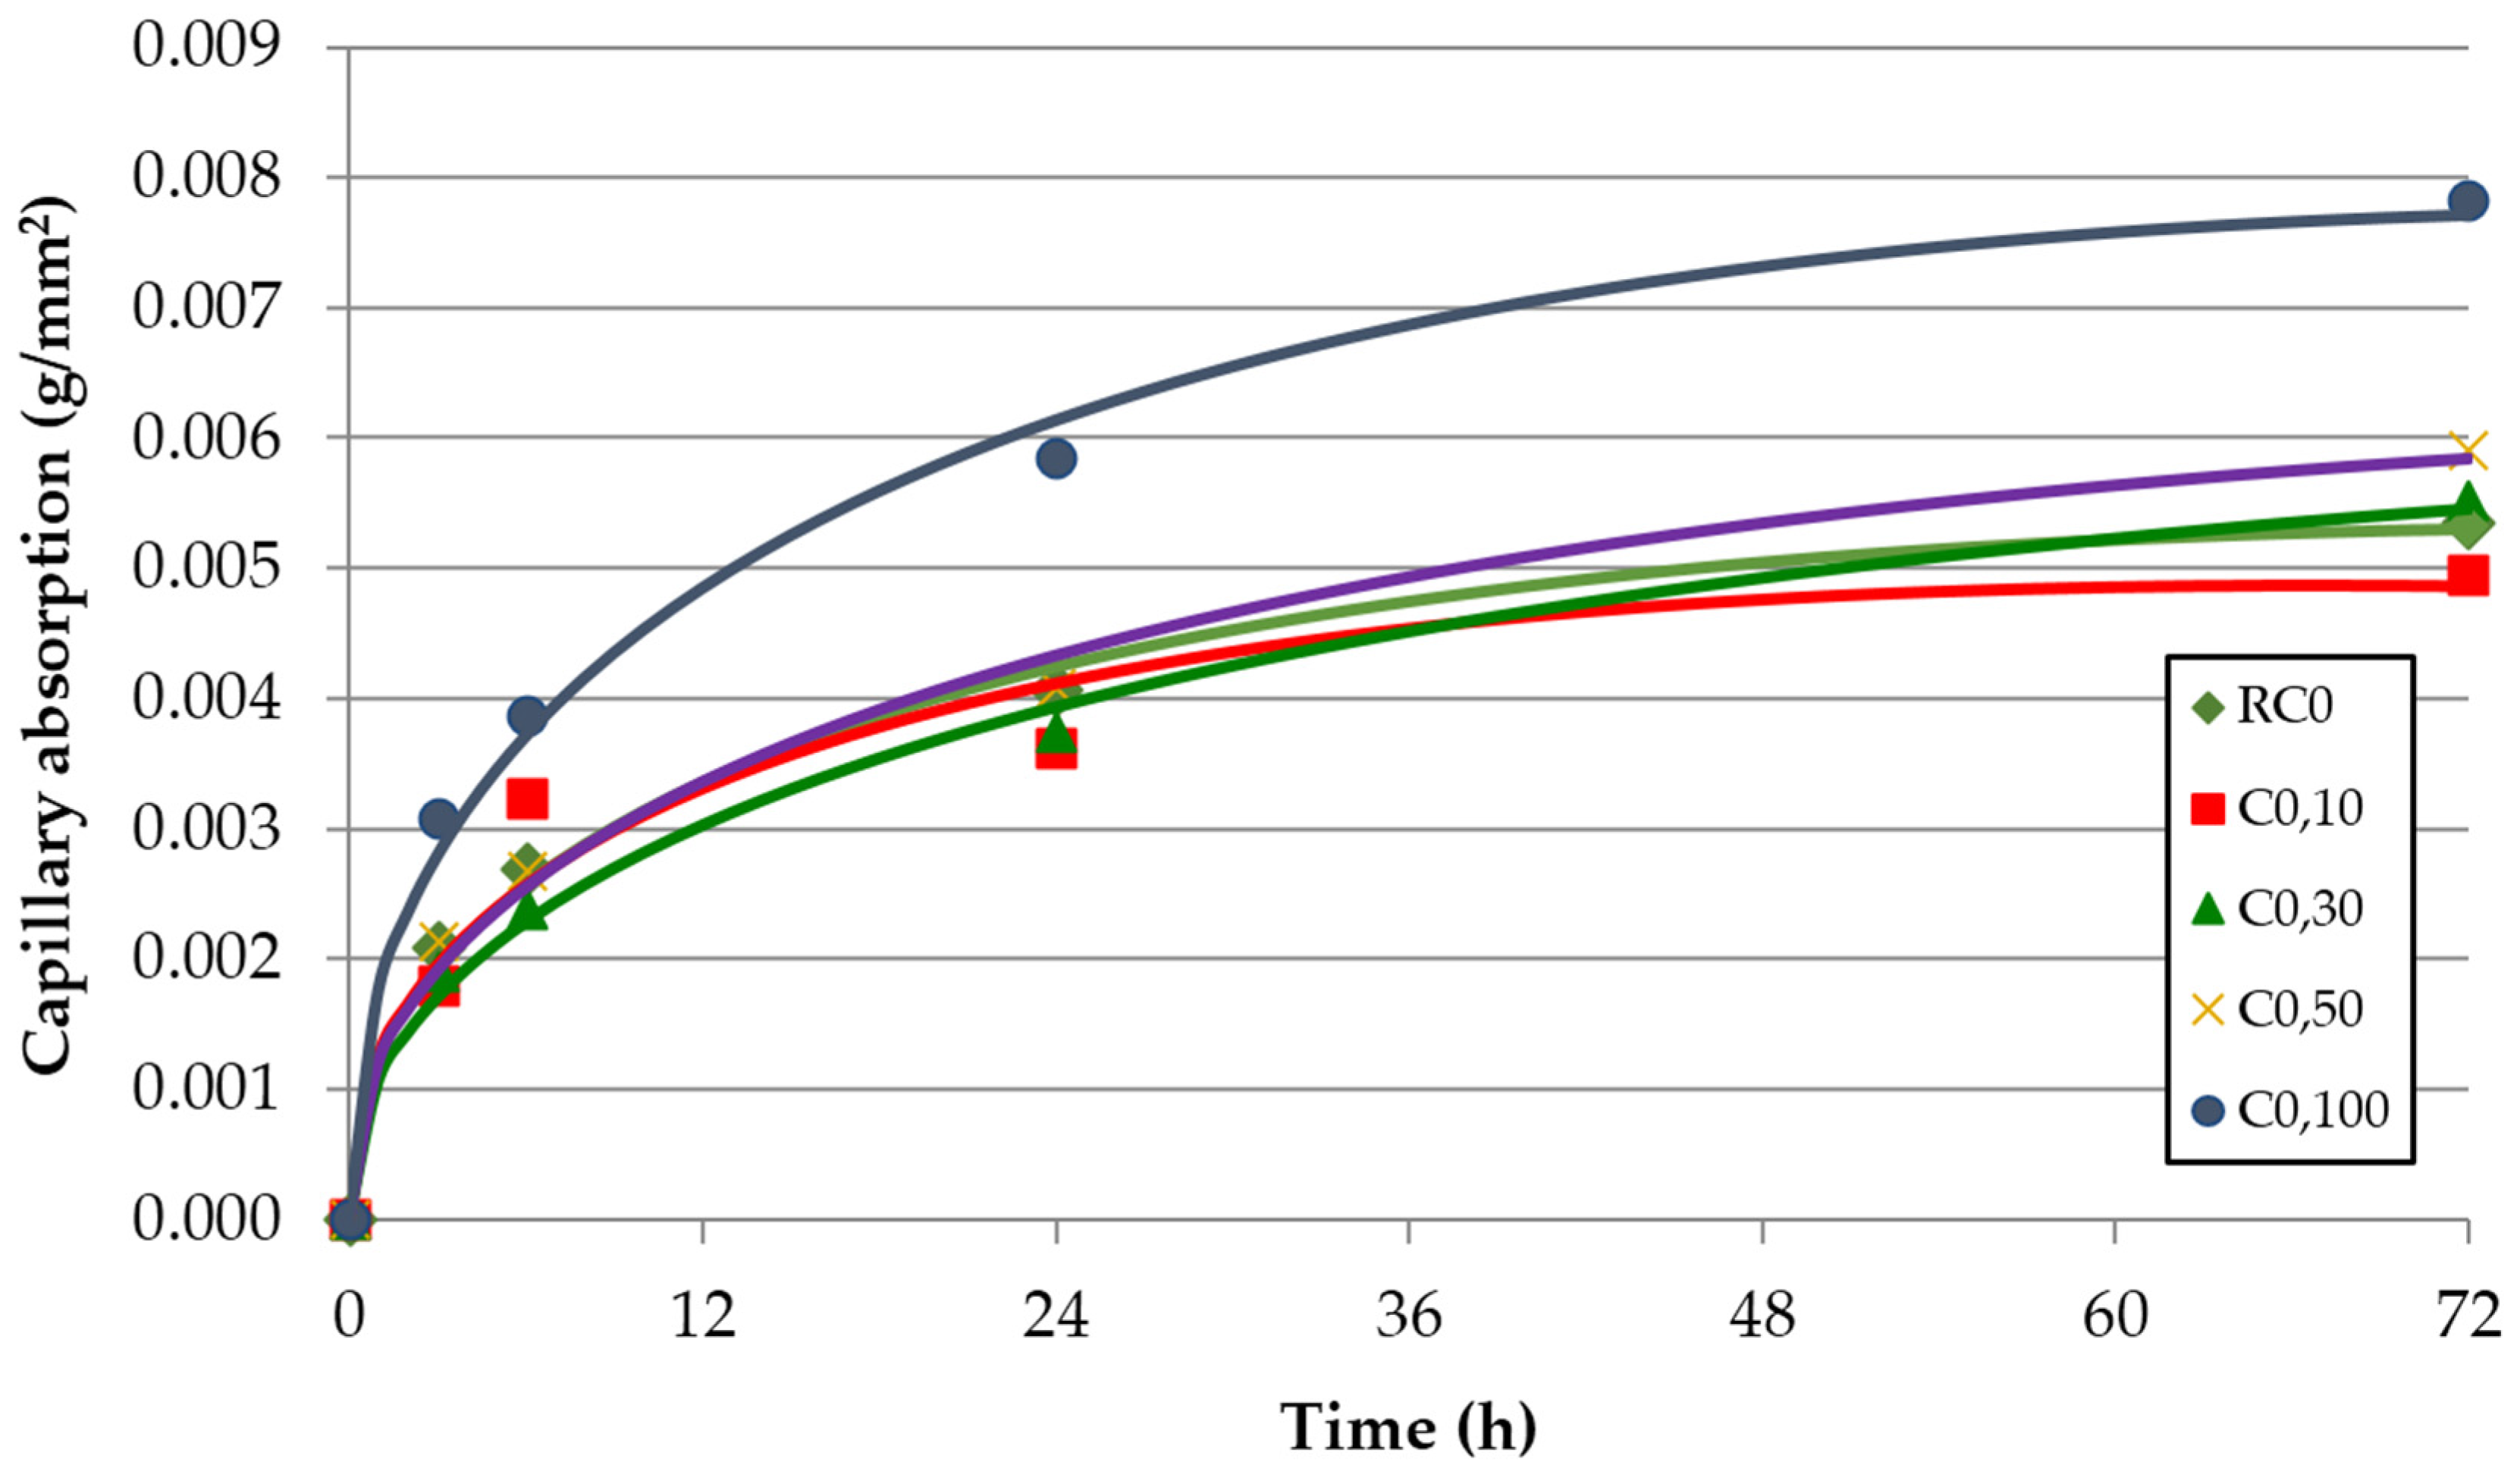
4.5. Capillarity Water Absorption
The evolution over time of the capillarity water absorption for each of the concrete families and replacement ratio of FRCA is shown in
Figure 8,
Figure 9 and
Figure 10. These graphs represent the results from each test and the adjustment function given by Halls [
46]:
where W is the capillary water absorption; t is time; S is sorptivity; and A and C are constants. According to Evangelista and de Brito [
12], the water absorption by capillarity agrees quite well with the Hall’s model.
Table 7 shows the adjustment parameters and sorptivity values.
Figure 8.
Capillary water absorption over time—concrete family C0 (without SP).
Figure 8.
Capillary water absorption over time—concrete family C0 (without SP).
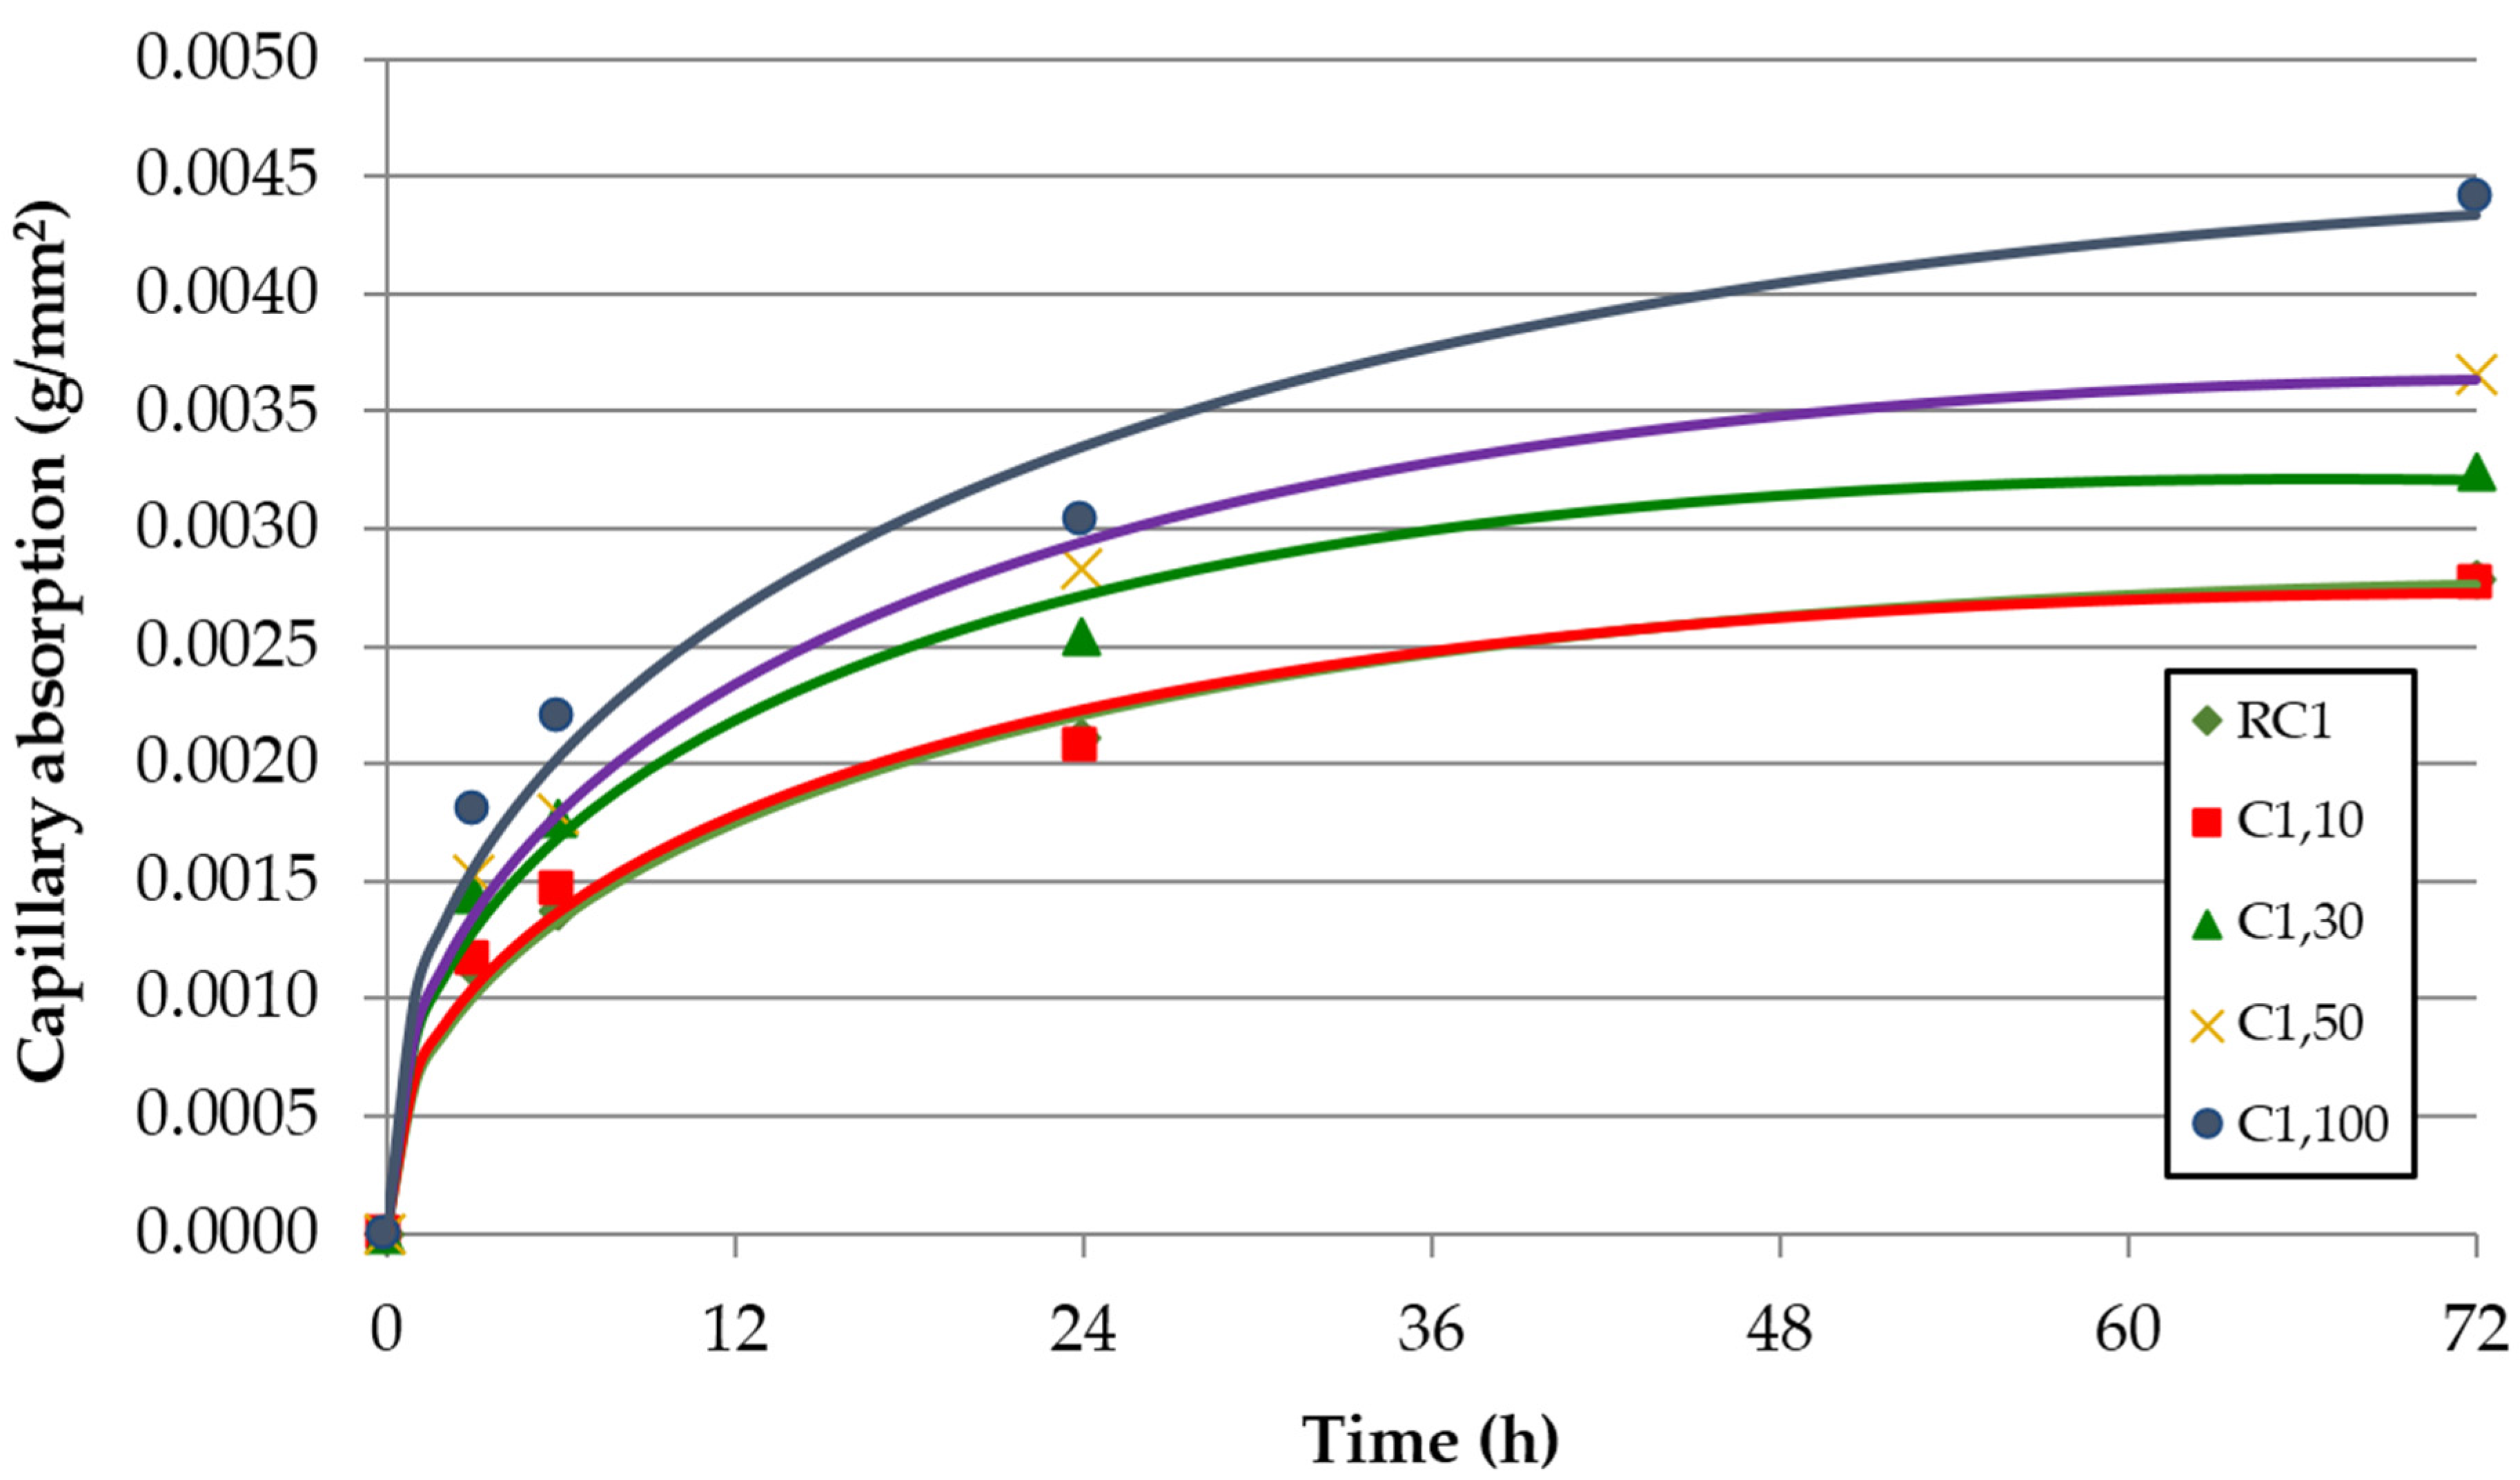
Figure 9.
Capillary water absorption over time—concrete family C1 (with SP1).
Figure 9.
Capillary water absorption over time—concrete family C1 (with SP1).
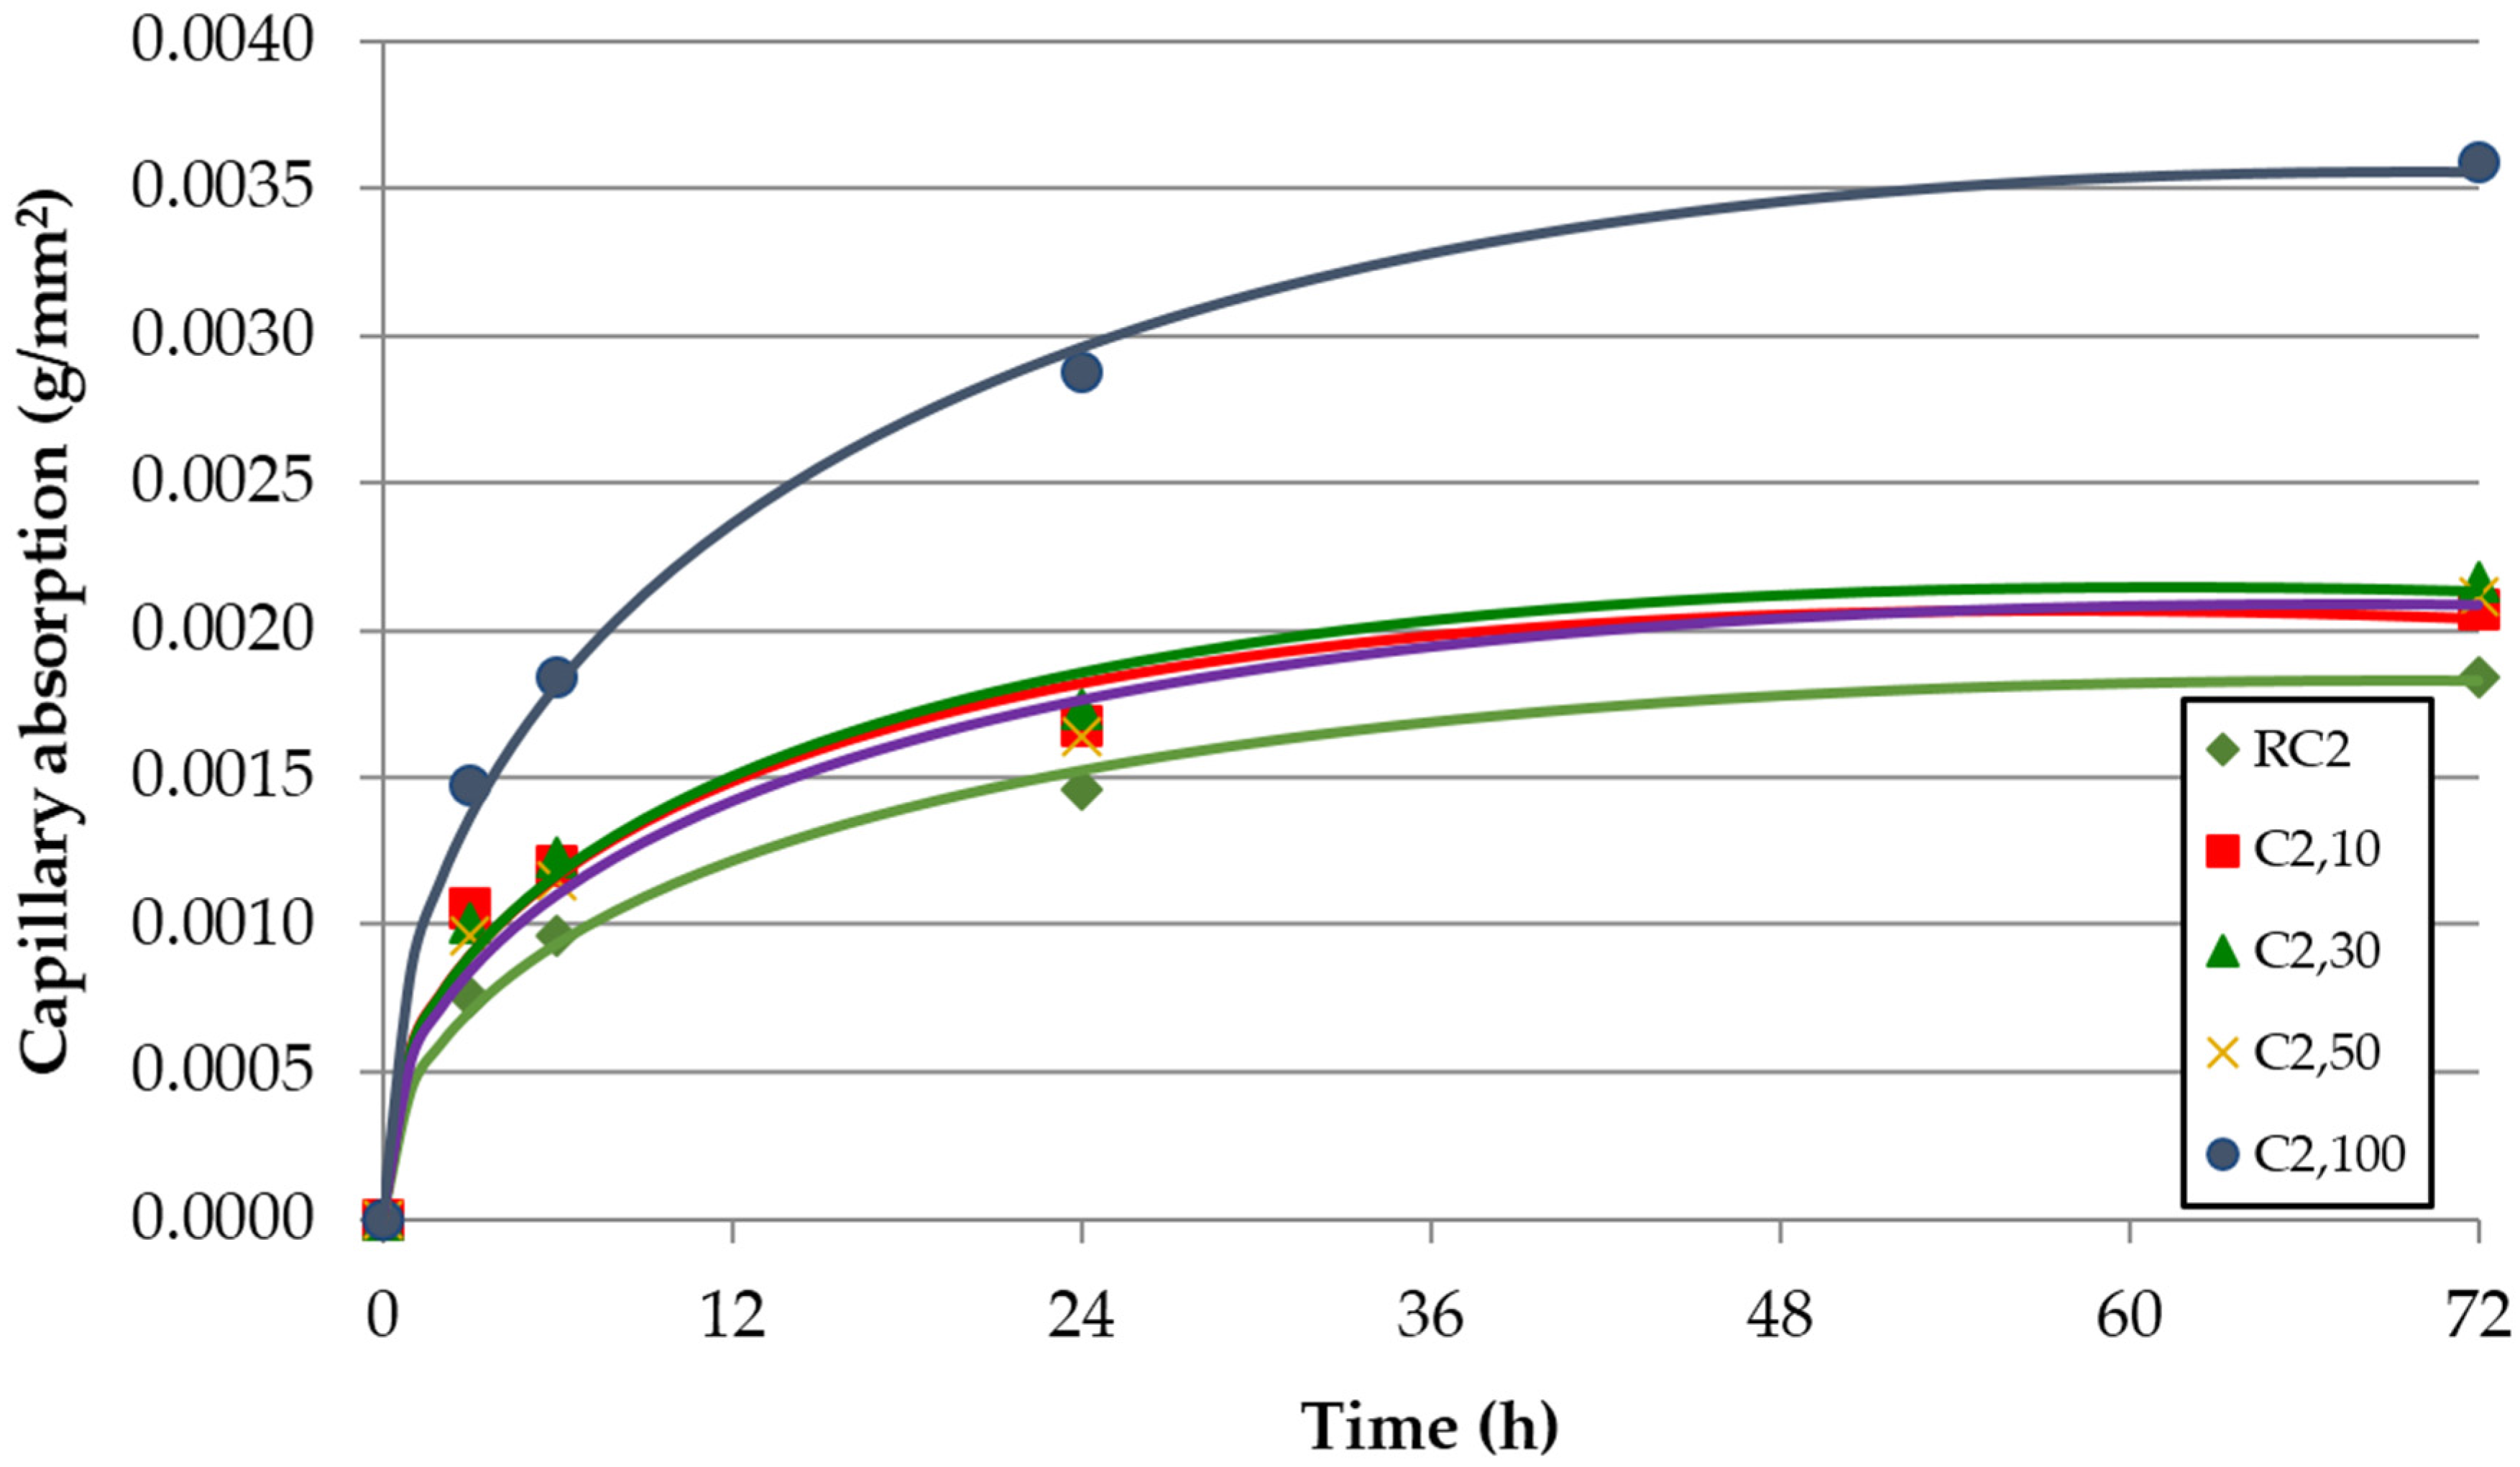
Figure 10.
Capillary water absorption over time—concrete family C2 (with SP2).
Figure 10.
Capillary water absorption over time—concrete family C2 (with SP2).
Table 7.
Adjustment parameters of the Hall’s capillary model.
Table 7.
Adjustment parameters of the Hall’s capillary model.
| Mixes | A | C | S | ΔS (%) | R2 |
|---|
| RC0 | 1.16 × 10⁻⁴ | 6.46 × 10⁻⁵ | 1.16 × 10⁻³ | - | 0.995 |
| C0,10 | 1.66 × 10⁻⁴ | 7.04 × 10⁻⁵ | 1.15 × 10⁻³ | −0.9 | 0.947 |
| C0,30 | 1.33 × 10⁻⁴ | 4.15 × 10⁻⁵ | 0.98 × 10⁻³ | −15.5 | 0.994 |
| C0,50 | 1.57 × 10⁻⁴ | 5.07 × 10⁻⁵ | 1.10 × 10⁻³ | −5.2 | 0.992 |
| C0,100 | 1.90 × 10⁻⁴ | 9.12 × 10⁻⁵ | 1.66 × 10⁻³ | 43.1 | 0.994 |
| RC1 | 7.00 × 10⁻⁵ | 3.32 × 10⁻⁵ | 5.99 × 10⁻⁴ | - | 0.993 |
| C1,10 | 9.74 × 10⁻⁵ | 3.50 × 10⁻⁵ | 6.07 × 10⁻⁴ | 1.3 | 0.986 |
| C1,30 | 1.08 × 10⁻⁴ | 4.66 × 10⁻⁵ | 7.61 × 10⁻⁴ | 27.0 | 0.988 |
| C1,50 | 9.09 × 10⁻⁵ | 4.59 × 10⁻⁵ | 8.07 × 10⁻⁴ | 34.7 | 0.993 |
| C1,100 | 1.98 × 10⁻⁴ | 4.34 × 10⁻⁵ | 8.56 × 10⁻⁴ | 42.9 | 0.976 |
| RC2 | 3.63 × 10⁻⁵ | 2.57 × 10⁻⁵ | 4.29 × 10⁻⁴ | - | 0.996 |
| C2,10 | 9.67 × 10⁻⁵ | 3.42 × 10⁻⁵ | 5.19 × 10⁻⁴ | 21.0 | 0.976 |
| C2,30 | 7.96 × 10⁻⁵ | 3.37 × 10⁻⁵ | 5.28 × 10⁻⁴ | 23.1 | 0.985 |
| C2,50 | 8.16 × 10⁻⁵ | 2.98 × 10⁻⁵ | 4.89 × 10⁻⁴ | 14.0 | 0.984 |
| C2,100 | 6.33 × 10⁻⁵ | 5.01 × 10⁻⁵ | 8.37 × 10⁻⁴ | 95.1 | 0.997 |
It is clear that the capillary water absorption increased with the incorporation of FRCA. This property is basically determined by the porosity of concrete, which increases with the percentage of FRCA. Two reasons are given for this greater porosity in concrete made with FRCA: the FRCA’s greater porosity and the higher effective (w/c) ratio required to achieve the target slump value (
Table 4).
A higher increase was noticed for the 100% replacement ratio, which is explained by the exponential growth of the connecting capillaries for this replacement ratio, to which Evangelista and de Brito (2010, [
12]) refer. The family made without SP (C0) had an increase with respect to the reference concrete (RC0) of 10% for a replacement ratio of 50% and an increase of 45% for a replacement ratio of 100% in the 72 h test. The increase of the connecting capillaries was justified by the higher porosity of the FRCA and the higher (w/c) ratio. In fact, the mix made with 100% FRCA (C0,100) increases the (w/c)
ef ratio 7.8% relative to the reference mix (RC0).
Similarly, the family made with SP1 (C1) increased from 31% to 58% for 50% and 100% of replacement ratios. The mix made with 100% FRCA (C1,100) increases the (w/c)
ef ratio by 16.3% relative to the reference mix (RC1). The family made with SP2 (C2) showed the greatest difference in the 72 h test, 15%–95% for 50% and 100% of replacement ratios: The mix made with 100% FRCA (C2,100) increases the (w/c)
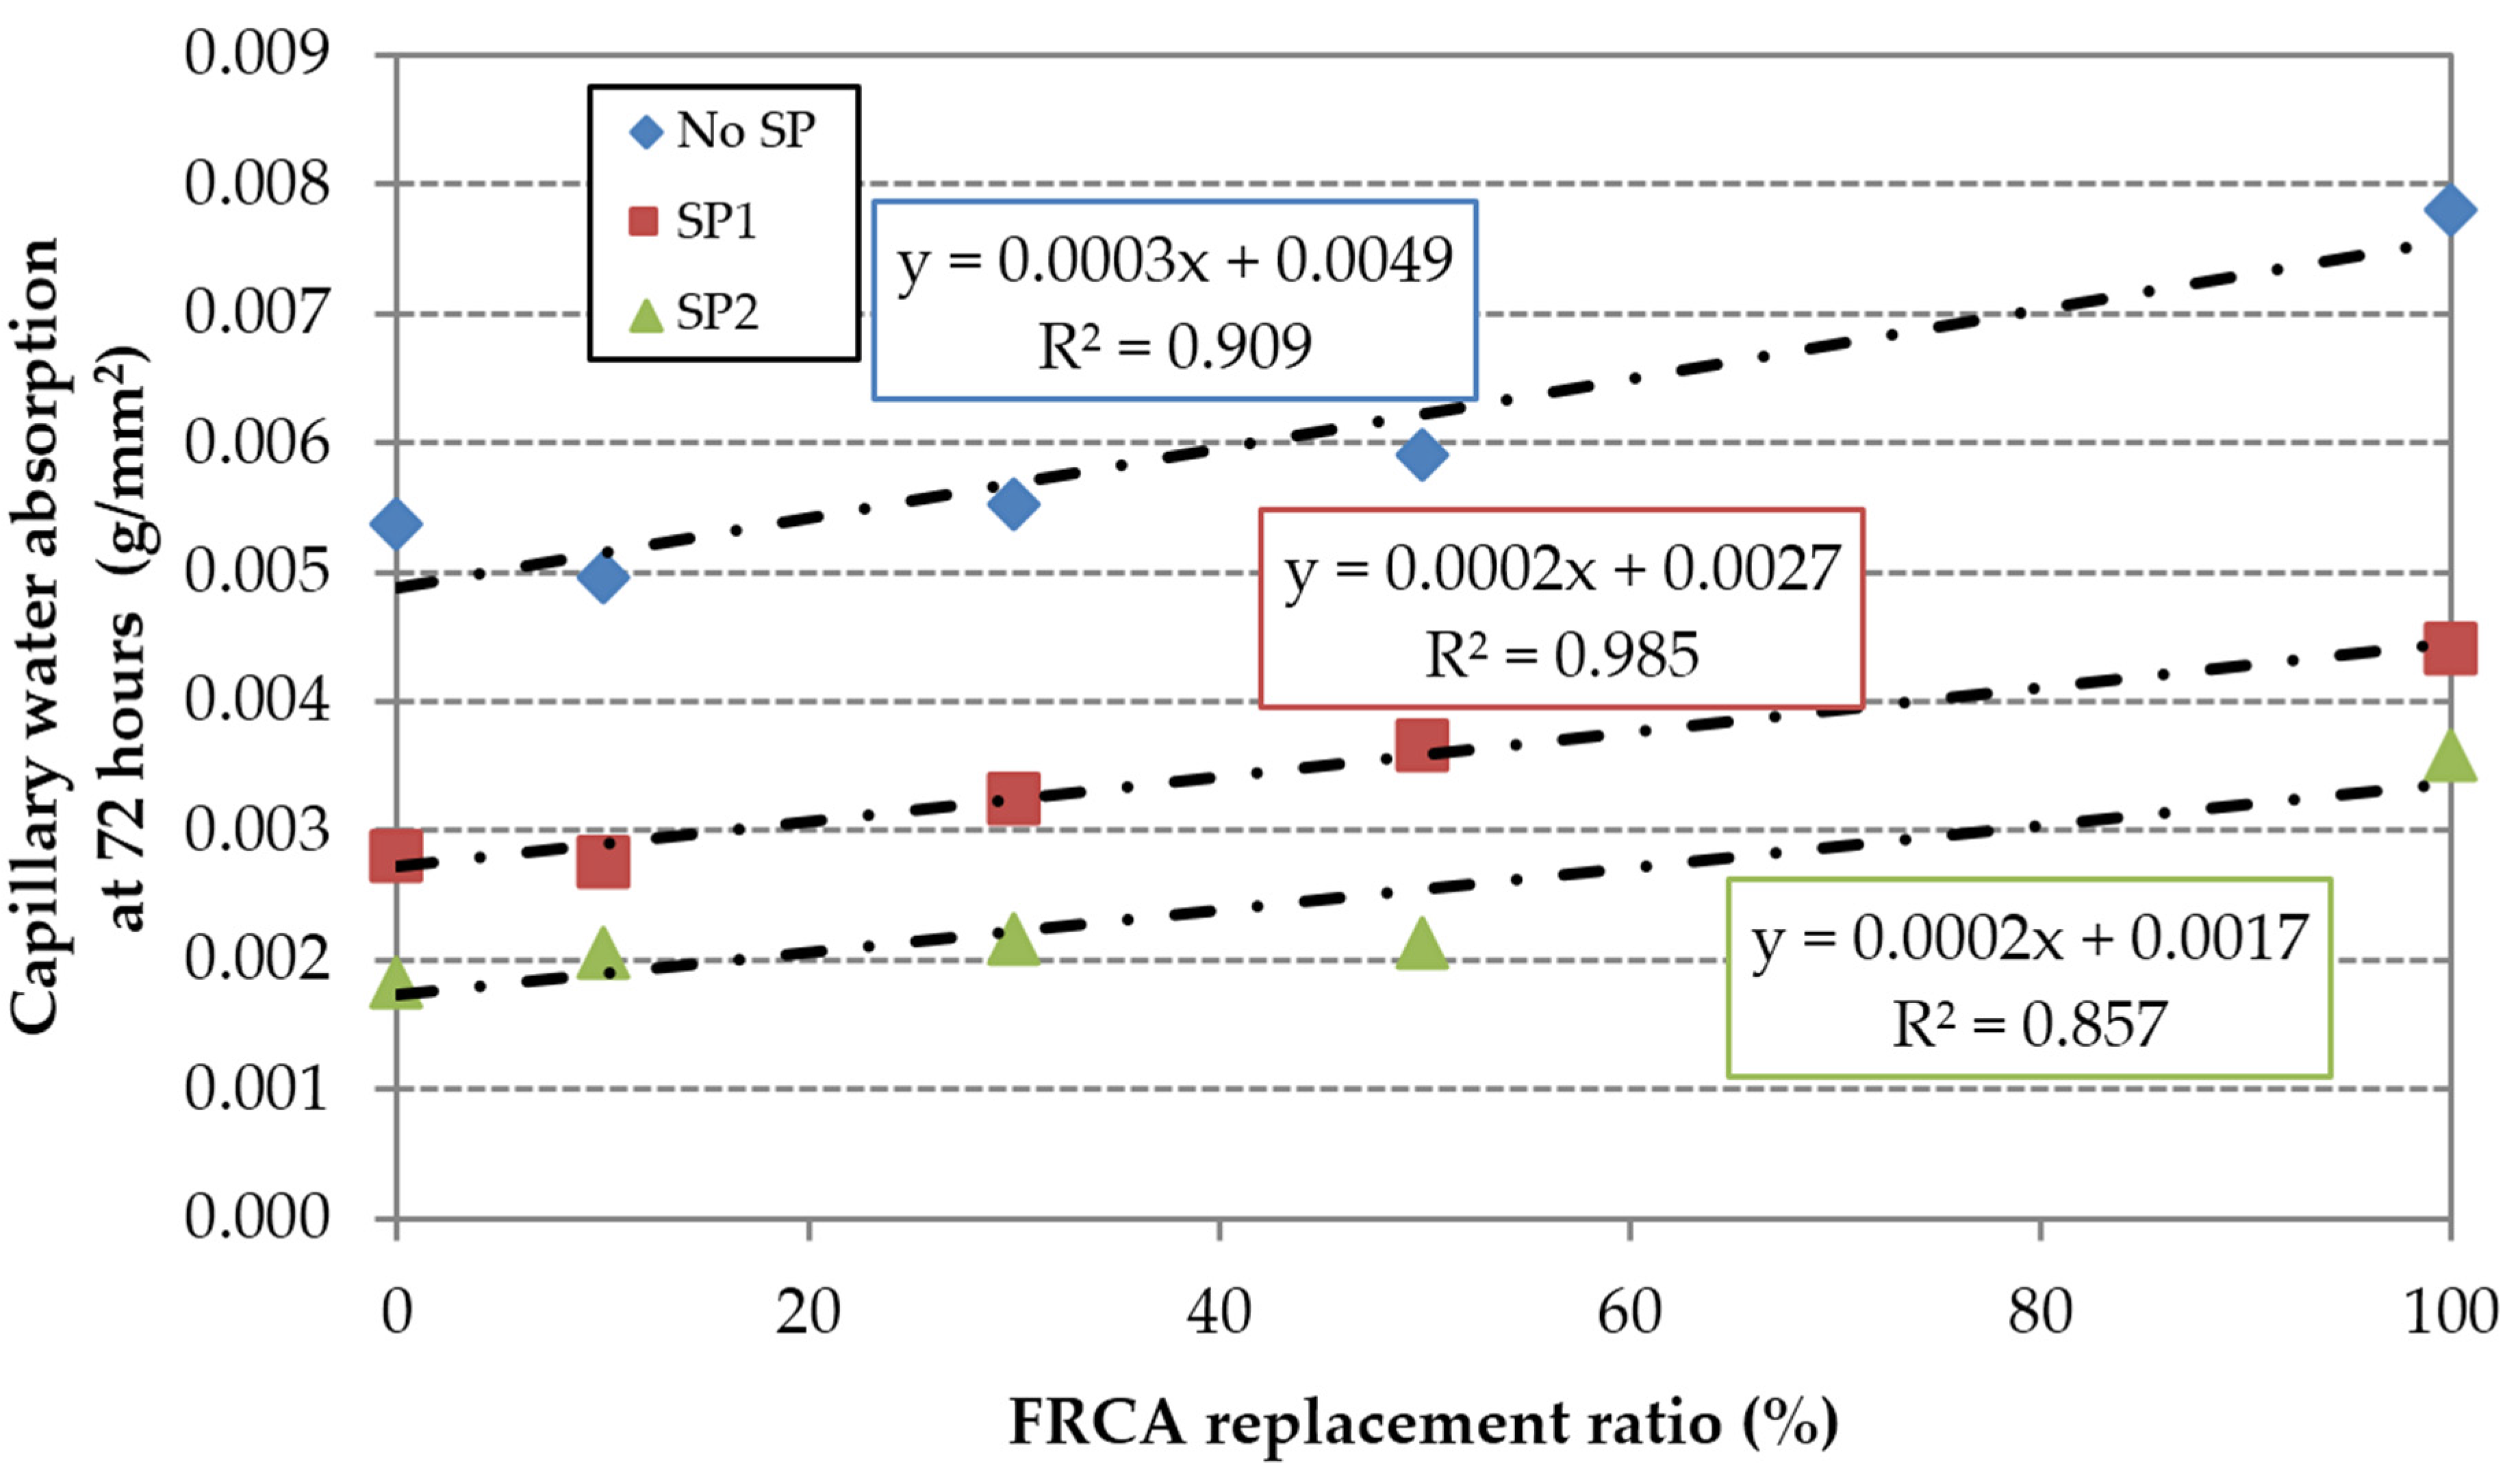
ef ratio by 7.9% relative to the reference mix (RC2). A linear increase of the capillary with FRCA can be adjusted very well (
Figure 11).
Concrete families made with SP showed the lowest values of sorptivity (
Table 7). For each of the concrete families the sorptivity increased with the incorporation of FRCA except in the free superplasticizer family, in which a clear tendency was not appreciated by incorporating FRCA. Evangelista and de Brito [
12] showed significant increases in the sorptivity with the incorporation of FRCA.
As in the water absorption by immersion, the replacement ratio of 10% showed a better performance in the concrete families without SP and with SP1. Due to their effectiveness in reducing the effective w/c ratio, the use of superplasticizers improves this property between 48% and 66% for RC1 and RC2 relative to RC0. The reference mixes (RC1 and RC2) needed a (w/c)
ef ratio 15.7% and 25.5% lower than RC0 (
Table 4).
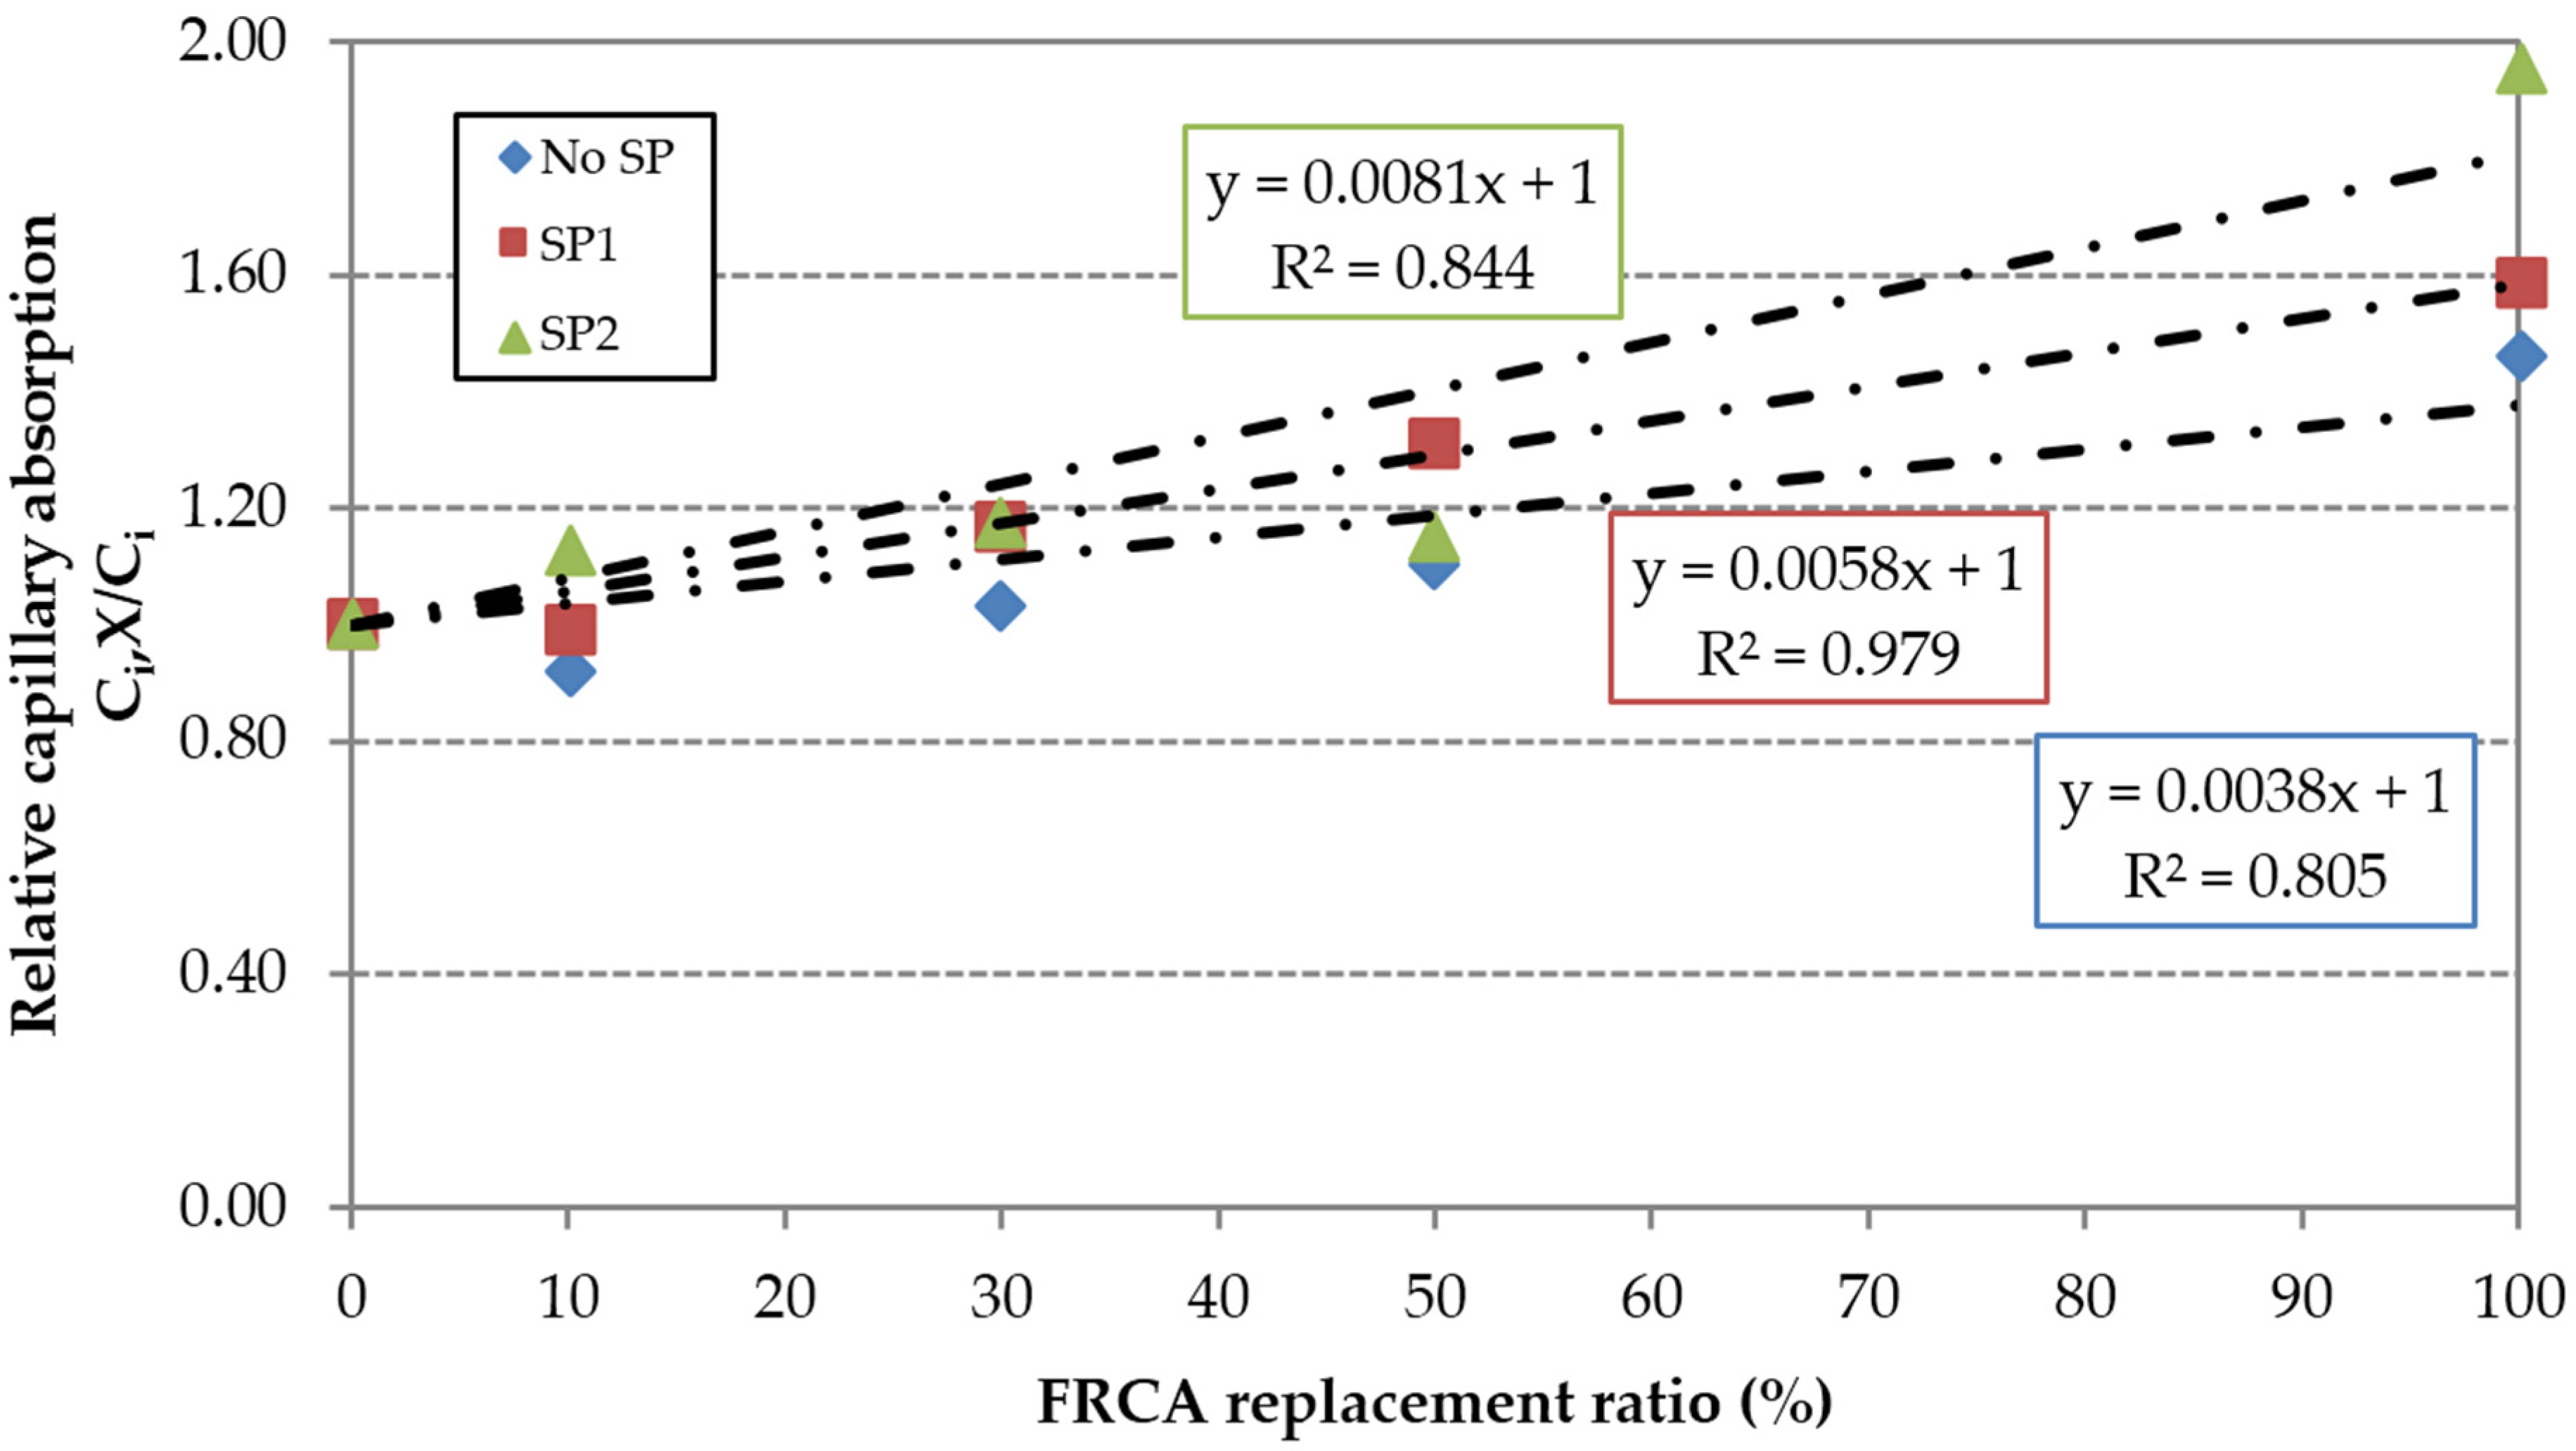
The capillary water absorption values were slightly lower when 100% FRCA was used,
i.e., 43% and 54% for C1.100 and C2.100. In this case, the mixes C1,100 and C2,100 needed a (w/c)
ef ratio 9.1% and 25.5% lower than RC0. Mixes incorporating admixtures are more sensitive to the incorporation of FRCA due to the distribution changes caused by the SP, referred to by Mehta and Monteiro [
47], which enhance the inter-connection of the capillaries. This is evidenced by the greater slope of the linear trend shown in
Figure 12. The loss of effectiveness was greater in the high-performance SP2.
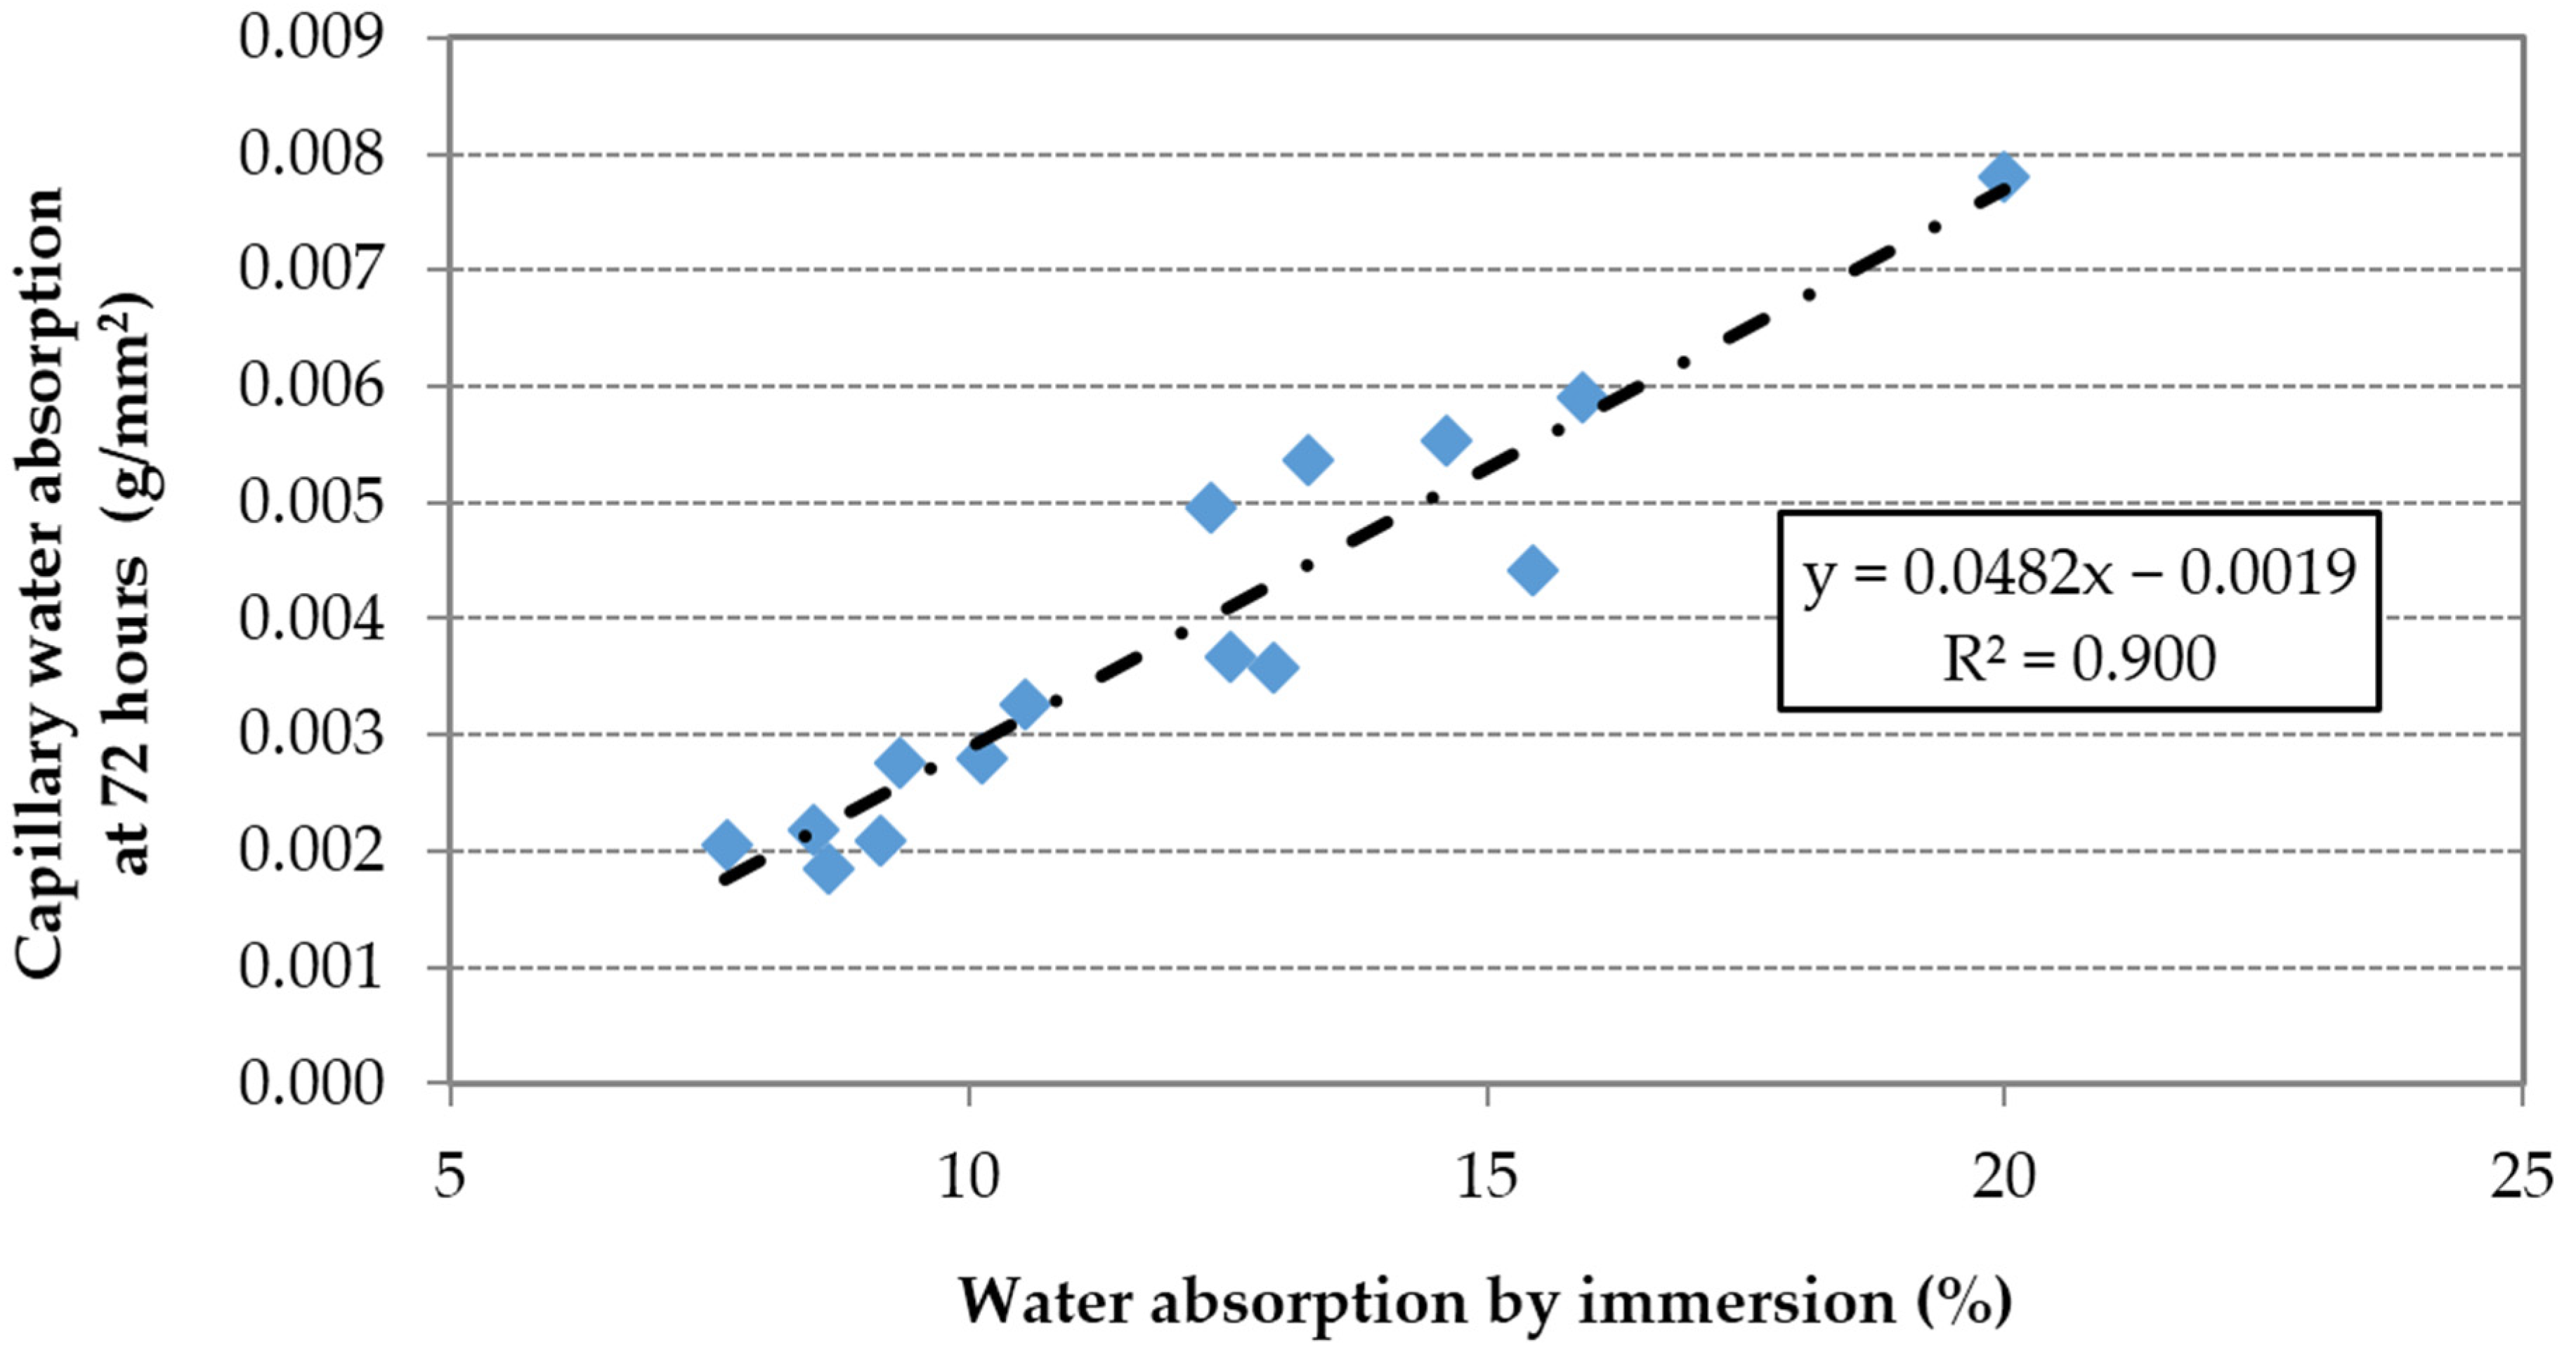
A liner correlation between the capillary water absorption and the water absorption by immersion can be observed (
Figure 13). The relationship between water absorption by immersion and effective w/c ratio was shown in
Figure 6.
Figure 11.
Capillary water absorption.
Figure 11.
Capillary water absorption.
Figure 12.
Influence of FRCA replacement ratio on the relative capillary water absorption.
Figure 12.
Influence of FRCA replacement ratio on the relative capillary water absorption.
Figure 13.
Capillary water absorption by immersion vs. water absorption by immersion.
Figure 13.
Capillary water absorption by immersion vs. water absorption by immersion.
4.6. Carbonation Resistance
The carbonation depth for each of the concrete families
vs. replacement ratio is shown in
Figure 14 and
Figure 15 at 7 and 91 days respectively. The carbonation depth increased with time. Concrete made with SP2 showed the lower carbonation depth values at any age. This can be related to the lower effective w/c ratio used in the mix (
Table 3) resulting in a lower porosity and hence a lower permeability to gases [
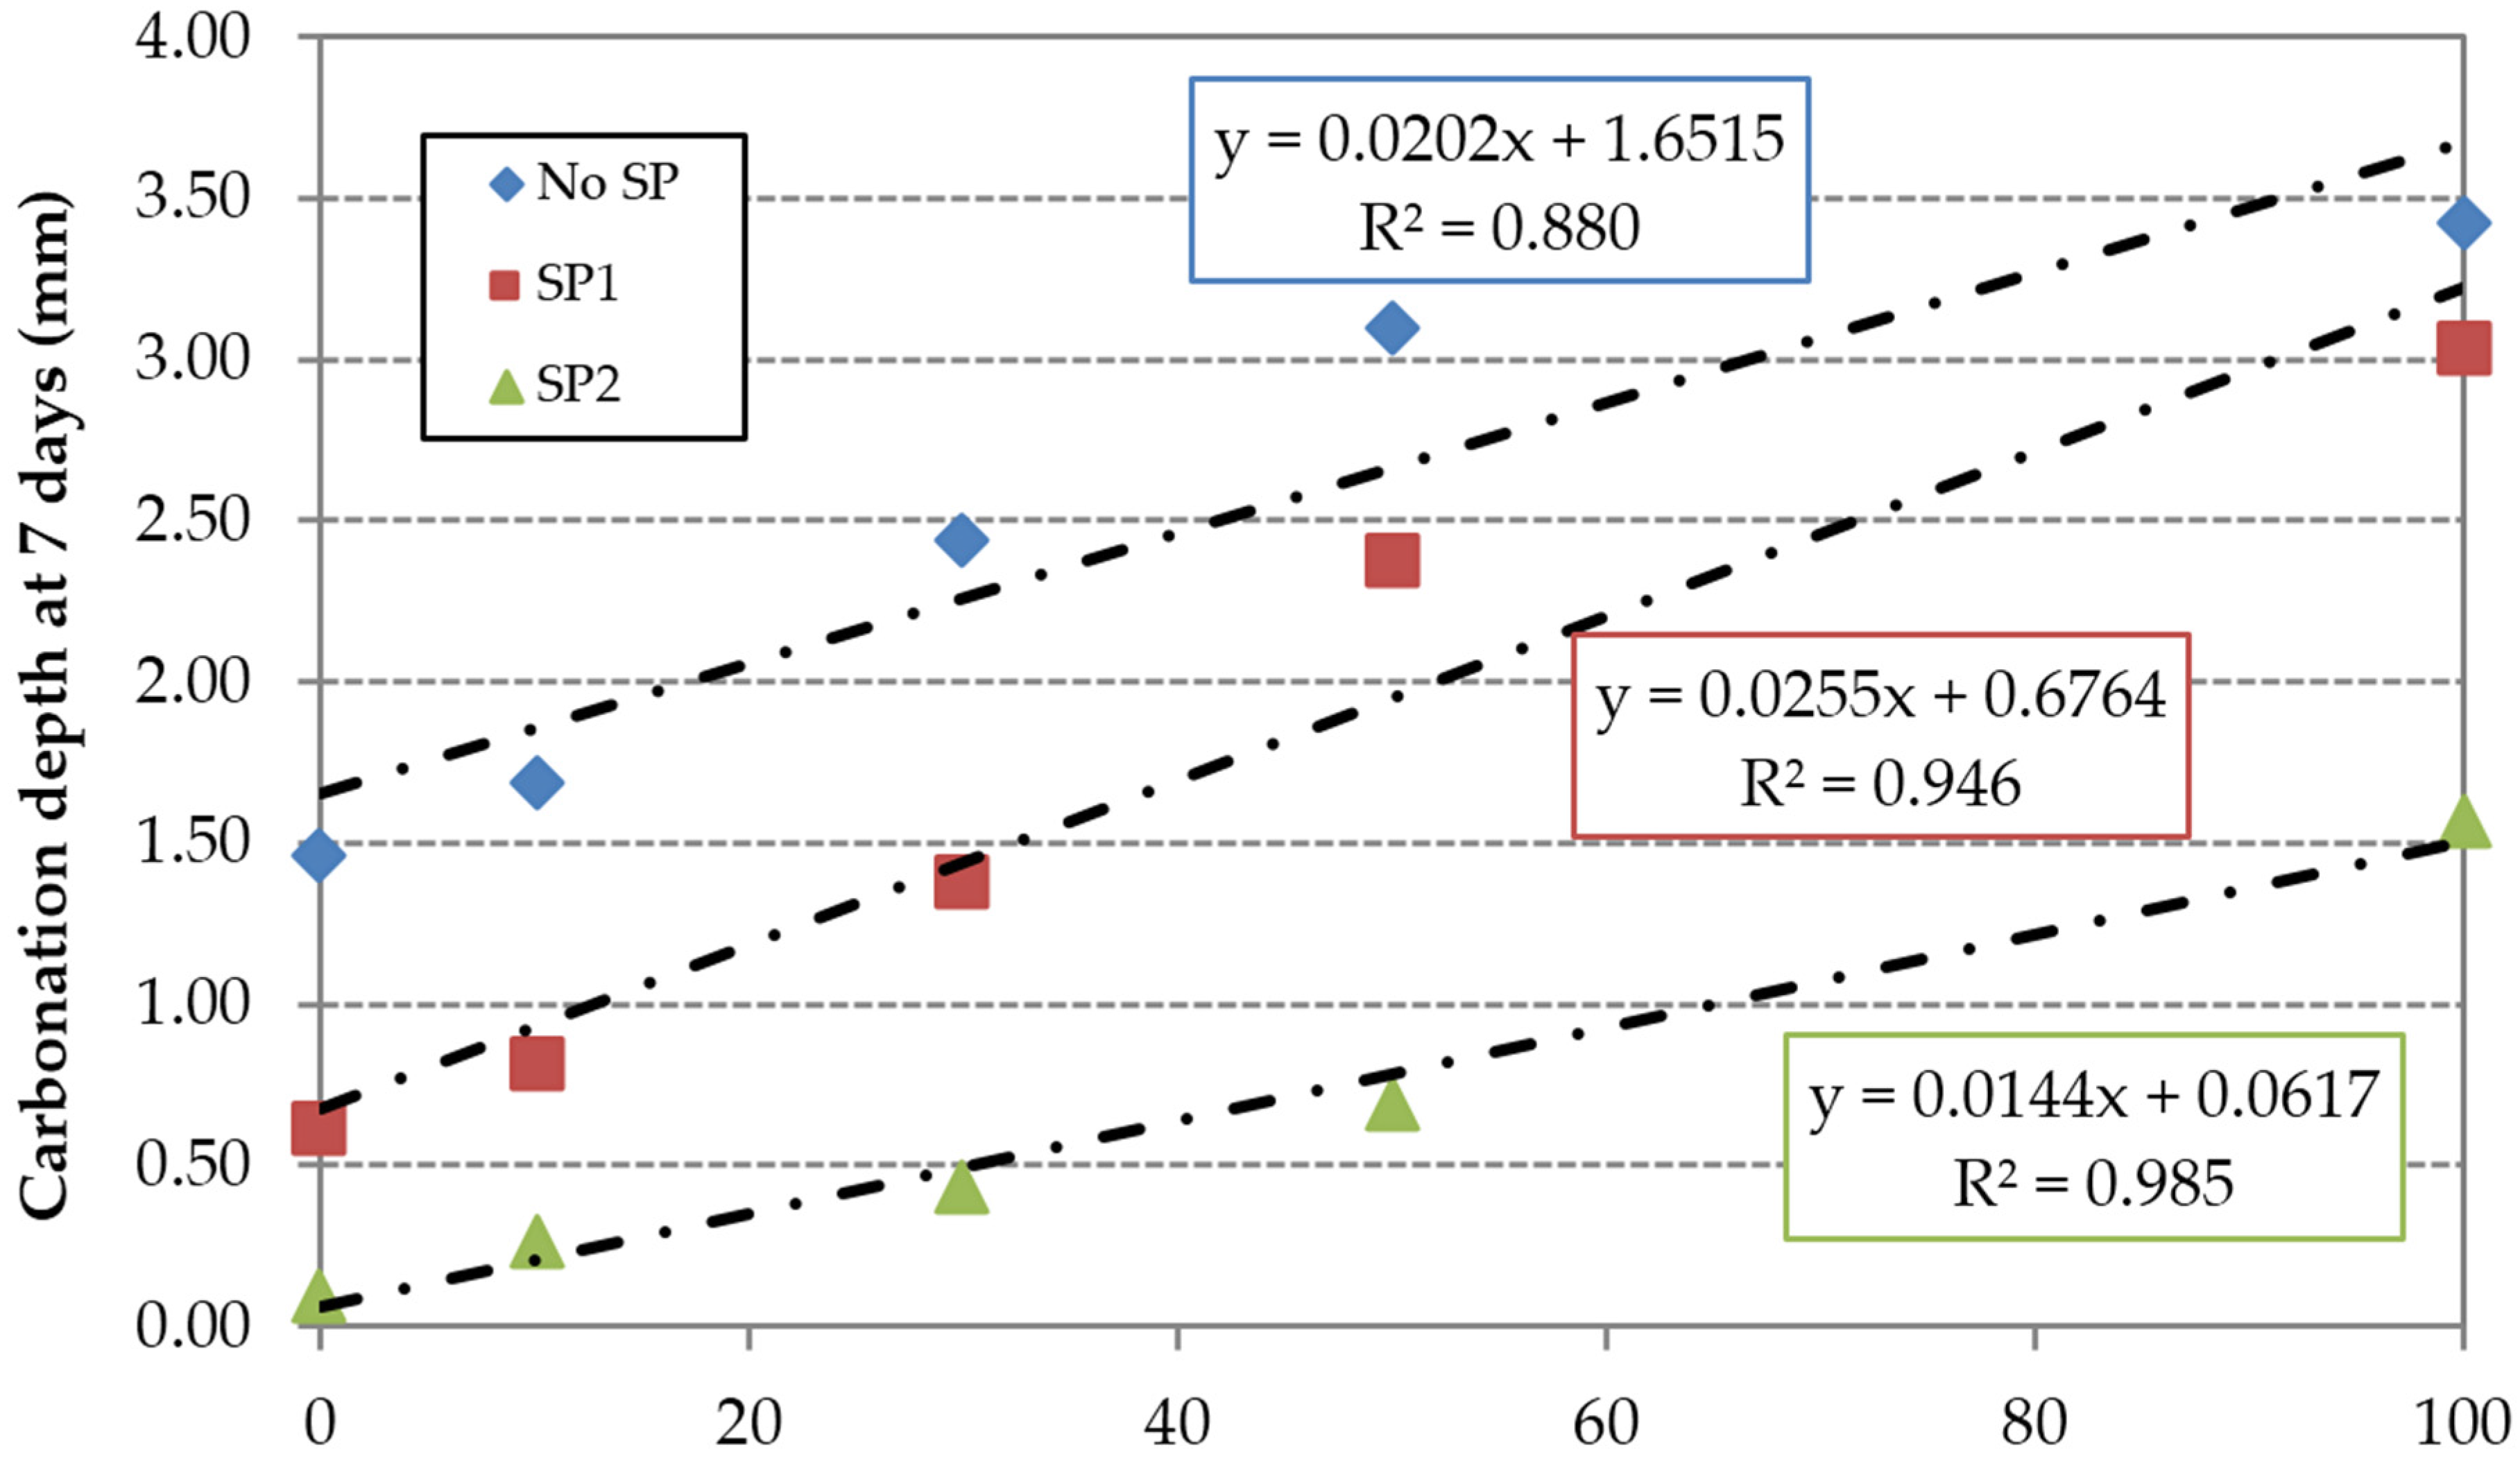
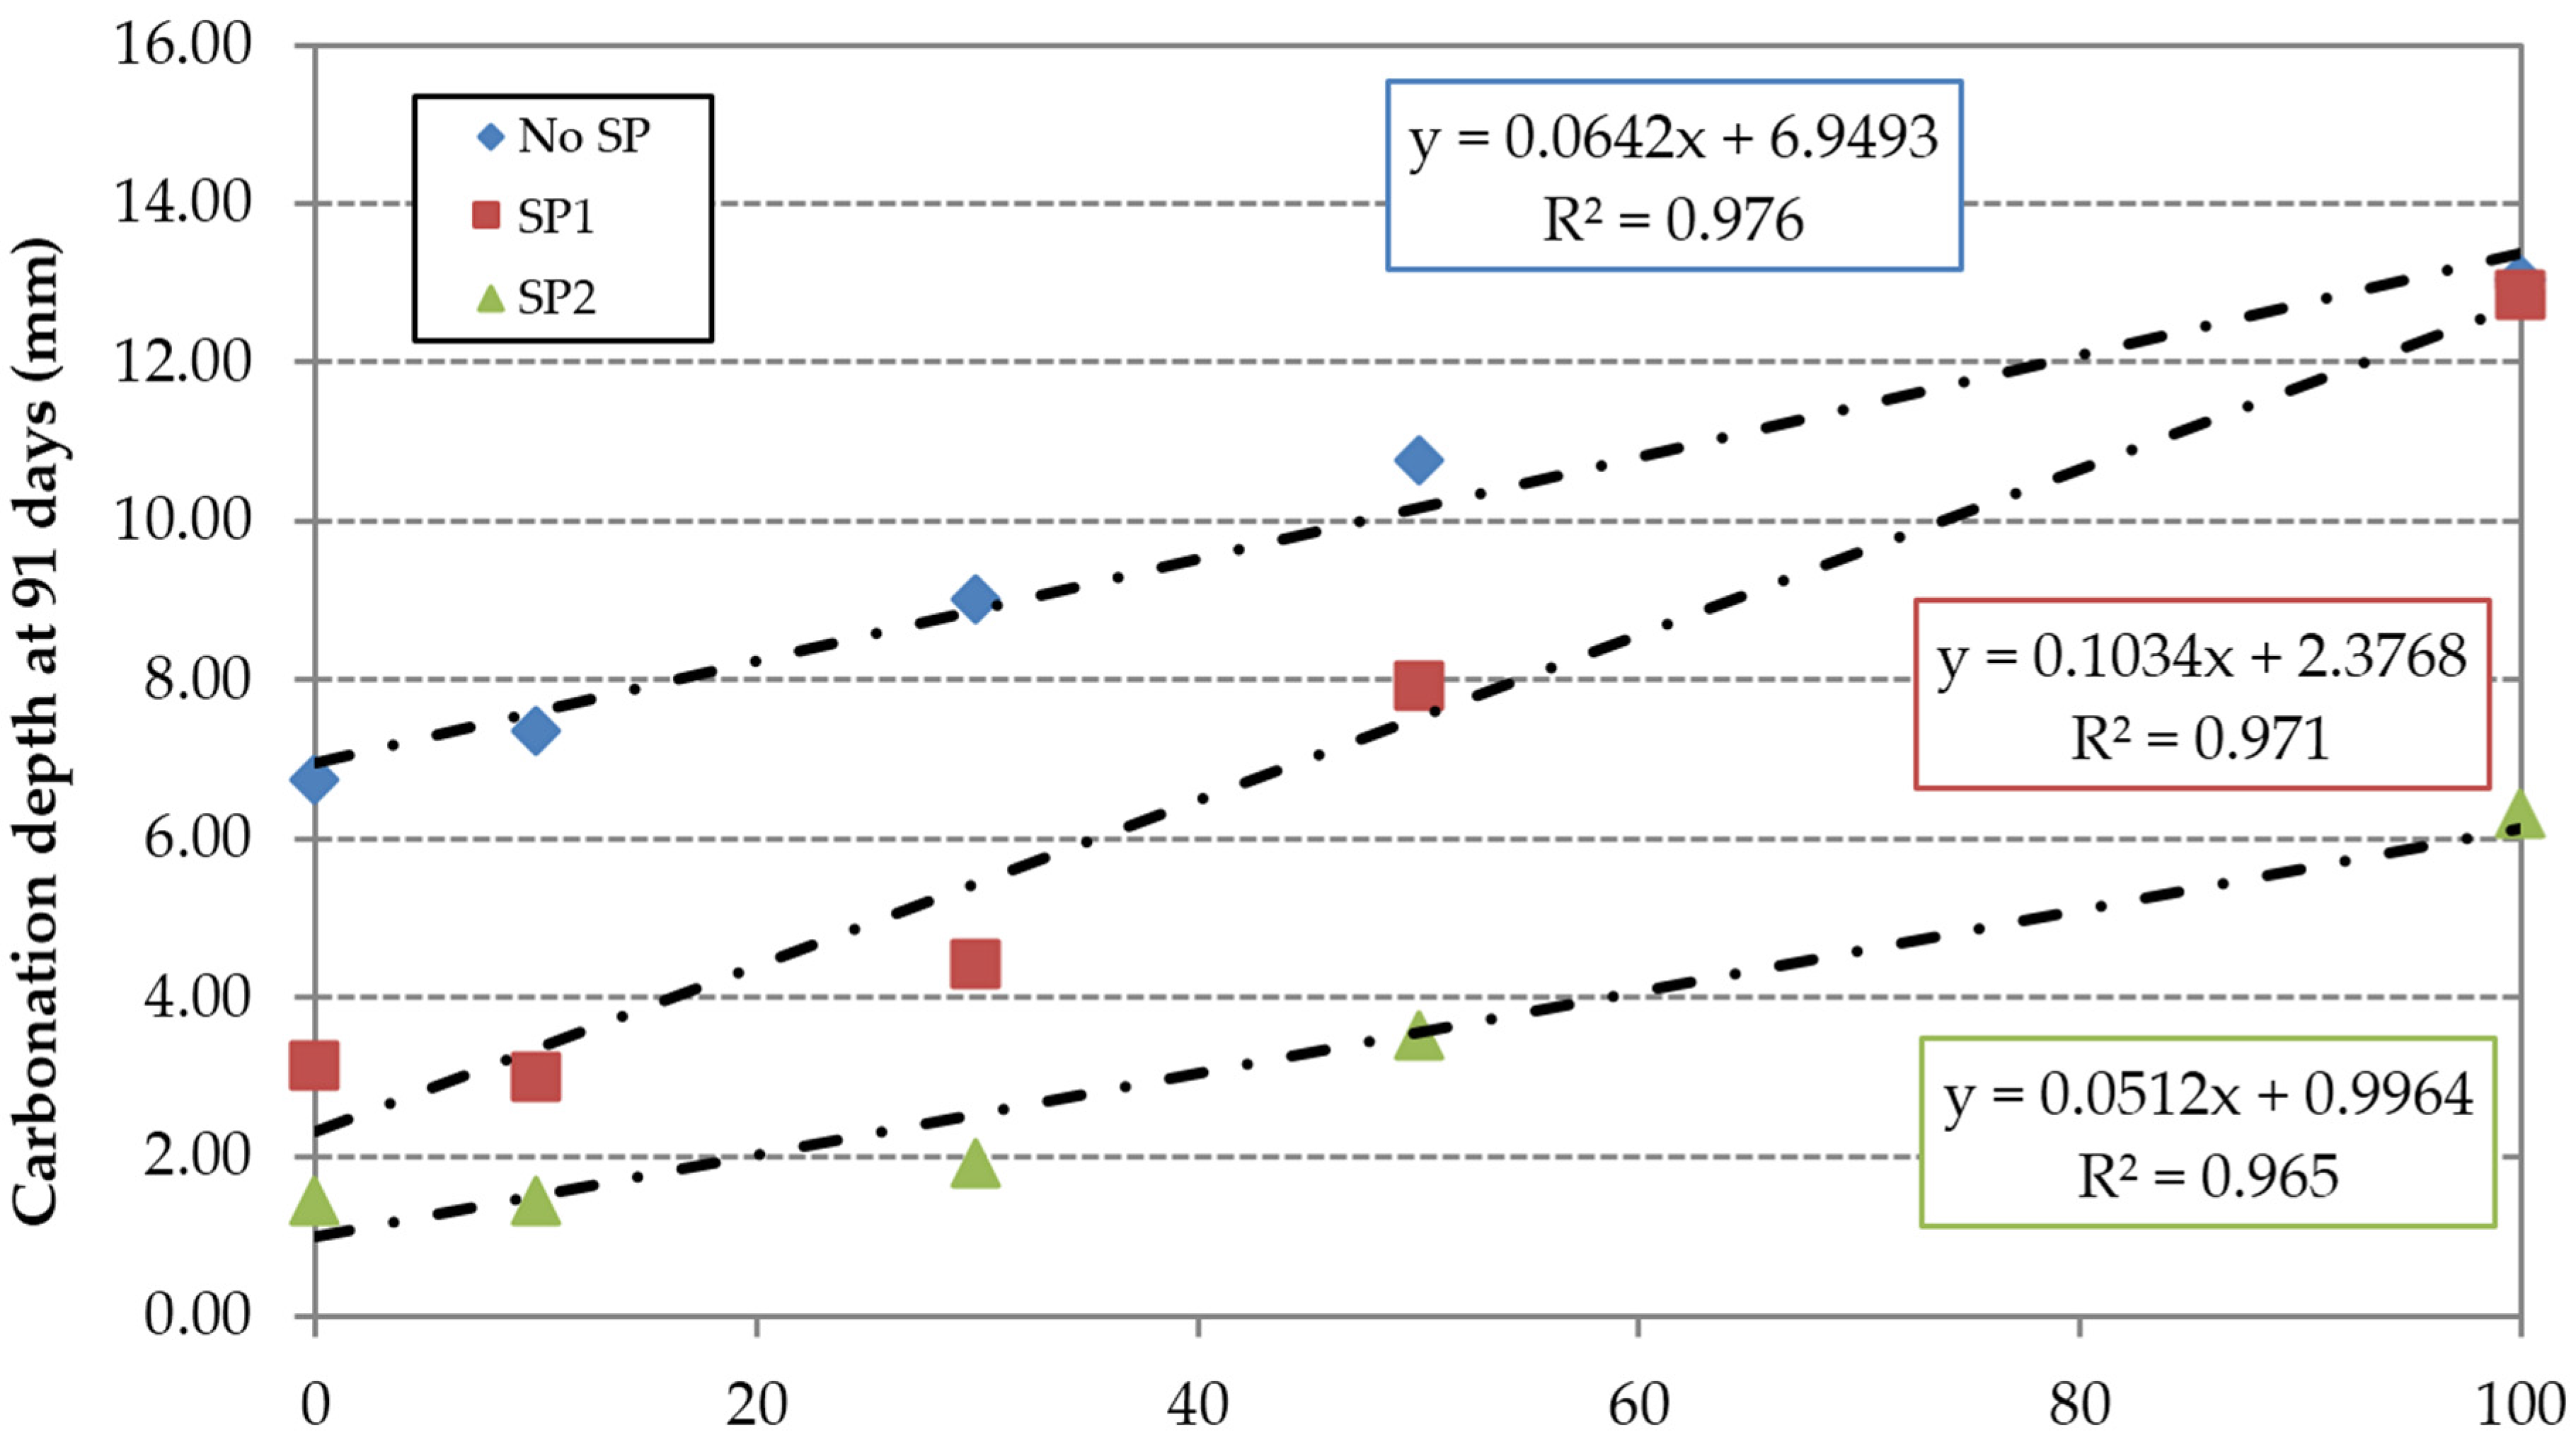
48]. As expected, the FRCA incorporation also increased the carbonation depth for all concrete families and test ages.
Figure 14.
Carbonation depth at seven days.
Figure 14.
Carbonation depth at seven days.
Figure 15.
Carbonation depth at 91 days.
Figure 15.
Carbonation depth at 91 days.
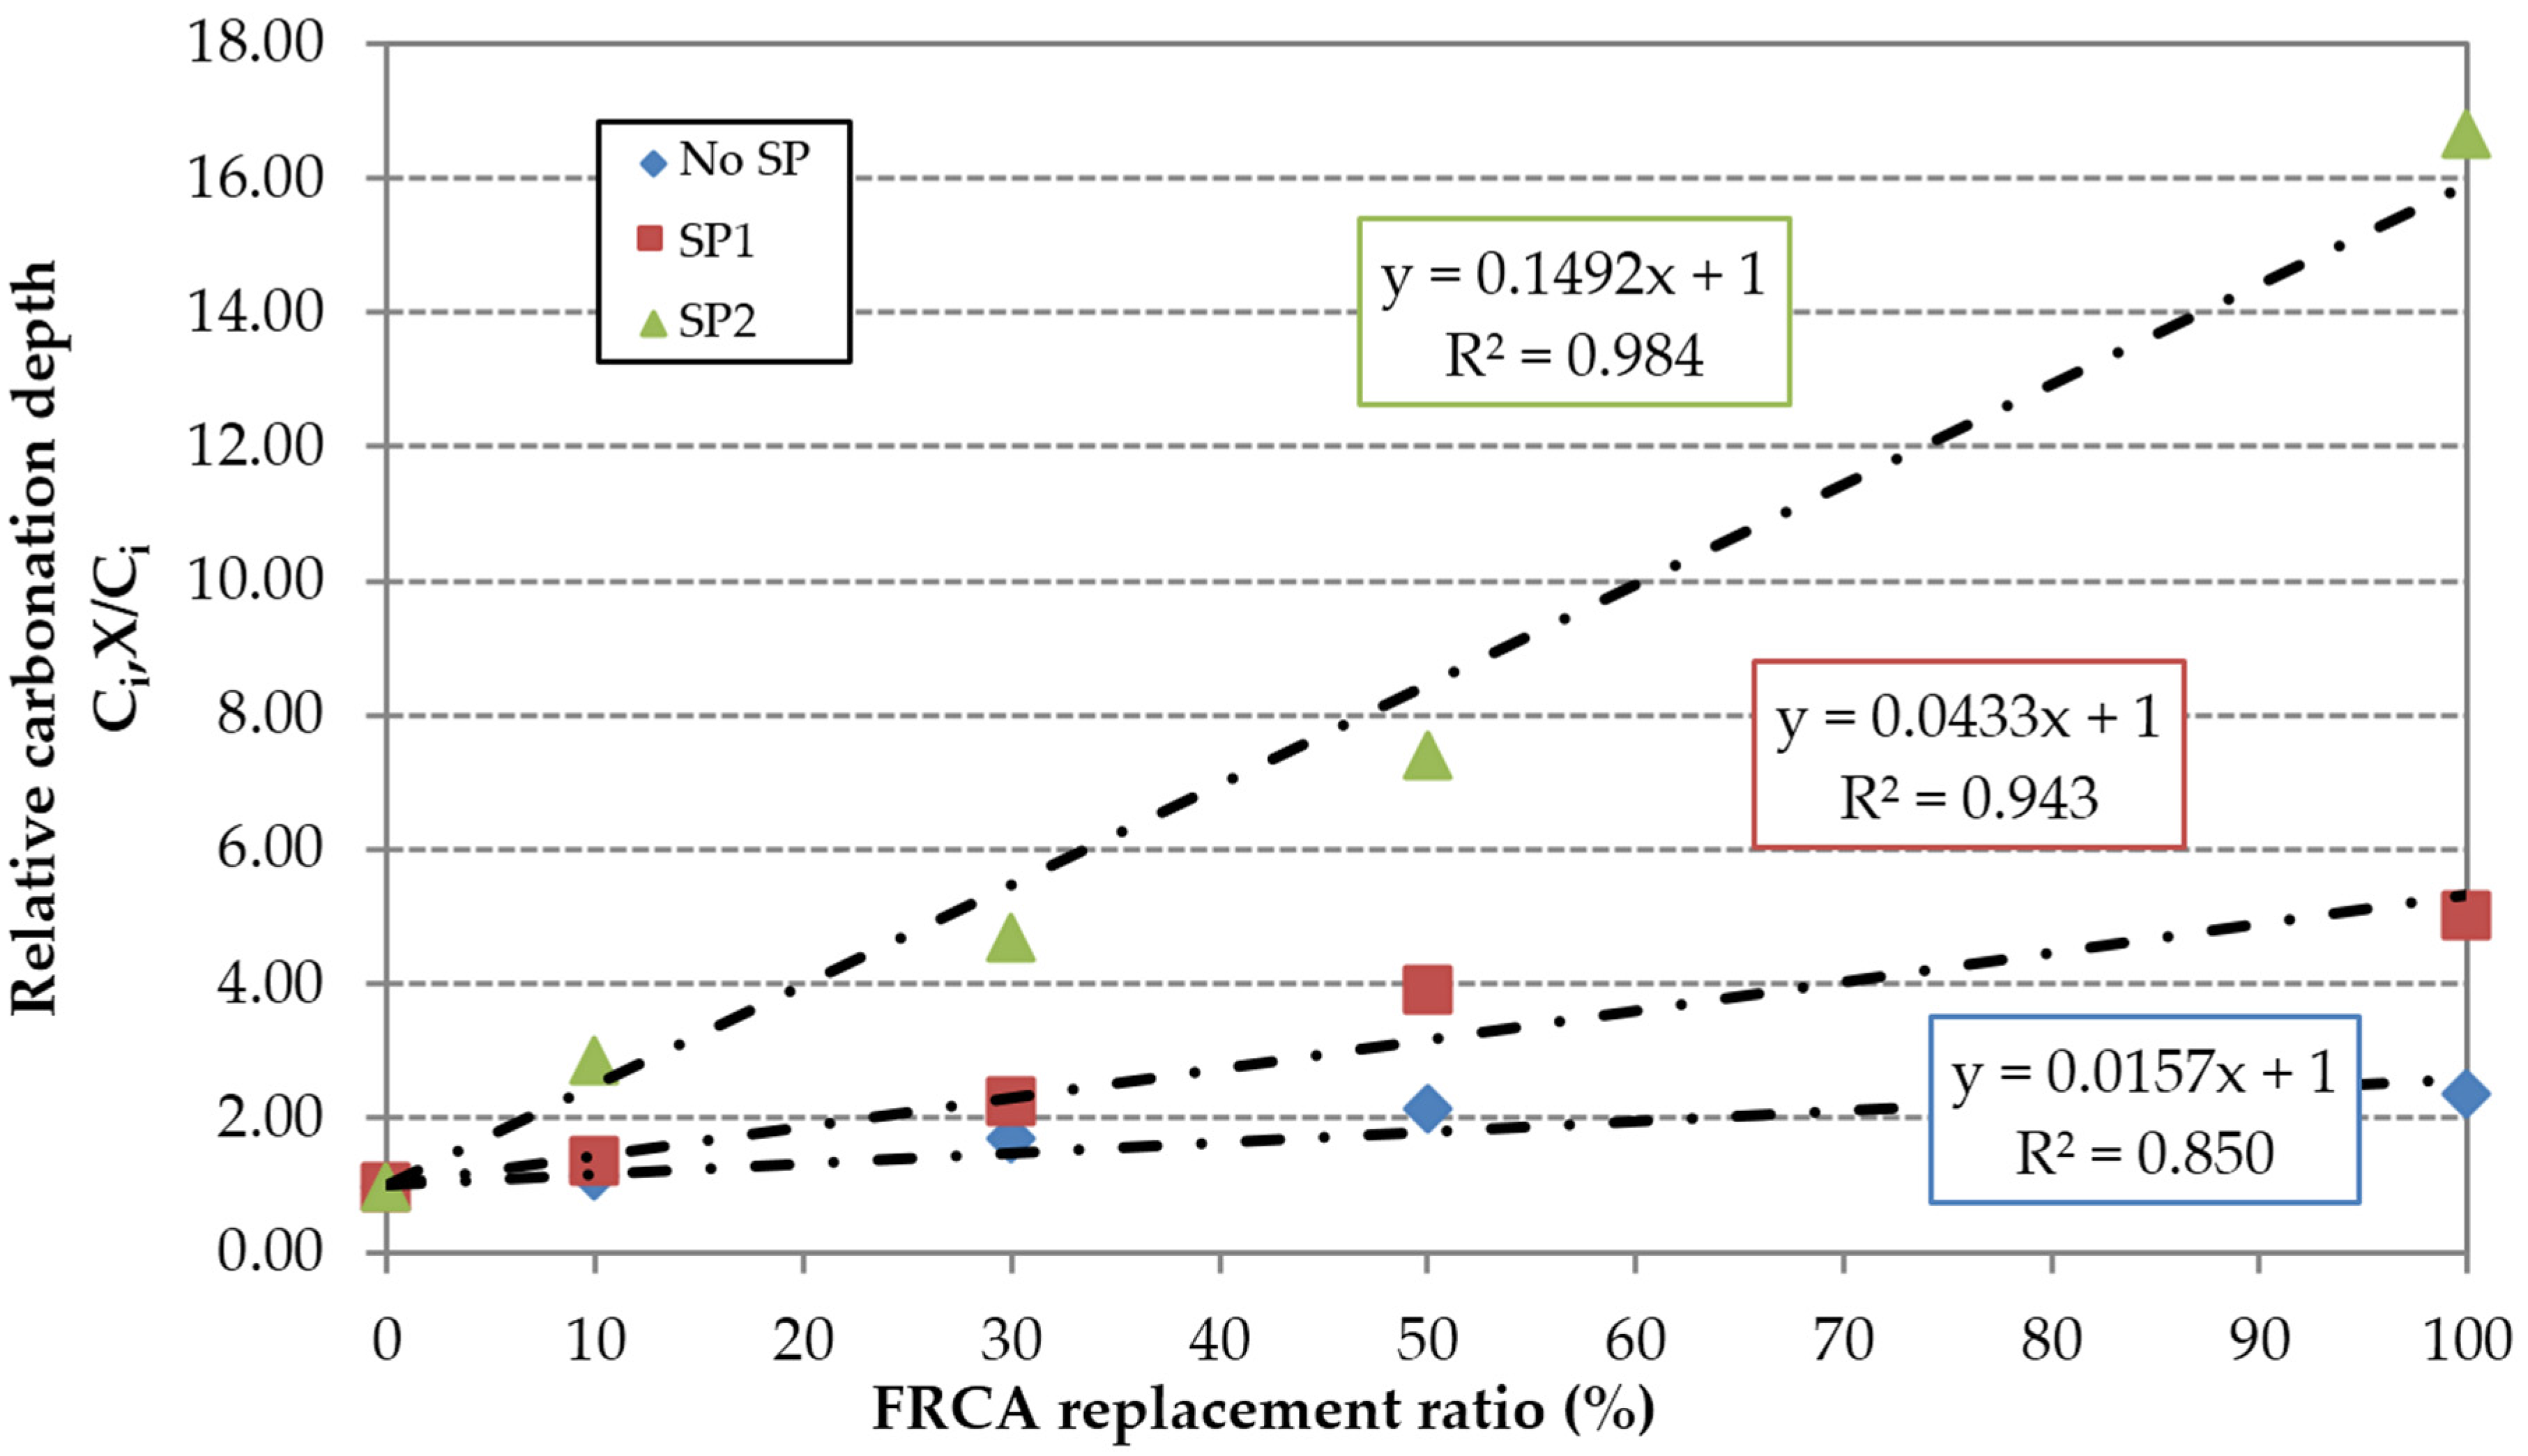
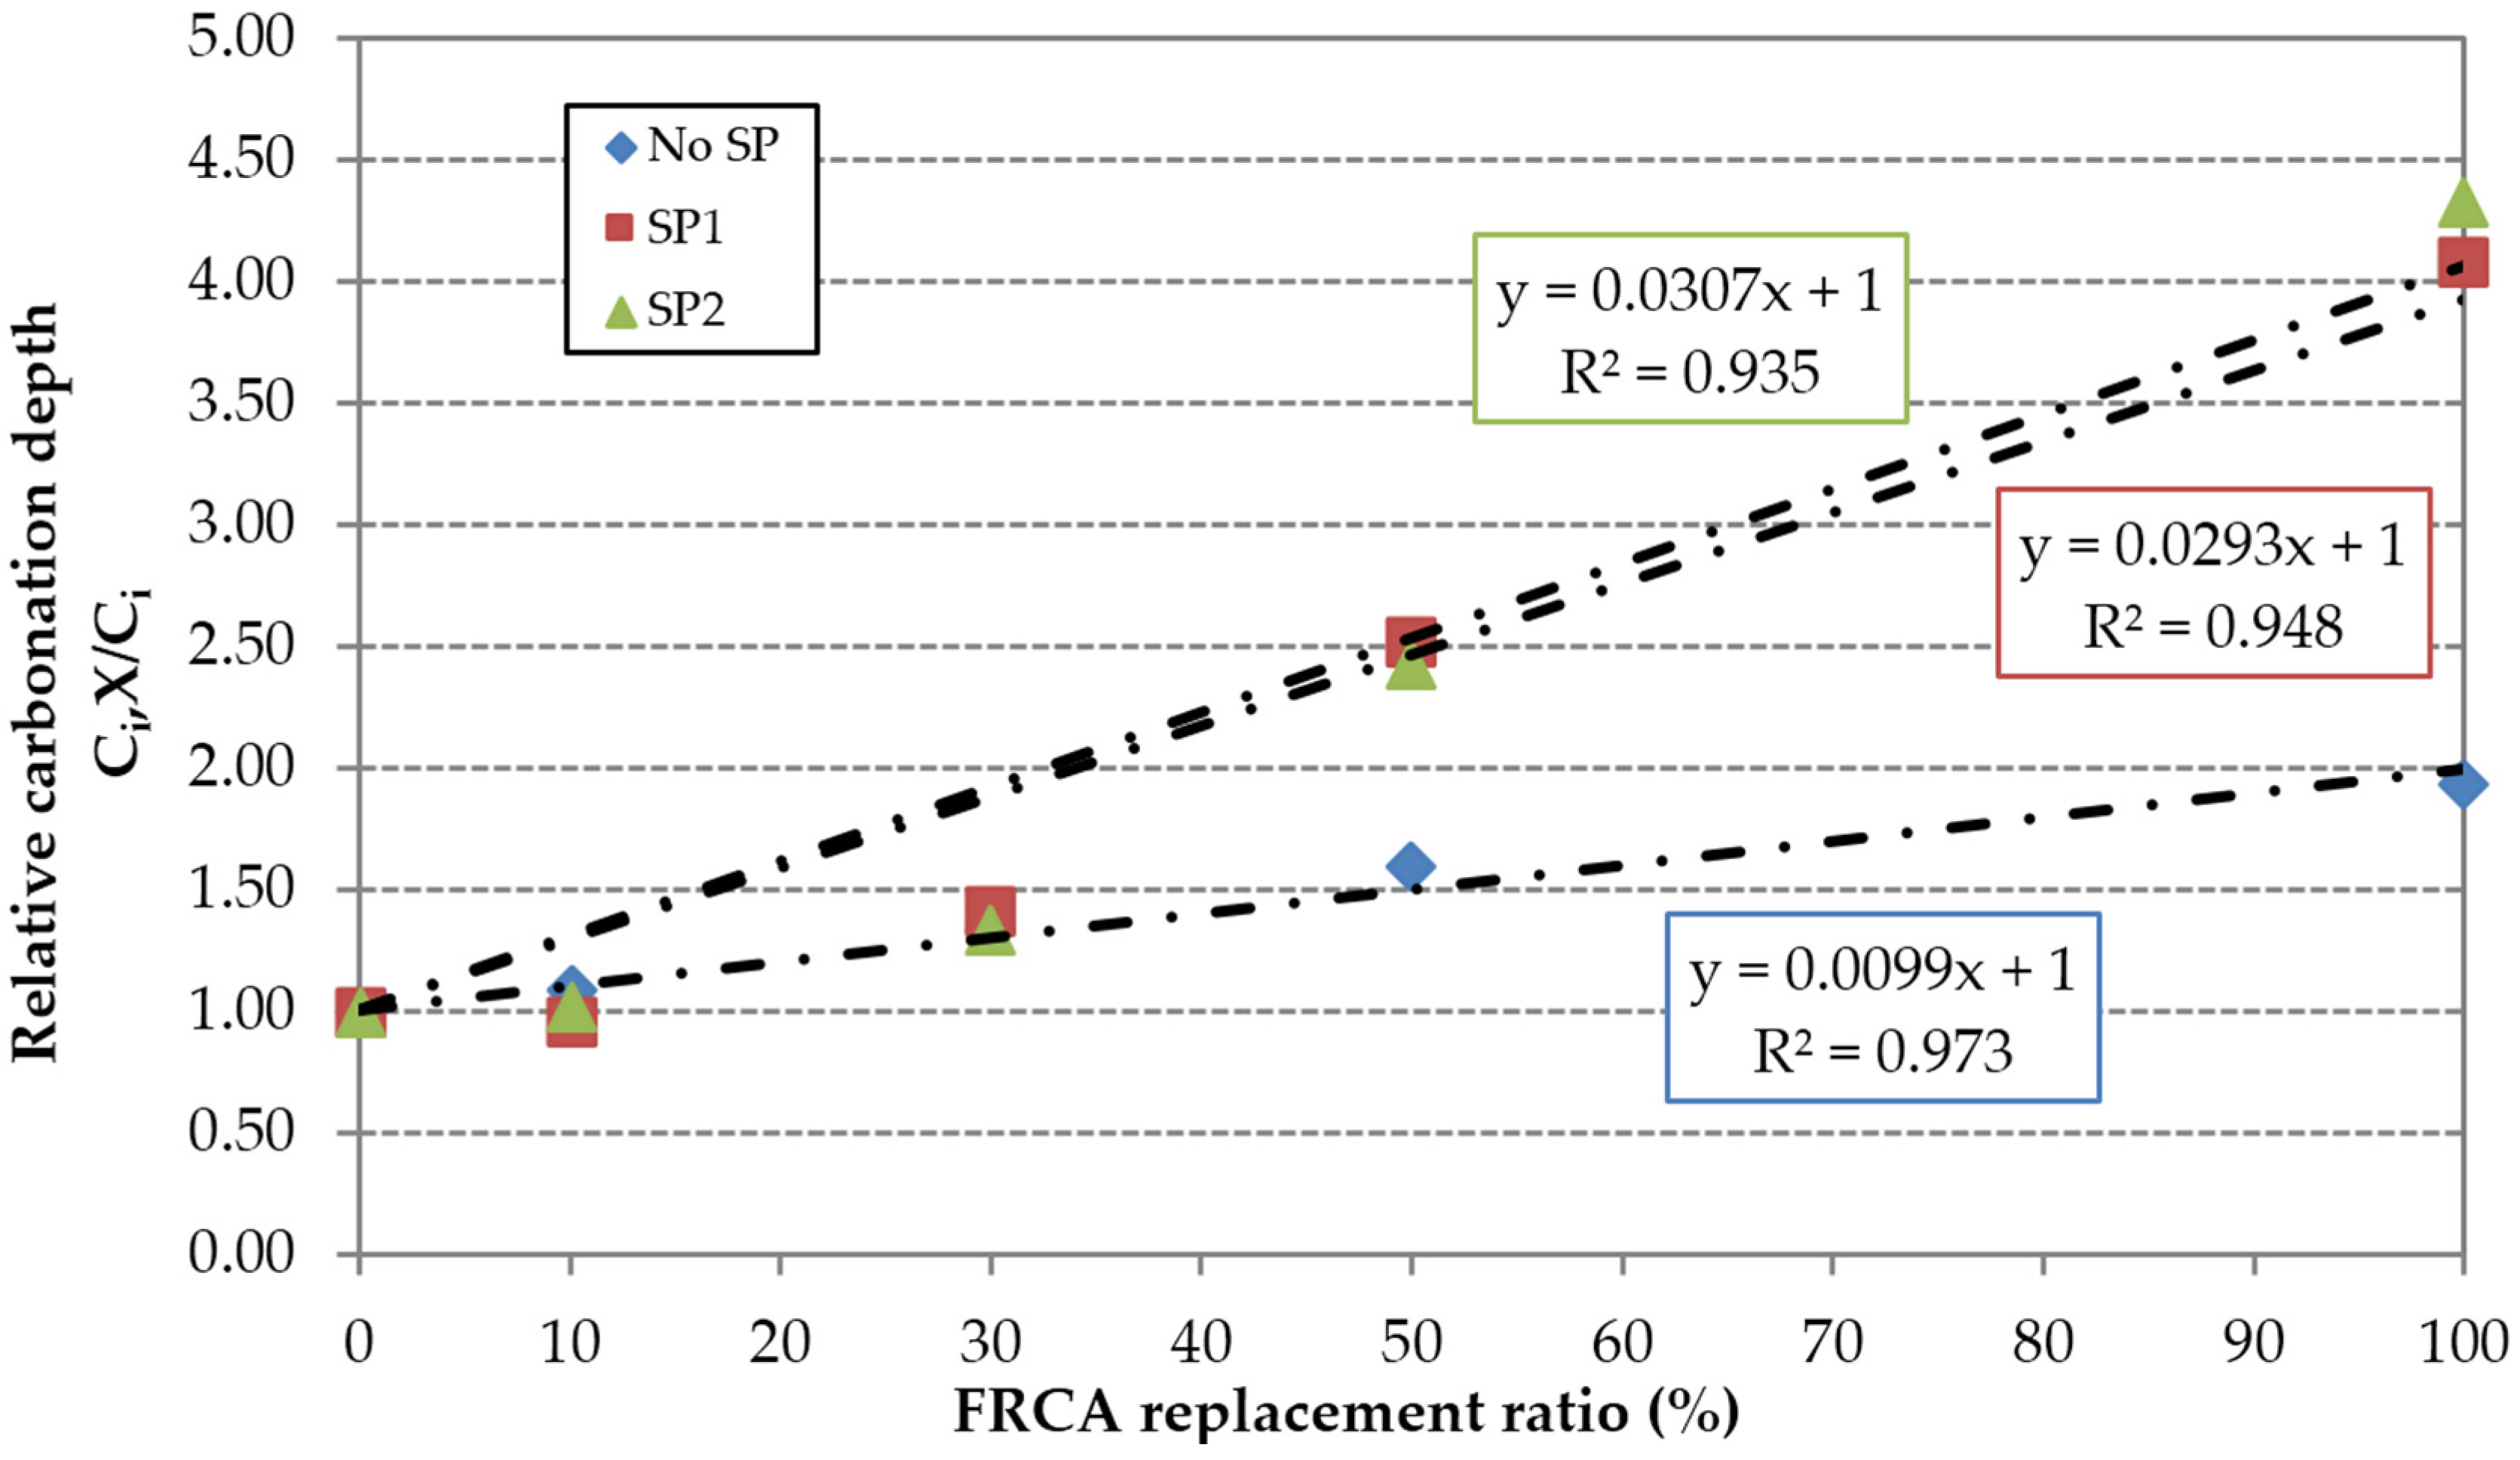
In relative terms, the superplasticizers’ efficiency is compromised by the incorporation of FRCA, especially at early ages. This can be justified by the higher porosity of FRCA, which results in a greater contact surface between the aggregate particles and superplasticizers. The content used in the reference mixes RC1 and RC2 is insufficient to maintain the effectiveness of the superplasticizers. This is more evident in the SP2 family, as shown by the higher slope of the linear trend (
Figure 16 and
Figure 17); this is due to the low value of the carbonation depth of the RC2 mix. However, the use of high-performance superplasticizer compensated the negative effect of the FRCA for this property.
Figure 16.
Influence of FRCA replacement ratio on the relative carbonation depth at seven days.
Figure 16.
Influence of FRCA replacement ratio on the relative carbonation depth at seven days.
Figure 17.
Influence of FRCA replacement ratio on the relative carbonation depth at 91 days.
Figure 17.
Influence of FRCA replacement ratio on the relative carbonation depth at 91 days.
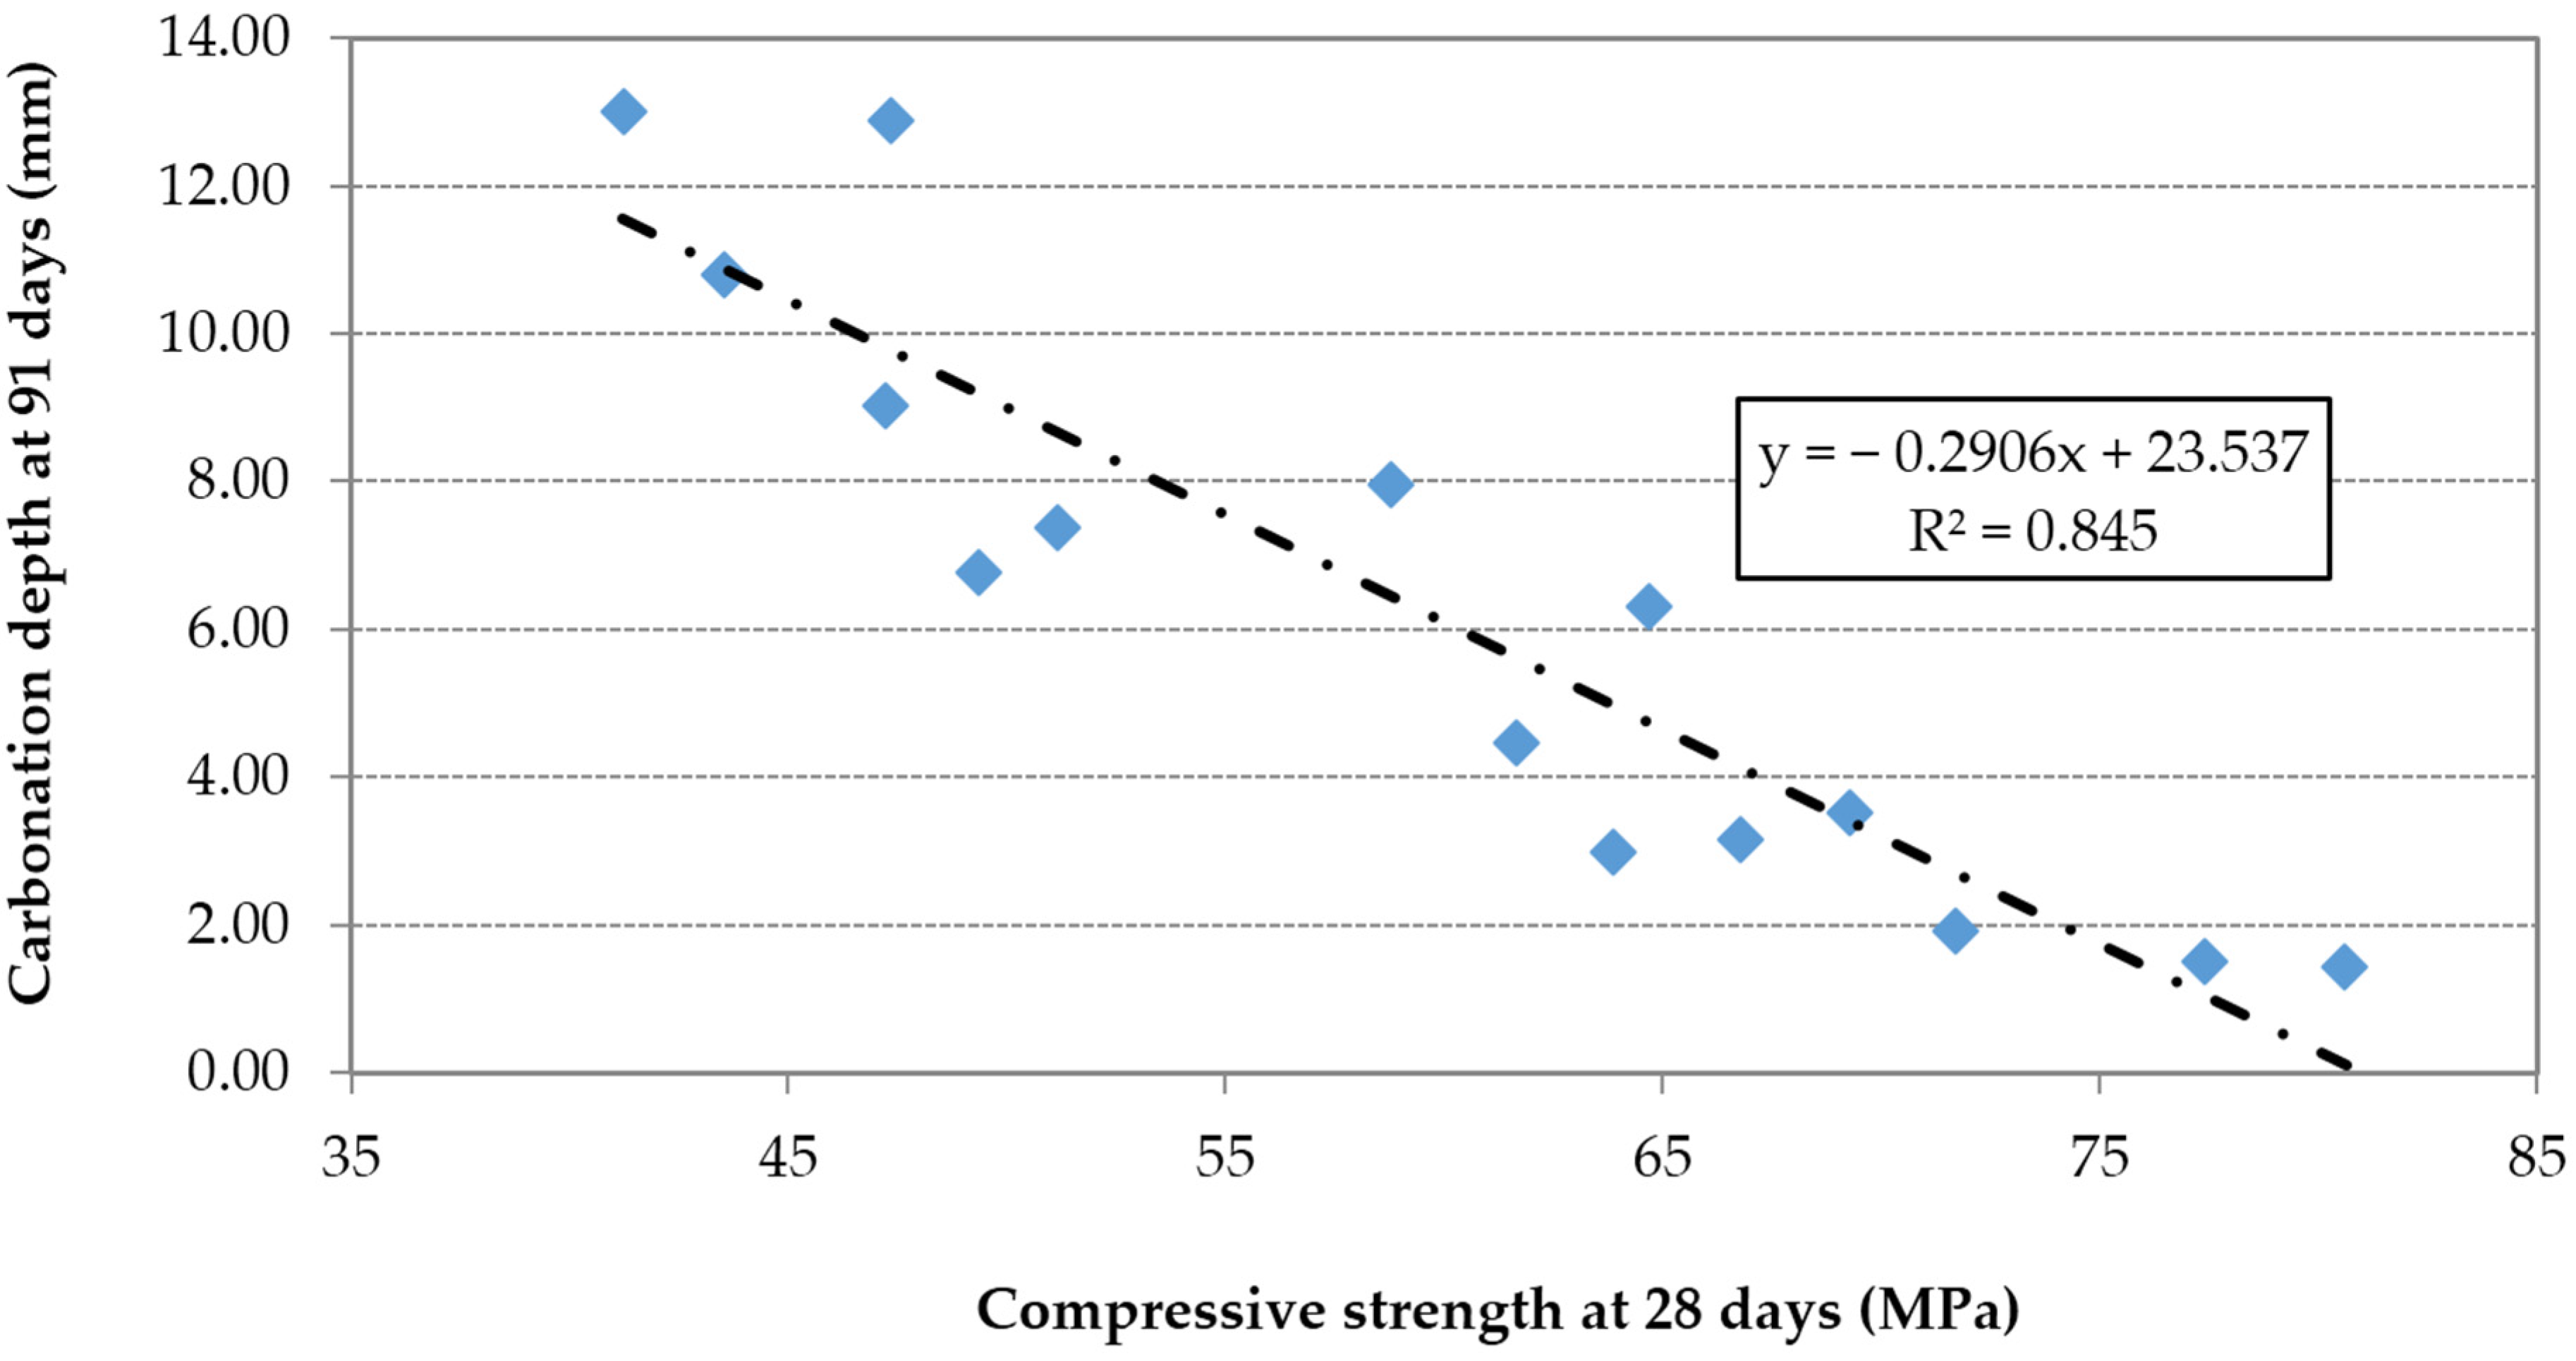
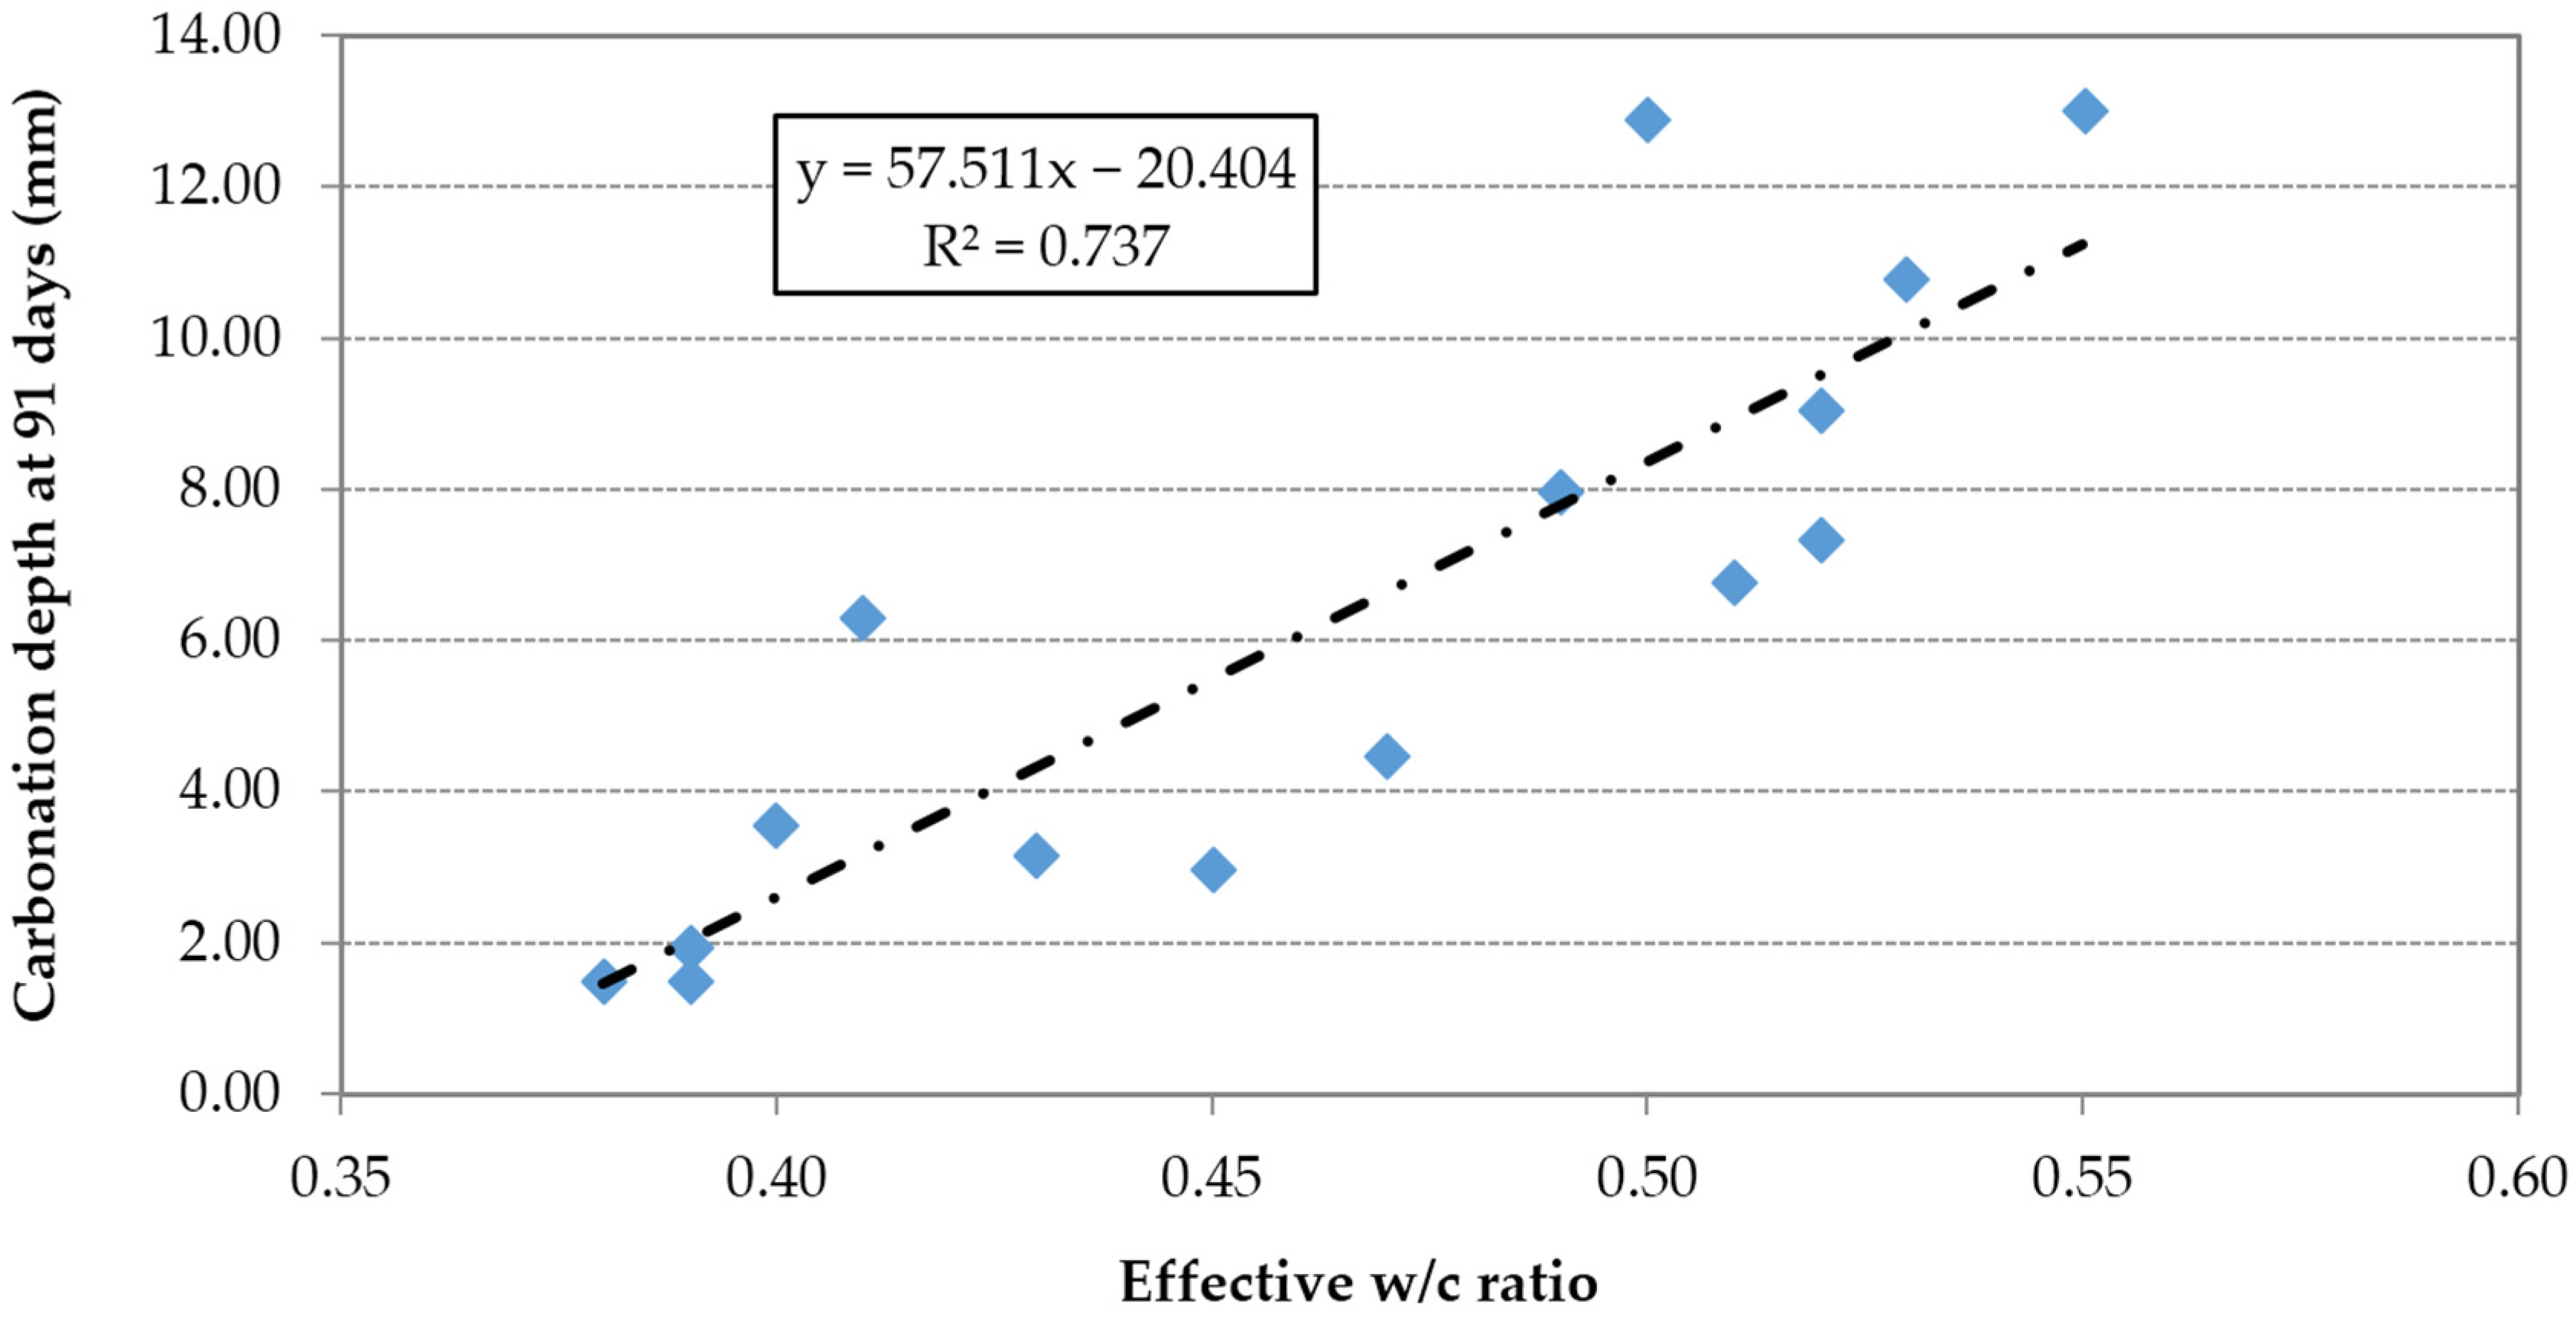
The carbonation depth is proportional to the effective w/c ratio (
Figure 18) and inversely proportional to the compressive strength (
Figure 19).
Table 8 shows that concrete made with 100% FRCA and SP2 had a carbonation depth of 6.31 mm while the mix without superplasticizer and 100% FNA had 6.75 mm. This demonstrated that the increase of porosity caused by the use of FRCA is offset by the effect of high-performance SP in reducing the w/c ratio and increasing the compacity of concrete.
Figure 18.
Carbonation depth vs. effective w/c ratio.
Figure 18.
Carbonation depth vs. effective w/c ratio.
Table 8.
91-day carbonation depth of each of the concrete’s families and FRCA replacement ratios.
Table 8.
91-day carbonation depth of each of the concrete’s families and FRCA replacement ratios.
| Family | C0 | C1 | C2 |
|---|
| FRCA (%) | Carbonation Depth (mm) | ΔFRCA (%) | ΔSP (%) | Carbonation Depth (mm) | ΔFRCA (%) | ΔSP (%) | Carbonation Depth (mm) | ΔFRCA (%) | ΔSP (%) |
|---|
| 0 | 6.75 | 0.00 | 0.00 | 3.16 | 0.00 | −53.24 | 1.46 | 0.00 | −78.40 |
| 10 | 7.34 | 8.80 | 0.00 | 3.00 | −4.95 | −59.15 | 1.47 | 0.71 | −80.00 |
| 30 | 9.03 | 33.80 | 0.00 | 4.44 | 40.59 | −50.87 | 1.94 | 32.86 | −78.55 |
| 50 | 10.78 | 59.72 | 0.00 | 7.94 | 151.49 | −26.38 | 3.54 | 142.86 | −67.15 |
| 100 | 13.03 | 93.06 | 0.00 | 12.88 | 307.92 | −1.20 | 6.31 | 332.86 | −51.56 |
Figure 19.
Carbonation depth vs. compressive strength.
Figure 19.
Carbonation depth vs. compressive strength.
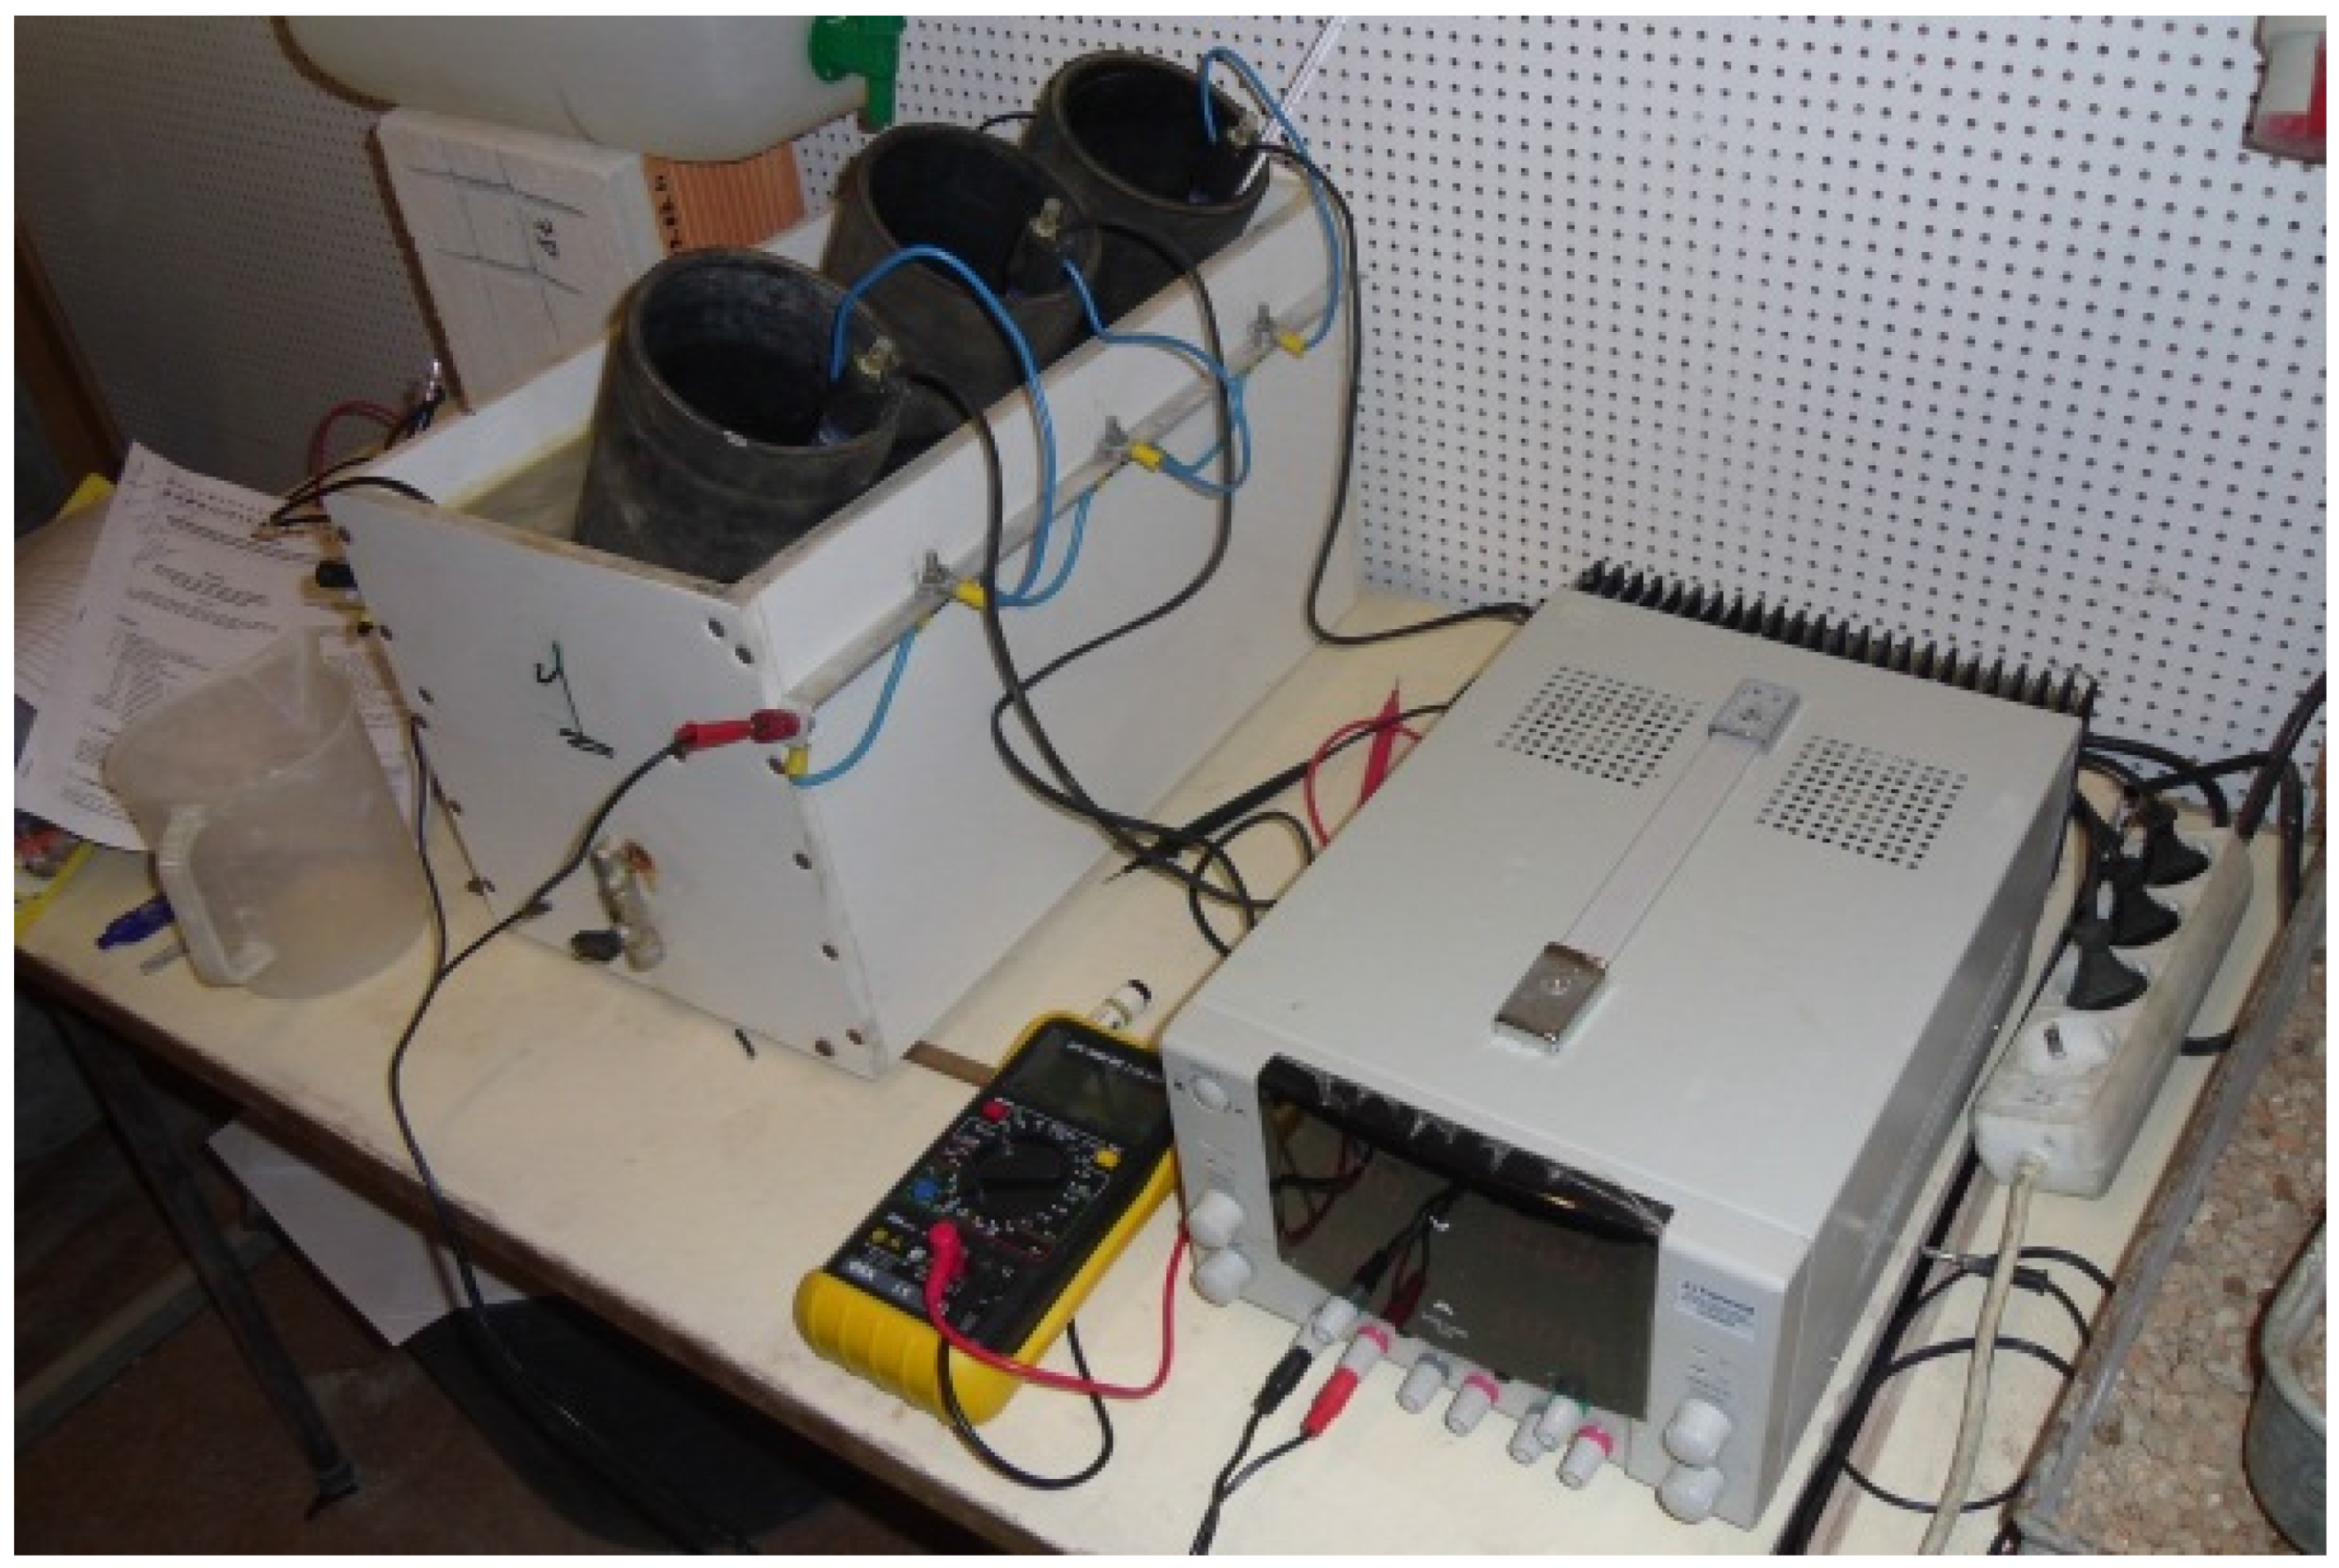
4.7. Chloride Penetration Test
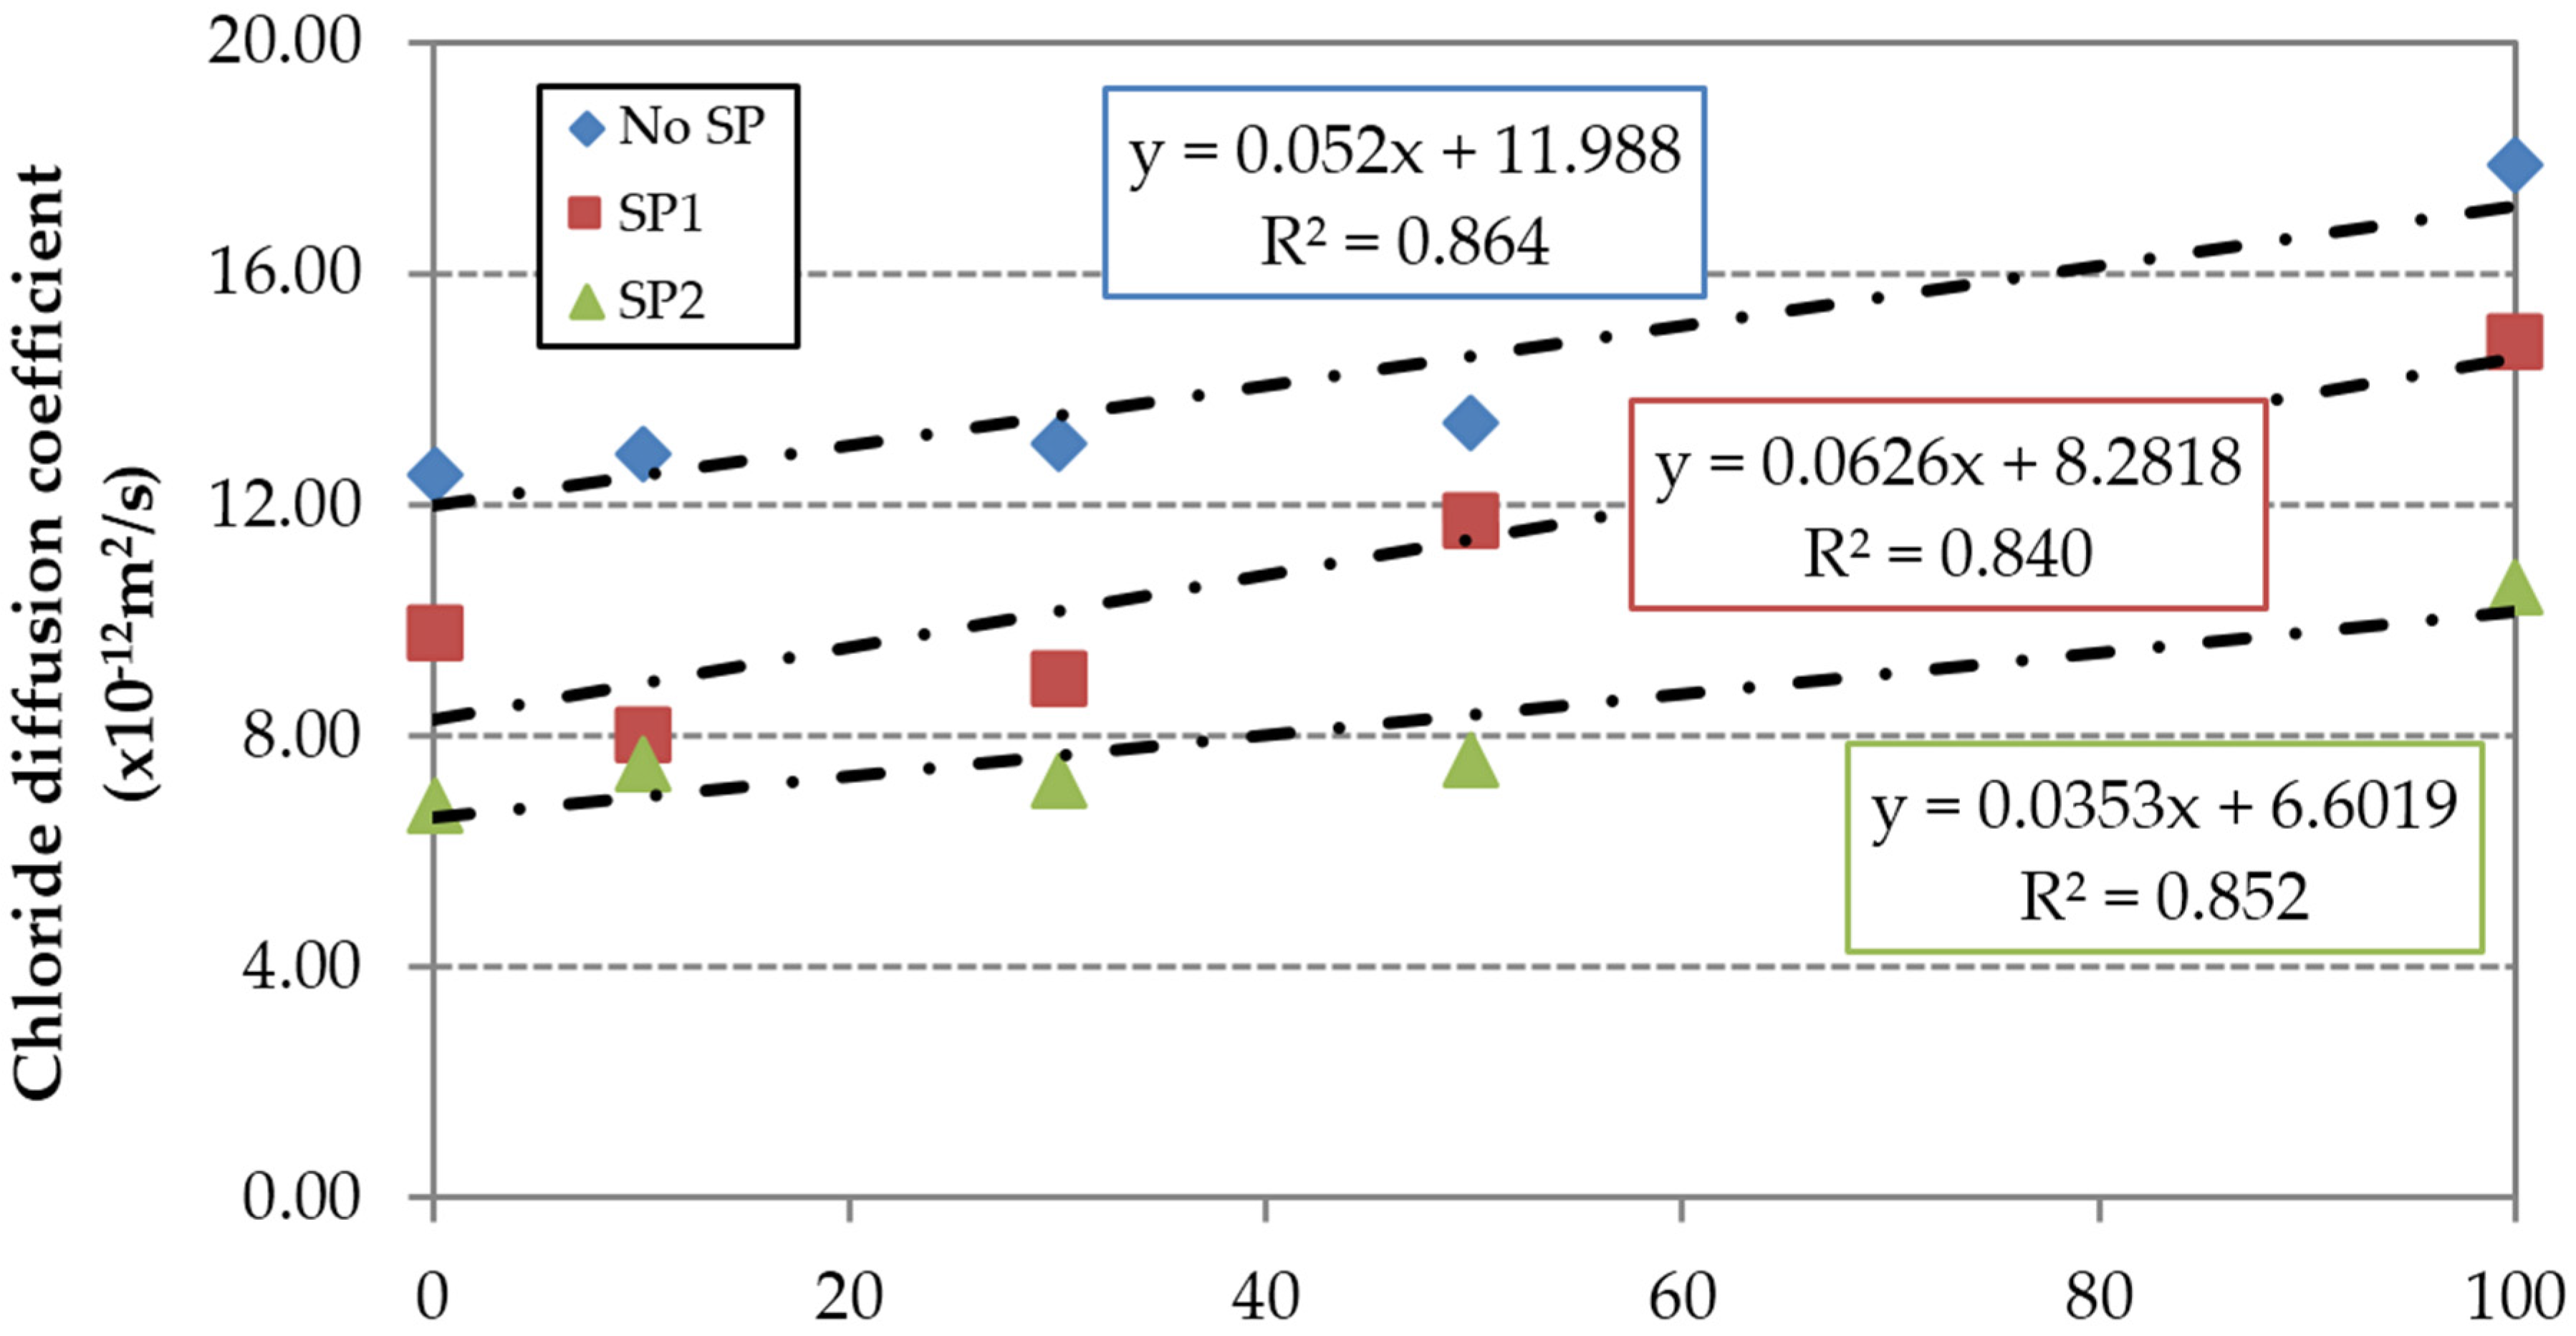
The chloride penetration test results at 91 days are shown in
Figure 20. There is a clear trend of increase of chloride diffusion coefficient by incorporating FRCA. Increases of 42%, 54% and 56% for concrete made without SP, with SP1 and with SP2, respectively, were obtained, which were related to the higher porosity of concrete made with FRCA.
Figure 20.
Chloride diffusion coefficient at 91 days.
Figure 20.
Chloride diffusion coefficient at 91 days.
Maximum decreases of 38% and 46% were obtained for the concrete families made with SP1 and SP2 respectively, which was related to their lower effective w/c ratio.
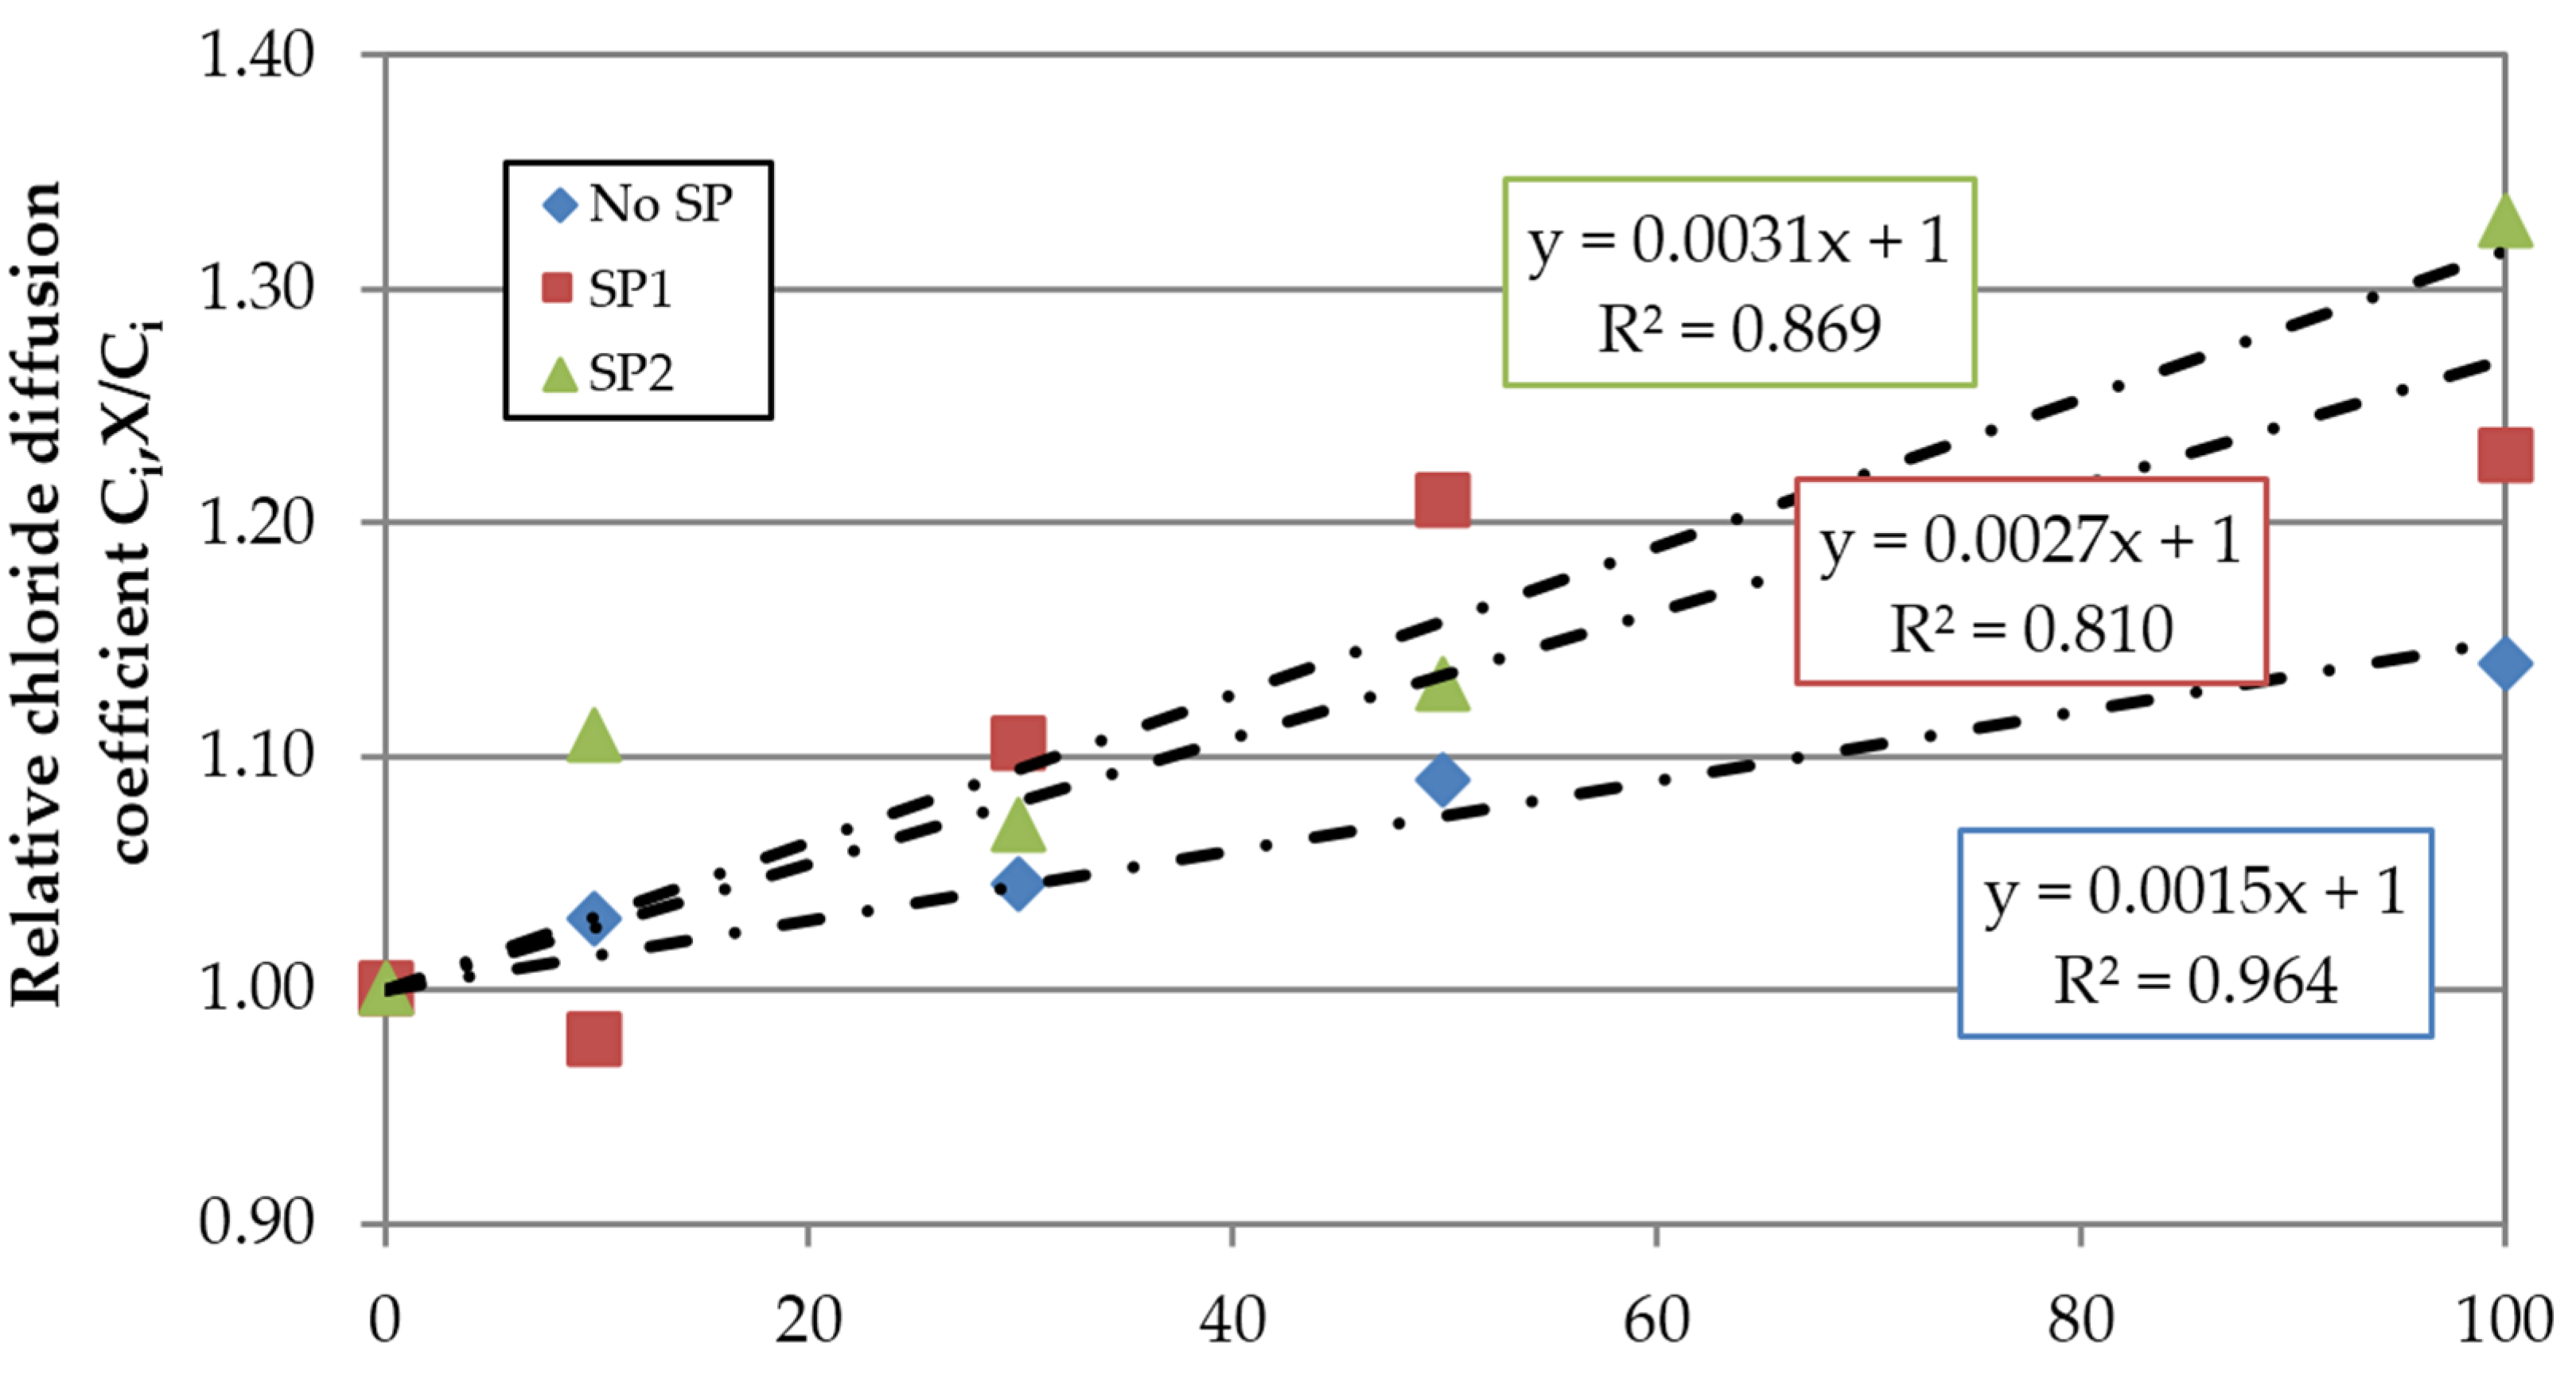
Figure 21 represents in relative terms the sensitivity of the superplasticizers to the FRCA incorporation, confirming the conclusions reached in the carbonation test. This effect is even clearer in the concrete made with SP2, as seen by the slope of the linear trend.
Figure 21.
Influence of FRCA replacement ratio on the relative chloride diffusion coefficient at 91 days.
Figure 21.
Influence of FRCA replacement ratio on the relative chloride diffusion coefficient at 91 days.
Table 9 shows the results for each of the concrete families and replacement ratios besides the values of Δ
FRCA and Δ
SP. Concrete made with 100% FRCA and SP2 showed a chloride diffusion coefficient value of 10.60 × 10
−12 m
2/s, whereas the reference concrete RC0 showed a higher value of 12.57 × 10
−12 m
2/s. As in the carbonation depth, the loss of porosity achieved with the use of SP2 was greater than the increase resulting from the use of FRCA and the higher effective w/c ratio necessary in the mix to obtain similar slump.
Table 9.
91-day chloride diffusion coefficient of each of the concrete’s families and FRCA replacement ratios.
Table 9.
91-day chloride diffusion coefficient of each of the concrete’s families and FRCA replacement ratios.
| Family | C0 | C1 | C2 |
|---|
| FRCA (%) | Dnssm (10−12 m2/s) | ΔFRCA (%) | ΔSP (%) | Dnssm (10−12 m2/s) | ΔFRCA (%) | ΔSP (%) | Dnssm (10−12 m2/s) | ΔFRCA (%) | ΔSP (%) |
|---|
| 0 | 12.57 | 0.00 | 0.00 | 9.79 | 0.00 | −22.13 | 6.81 | 0.00 | -45.80 |
| 10 | 12.91 | 2.74 | 0.00 | 8.01 | −18.15 | −37.96 | 7.49 | 10.00 | -41.97 |
| 30 | 13.06 | 3.96 | 0.00 | 8.96 | −8.40 | −31.39 | 7.24 | 6.23 | -44.62 |
| 50 | 13.38 | 6.50 | 0.00 | 11.69 | 19.47 | −12.65 | 7.58 | 11.25 | -43.39 |
| 100 | 17.90 | 42.43 | 0.00 | 14.85 | 51.73 | −17.05 | 10.60 | 55.67 | -40.77 |
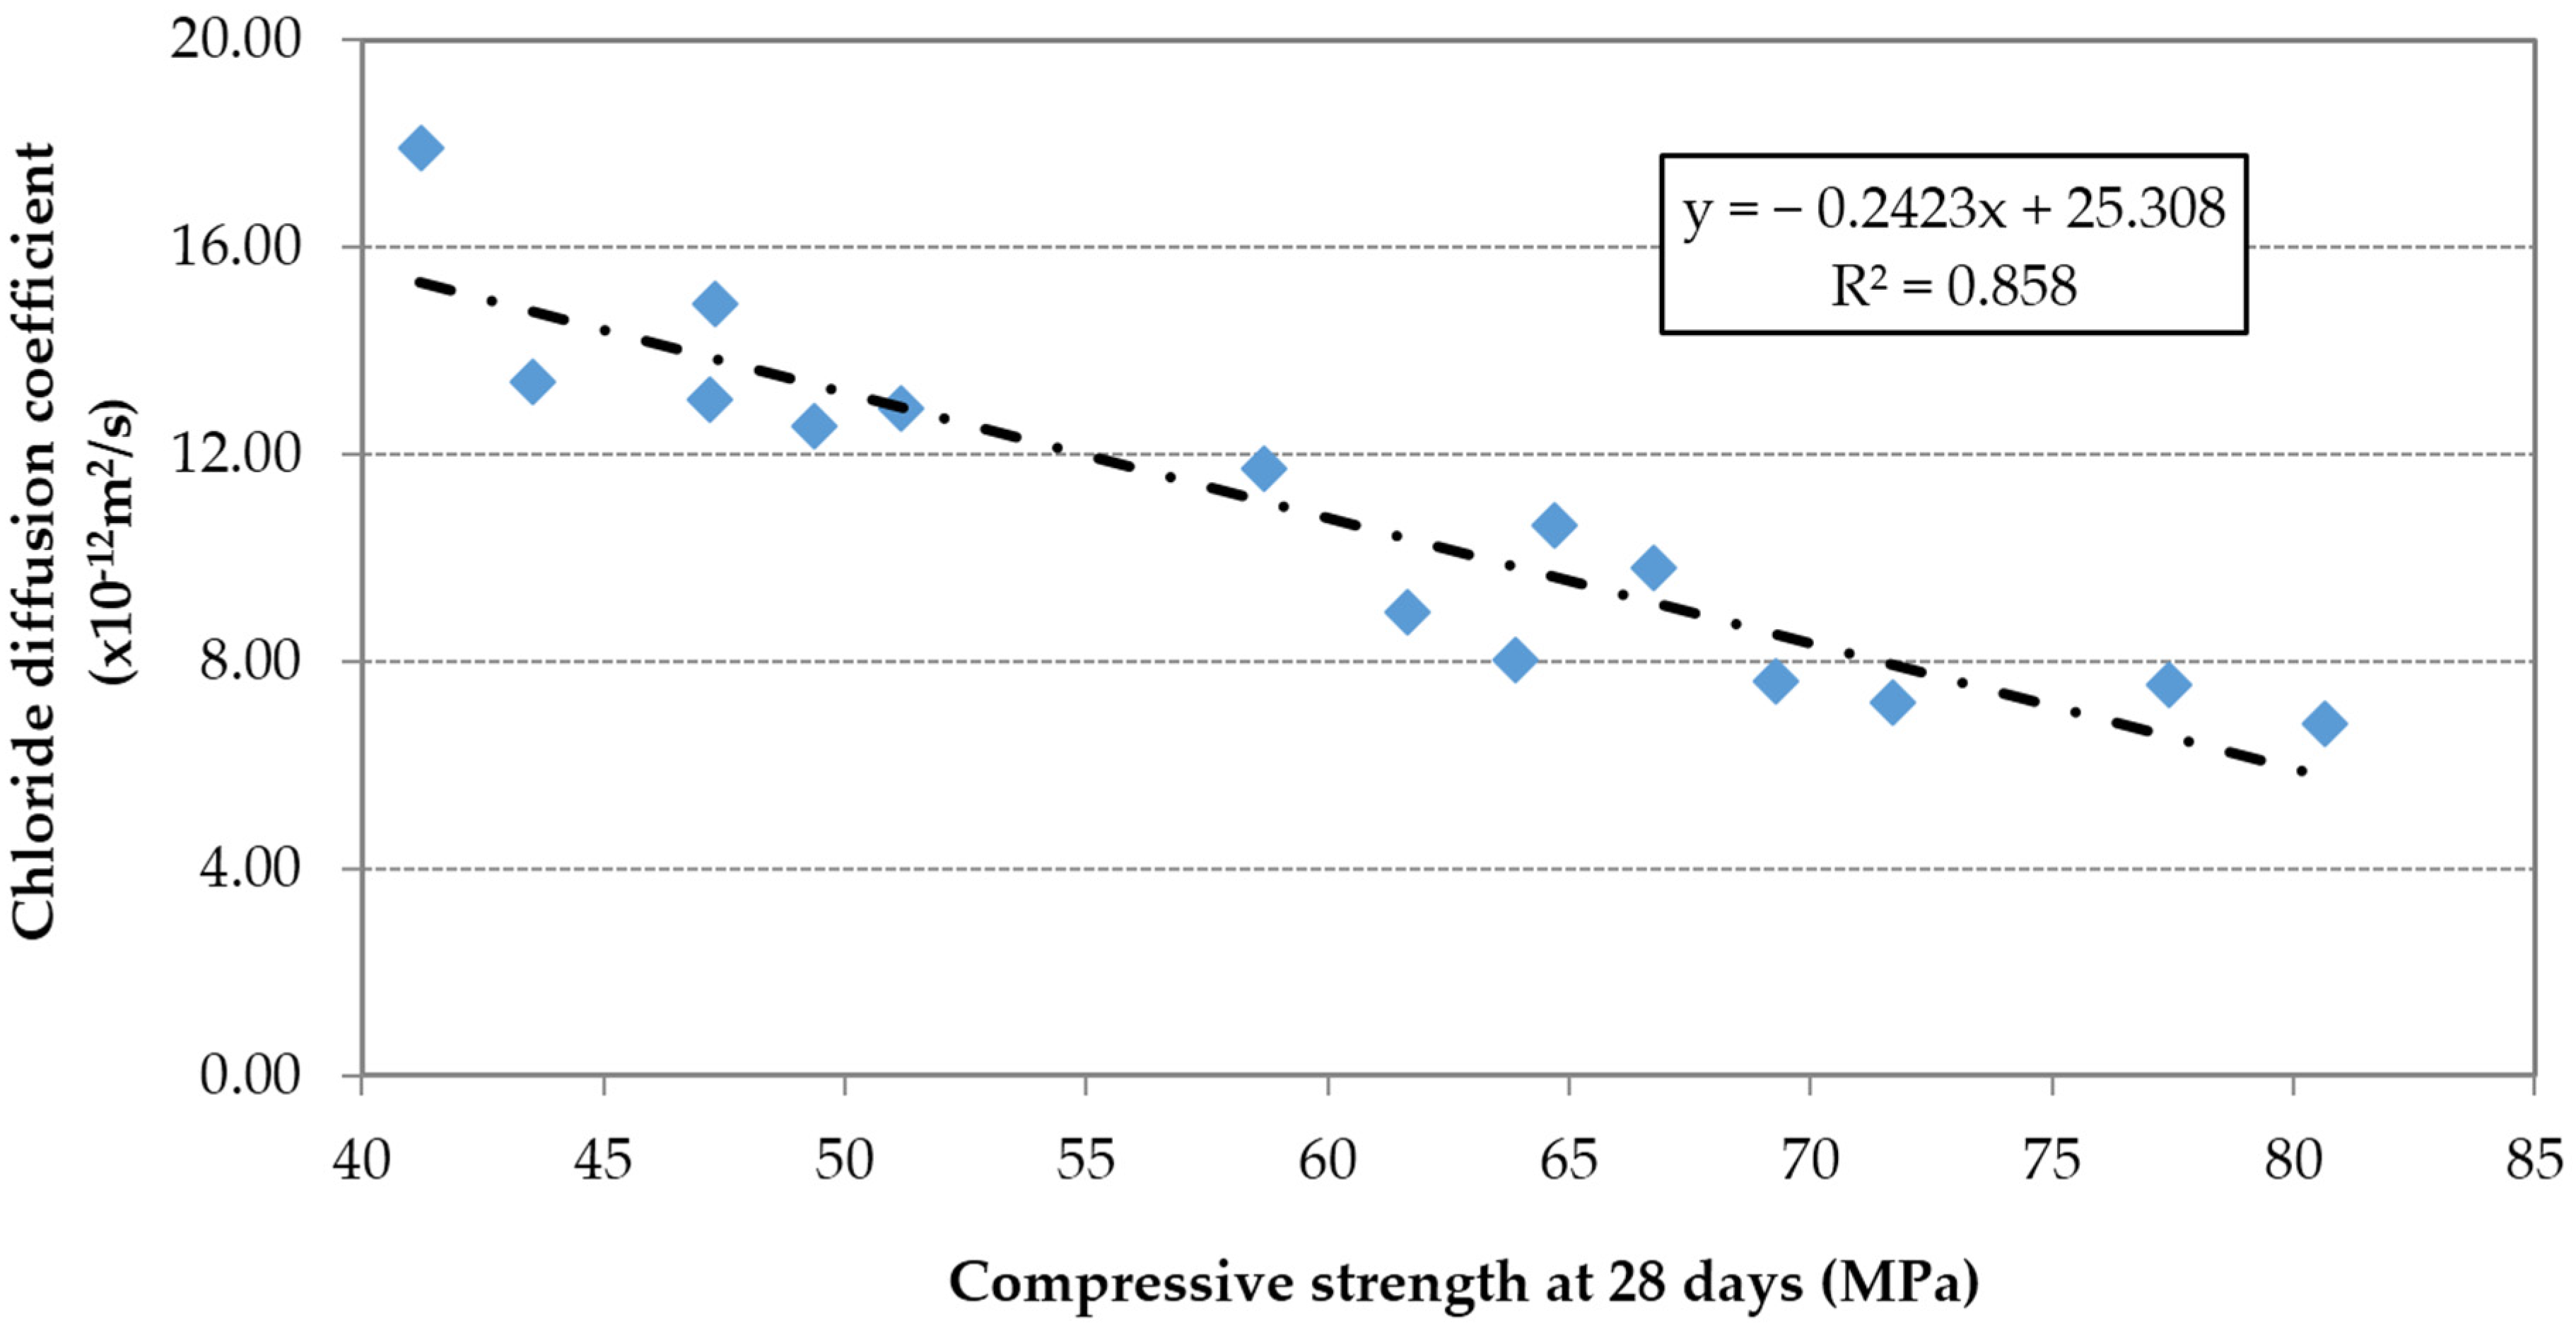
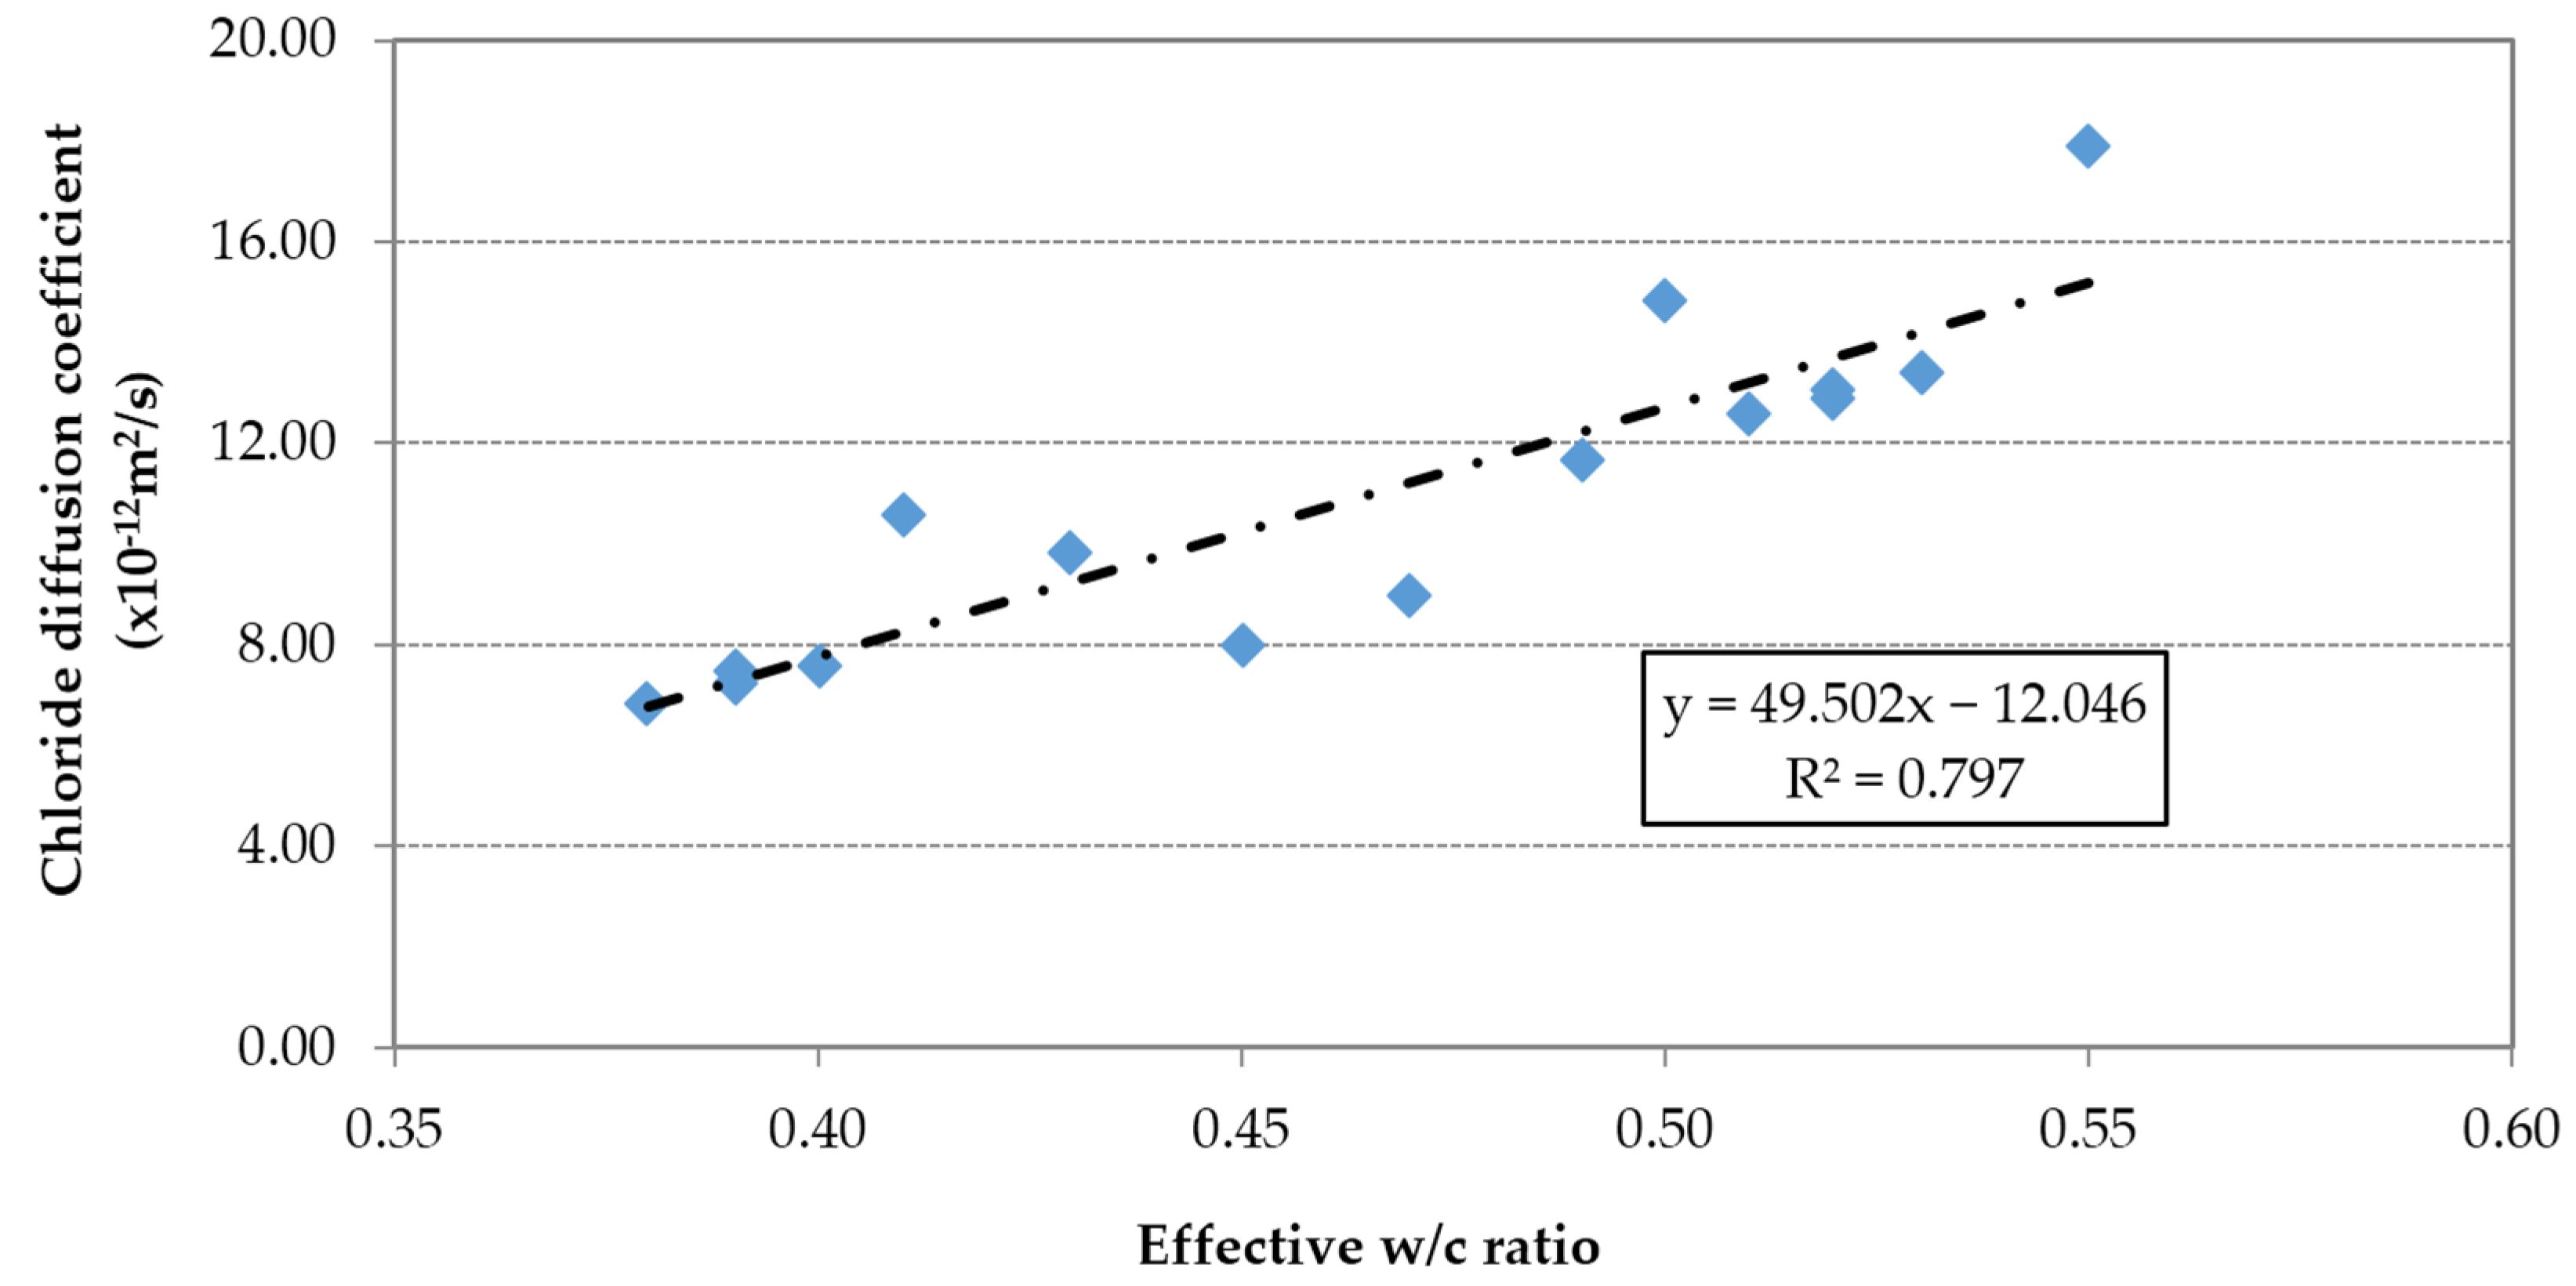
The chloride diffusion coefficient was proportional to the effective w/c ratio (
Figure 22) and inversely proportional to the compressive strength (
Figure 23).
Figure 22.
Chloride diffusion coefficient at 91 days vs. effective w/c ratio.
Figure 22.
Chloride diffusion coefficient at 91 days vs. effective w/c ratio.
Figure 23.
Chloride diffusion coefficient at 91 days vs. compressive strength.
Figure 23.
Chloride diffusion coefficient at 91 days vs. compressive strength.


 ,
, 

