
Controllable Electrochemical Synthesis of Reduced Graphene Oxide Thin-Film Constructed as Efficient Photoanode in Dye-Sensitized Solar Cells


Abstract
:
1. Introduction
2. Methodology
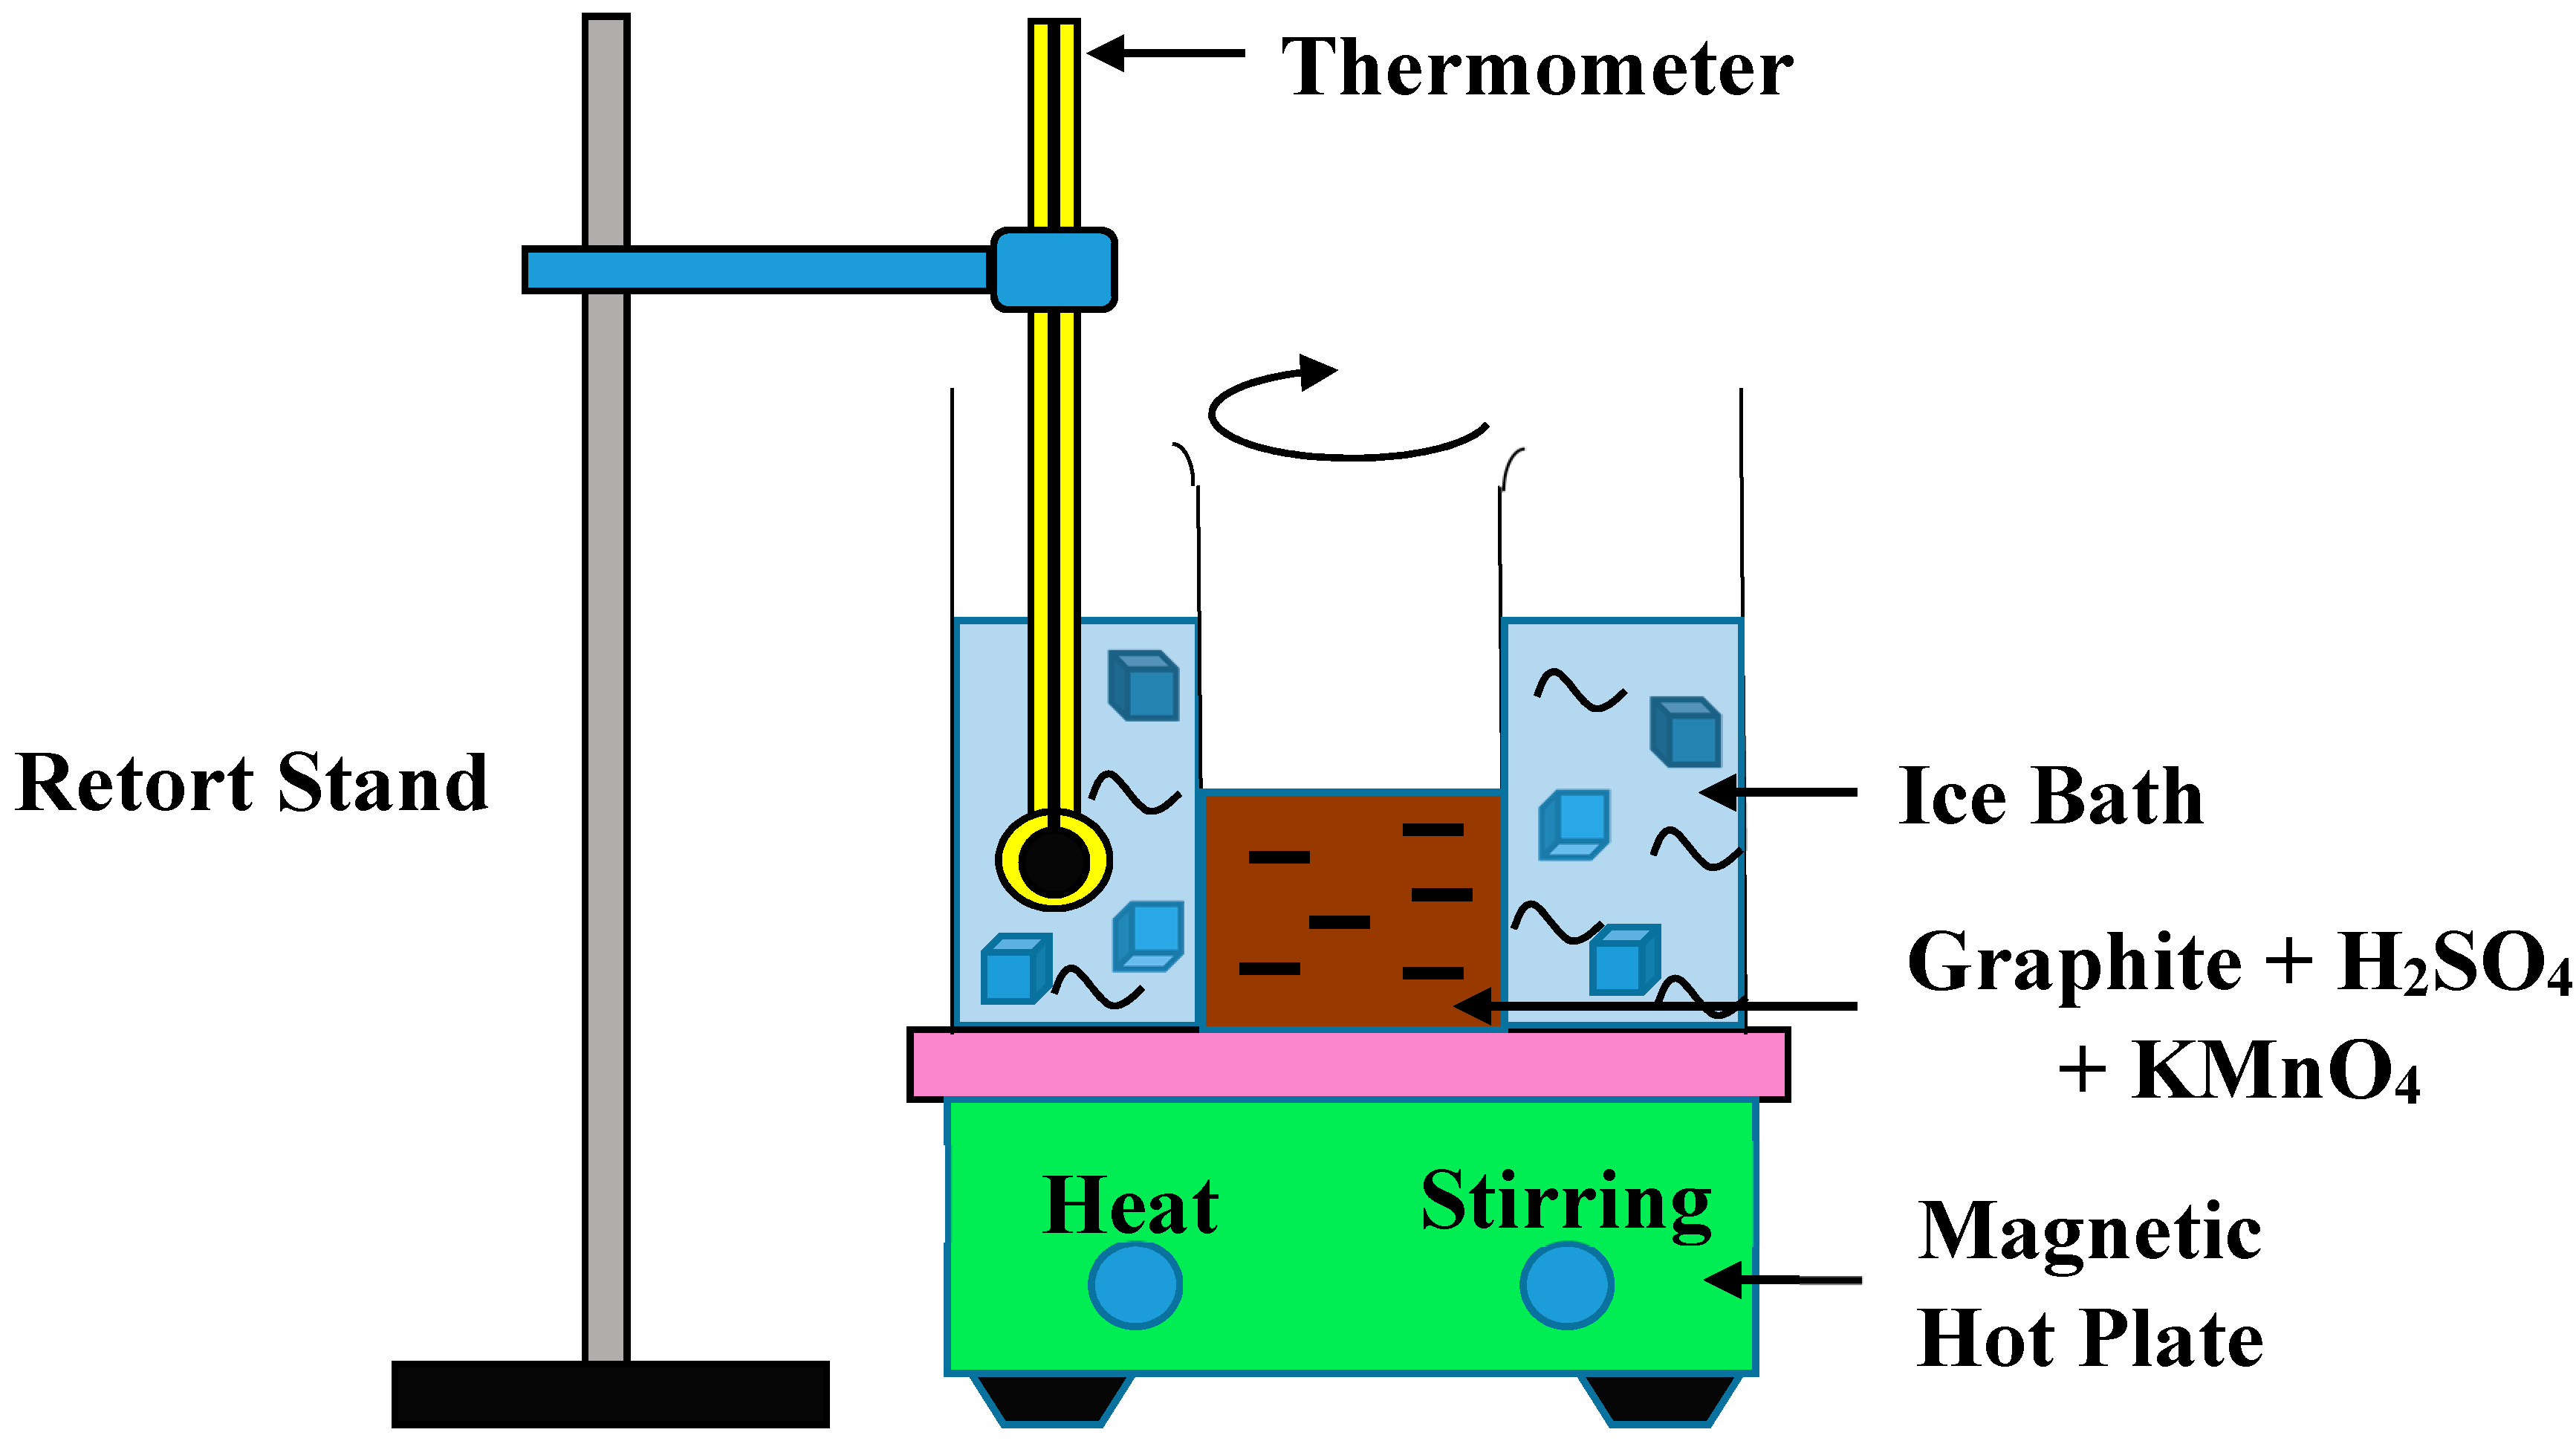
2.1. Graphene Oxide (GO) Synthesis
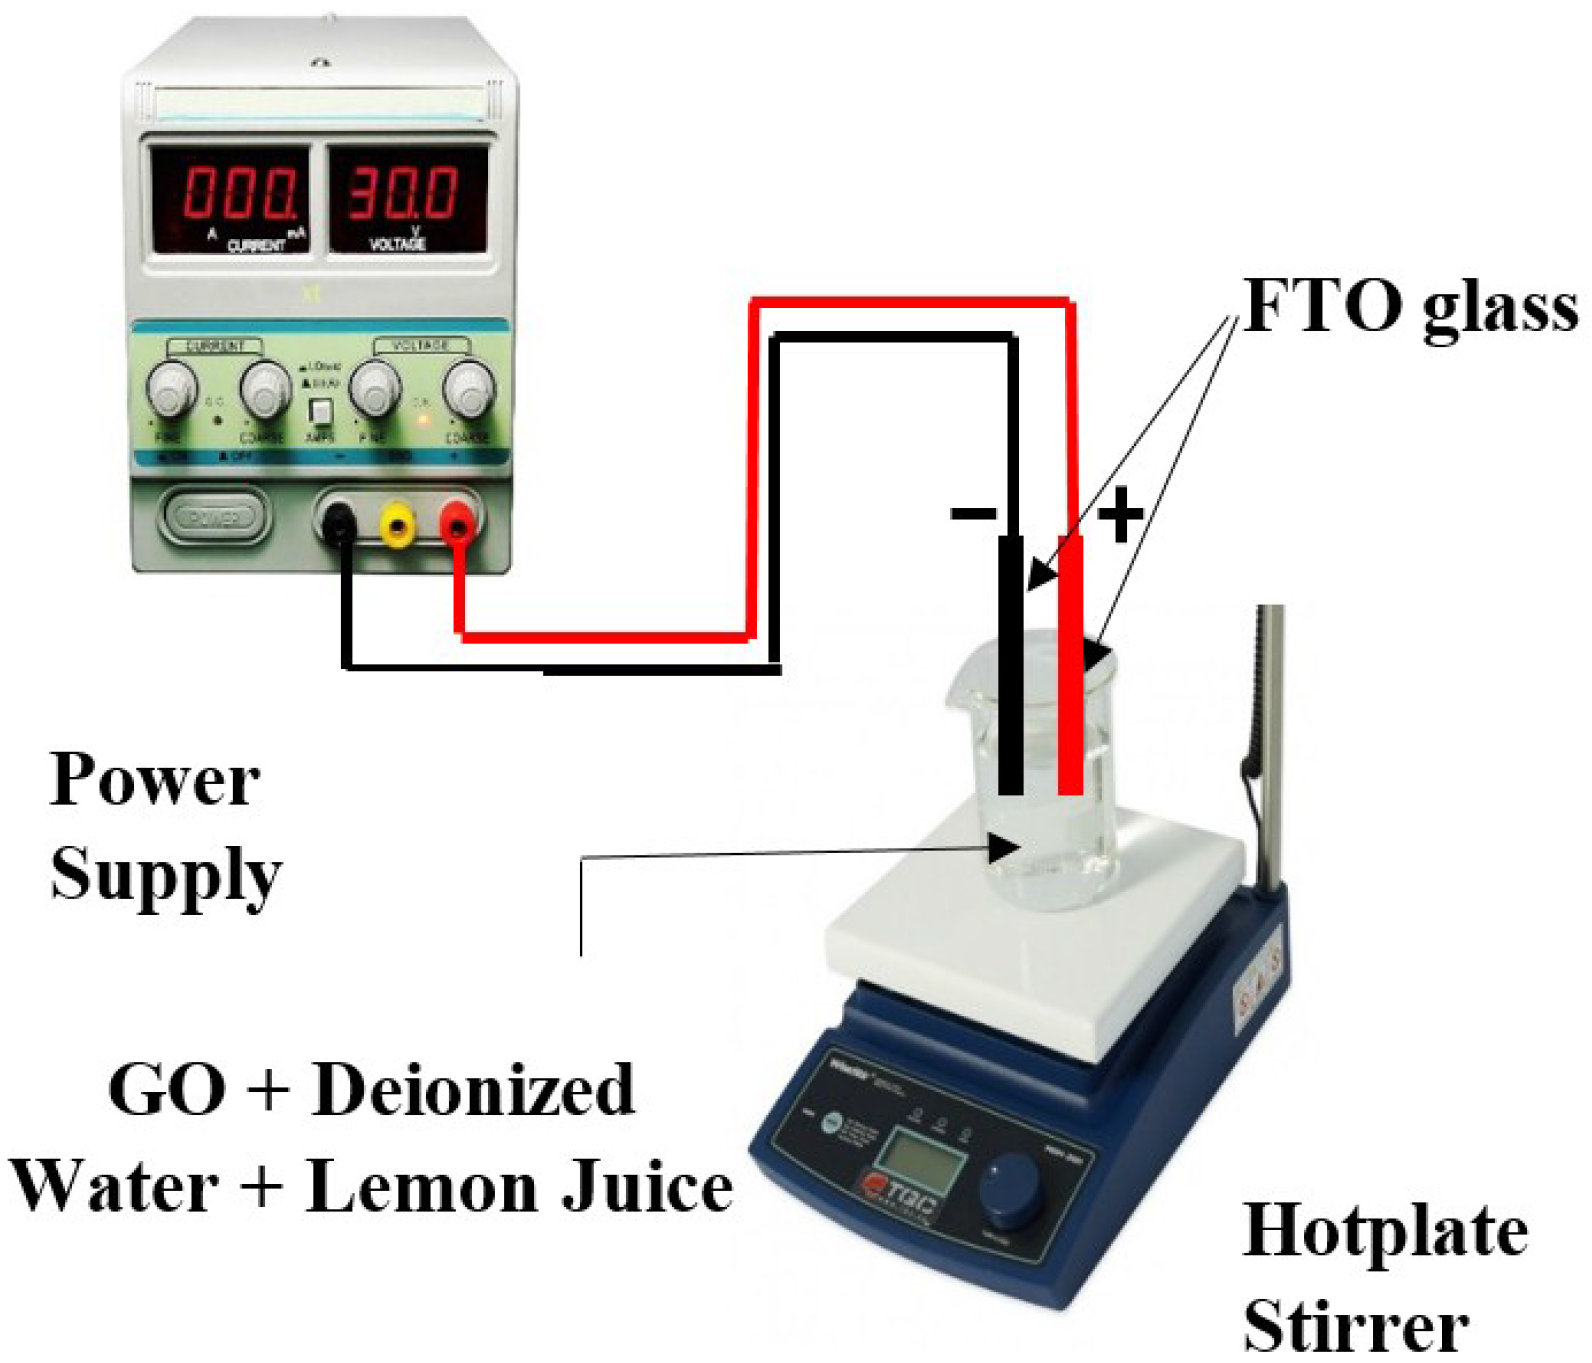
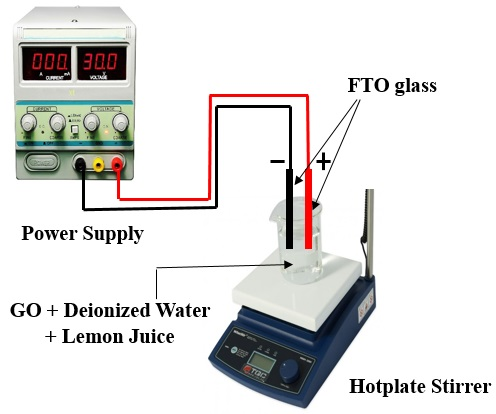
2.2. Electrochemical Reduction
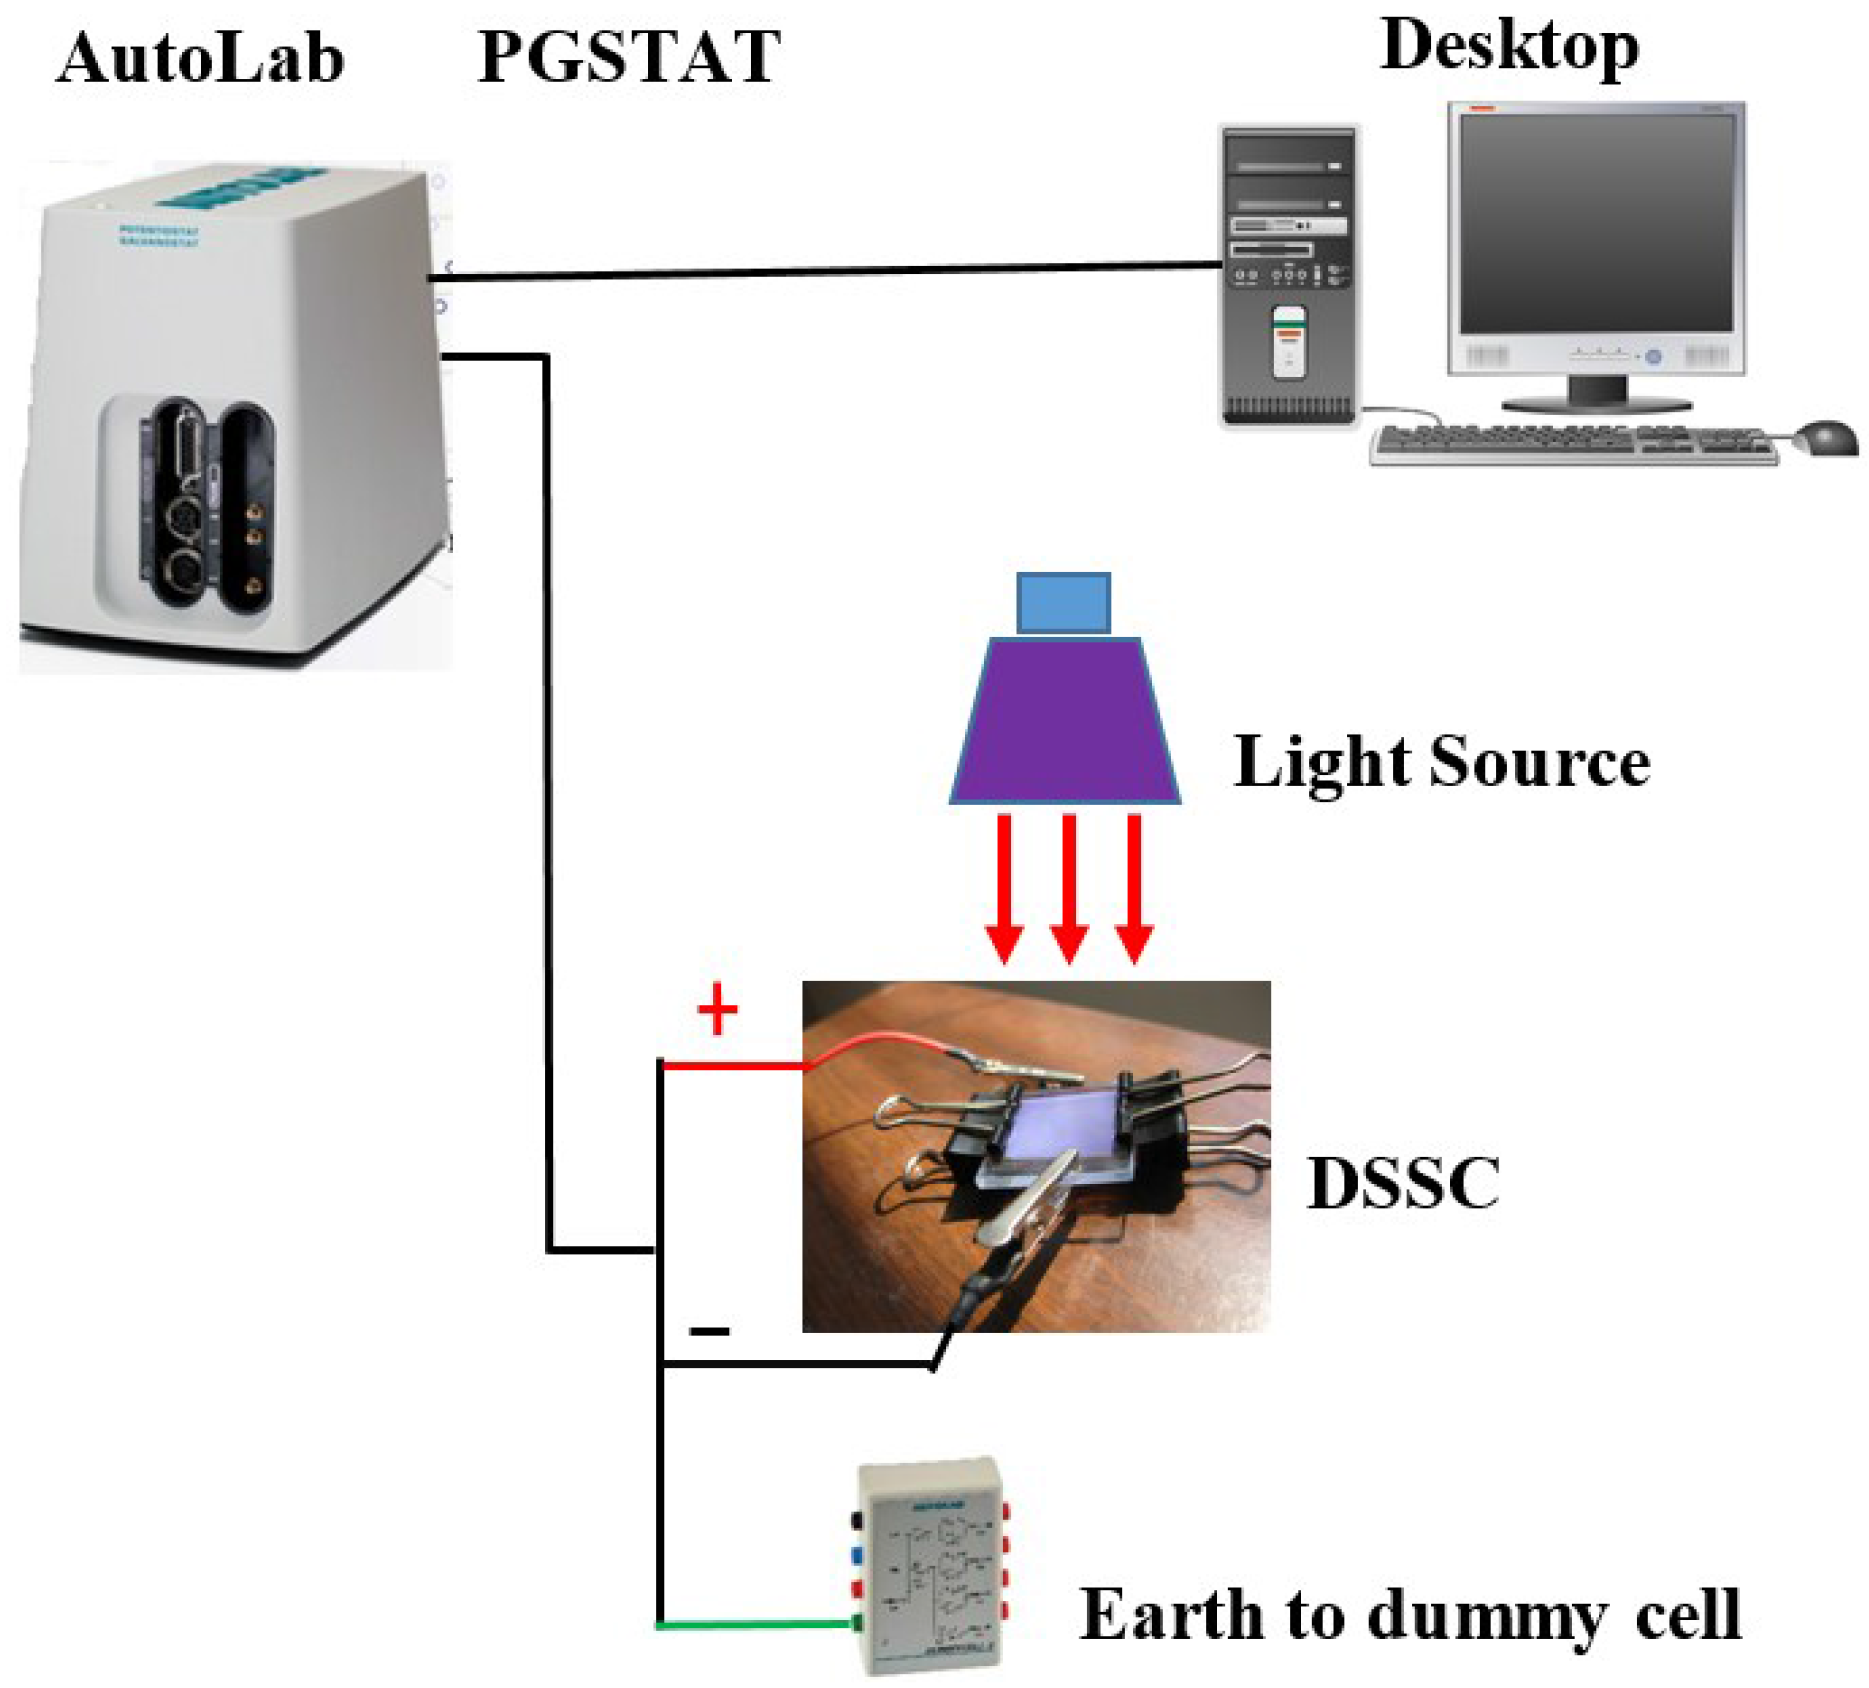
2.3. Preparation of DSSC
2.4. Characterization

3. Results and Discussion


| Materials | Carbon (%) | Oxygen (%) | Sulphur (%) | Chlorine (%) | Sodium (%) | Total (%) |
|---|---|---|---|---|---|---|
| rGO thin-film (5 V) | 76.20 | 23.00 | 0.08 | 0.29 | 0.43 | 100 |
| rGO thin-film (10 V) | 80.60 | 18.57 | 0.09 | 0.28 | 0.46 | 100 |
| rGO thin-film (15 V) | 84.32 | 15.06 | 0.07 | 0.20 | 0.35 | 100 |
| rGO thin-film (20 V) | 75.21 | 24.02 | 0.08 | 0.22 | 0.47 | 100 |
| rGO thin-film (25 V) | 73.17 | 26.19 | 0.07 | 0.25 | 0.32 | 100 |
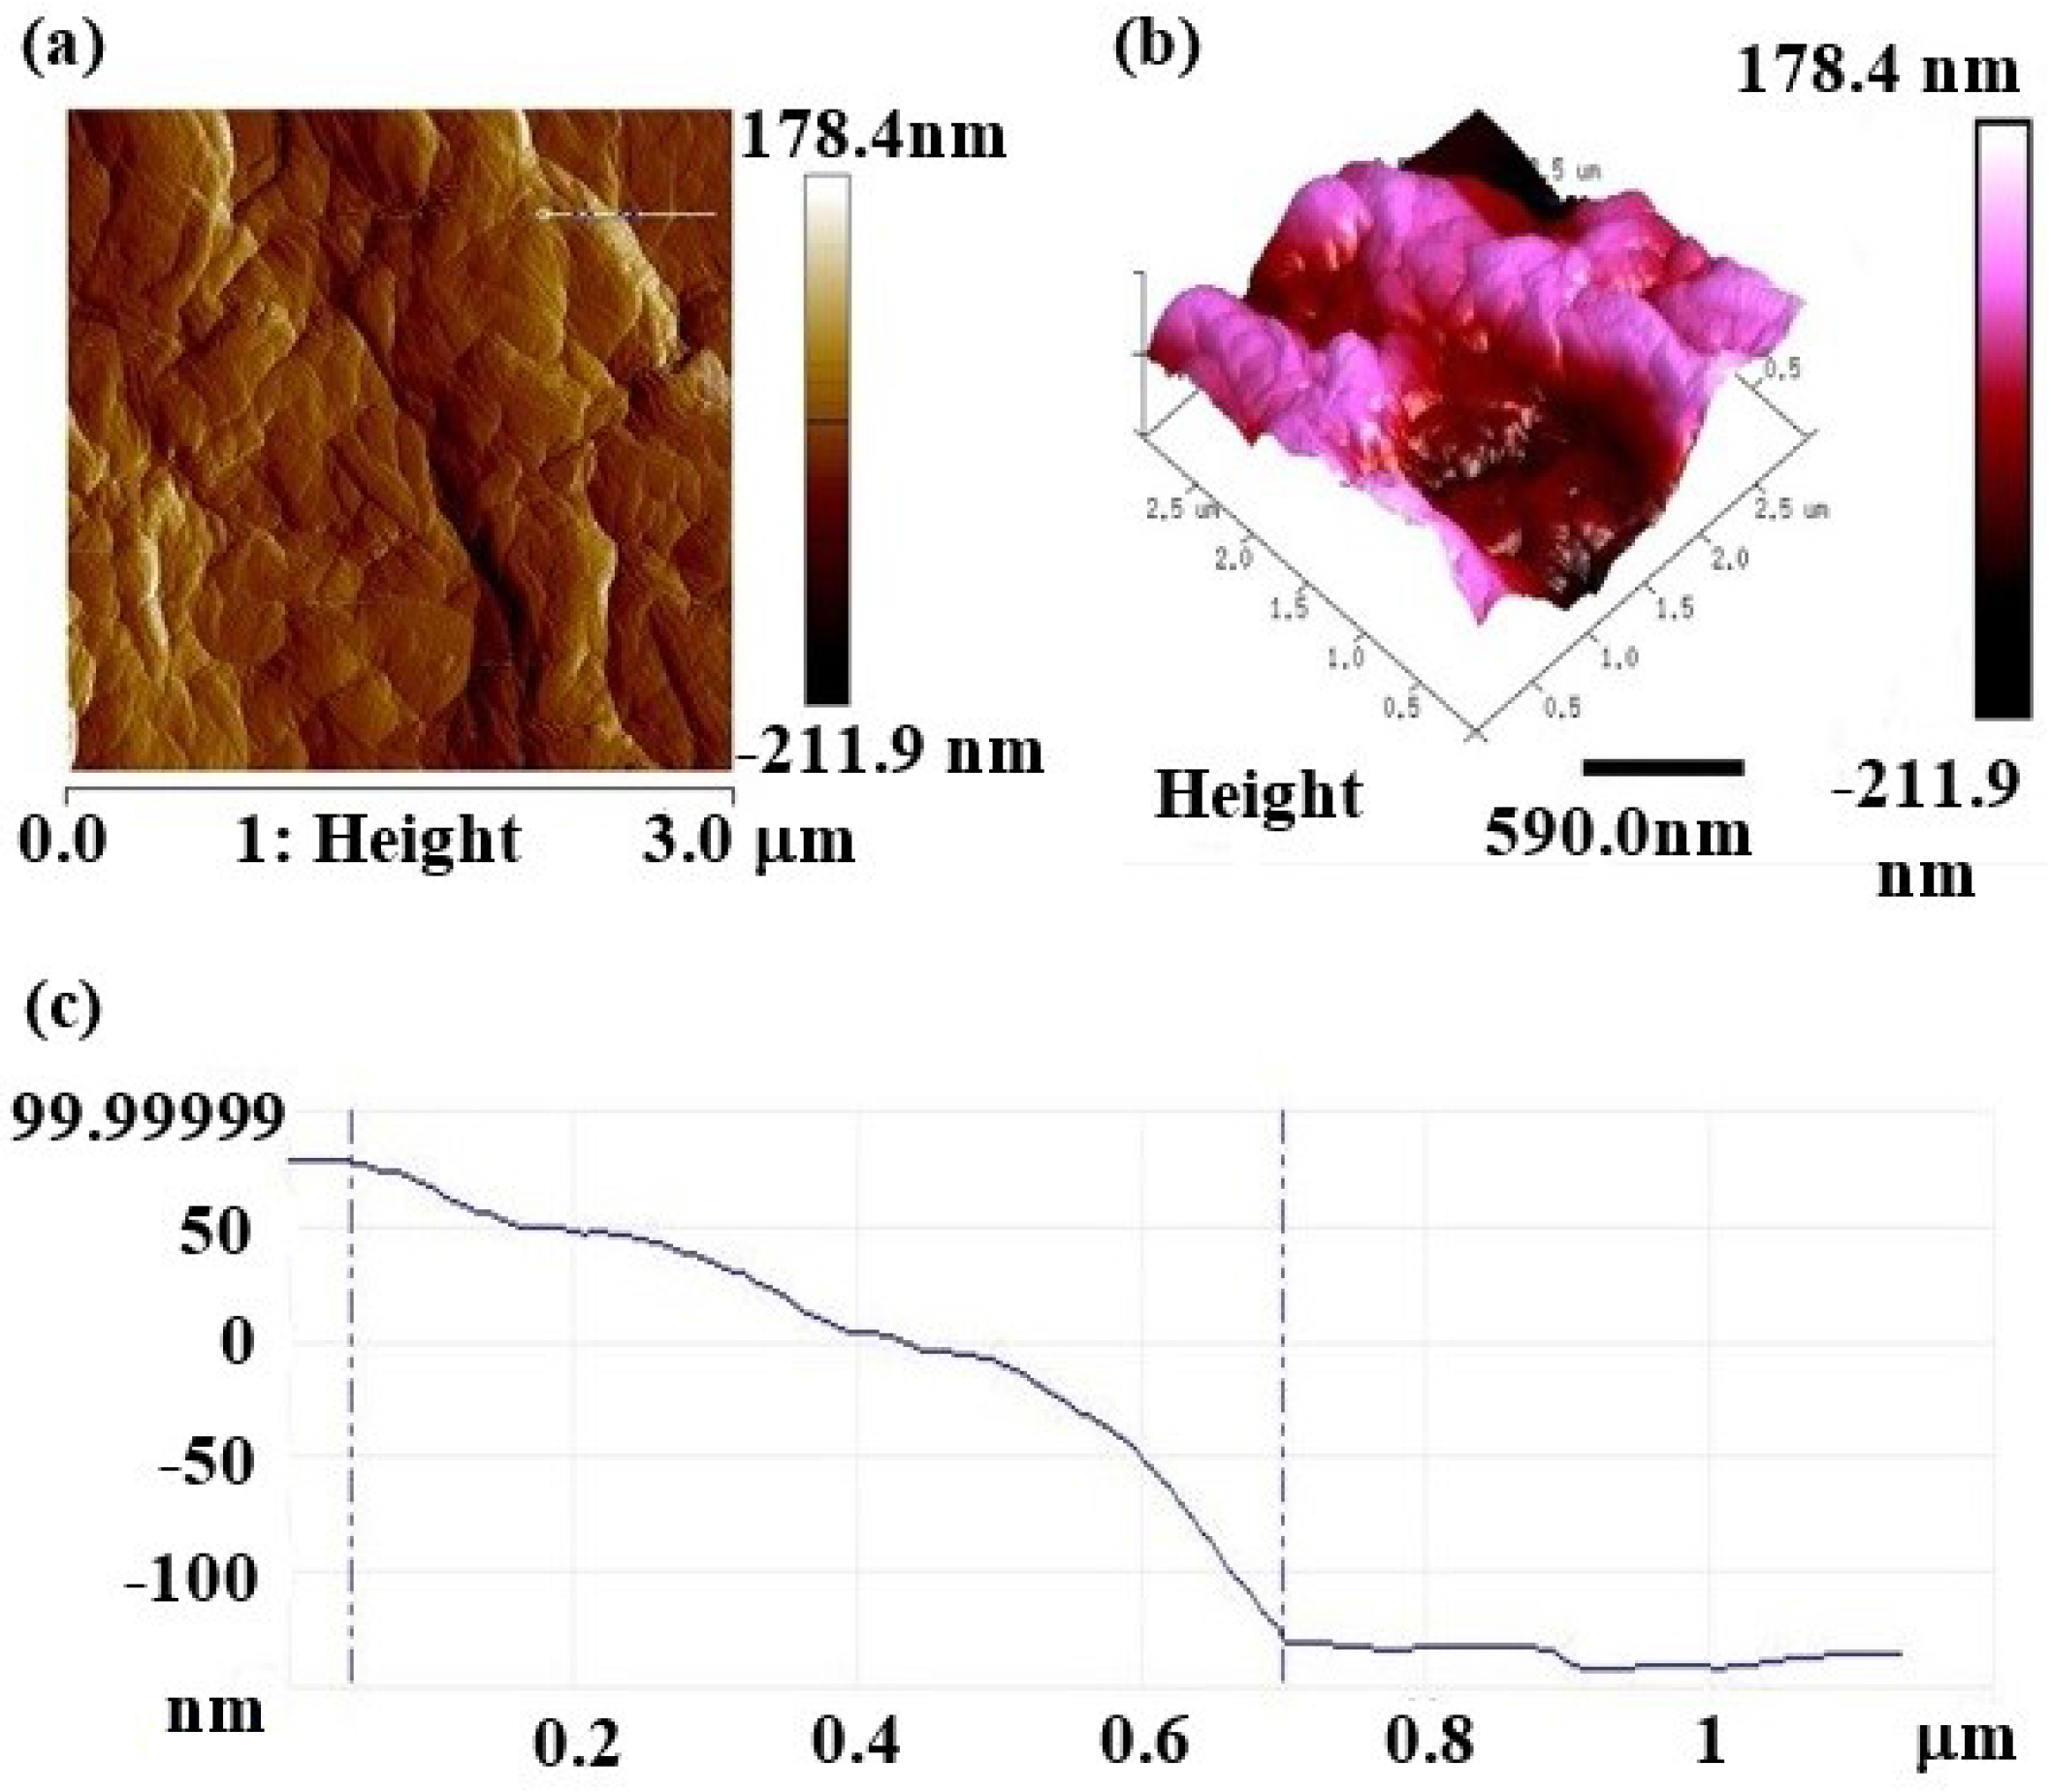
| Sample | Roughness Parameters | ||
|---|---|---|---|
| Thickness (Mean), nm | Roughness (Rmax), nm | Surface Roughness (Ra), nm | |
| rGO thin-film (5 V) | 178.2 | 19.021 | 10.23 |
| rGO thin-film (10 V) | 189.3 | 19.876 | 11.78 |
| rGO thin-film (15 V) | 207.8 | 21.095 | 12.11 |
| rGO thin-film (20 V) | 224.7 | 24.571 | 12.54 |
| rGO thin-film (25 V) | 256.8 | 28.922 | 13.42 |


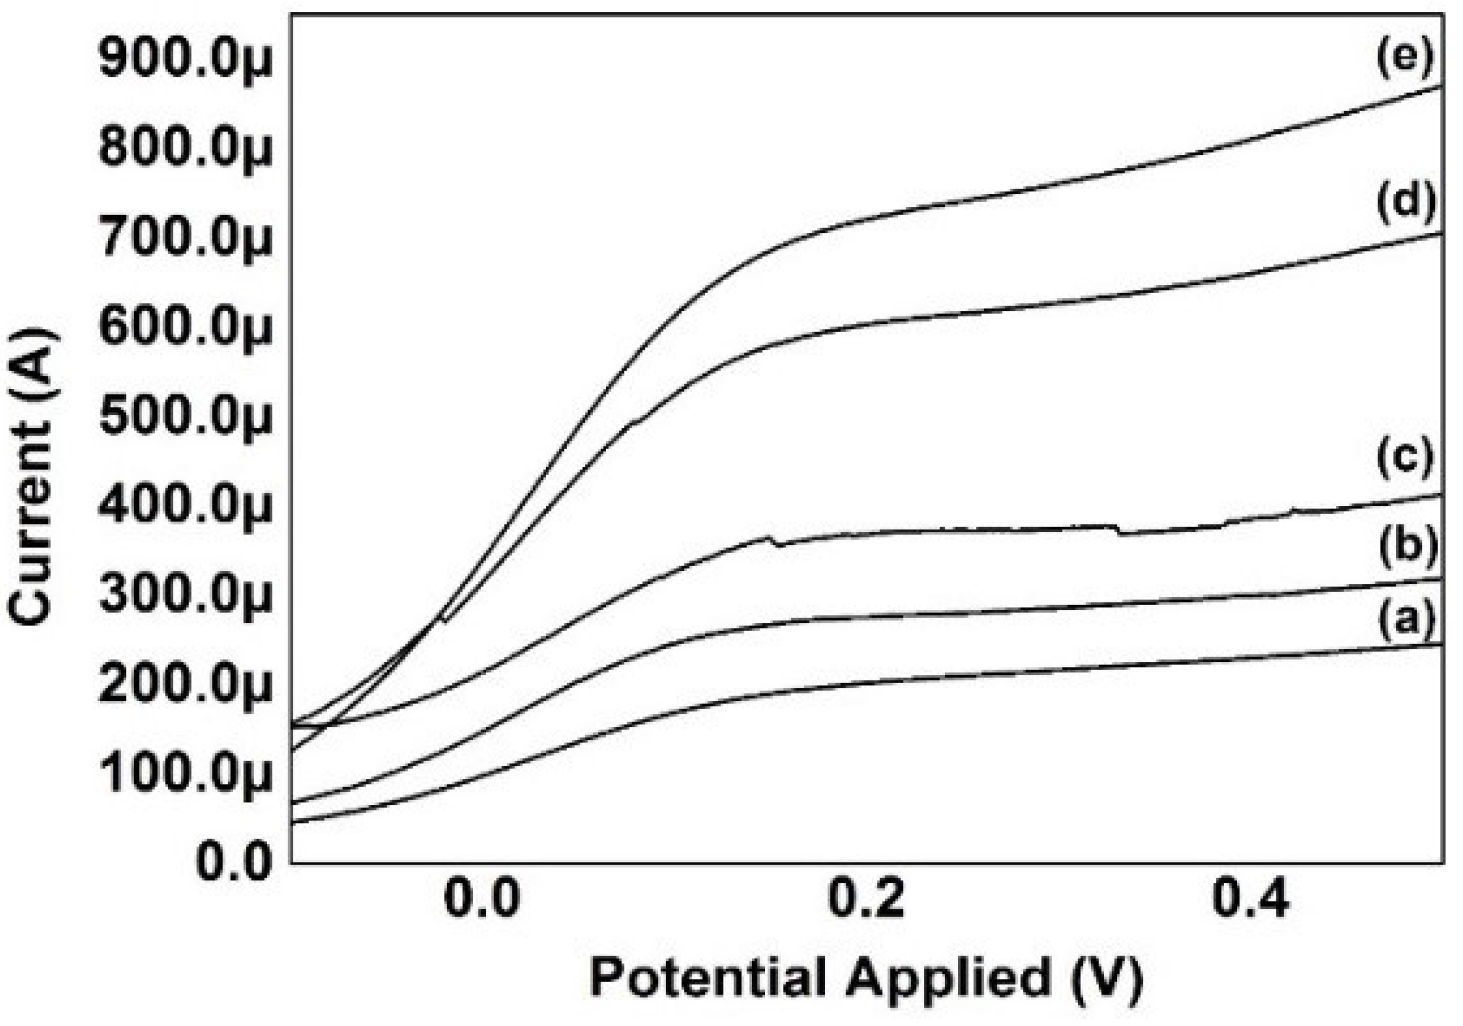
| Materials | Voltage (V) | Current (μA) | Resistance (Ω) | Conductance (μ Ω−1) |
|---|---|---|---|---|
| rGO thin-film (5 V) | 0.5 | 413 | 1210.7 | 826.0 |
| rGO thin-film (10 V) | 0.5 | 705 | 709.2 | 1410.0 |
| rGO thin-film (15 V) | 0.5 | 869 | 575.4 | 1737.9 |
| rGO thin-film (20 V) | 0.5 | 318 | 1572.3 | 636.0 |
| rGO thin-film (25 V) | 0.5 | 245 | 2040.8 | 490.0 |

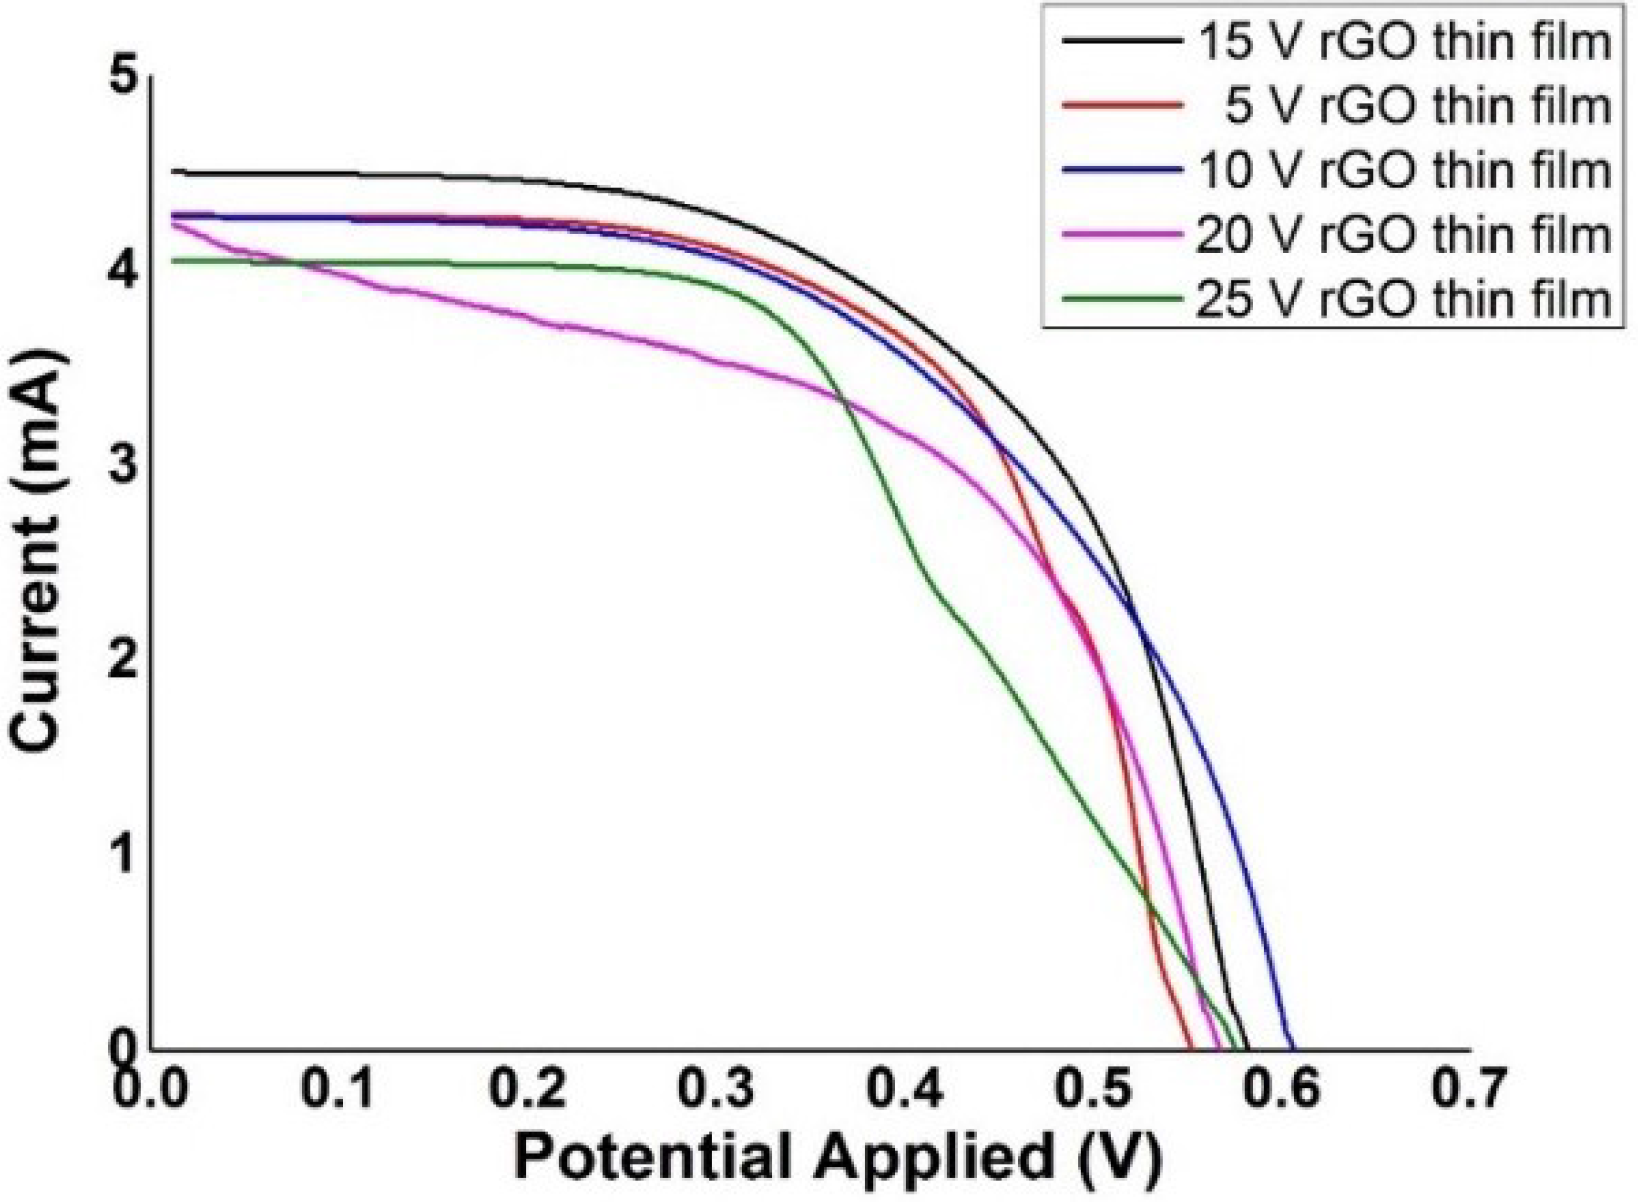
| Electrochemical Reduction Applied Voltage, (V) | Open-Circuit Voltage, VOC (V) | Short-Circuit Current, ISC (A) | Maximum Voltage, Vmax (V) | Maximum Current, Imax (A) | Fill Factor, FF | Efficiency, η (%) |
|---|---|---|---|---|---|---|
| 5 | 0.553 | 4.29 | 0.46 | 2.81 | 0.5449 | 1.2927 |
| 10 | 0.607 | 4.28 | 0.48 | 2.78 | 0.5136 | 1.3413 |
| 15 | 0.583 | 4.51 | 0.41 | 3.71 | 0.5785 | 1.5211 |
| 20 | 0.568 | 4.24 | 0.48 | 2.39 | 0.4763 | 1.1471 |
| 25 | 0.576 | 4.05 | 0.38 | 3.01 | 0.4903 | 1.1438 |
4. Conclusions
Acknowledgments
Author Contributions
Conflicts of Interest
References
- Rathjens, G.W. Energy and climatic change. In Preserving the Global Environment; WW Norton and Company: New York, NY, USA, 1991; pp. 154–186. [Google Scholar]
- Grätzel, M. Photoelectrochemical cells. Nature 2001, 414, 338–344. [Google Scholar] [CrossRef] [PubMed]
- Grätzel, M. Solar energy conversion by dye-sensitized photovoltaic cells. Inorg. Chem. 2005, 44, 6841–6851. [Google Scholar] [CrossRef] [PubMed]
- Grätzel, M. Recent advances in sensitized mesoscopic solar cells. Acc. Chem. Res. 2009, 42, 1788–1798. [Google Scholar] [CrossRef] [PubMed]
- Grätzel, M. Dye-sensitized solar cells. J. Photochem. Photobiol. C Photochem. Rev. 2003, 4, 145–153. [Google Scholar] [CrossRef]
- Hagfeldt, A.; Boschloo, G.; Sun, L.; Kloo, L.; Pettersson, H. Dye-sensitized solar cells. Chem. Rev. 2010, 110, 6595–6663. [Google Scholar] [CrossRef] [PubMed]
- Kalyanasundaram, K. Dye-Sensitized Solar Cells; EPFL Press: Lausanne, Switzerland, 2010. [Google Scholar]
- Wei, D. Dye sensitized solar cells. Int. J. Mol. Sci. 2010, 11, 1103–1113. [Google Scholar] [CrossRef] [PubMed]
- Nazeeruddin, M.K.; Kay, A.; Rodicio, I.; Humphry-Baker, R.; Müller, E.; Liska, P.; Vlachopoulos, N.; Grätzel, M. Conversion of light to electricity by cis-X2bis (2,2′-bipyridyl-4,4′-dicarboxylate) ruthenium (II) charge-transfer sensitizers (X = Cl-, Br-, I-, CN-, and SCN-) on nanocrystalline titanium dioxide electrodes. J. Am. Chem. Soc. 1993, 115, 6382–6390. [Google Scholar] [CrossRef]
- O’regan, B.; Grätzel, M. A low-cost, high-efficiency solar cell based on dye-sensitized colloidal TiO2 films. Nature 1991, 353, 737–740. [Google Scholar] [CrossRef]
- Choi, H.; Kim, H.; Hwang, S.; Han, Y.; Jeon, M. Graphene counter electrodes for dye-sensitized solar cells prepared by electrophoretic deposition. J. Mater. Chem. 2011, 21, 7548–7551. [Google Scholar] [CrossRef]
- Zhang, D.; Li, X.; Li, H.; Chen, S.; Sun, Z.; Yin, X.; Huang, S. Graphene-based counter electrode for dye-sensitized solar cells. Carbon 2011, 49, 5382–5388. [Google Scholar] [CrossRef]
- Dreyer, D.R.; Park, S.; Bielawski, C.W.; Ruoff, R.S. The chemistry of graphene oxide. Chem. Soc. Rev. 2010, 39, 228–240. [Google Scholar] [CrossRef] [PubMed]
- Shin, H.J.; Kim, K.K.; Benayad, A.; Yoon, S.M.; Park, H.K.; Jung, I.S.; Jin, M.H.; Jeong, H.K.; Kim, J.M.; Choi, J.Y. Efficient reduction of graphite oxide by sodium borohydride and its effect on electrical conductance. Adv. Funct. Mater. 2009, 19, 1987–1992. [Google Scholar] [CrossRef]
- Zhou, M.; Wang, Y.; Zhai, Y.; Zhai, J.; Ren, W.; Wang, F.; Dong, S. Controlled synthesis of large-area and patterned electrochemically reduced graphene oxide films. Chem. A Eur. J. 2009, 15, 6116–6120. [Google Scholar] [CrossRef] [PubMed]
- Wang, Z.; Zhou, X.; Zhang, J.; Boey, F.; Zhang, H. Direct electrochemical reduction of single-layer graphene oxide and subsequent functionalization with glucose oxidase. J. Phys. Chem. C 2009, 113, 14071–14075. [Google Scholar] [CrossRef]
- An, S.J.; Zhu, Y.; Lee, S.H.; Stoller, M.D.; Emilsson, T.; Park, S.; Velamakanni, A.; An, J.; Ruoff, R.S. Thin film fabrication and simultaneous anodic reduction of deposited graphene oxide platelets by electrophoretic deposition. J. Phys. Chem. Lett. 2010, 1, 1259–1263. [Google Scholar] [CrossRef]
- Ramesha, G.K.; Sampath, S. Electrochemical reduction of oriented graphene oxide films: An in situ raman spectroelectrochemical study. J. Phys. Chem. C 2009, 113, 7985–7989. [Google Scholar] [CrossRef]
- Chong, S.W.; Lai, C.W.; Hamid, S.B.A. Green preparation of reduced graphene oxide using a natural reducing agent. Ceram. Int. 2015, 41, 9505–9513. [Google Scholar] [CrossRef]
- Chen, J.; Yao, B.; Li, C.; Shi, G. An improved hummers method for eco-friendly synthesis of graphene oxide. Carbon 2013, 64, 225–229. [Google Scholar] [CrossRef]
- Koh, Y.K.; Bae, M.-H.; Cahill, D.G.; Pop, E. Reliably counting atomic planes of few-layer graphene (n > 4). ACS Nano 2010, 5, 269–274. [Google Scholar] [CrossRef] [PubMed]
- Chang, D.W.; Choi, H.-J.; Filer, A.; Baek, J.-B. Graphene in photovoltaic applications: Organic photovoltaic cells (OPVs) and dye-sensitized solar cells (DSSCs). J. Mater. Chem. A 2014, 2, 12136–12149. [Google Scholar] [CrossRef]
- Chen, J.P.; Wu, S.; Chong, K.-H. Surface modification of a granular activated carbon by citric acid for enhancement of copper adsorption. Carbon 2003, 41, 1979–1986. [Google Scholar] [CrossRef]
- Guo, Y.; Wu, B.; Liu, H.; Ma, Y.; Yang, Y.; Zheng, J.; Yu, G.; Liu, Y. Electrical assembly and reduction of graphene oxide in a single solution step for use in flexible sensors. Adv. Mater. 2011, 23, 4626–4630. [Google Scholar] [CrossRef] [PubMed]
- Teoh, H.; Tao, Y.; Tok, E.; Ho, G.; Sow, C. Electrical current mediated interconversion between graphene oxide to reduced grapene oxide. Appl. Phys. Lett. 2011, 98, 173105. [Google Scholar] [CrossRef]
- Yao, Y.; Chen, X.; Zhu, J.; Zeng, B.; Wu, Z.; Li, X. The effect of ambient humidity on the electrical properties of graphene oxide films. Nanoscale Res. Lett. 2012, 7, 1–7. [Google Scholar] [CrossRef] [PubMed]
- Loryuenyong, V.; Totepvimarn, K.; Eimburanapravat, P.; Boonchompoo, W.; Buasri, A. Preparation and characterization of reduced graphene oxide sheets via water-based exfoliation and reduction methods. Adv. Mater. Sci. Eng. 2013, 2013, 923403. [Google Scholar] [CrossRef]
- Alsharaeh, E.H.; Othman, A.A.; Aldosari, M.A. Microwave irradiation effect on the dispersion and thermal stability of RGO nanosheets within a polystyrene matrix. Materials 2014, 7, 5212–5224. [Google Scholar] [CrossRef]
- Gensheimer, J.; Broaddus, J.; Lin, Y.-C.; Cao, Y. Scalable production of reduced graphene oxide (rGO) from graphite oxide (GO). 2014. Available online: https://www.youngscientistjournal.org/article/scalable-production-of-reduced-graphene-oxide-rgo-from-graphite-oxide-go (accessed on 22 January 2016).
- Thakur, S.; Karak, N. Green reduction of graphene oxide by aqueous phytoextracts. Carbon 2012, 50, 5331–5339. [Google Scholar] [CrossRef]
- Liao, K.-H.; Mittal, A.; Bose, S.; Leighton, C.; Mkhoyan, K.A.; Macosko, C.W. Aqueous only route toward graphene from graphite oxide. ACS Nano 2011, 5, 1253–1258. [Google Scholar] [CrossRef] [PubMed]
- Fernandez-Merino, M.; Guardia, L.; Paredes, J.; Villar-Rodil, S.; Solis-Fernandez, P.; Martinez-Alonso, A.; Tascon, J. Vitamin C is an ideal substitute for hydrazine in the reduction of graphene oxide suspensions. J. Phys. Chem. C 2010, 114, 6426–6432. [Google Scholar] [CrossRef]
- Pei, S.; Cheng, H.-M. The reduction of graphene oxide. Carbon 2012, 50, 3210–3228. [Google Scholar] [CrossRef]
- Shao, Y.; Wang, J.; Engelhard, M.; Wang, C.; Lin, Y. Facile and controllable electrochemical reduction of graphene oxide and its applications. J. Mater. Chem. 2010, 20, 743–748. [Google Scholar] [CrossRef]
- Lin, T.; Tang, Y.; Wang, Y.; Bi, H.; Liu, Z.; Huang, F.; Xie, X.; Jiang, M. Scotch-tape-like exfoliation of graphite assisted with elemental sulfur and graphene–sulfur composites for high-performance lithium-sulfur batteries. Energy Environ. Sci. 2013, 6, 1283–1290. [Google Scholar] [CrossRef]
- Lizzit, S.; Larciprete, R.; Lacovig, P.; Dalmiglio, M.; Orlando, F.; Baraldi, A.; Gammelgaard, L.; Barreto, L.; Bianchi, M.; Perkins, E. Transfer-free electrical insulation of epitaxial graphene from its metal substrate. Nano Lett. 2012, 12, 4503–4507. [Google Scholar] [CrossRef] [PubMed]
- Srinivasan, C.; Saraswathi, R. Growing high-quality graphene from incredible solid materials. Curr. Sci. India 2012, 102, 17–18. [Google Scholar]
- Chen, Y.; Zhuang, Q.; Liu, X.; Liu, J.; Lin, S.; Han, Z. Preparation of thermostable PBO/graphene nanocomposites with high dielectric constant. Nanotechnology 2013, 24, 245702. [Google Scholar] [CrossRef] [PubMed]
- Li, D.; Mueller, M.B.; Gilje, S.; Kaner, R.B.; Wallace, G.G. Processable aqueous dispersions of graphene nanosheets. Nat. Nanotechnol. 2008, 3, 101–105. [Google Scholar] [CrossRef] [PubMed]
- Gardiner, D.J. Introduction to raman scattering. In Practical Raman Spectroscopy; Springer: Berlin/Heidelberg, Germany, 1989; pp. 1–12. [Google Scholar]
- Saito, R.; Hofmann, M.; Dresselhaus, G.; Jorio, A.; Dresselhaus, M. Raman spectroscopy of graphene and carbon nanotubes. Adv. Phys. 2011, 60, 413–550. [Google Scholar] [CrossRef]
- Childres, I.; Jauregui, L.A.; Park, W.; Cao, H.; Chen, Y.P. Raman spectroscopy of graphene and related materials. Dev. Photon Mater. Res. 2013. Available online: https://www.physics.purdue.edu/quantum/files/Raman_Spectroscopy_of_Graphene_NOVA_Childres.pdf (accessed on 22 January 2016). [Google Scholar]
- Thomsen, C.; Reich, S. Double resonant raman scattering in graphite. Phys. Rev. Let. 2000, 85, 5214–5217. [Google Scholar] [CrossRef] [PubMed]
- Ferrari, A.; Meyer, J.; Scardaci, V.; Casiraghi, C.; Lazzeri, M.; Mauri, F.; Piscanec, S.; Jiang, D.; Novoselov, K.; Roth, S. Raman spectrum of graphene and graphene layers. Phys. Rev. Lett. 2006, 97, 187401. [Google Scholar] [CrossRef] [PubMed]
- Stankovich, S.; Dikin, D.A.; Piner, R.D.; Kohlhaas, K.A.; Kleinhammes, A.; Jia, Y.; Wu, Y.; Nguyen, S.T.; Ruoff, R.S. Synthesis of graphene-based nanosheets via chemical reduction of exfoliated graphite oxide. Carbon 2007, 45, 1558–1565. [Google Scholar] [CrossRef]
- Tuinstra, F.; Koenig, J.L. Raman spectrum of graphite. J. Chem. Phys. 1970, 53, 1126–1130. [Google Scholar] [CrossRef]
- Ferrari, A.C. Raman spectroscopy of graphene and graphite: Disorder, electron–phonon coupling, doping and nonadiabatic effects. Solid State Commun. 2007, 143, 47–57. [Google Scholar] [CrossRef]
© 2016 by the authors; licensee MDPI, Basel, Switzerland. This article is an open access article distributed under the terms and conditions of the Creative Commons by Attribution (CC-BY) license (http://creativecommons.org/licenses/by/4.0/).
Share and Cite
Chong, S.W.; Lai, C.W.; Abd Hamid, S.B. Controllable Electrochemical Synthesis of Reduced Graphene Oxide Thin-Film Constructed as Efficient Photoanode in Dye-Sensitized Solar Cells. Materials 2016, 9, 69. https://doi.org/10.3390/ma9020069
Chong SW, Lai CW, Abd Hamid SB. Controllable Electrochemical Synthesis of Reduced Graphene Oxide Thin-Film Constructed as Efficient Photoanode in Dye-Sensitized Solar Cells. Materials. 2016; 9(2):69. https://doi.org/10.3390/ma9020069
Chicago/Turabian StyleChong, Soon Weng, Chin Wei Lai, and Sharifah Bee Abd Hamid. 2016. "Controllable Electrochemical Synthesis of Reduced Graphene Oxide Thin-Film Constructed as Efficient Photoanode in Dye-Sensitized Solar Cells" Materials 9, no. 2: 69. https://doi.org/10.3390/ma9020069