3.1. Materials Characterisation
The samples were characterized with SEM, XRD and porosity measurements.
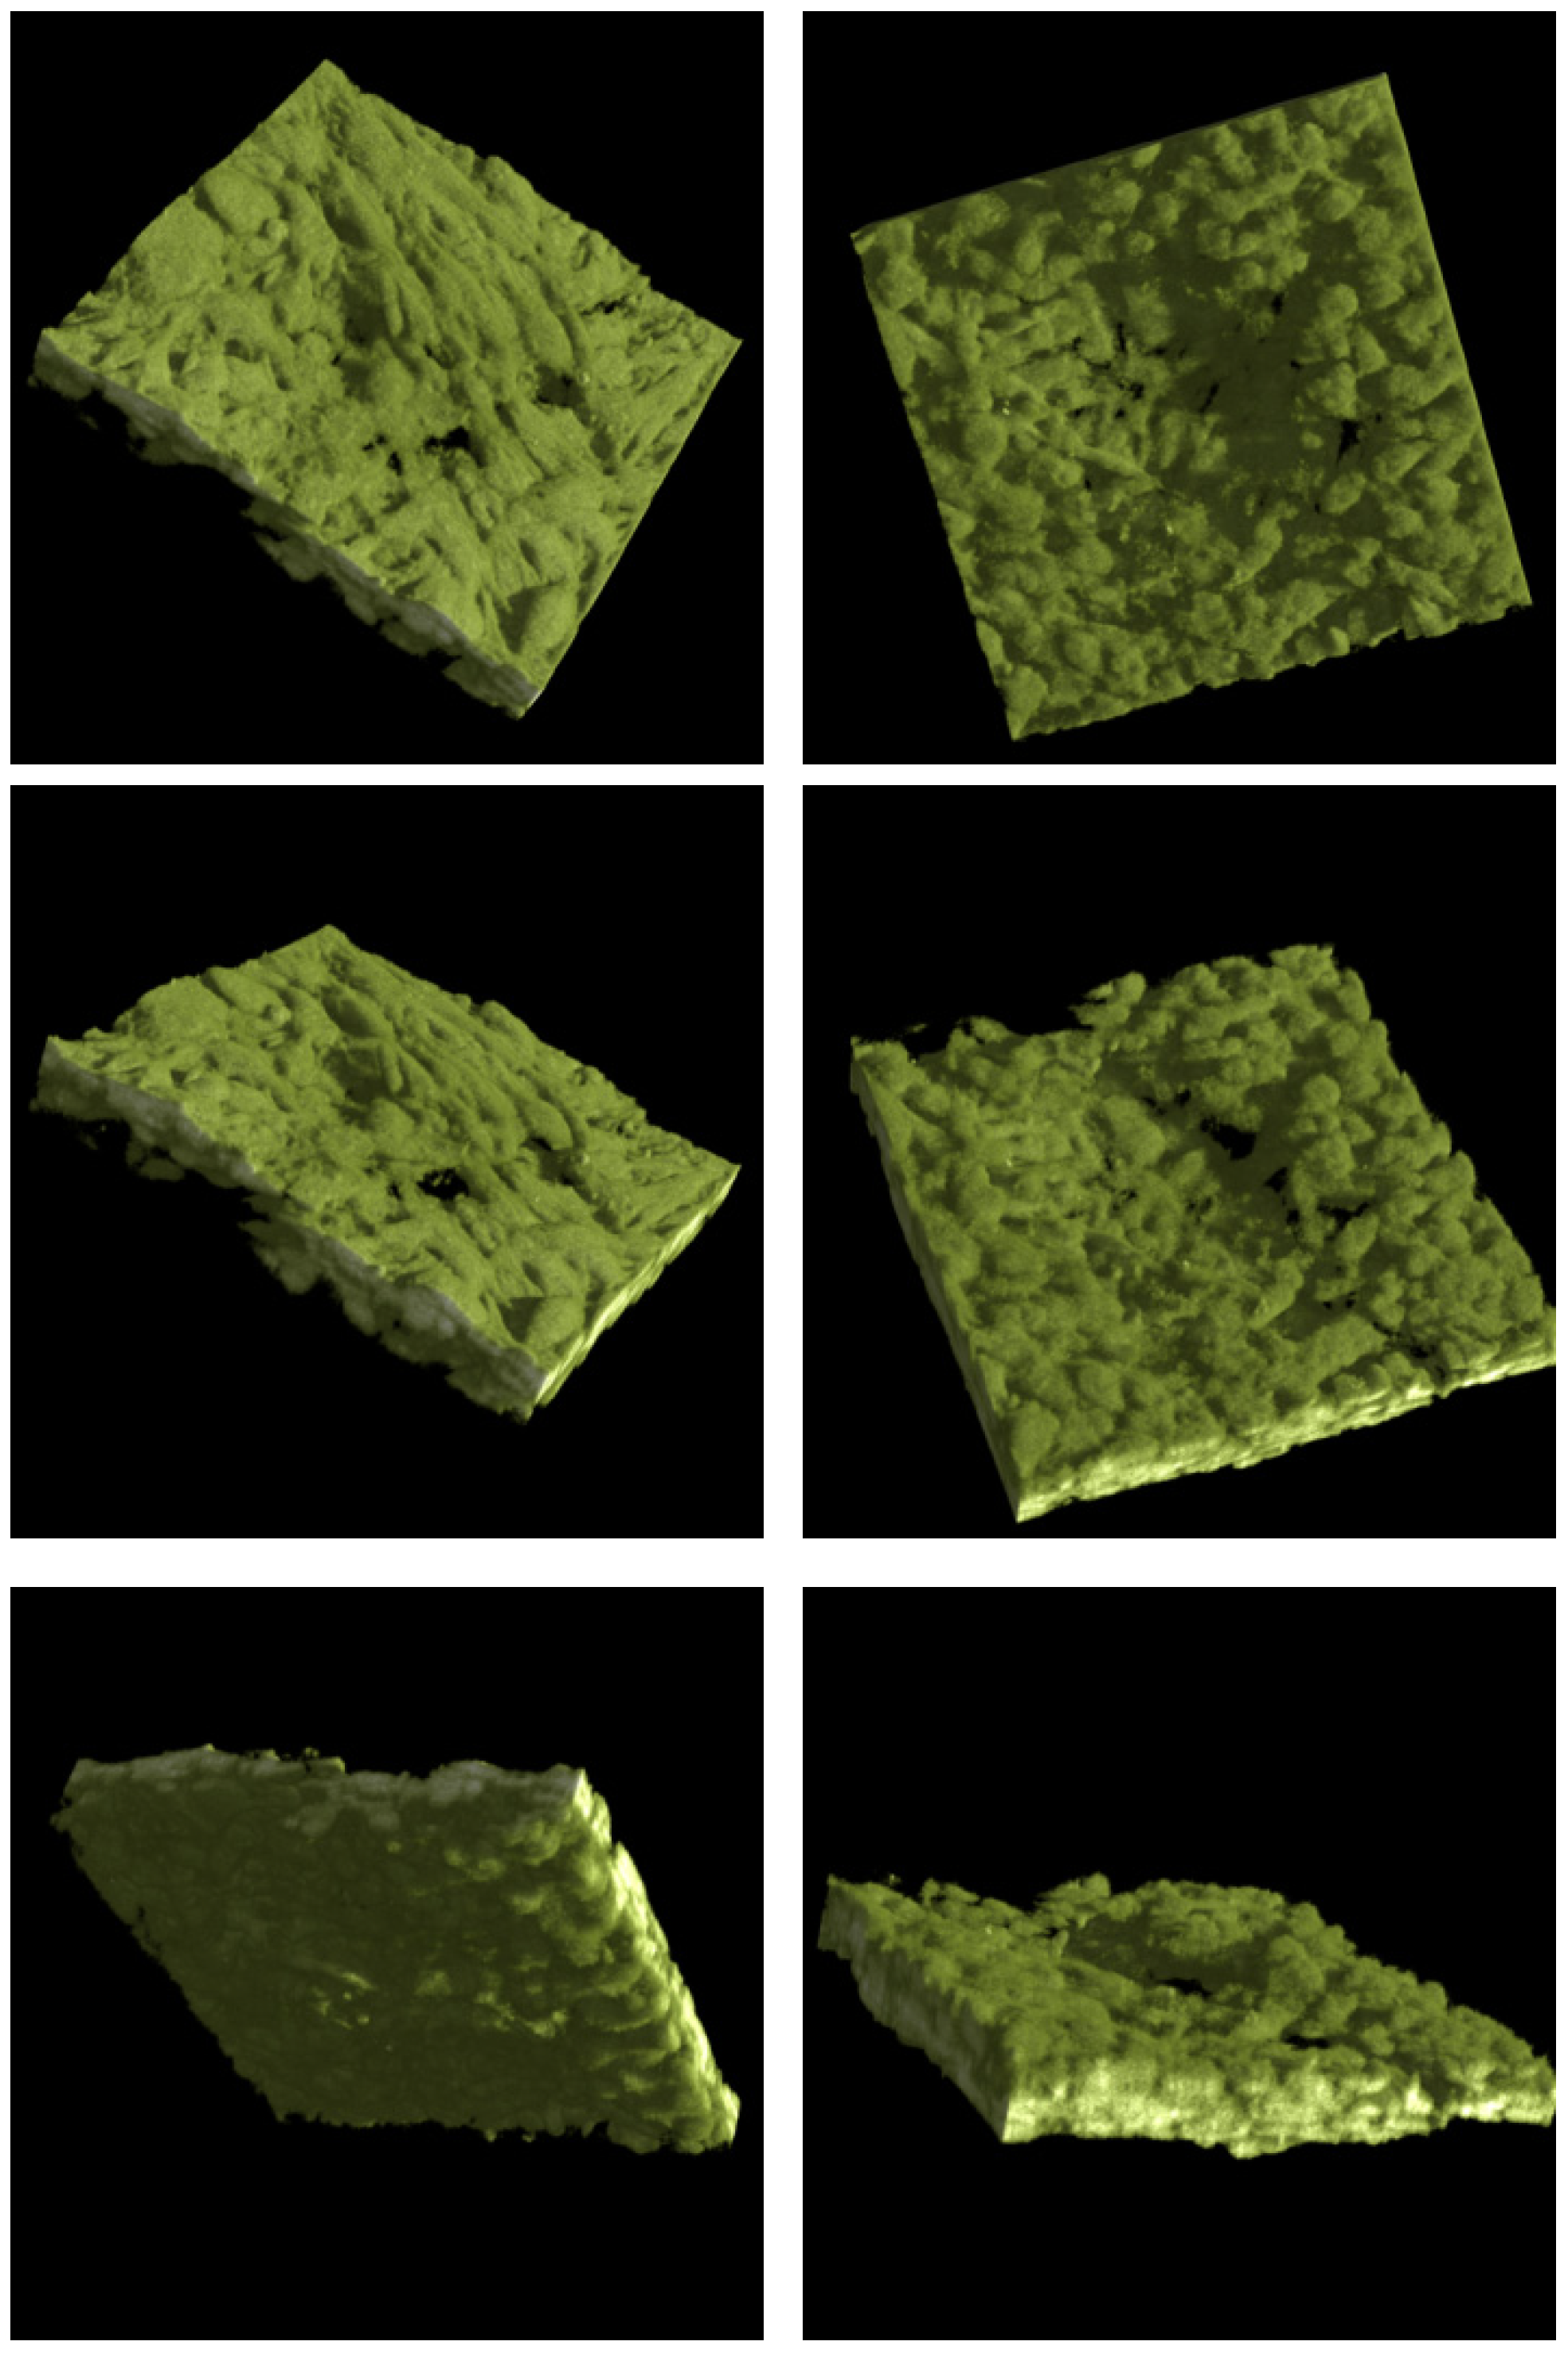
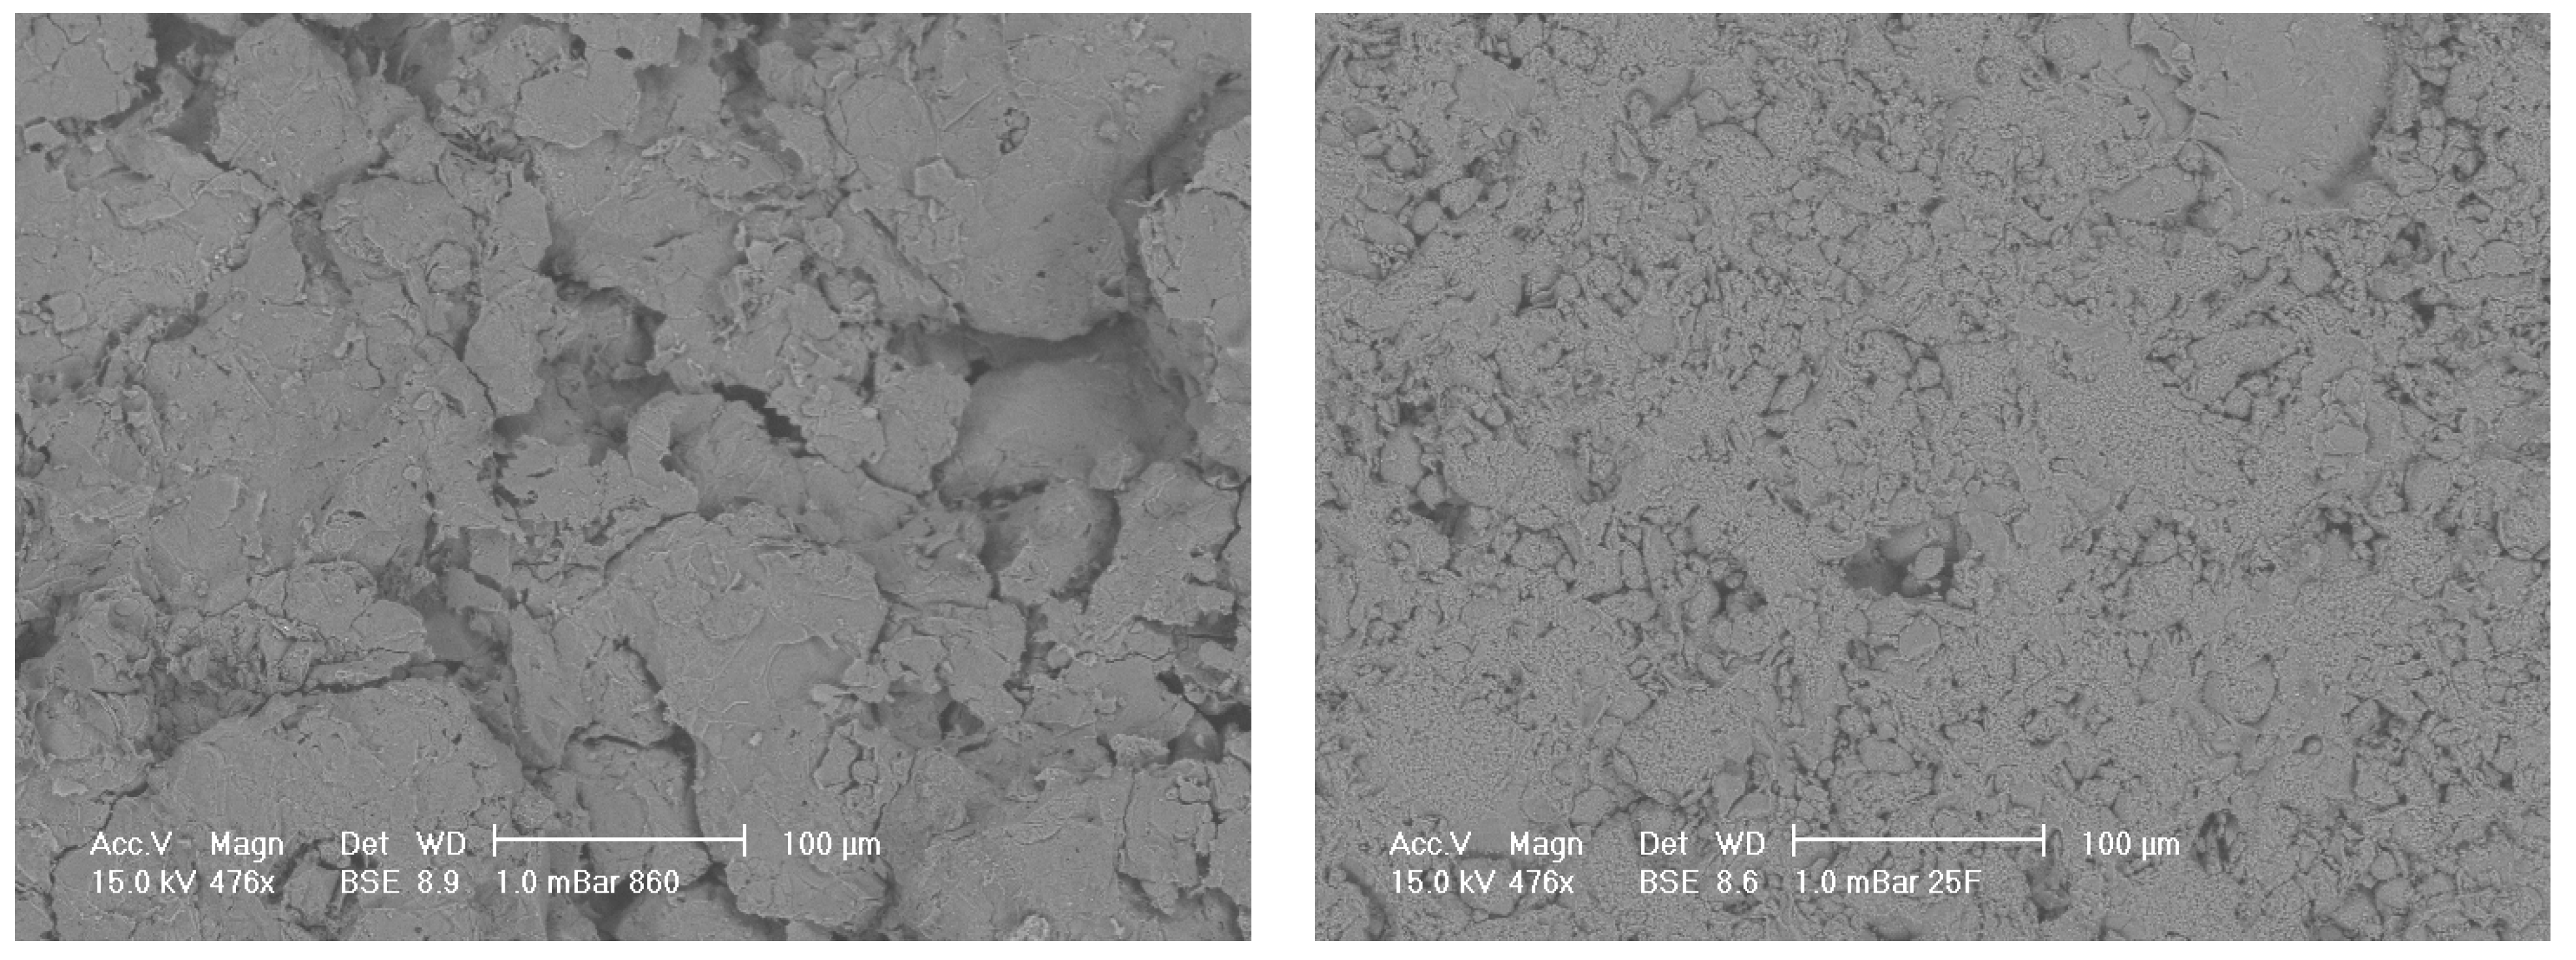
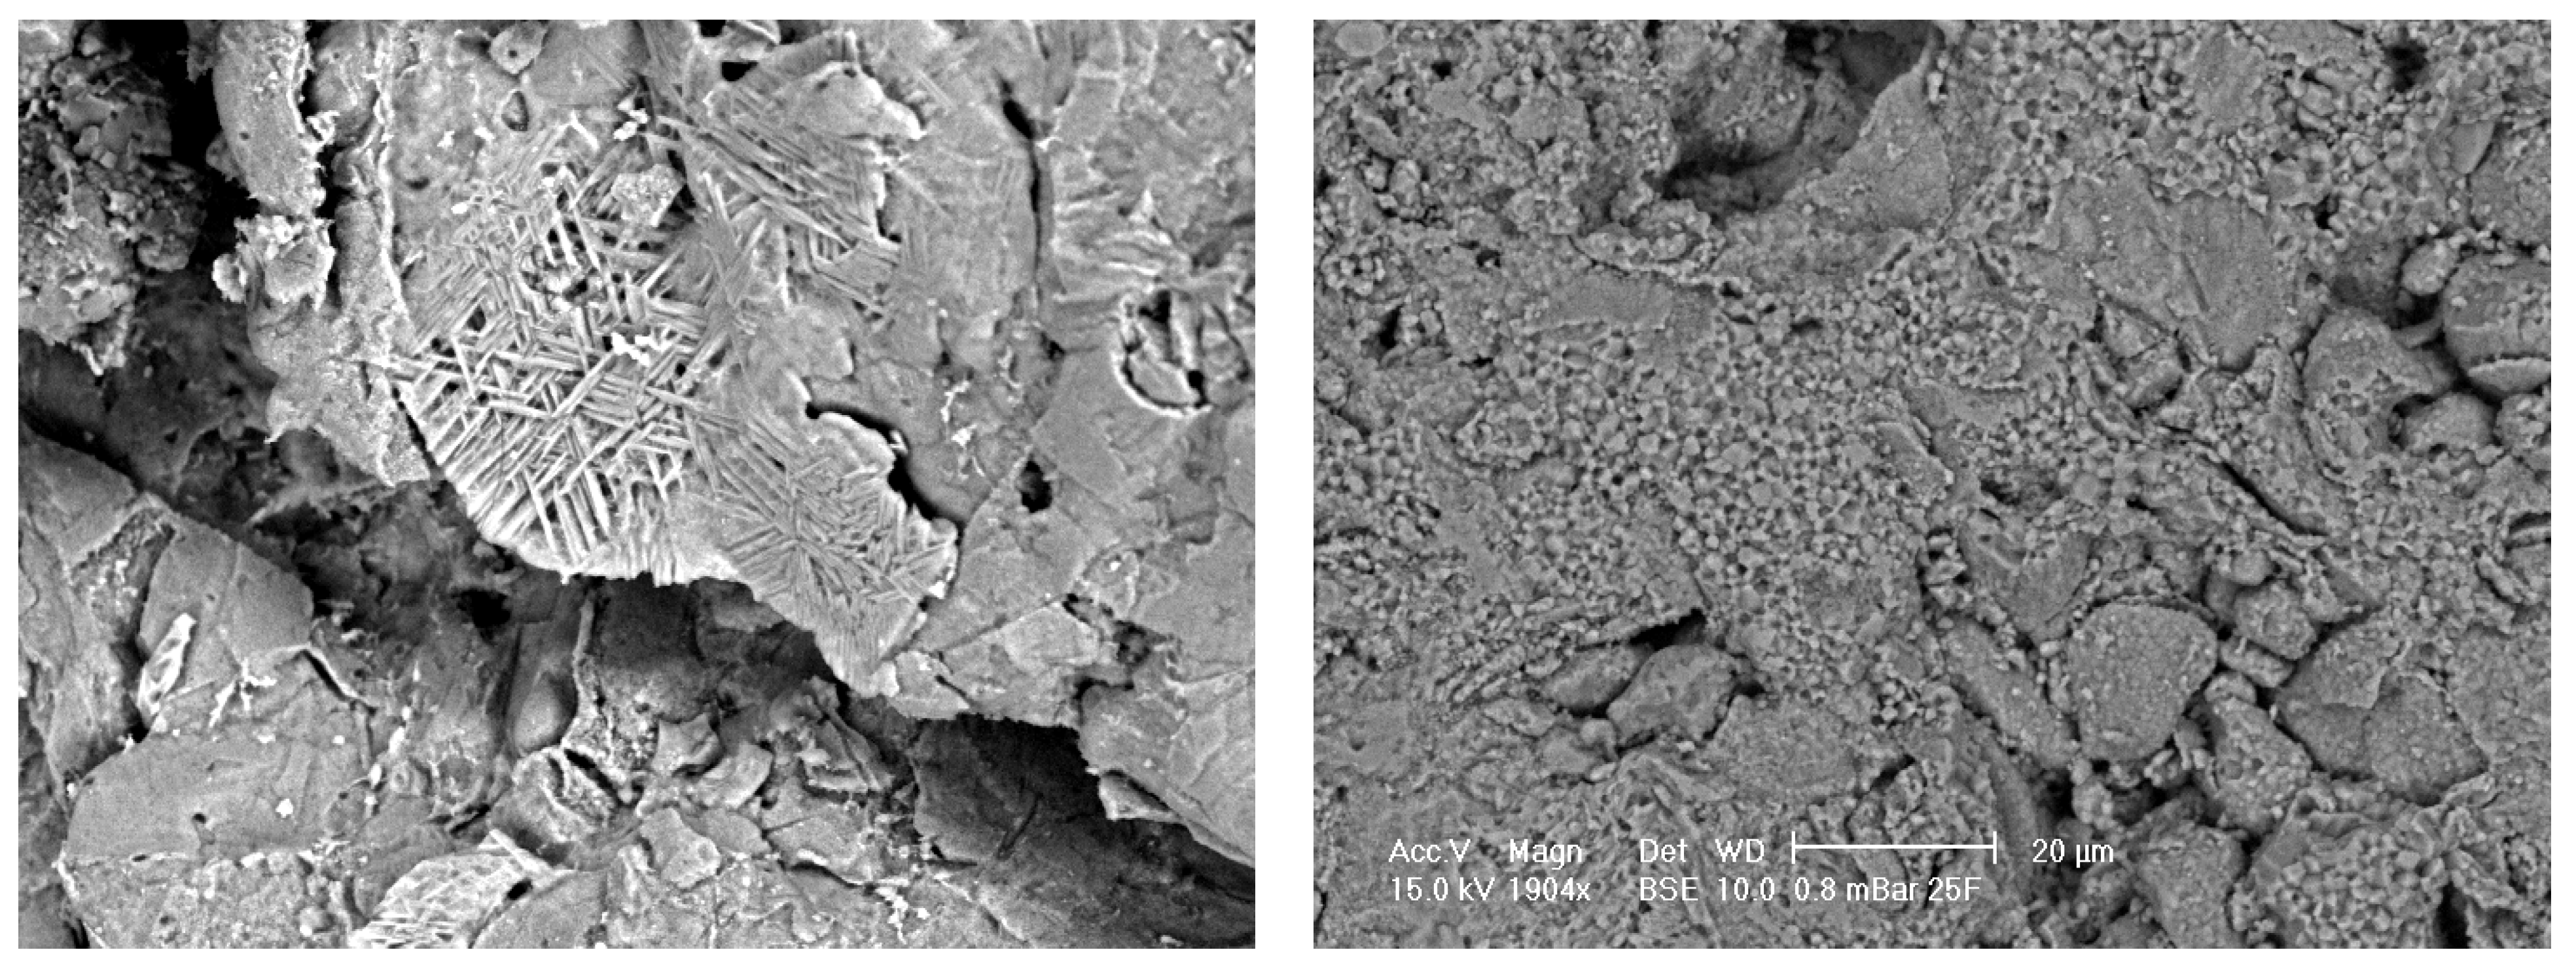
Figure 1 shows pellets of porous alumina after fabrication, without further treatment.
Figure 1 (left) shows Sample A which is a pellet of porous alumina prepared from 80 µm mesh alumina granulated powder mixed in a ratio of 60% carbon to granulated alumina.
Figure 1 (right) shows Sample B which is a pellet of less porous alumina prepared from 200 µm mesh alumina granulated powder mixed in a ratio of 5% carbon to granulated alumina with far less porosity after fabrication.
Figure 1.
(left) SEM micrograph of porous alumina samples before SBF treatment for sample A with original magnification of approximately 500X. Large porous regions are evident; (right) SEM micrograph of porous alumina samples before SBF treatment for Sample B with original magnification of approximately 500X. Small porous regions are evident.
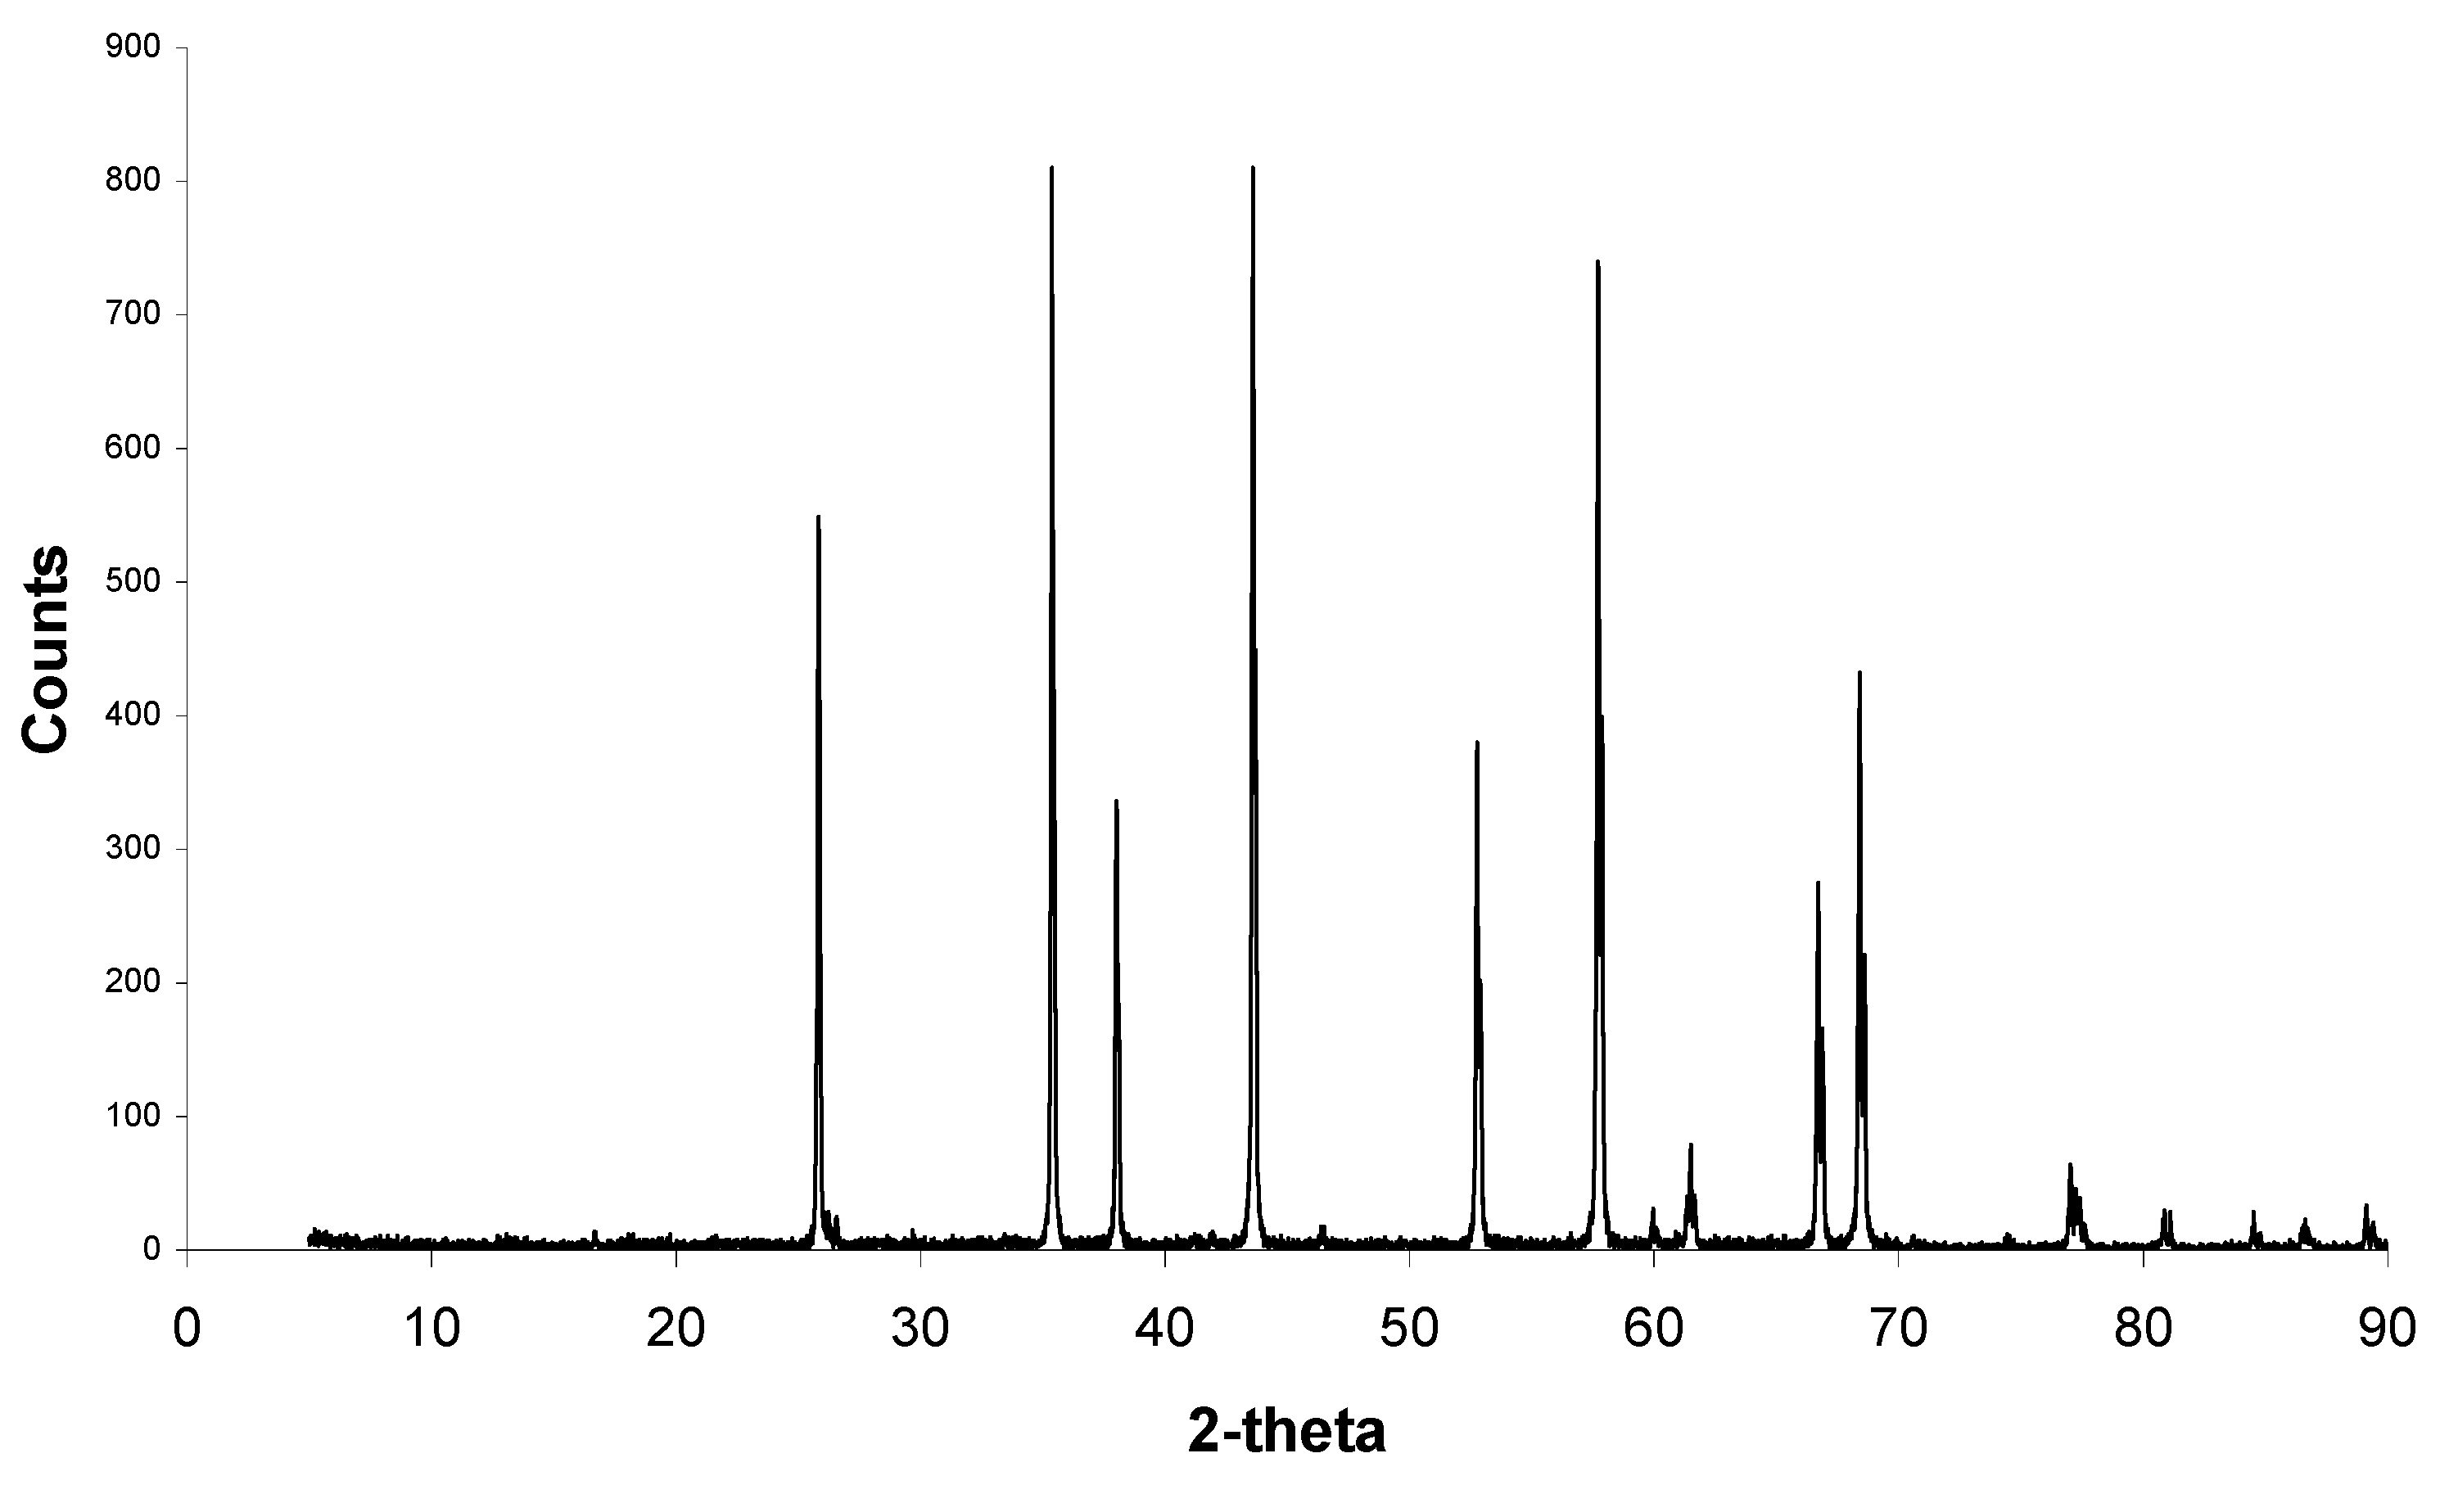
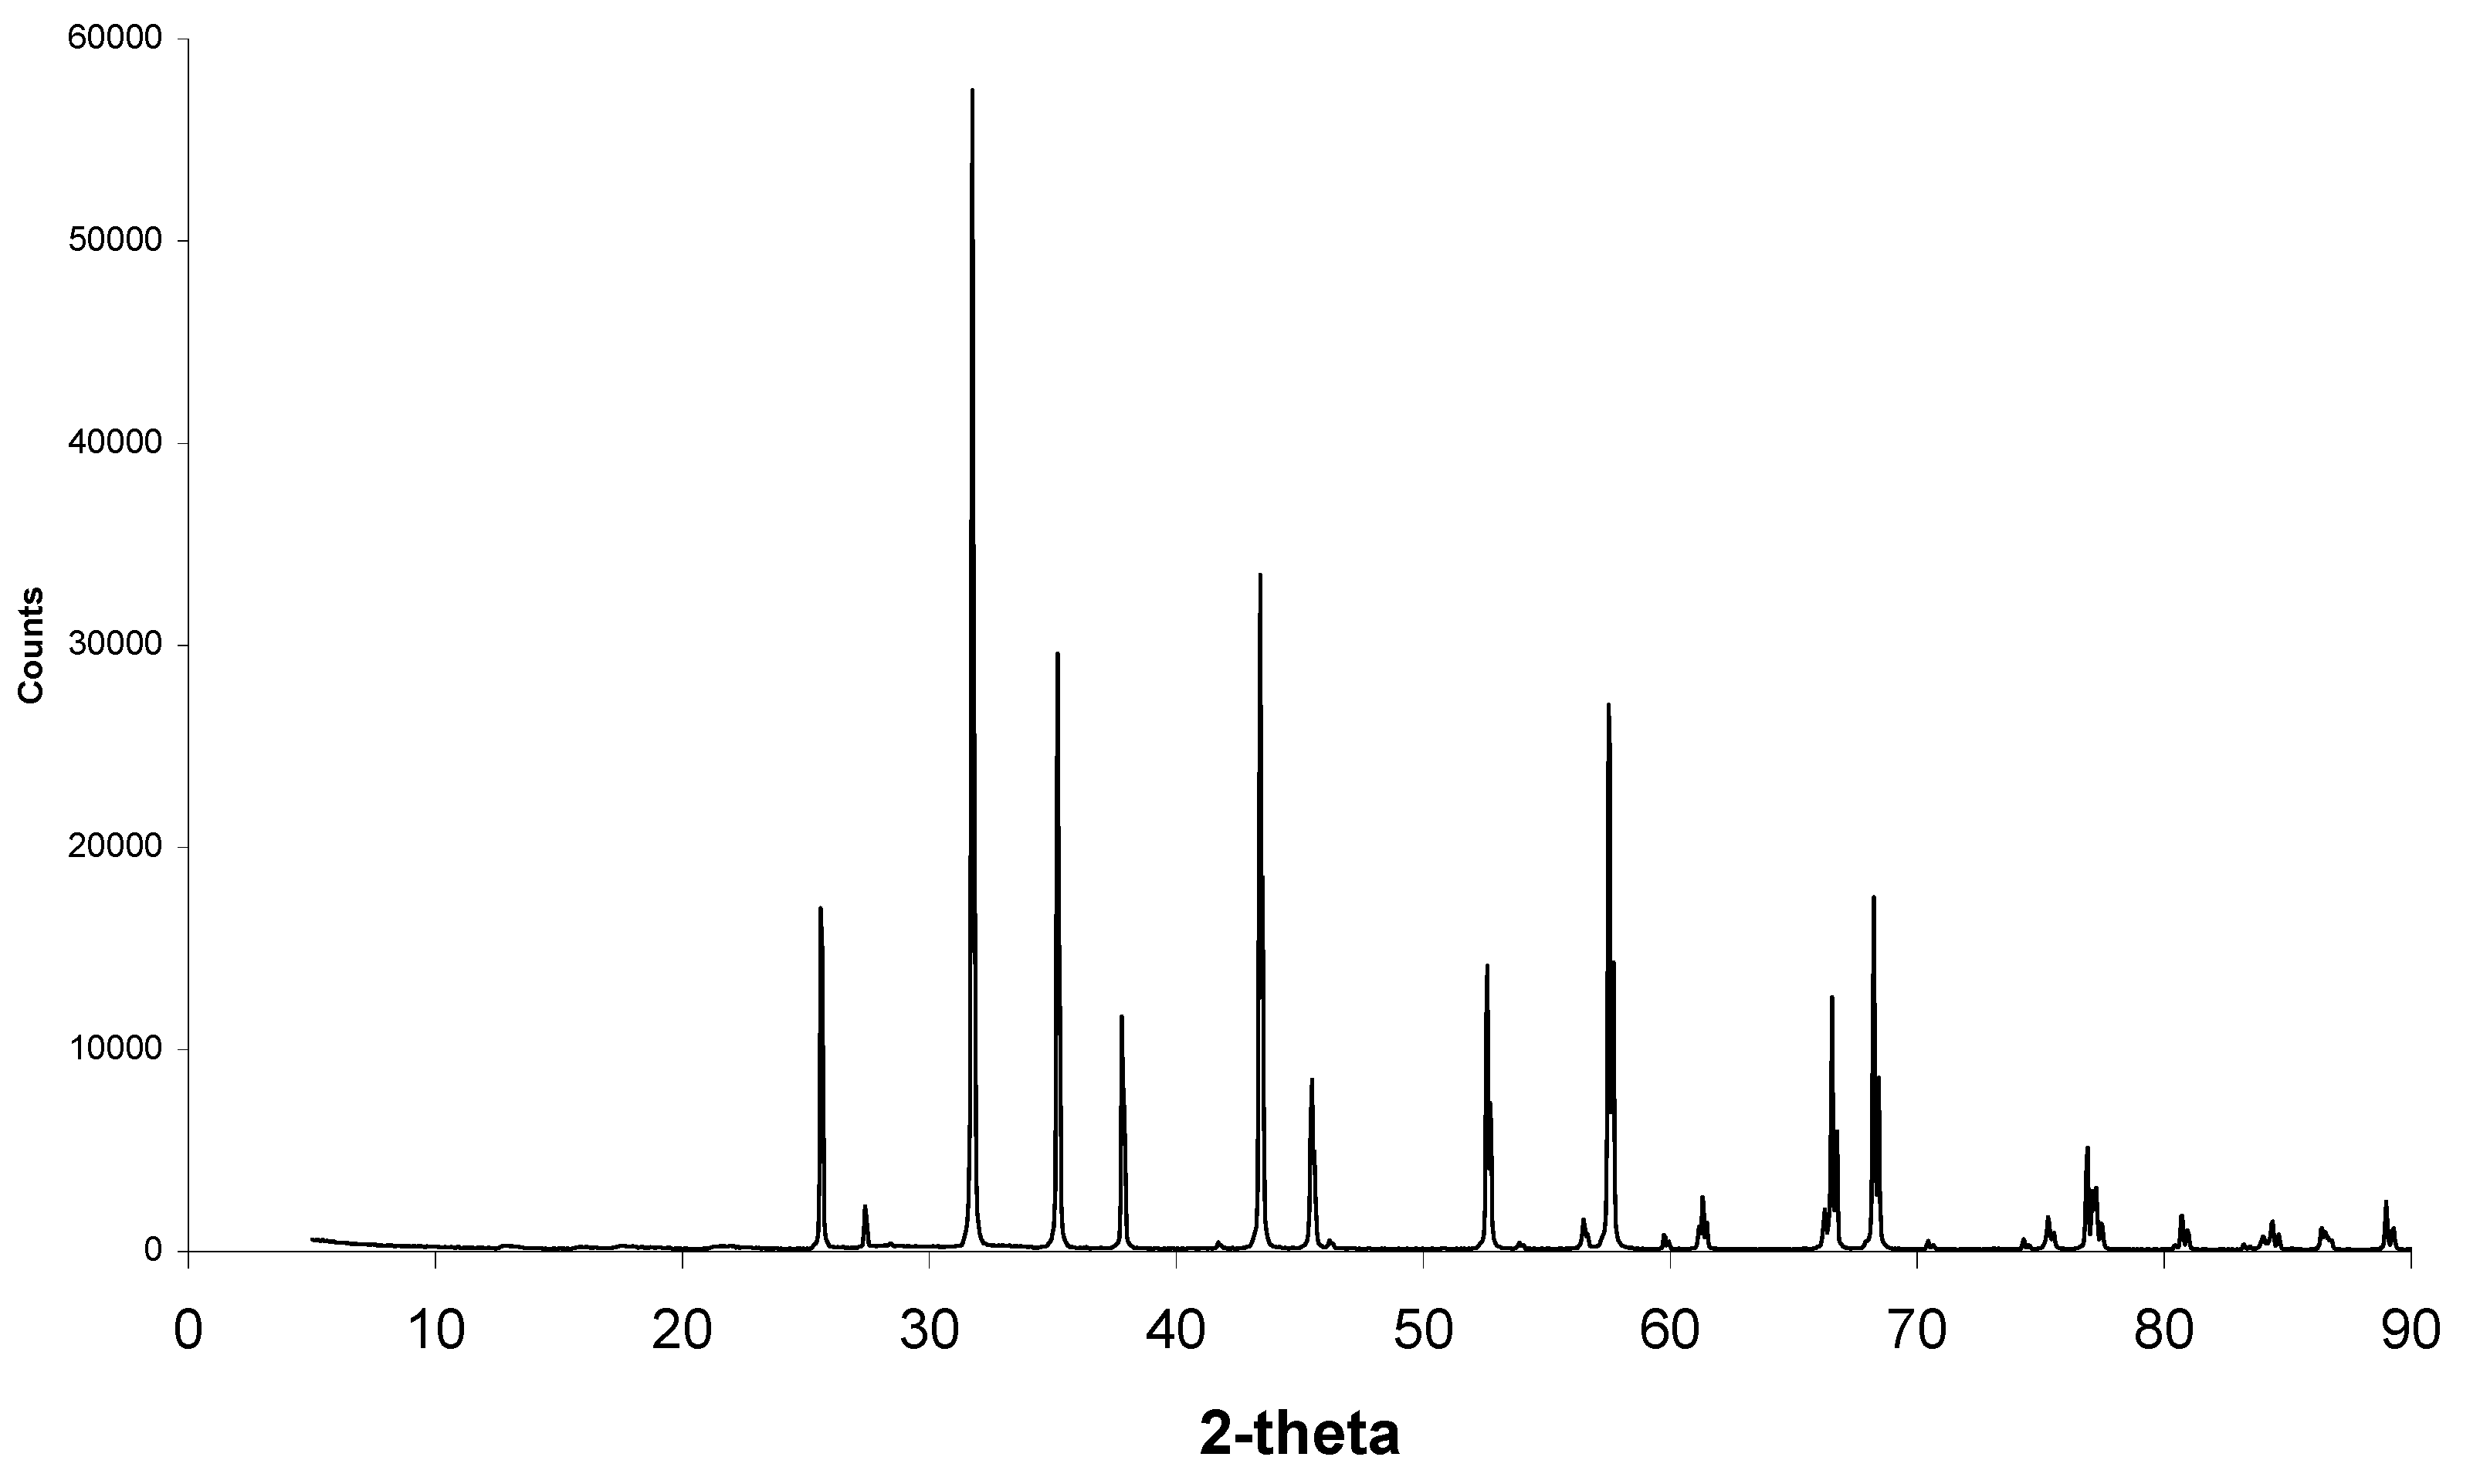
Figure 2 shows the XRD pattern for corundum alumina that makes up the sintered alumina pellets.
Figure 2.
XRD pattern for alumina showing corundum peaks signalling that the alumina is a pure phase.
Figure 2.
XRD pattern for alumina showing corundum peaks signalling that the alumina is a pure phase.
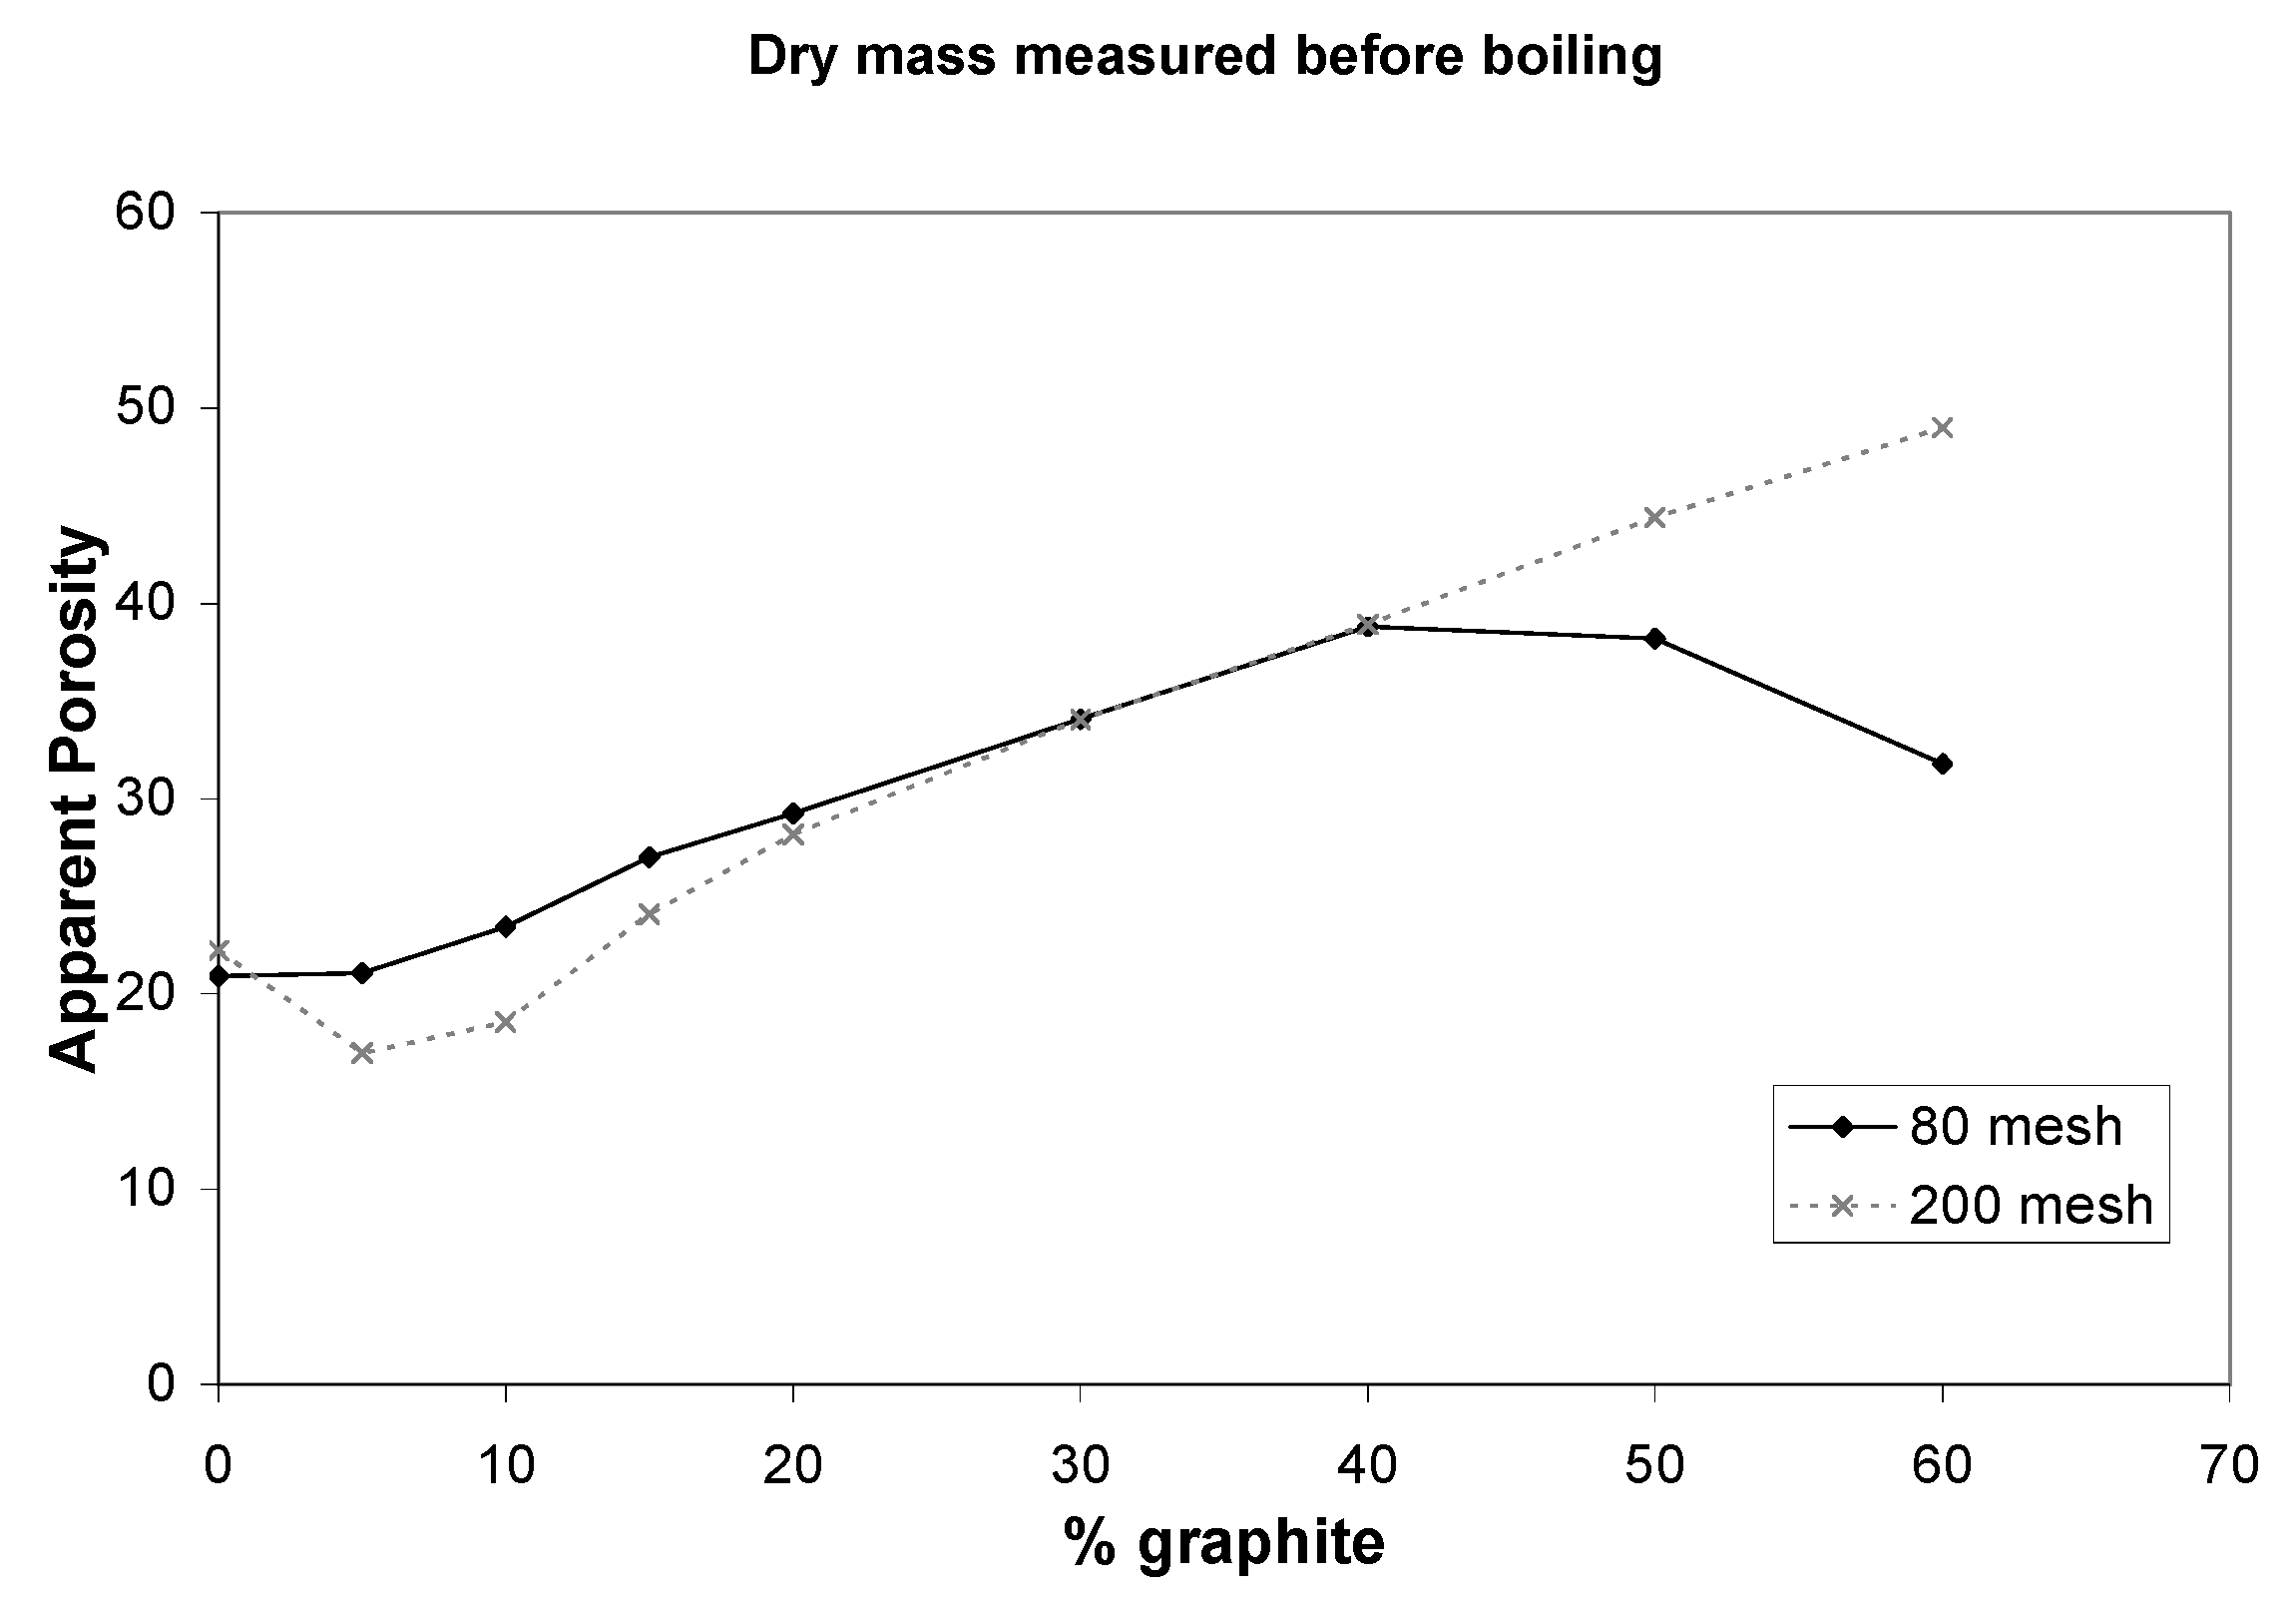
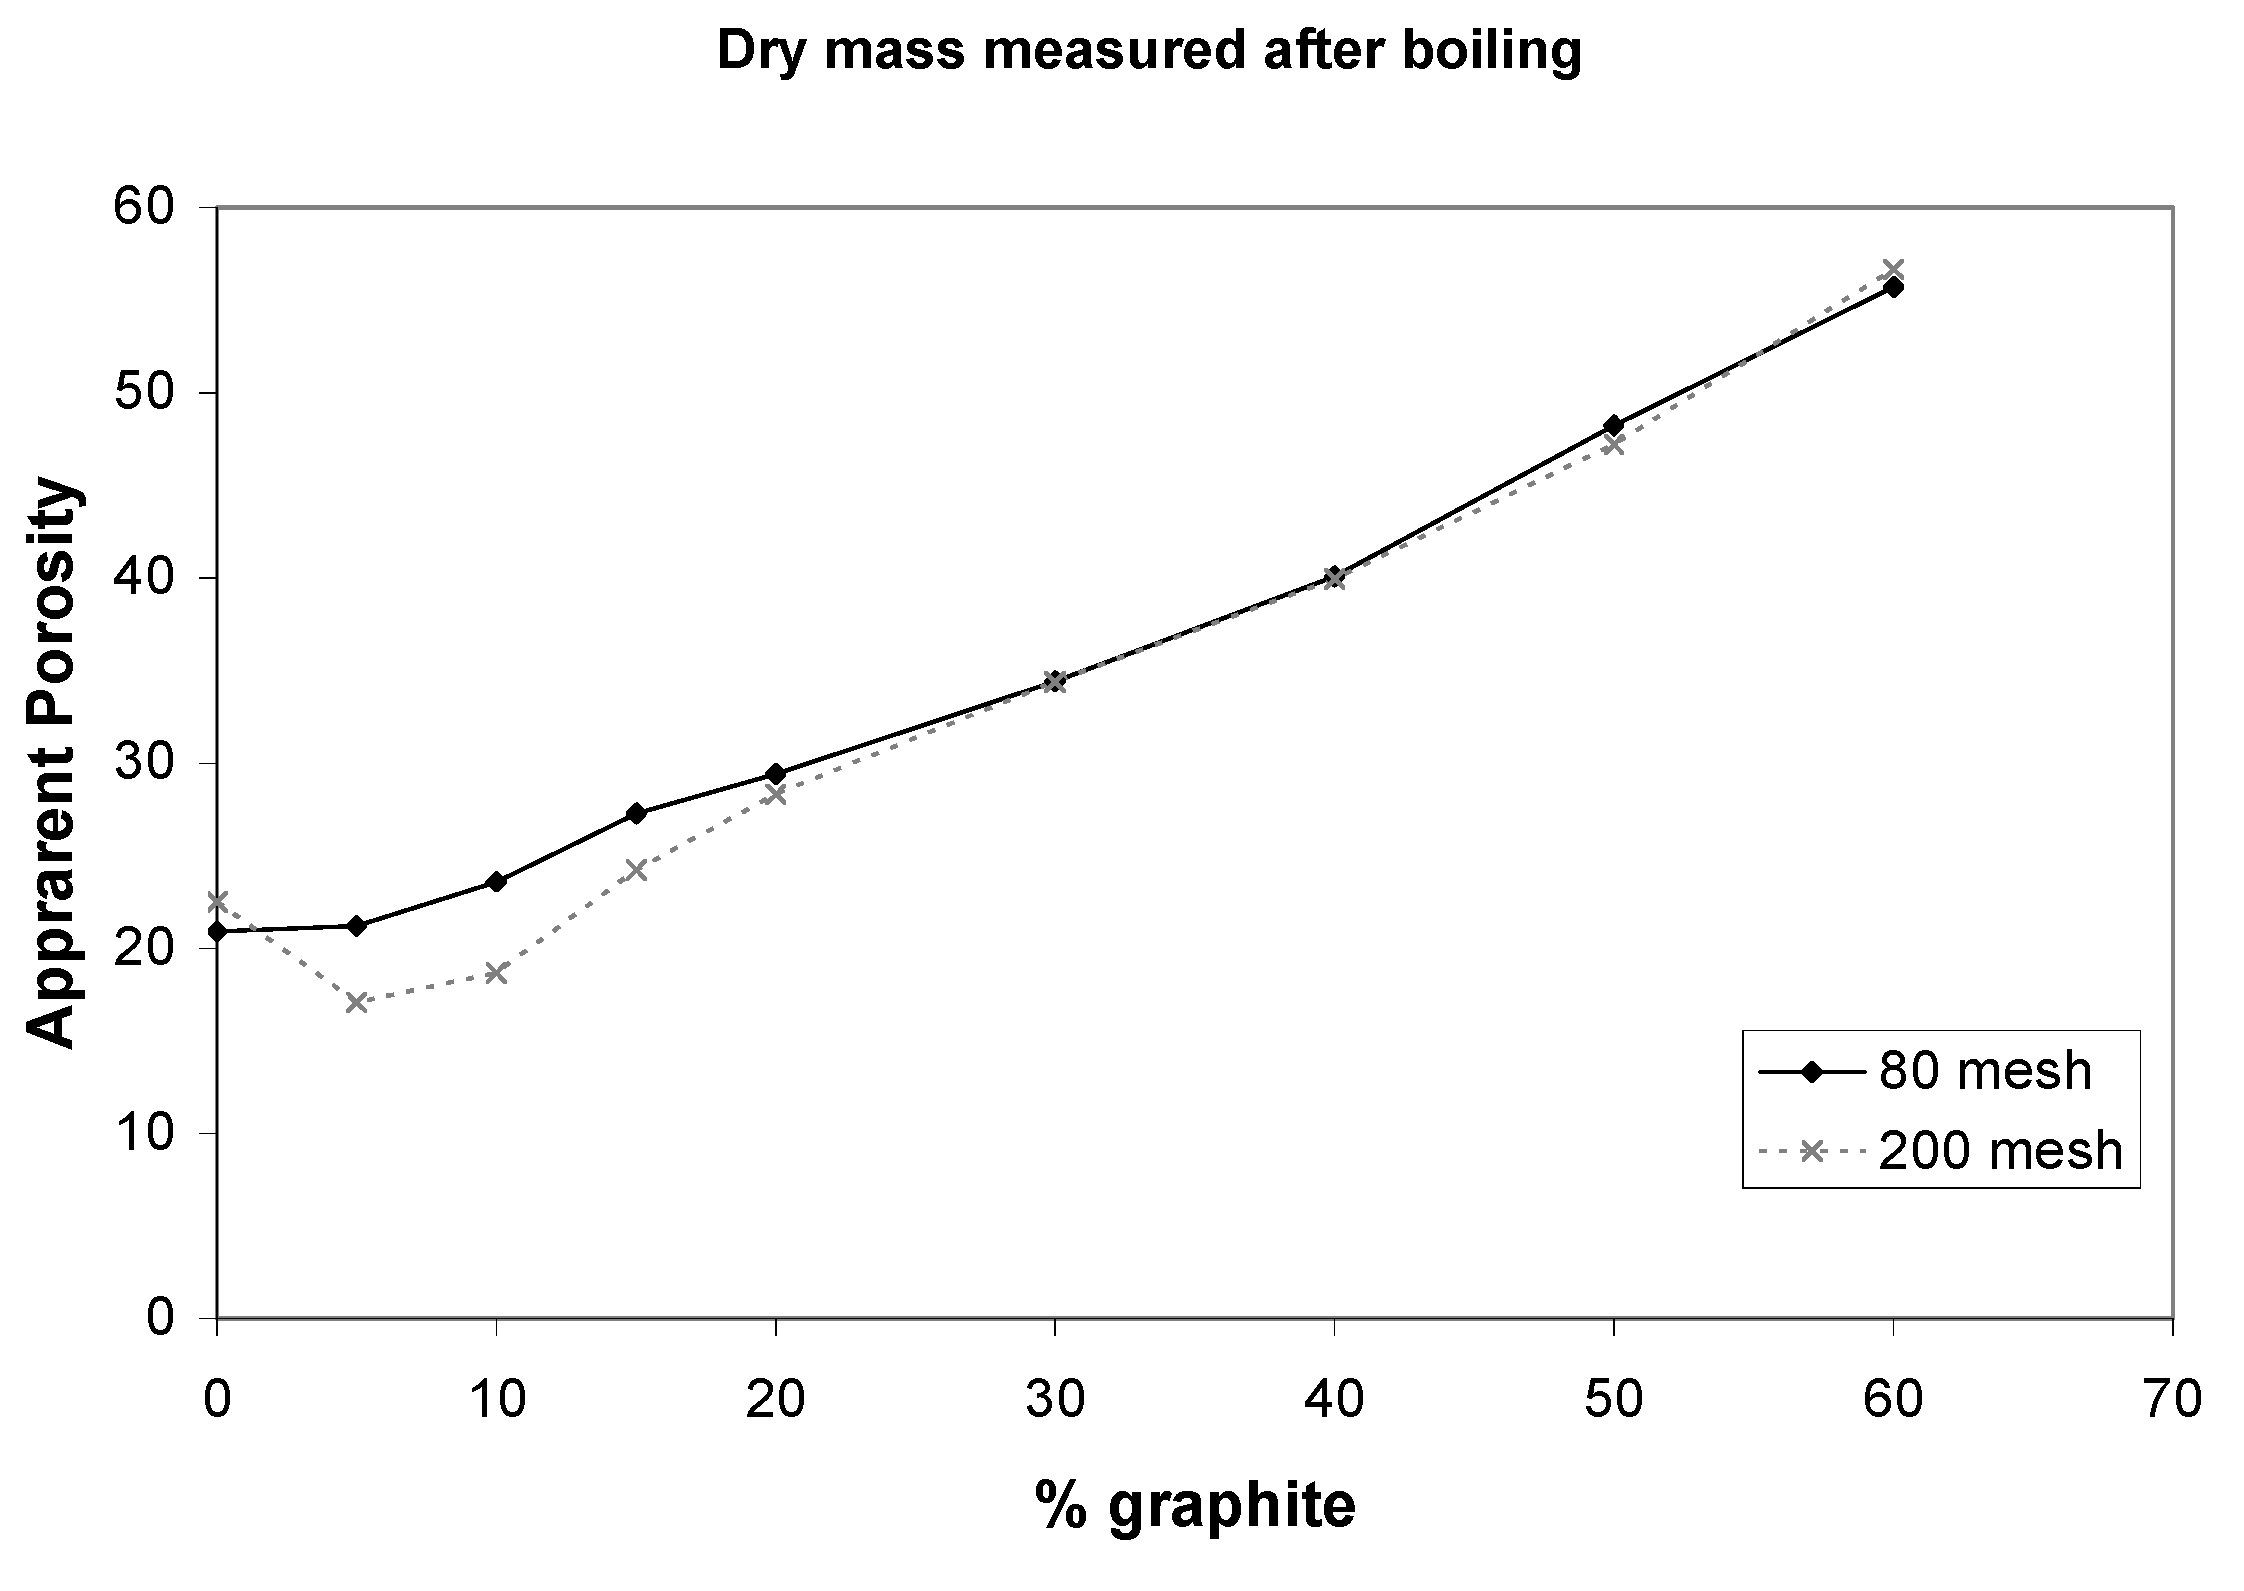
Figure 3 shows two plots for porosity, dry mass measured before boiling of alumina (top) and dry mass measured after boiling of alumina (bottom). Apparent porosity increased with increasing percent graphite added to alumina mixture. Two hundred mesh samples; samples that had a smaller particle size, dipped to a lower porosity before increasing. This is mostly likely due to laminations in the pellets.
Figure 3.
A plot presenting apparent porosity for each alumina sample for increasing % graphite component, or increasing porosity with dry mass measurements taken either before or after boiling.
Figure 3.
A plot presenting apparent porosity for each alumina sample for increasing % graphite component, or increasing porosity with dry mass measurements taken either before or after boiling.
It is important to take dry mass measurements after boiling with samples of high porosity.
If dry mass measurements are taken before boiling, as suggested in the standard quoted in methods Porosity Measurements, the porosity of high porosity samples goes down. If dry mass measurements are taken after boiling, the porosity of high porosity samples increases, which is expected. This is due to fragility of porous samples especially because pieces break away during boiling. It may be surmised that 200 mesh pellets was not as sensitive to dry mass measurements being done before or after boiling.
3.2. Pre-Treatment
Alumina was pre-treated to follow the biomimetic technique of pre-treatment and SBF, and to instigate nucleation for calcium phosphate crystal growth.
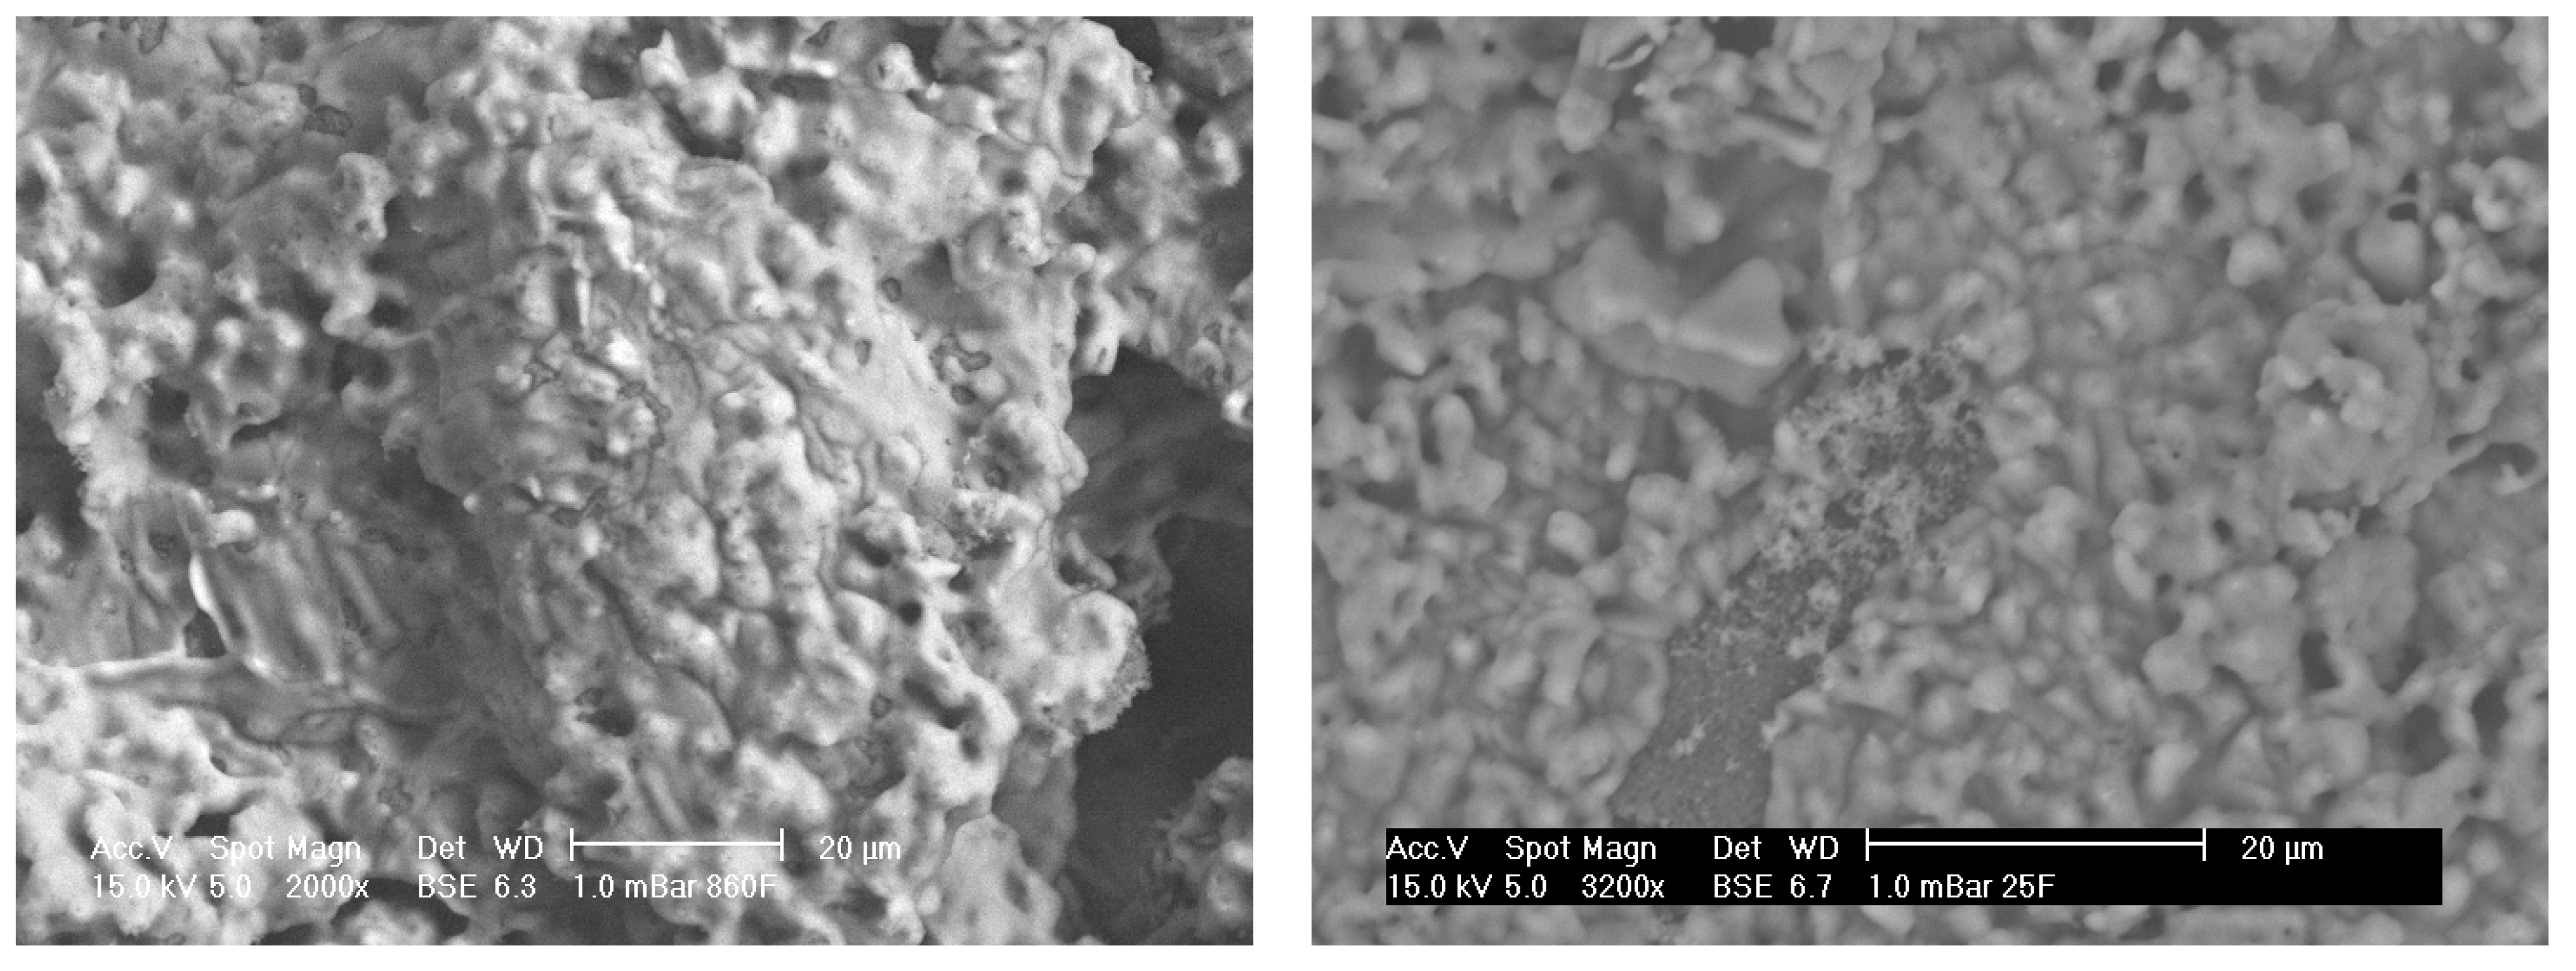
Figure 4 shows an SEM micrograph of Sample A (left) and Sample B (right) alumina pre-treated with concentrated sulphuric acid. With pre-treatment, the surface of the porous alumina was etched, that is, the grain structure is easier to identify. An acicular structure, that is, crystal structure appearing needle-like, was apparent at some porosities or % graphite and at some high original magnifications of 1904X on different samples. The surface topography was generally seen to increase with micro porosity apparent even at low % graphite, that is, low porosity samples.
The effect of pre-treatment on the alumina surface is easily seen in these SEM micrographs. It is envisaged that pre-treatment will allow more efficient SBF coating of calcium phosphate due to an increase in surface topography for heterogeneous nucleation and breaking of Al-O bonds to produce Al-OH bonds at the surface for chemical attachment of the calcium then phosphates.
The formation of Al-OH bonds is disputed. Some researchers report that Al-OH groups do not induce apatite nucleation in a body environment [
8,
9,
10]. Other researchers report the attachment of ions to the surface is possible through segregation of bioceramics [
11]. Therefore segregation, a diffusional process, may confer a degree of bioactivity on the surface of a ceramic whose bulk is inert. The calcium ions that are present on the alumina as an impurity or obtained from the SBF in a later step will thus improve bioactivity of alumina. The improvement of bioactivity of alumina will occur at the calcium ions diffuse into the surface of the alumina. Thus bioactivity may be improved due to high surface concentrations of calcium and low bulk calcium concentrations.
Figure 4.
SEM micrographs of alumina control samples after pre-treatment with approximate magnification of 2000. Porous Sample A (left) shows acicular structure from etching. Less porous Sample B (right) shows fine structure from etching.
Figure 4.
SEM micrographs of alumina control samples after pre-treatment with approximate magnification of 2000. Porous Sample A (left) shows acicular structure from etching. Less porous Sample B (right) shows fine structure from etching.
Researchers who have coated dense alumina using the G-glass method as pre-treatment give no indication as to the chemical attachment process for pre-treatment except that the “growth of the apatite layer is controlled by mass transport across the interface between the crystal and the fluid” [
12].
A stipulation of the biomimetic technique is that pre-treatment is required for further calcium phosphate coating using a SBF solution. Alumina is a bioinert material and requires an acidic pre-treatment to prepare the surface.
Alumina was pre-treated with a concentrated acid that etched the alumina surface. Chemical integration of the OH groups was also achieved. It is probable that both physical and chemical modification occurred. Porous alumina has not been previously coated using the biomimetic coating technique. Further investigation into pre-treatments for porous alumina could be considered, especially the effect of physical modification.
3.3. SBF Coating
Once samples underwent pre-treatment they were soaked in SBF solutions. Materials were soaked in 5.0 SBF. Samples were characterised with SEM, EDS and XRD.
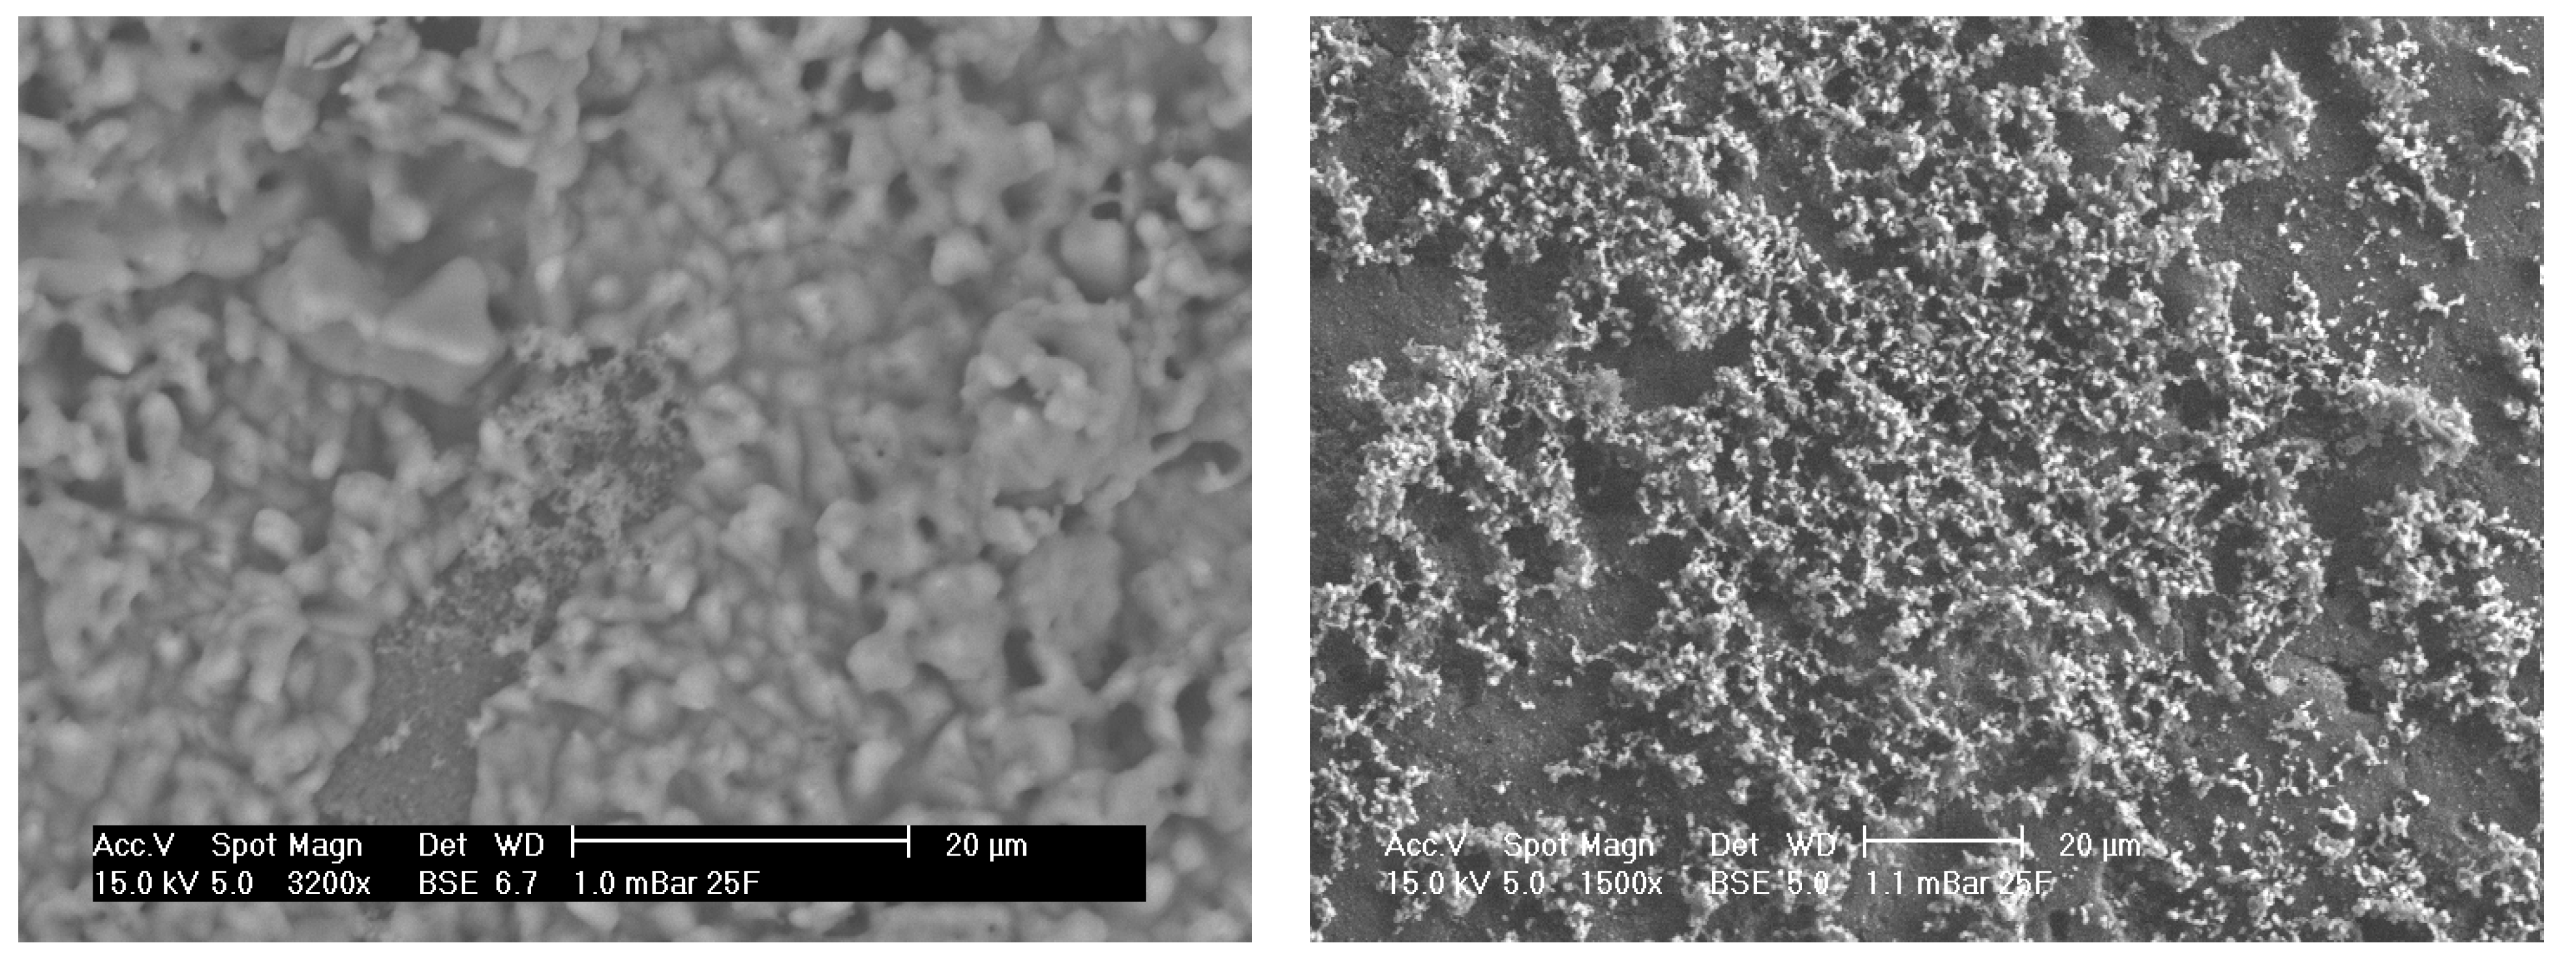
Figure 5 (left) shows SEM micrographs of porous alumina Sample A that has been pre-treated and then soaked in a 5.0 SBF solution.
Figure 5 (right) shows SEM micrographs of less porous alumina Sample B that has been pre-treated and then soaked in a 5.0 SBF solution.
Figure 5.
SEM micrographs of alumina after SBF soaking showing porous Sample A (left) and less porous Sample B (right) alumina. A coating is clearly visible.
Figure 5.
SEM micrographs of alumina after SBF soaking showing porous Sample A (left) and less porous Sample B (right) alumina. A coating is clearly visible.
From the SEM analysis, there seem to be small crystals attached to the porous alumina. The coatings cover the majority of the sample, especially on the sample’s up-side. However, the crystals do not completely coat the porous surface and there seems to be areas without coating. This is possibly due to the coatings cracking off or that the coatings spread and have not yet filled the areas. On the less porous alumina Sample B in
Figure 5, small needle crystals in comparison with the bigger rounder alumina particles are present. These small crystals are composed of calcium and phosphorous as suggested from elemental analysis shown in
Figure 6.
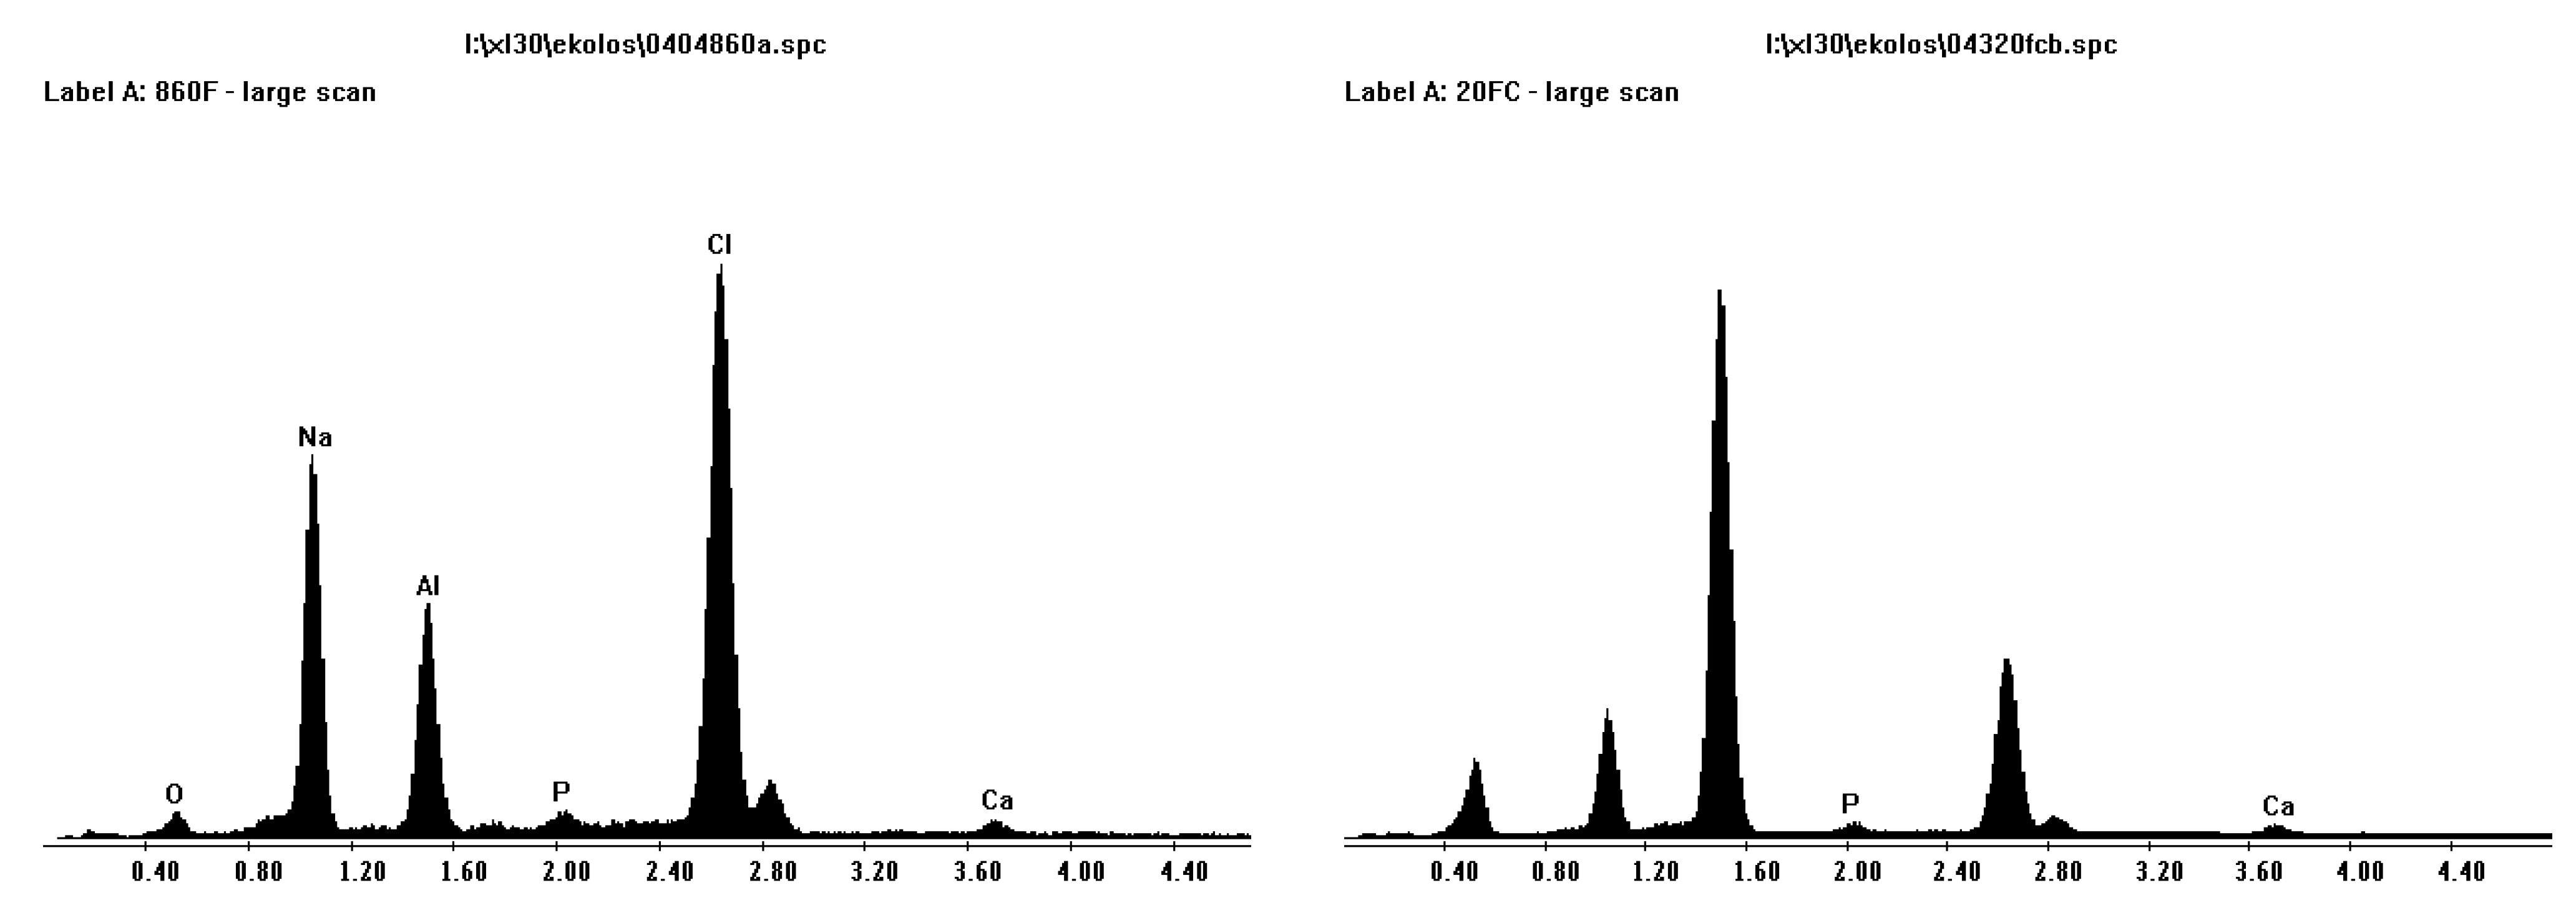
Figure 6 shows EDS results from both porous and less porous alumina. Two morphologies of coating are evident on the porous alumina, one that looks amorphous that totally covers the sample (charges easily on SEM) and an acicular morphology within or under the thicker coating that is composed of calcium and phosphorous.
Figure 6.
EDS plots for porous Sample A (left) and less porous Sample B (right) alumina after SBF coating. Calcium and phosphorous are present.
Figure 6.
EDS plots for porous Sample A (left) and less porous Sample B (right) alumina after SBF coating. Calcium and phosphorous are present.
Figure 7 shows an XRD scan of SBF coated alumina. The “amorphous” coating is NaCl (halite) as was suggested from XRD analysis in
Figure 7. From examination of the XRD scan, the calcium and phosphorous phase is not present. Therefore, the scan was re-done with twice the step time in the hope to allow a better analysis. This result produced peaks that were slimmer, less background noise, and some phases found that matched even the smaller ones of corundum (alumina) and halite (NaCl). However there were no large peaks of calcium phosphate. This is mostly due to the small layer of calcium and phosphorous compared to alumina. This led to the opportunity to heat treat samples, burn off of the halite phase, and for sintering of the calcium phosphate phase.
Once alumina was pre-treated with sulphuric acid, the surface was etched and ready for SBF coating. The Al-OH bonds were available for apatite nuclei to form on the surface, to grow spontaneously by consuming the calcium, phosphate and hydroxide ions in the SBF. This is because the SBF is highly saturated with respect to the apatite [
13]. Alumina did form the calcium phosphate layer, but the surface was not completely covered. This may be due to alumina’s poor ability to form an apatite layer following the biomimetic coating technique. Or the pre-treatment on the more porous alumina Sample A did not produce an adequate substrate for attaching, that is, the acicular structure may not be as compatible.
Figure 7.
XRD scan of alumina after SBF coating showing corundum peaks and halite peaks.
Figure 7.
XRD scan of alumina after SBF coating showing corundum peaks and halite peaks.
3.4. Sintering
Alumina was sintered to remove the sodium chloride phase present after soaking.
Figure 8 and
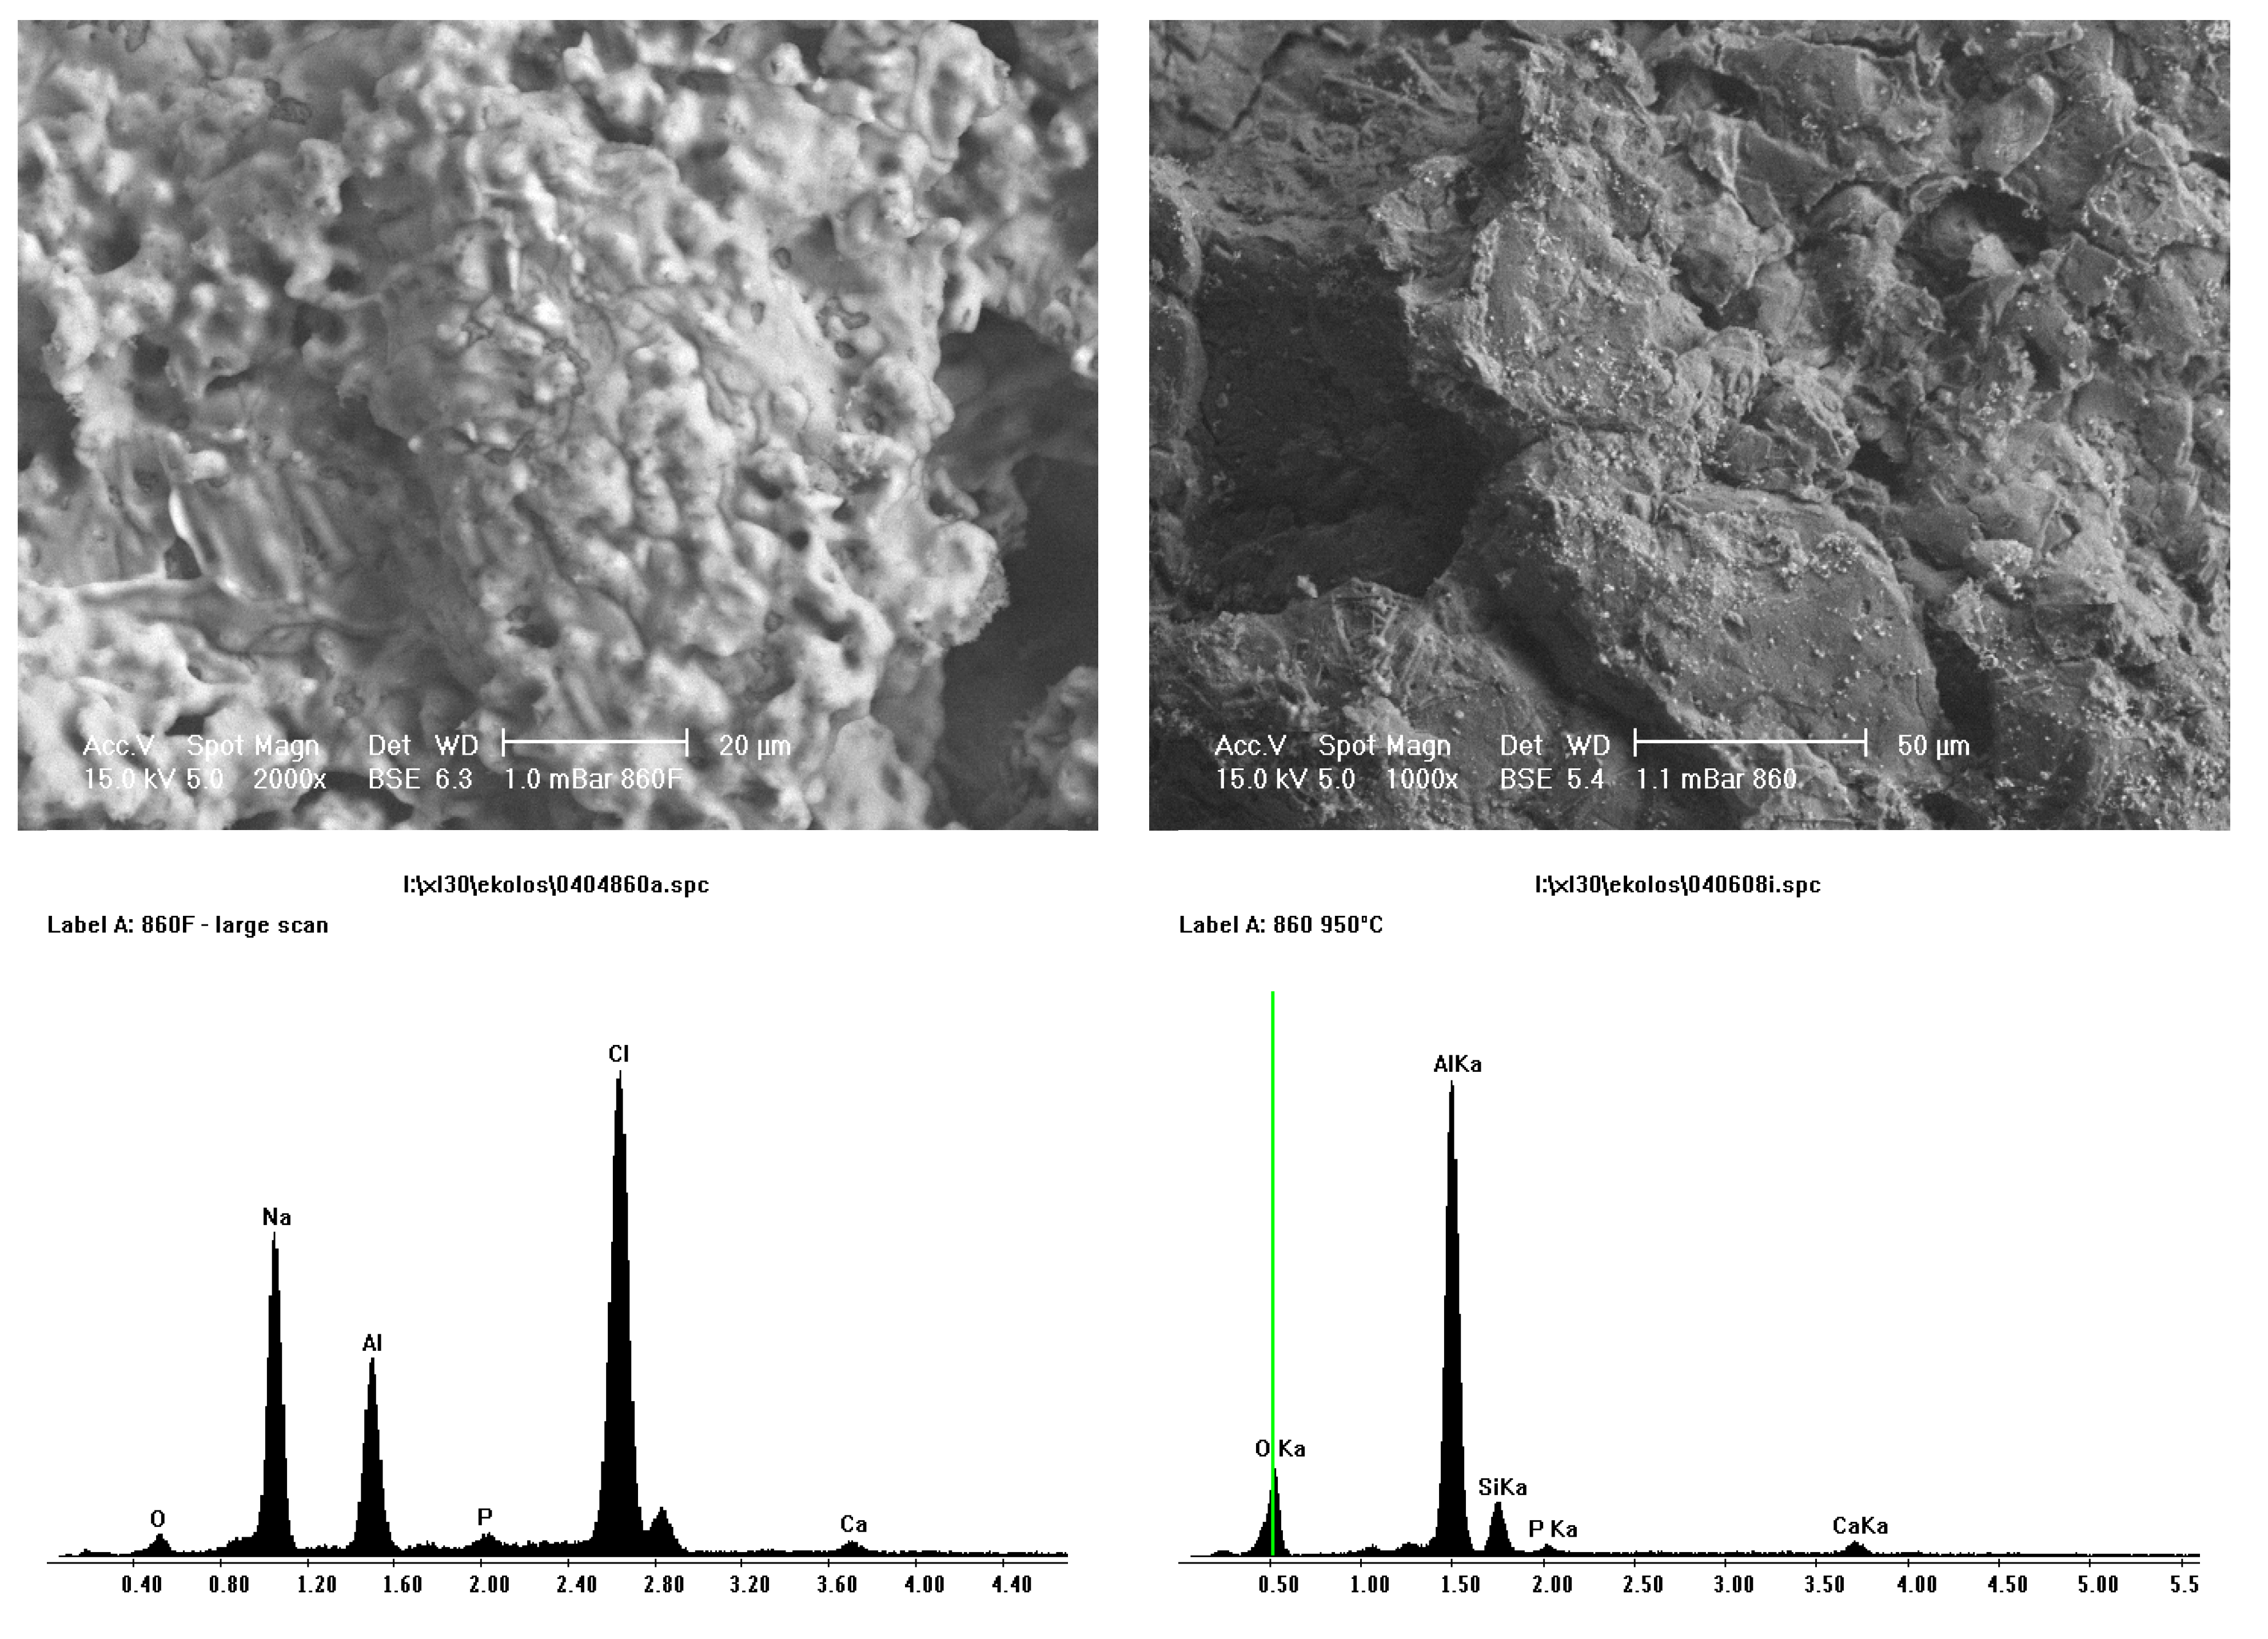
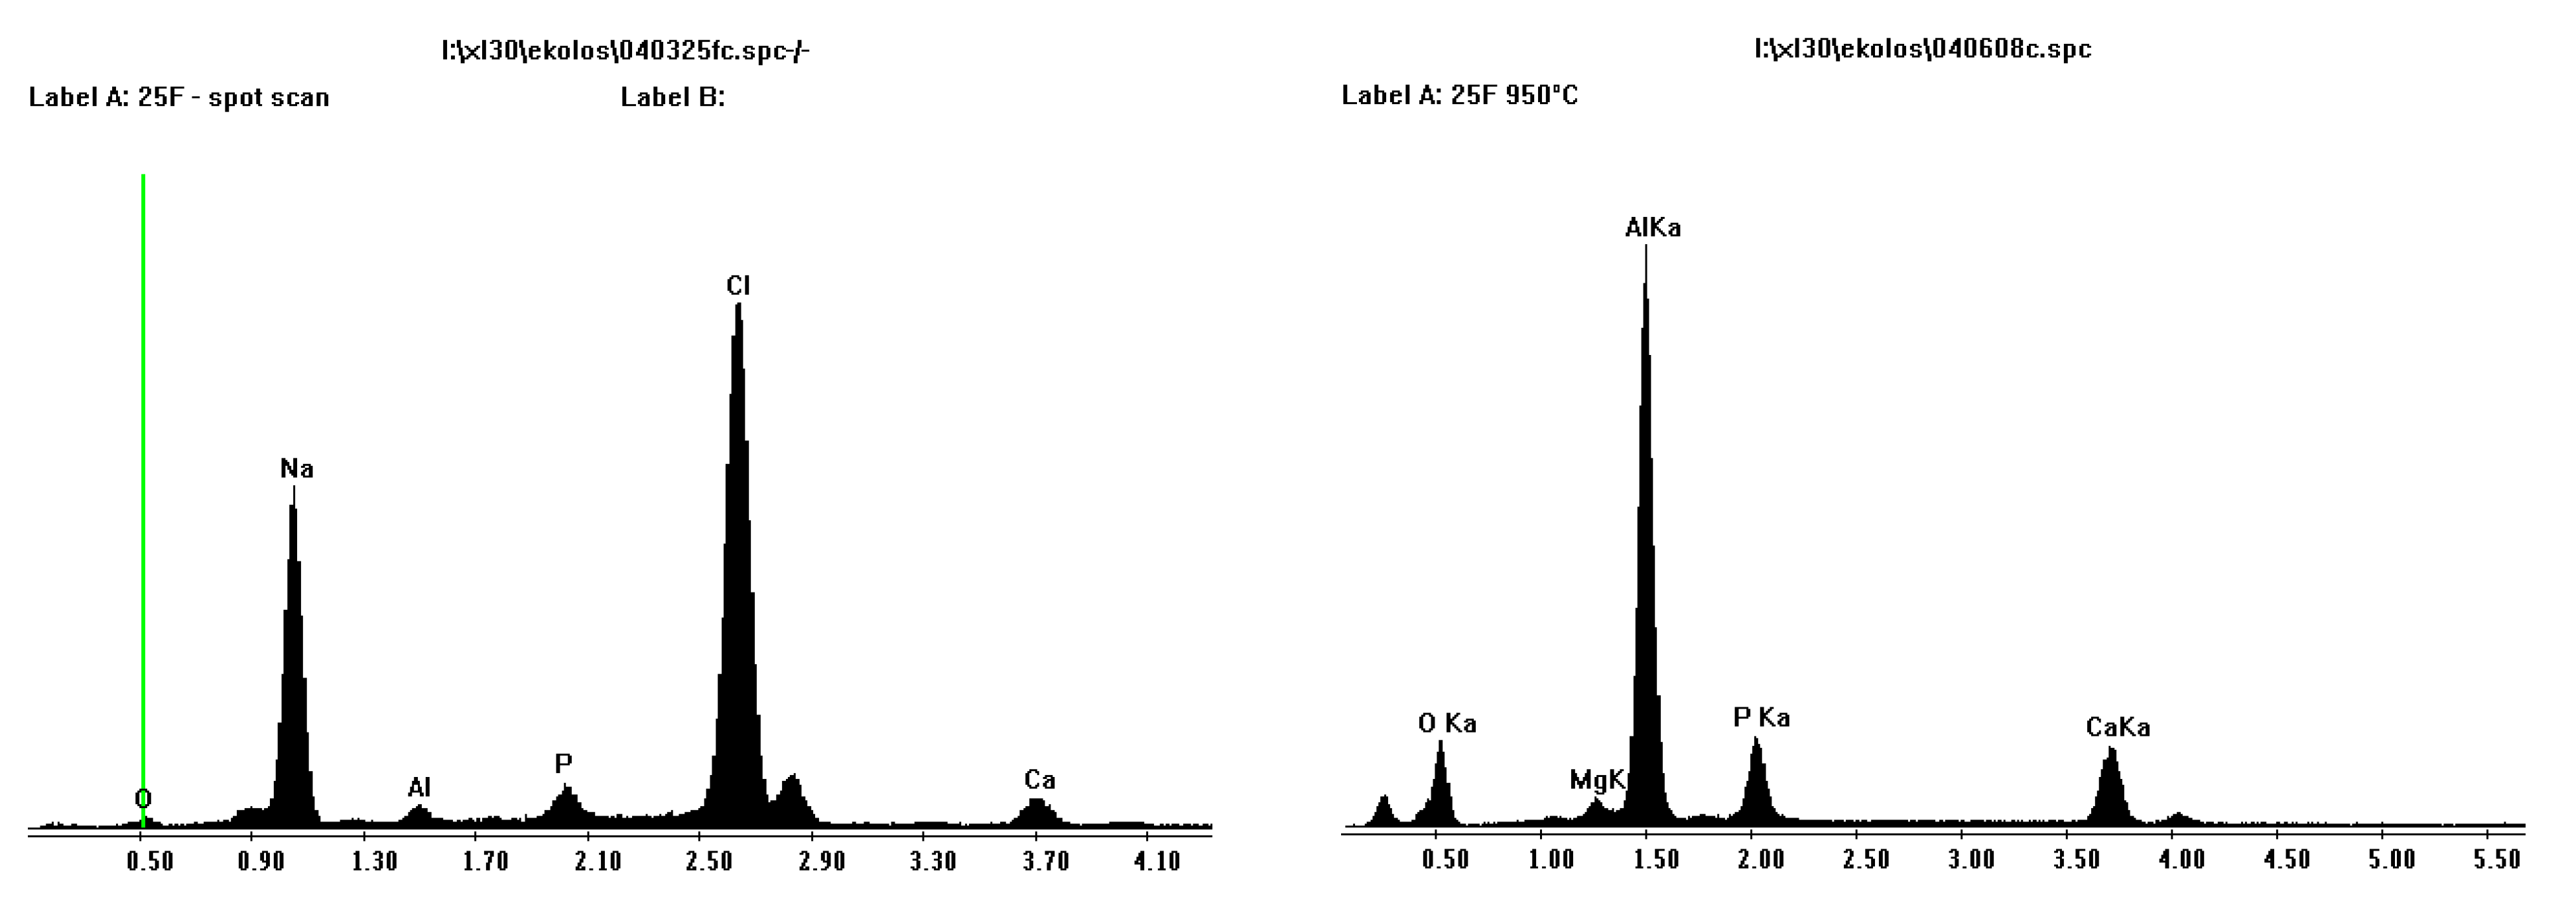
Figure 9 shows SEM and EDS images of porous Sample A and less porous Sample B alumina that have undergone pre-treatment and SBF coating on the left and sintering at 950 °C on the right. The SEM images on the left show an amorphous coating and some homogeneously dispersed small crystals that consisted of calcium and phosphorous, as seen in EDS plots. It was thought, that upon heating, the “amorphous” coating would burn out, leaving the homogeneously dispersed small crystals of calcium and phosphorous. Sintering of the alumina ceramic would not occur at this temperature, 950°C, as to sinter alumina, temperatures around 1400 °C are required. EDS results showed that this layer consisted of sodium and chlorine elements.
Figure 8.
SEM and EDS of before (left) and after (right) heat treatment of coating at 950 °C for porous Sample A alumina. Sodium and chlorine are no longer present after heat treatment.
Figure 8.
SEM and EDS of before (left) and after (right) heat treatment of coating at 950 °C for porous Sample A alumina. Sodium and chlorine are no longer present after heat treatment.
Figure 9.
SEM and EDS of before (left) and after (right) heat treatment of coating at 950 °C for less porous Sample B alumina. Sodium and chlorine are no longer present after heat treatment.
Figure 9.
SEM and EDS of before (left) and after (right) heat treatment of coating at 950 °C for less porous Sample B alumina. Sodium and chlorine are no longer present after heat treatment.
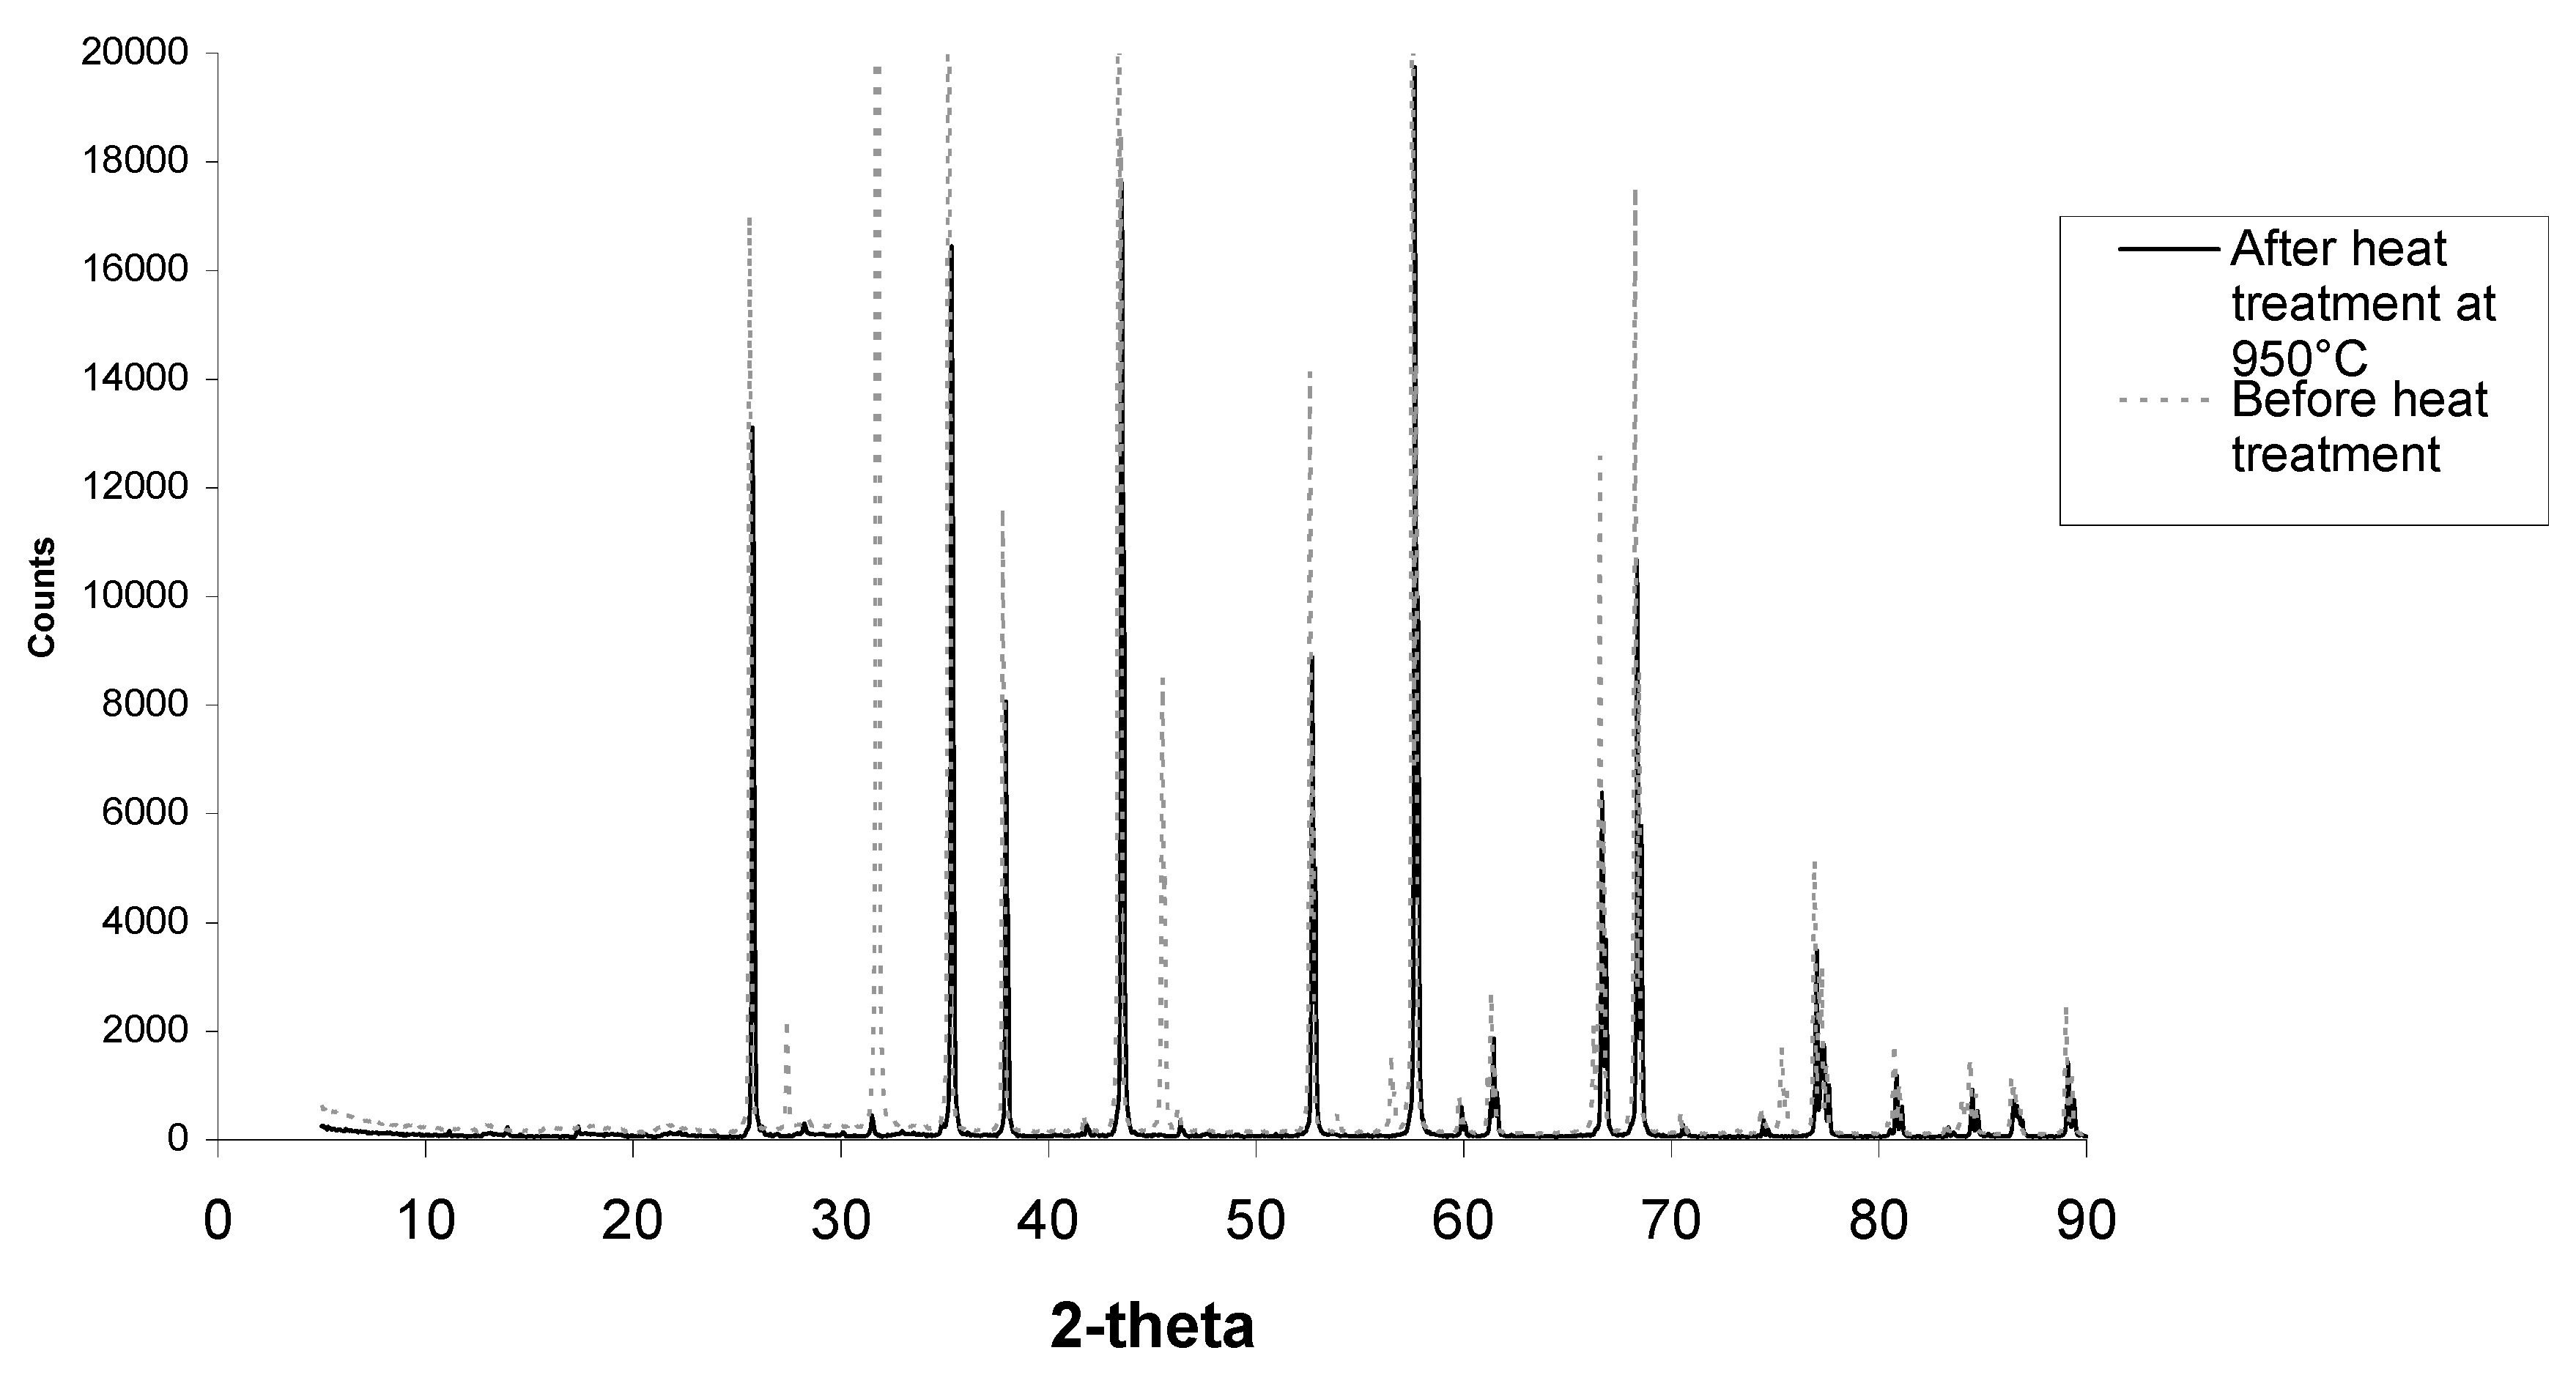
Figure 10.
XRD scan of alumina samples before and after heat treatment showing common corundum phases and halite phases that are no longer present after heat treatment. New small peaks are present between 20 and 40°.
Figure 10.
XRD scan of alumina samples before and after heat treatment showing common corundum phases and halite phases that are no longer present after heat treatment. New small peaks are present between 20 and 40°.
Further XRD analysis as seen in
Figure 10 showed this phase to be halite, better known as sodium chloride. It is possible that this phase formed during SBF soaking as the 5.0 SBF has a very high percentage of sodium and chlorine ions.
On the right of
Figure 8 and
Figure 9, results from after sintering are presented. A sintering temperature of 950 °C was chosen, as an amorphous material would not survive this temperature, but calcium phosphate would. It is now obvious that the “amorphous” coating has gone, as seen on SEM micrographs, and no sodium and chlorine ions are present in EDS results. Small crystals of calcium phosphate are therefore apparent. The coverage of calcium phosphate crystals was more extensive on the less porous alumina Sample B then the porous alumina Sample A. The greater coverage on the less porous alumina will continue to be important in cell culture studies. Aluminium ions were present in EDS due to the calcium phosphate crystals not completely covering the alumina surface.
Figure 10 shows XRD scans of less porous alumina samples before and after heat treatment. Corundum (alumina) peaks are present at 26°, 35°, 38°, 58°, 60°, 63°, 66°, 68°, 71°, 75°, 77°, 81°, 85°, 87°, and 89°. Halite (sodium chloride) peaks are present at 28°, 32°, 45° and 56°. As seen in
Figure 10 and higher magnification in
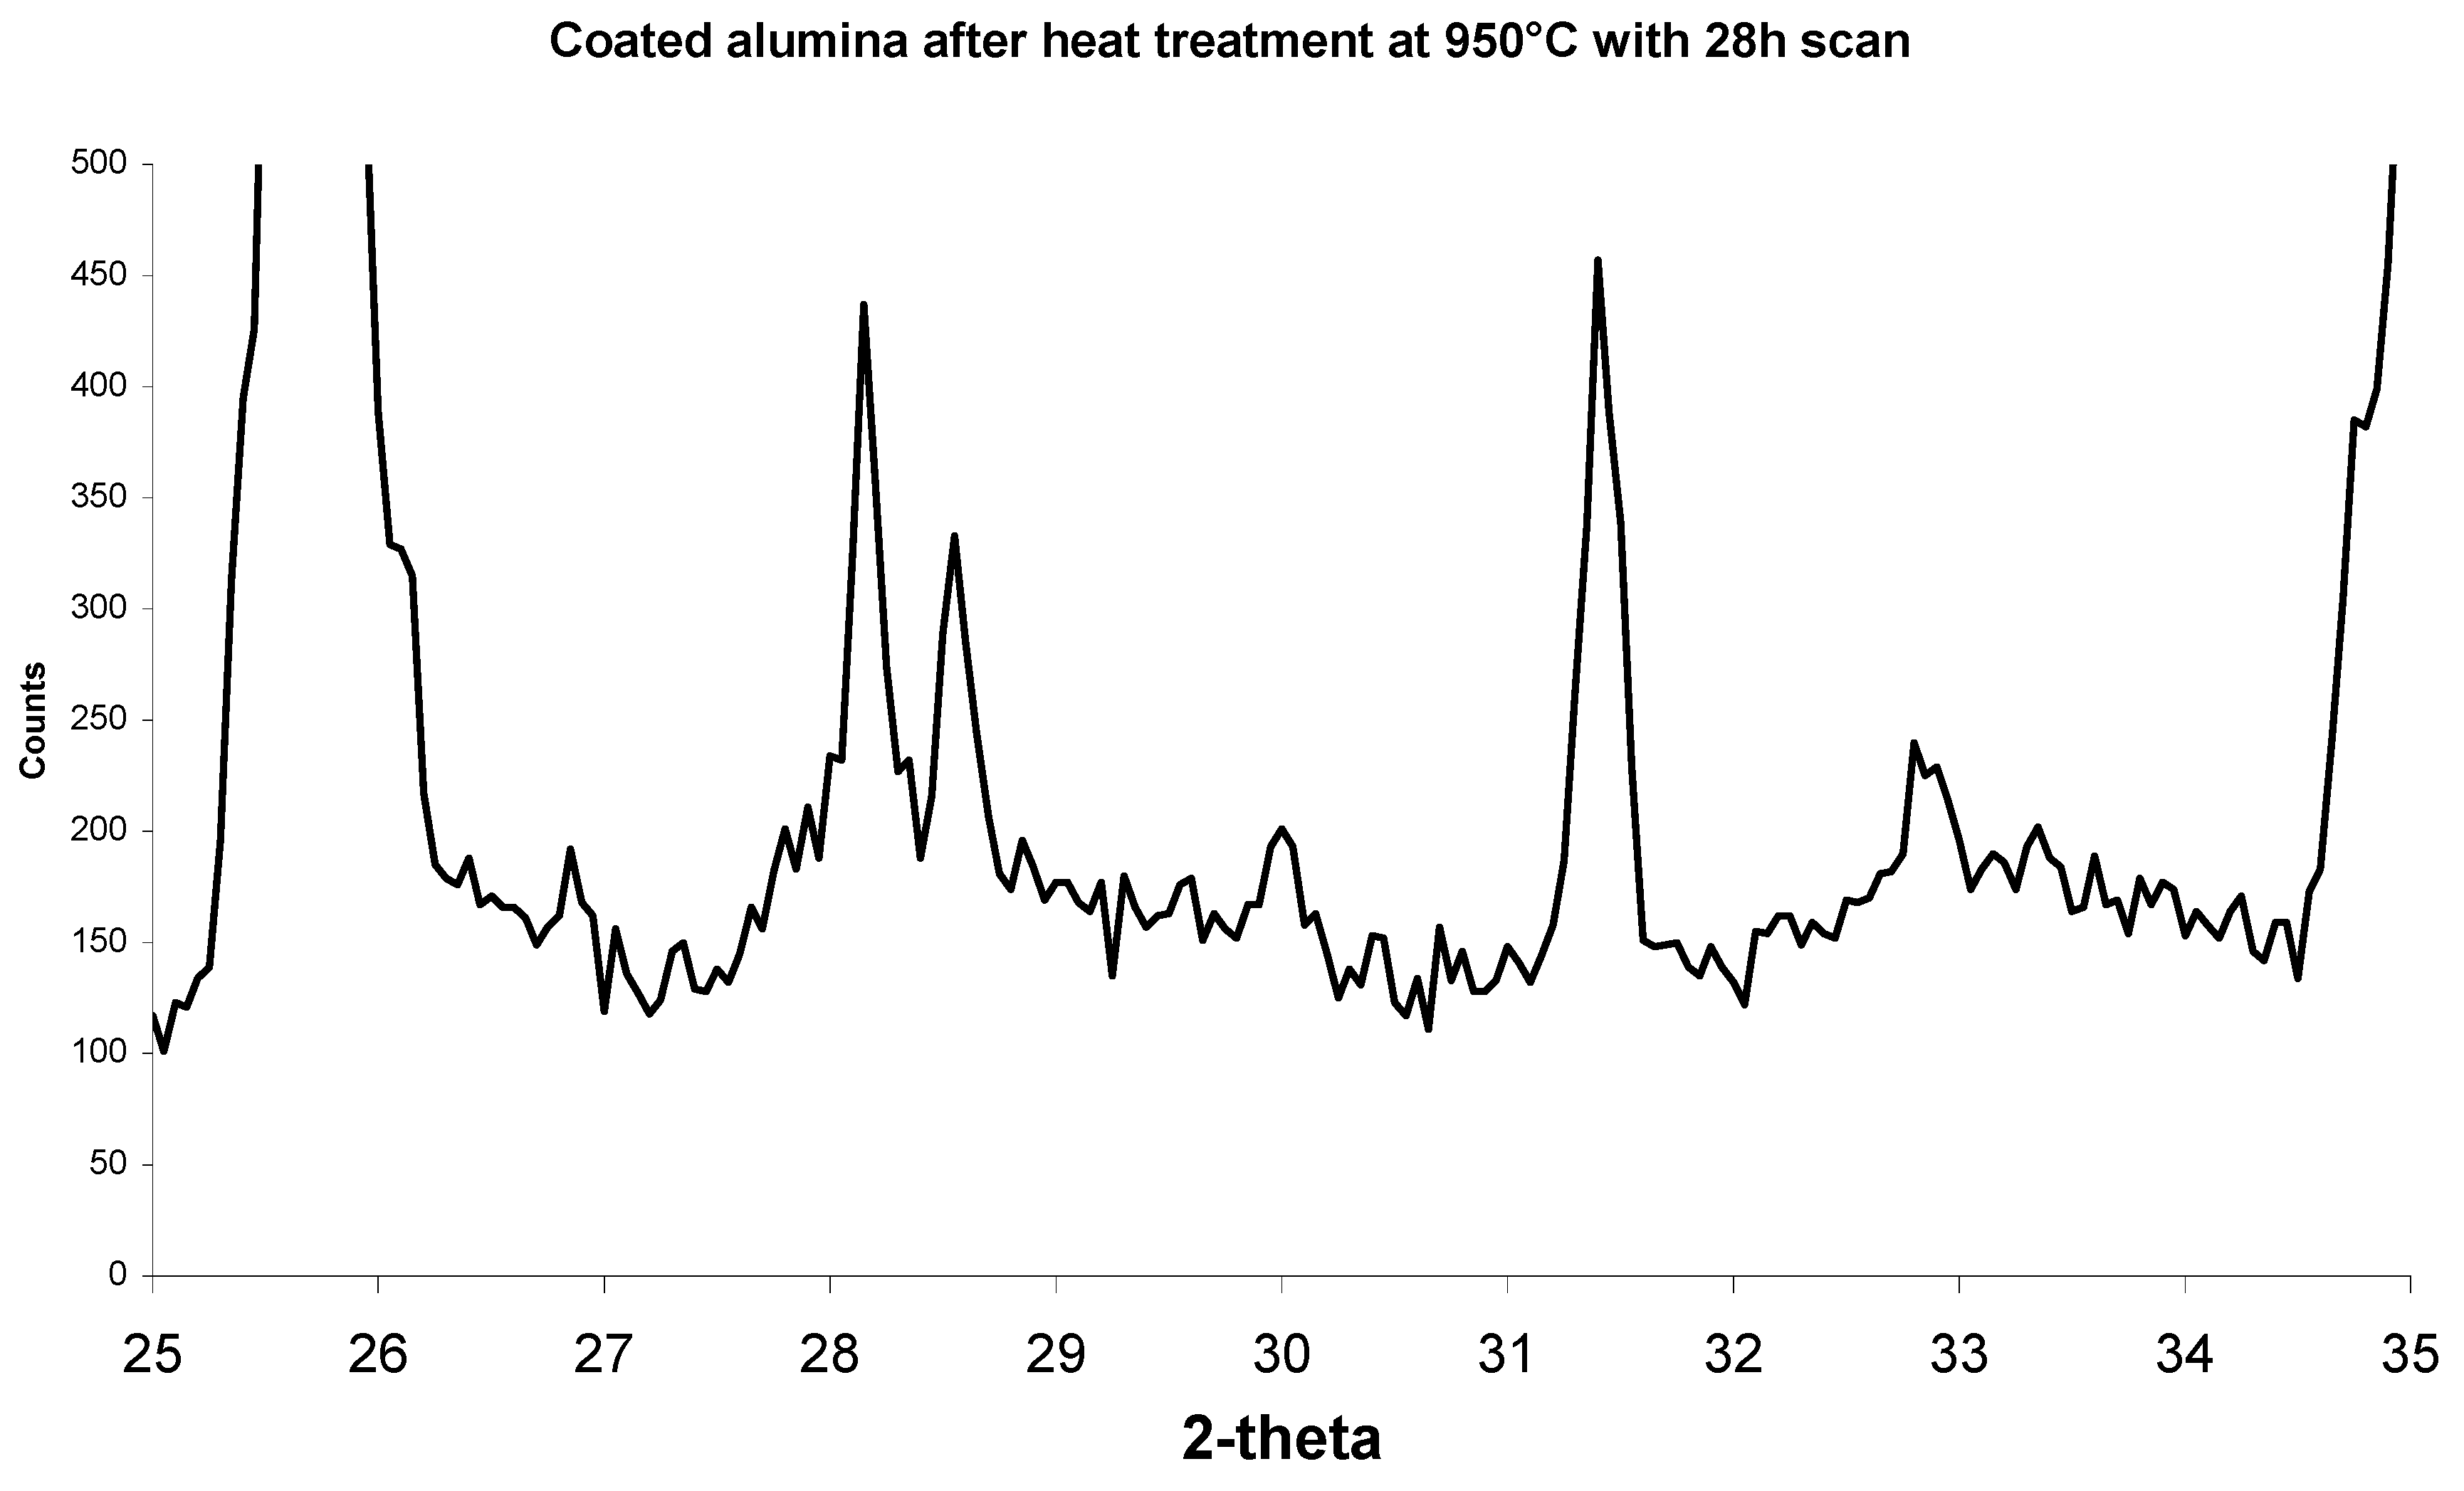
Figure 11, after heat treatment there are small extra peaks at 28.1°, 28.6° and 31.4°. These phases could not be identified before heat treatment. The amounts of calcium phosphate were most likely too small and mostly covered with the halite phase to contribute to the XRD scans. Once the halite was burnt off, the calcium phosphate crystals were not covered with halite and therefore the apatite phases can be clearly observed.
Figure 11.
XRD scan of a select 2-theta showing a high magnification of the small peaks from
Figure 10. Apatite peaks are now visible.
Figure 11.
XRD scan of a select 2-theta showing a high magnification of the small peaks from
Figure 10. Apatite peaks are now visible.
Sintering was done on alumina to remove the halite layer and expose the calcium phosphate crystals. The calcium phosphate phase was exposed with sintering to 950 °C.
3.5. Cell Culturing
The purpose of cell culturing was to characterise the biological performance of these materials.
The porous and less porous alumina was tested with a twenty-four day cell culture. These studies were done to observe biocompatibility and cell morphology, and a further investigation was done to observe cell ingrowth.
SEM and confocal microscopy was used to view cell behaviour.
The MG-63 osteosarcoma osteoblast cell line was employed in all cell culture experiments. This was done as a standard technique for comparison purposes. Standard cell culturing procedures were followed, again for comparison purposes.
The porous Sample A and less porous Sample B alumina underwent cell culturing, in all cases the alumina material had been coated with a SBF coating and sintered at 950 °C. SEM and confocal microscopy were employed as characterisation tools, to examine cell attachment and cell ingrowth.
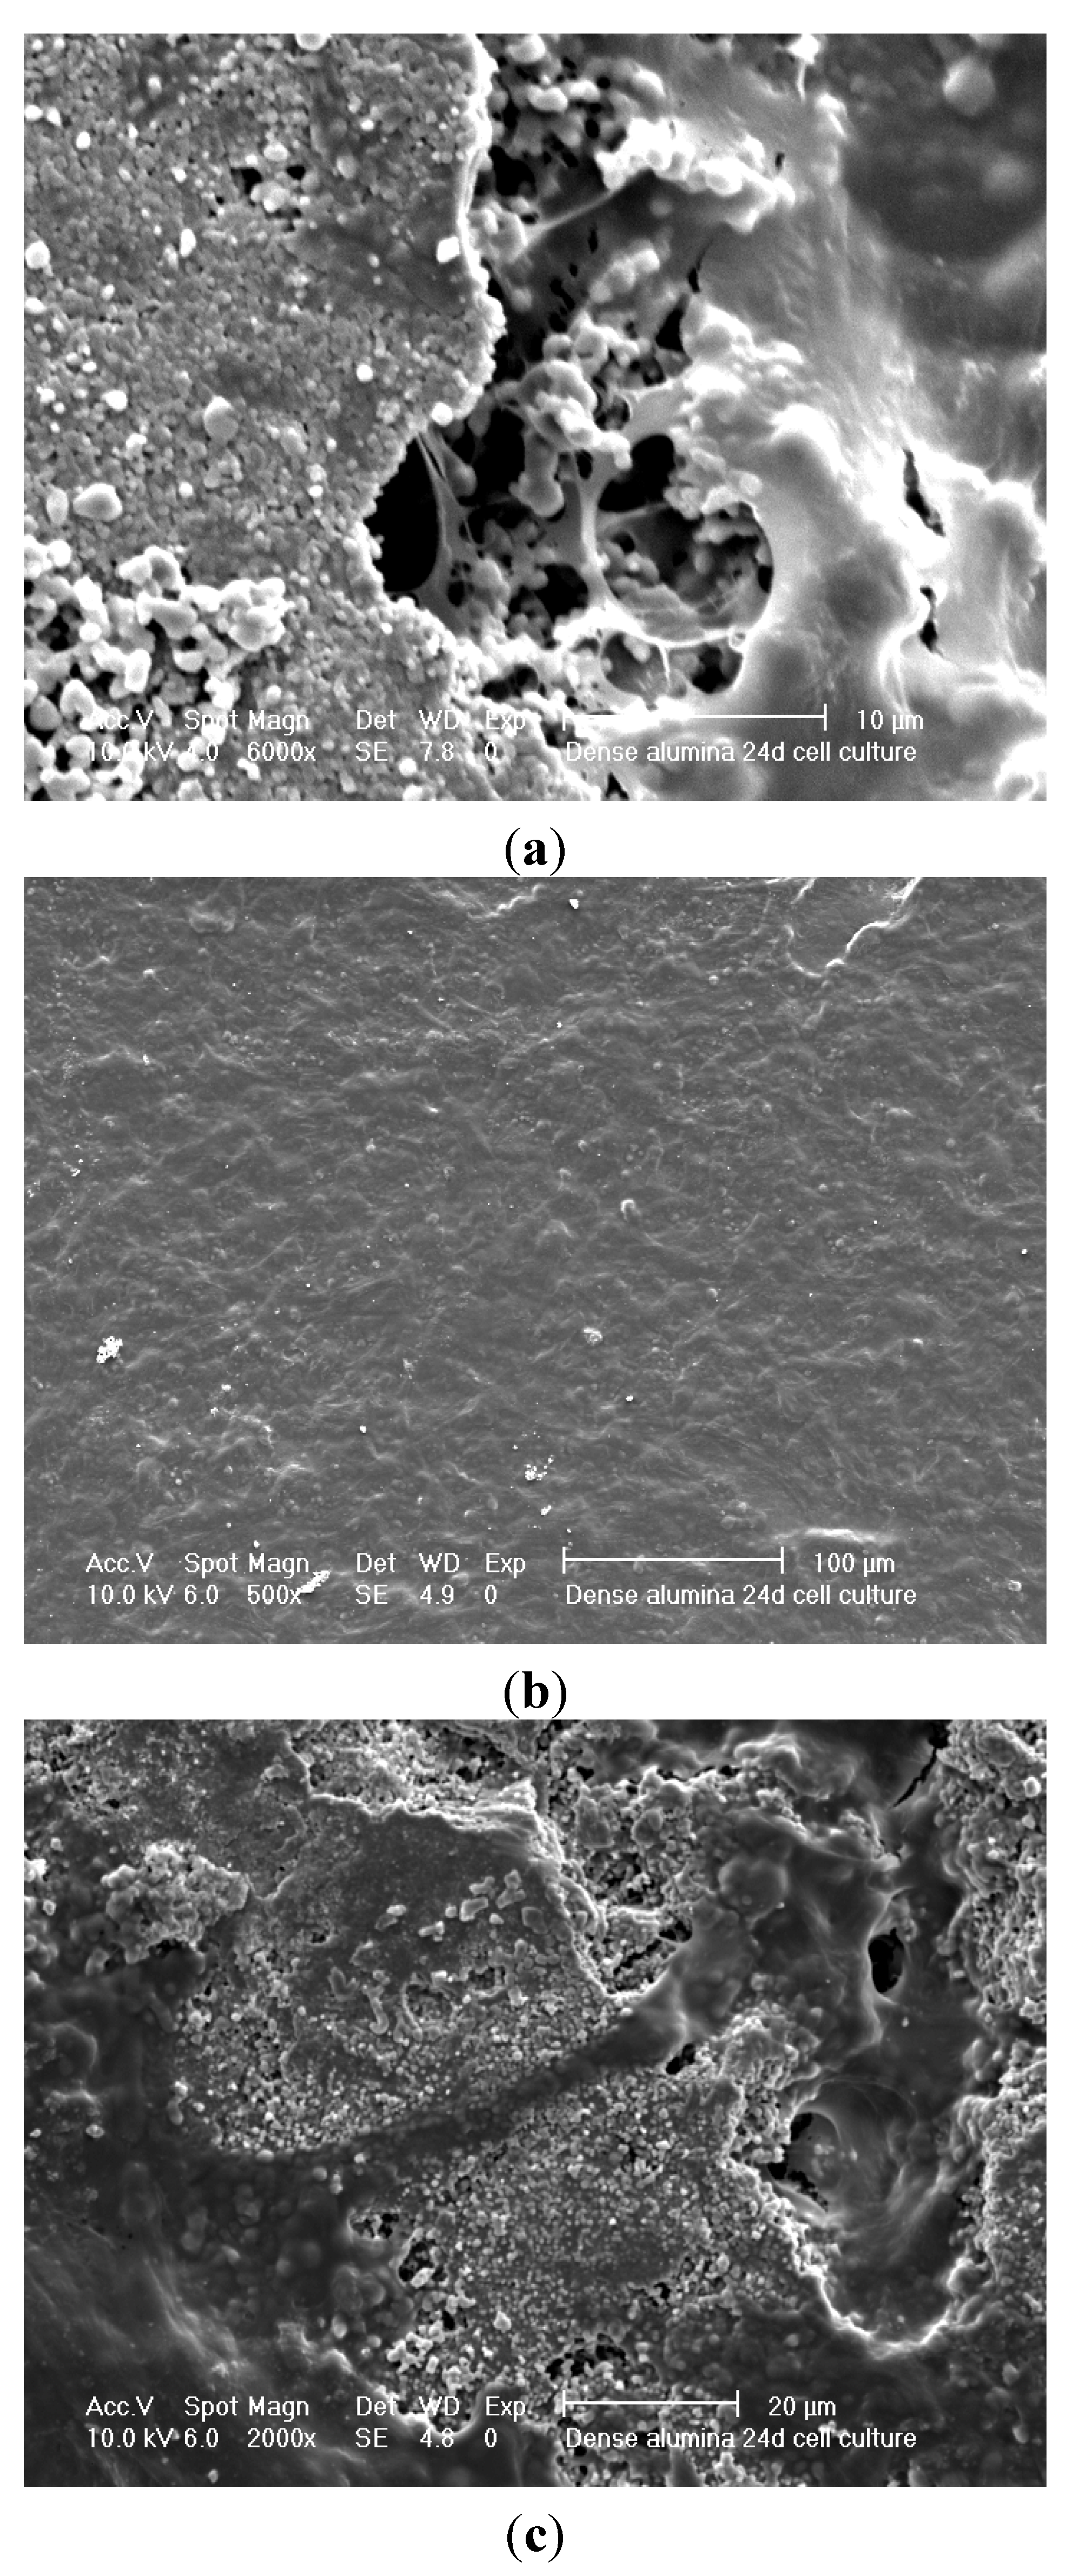
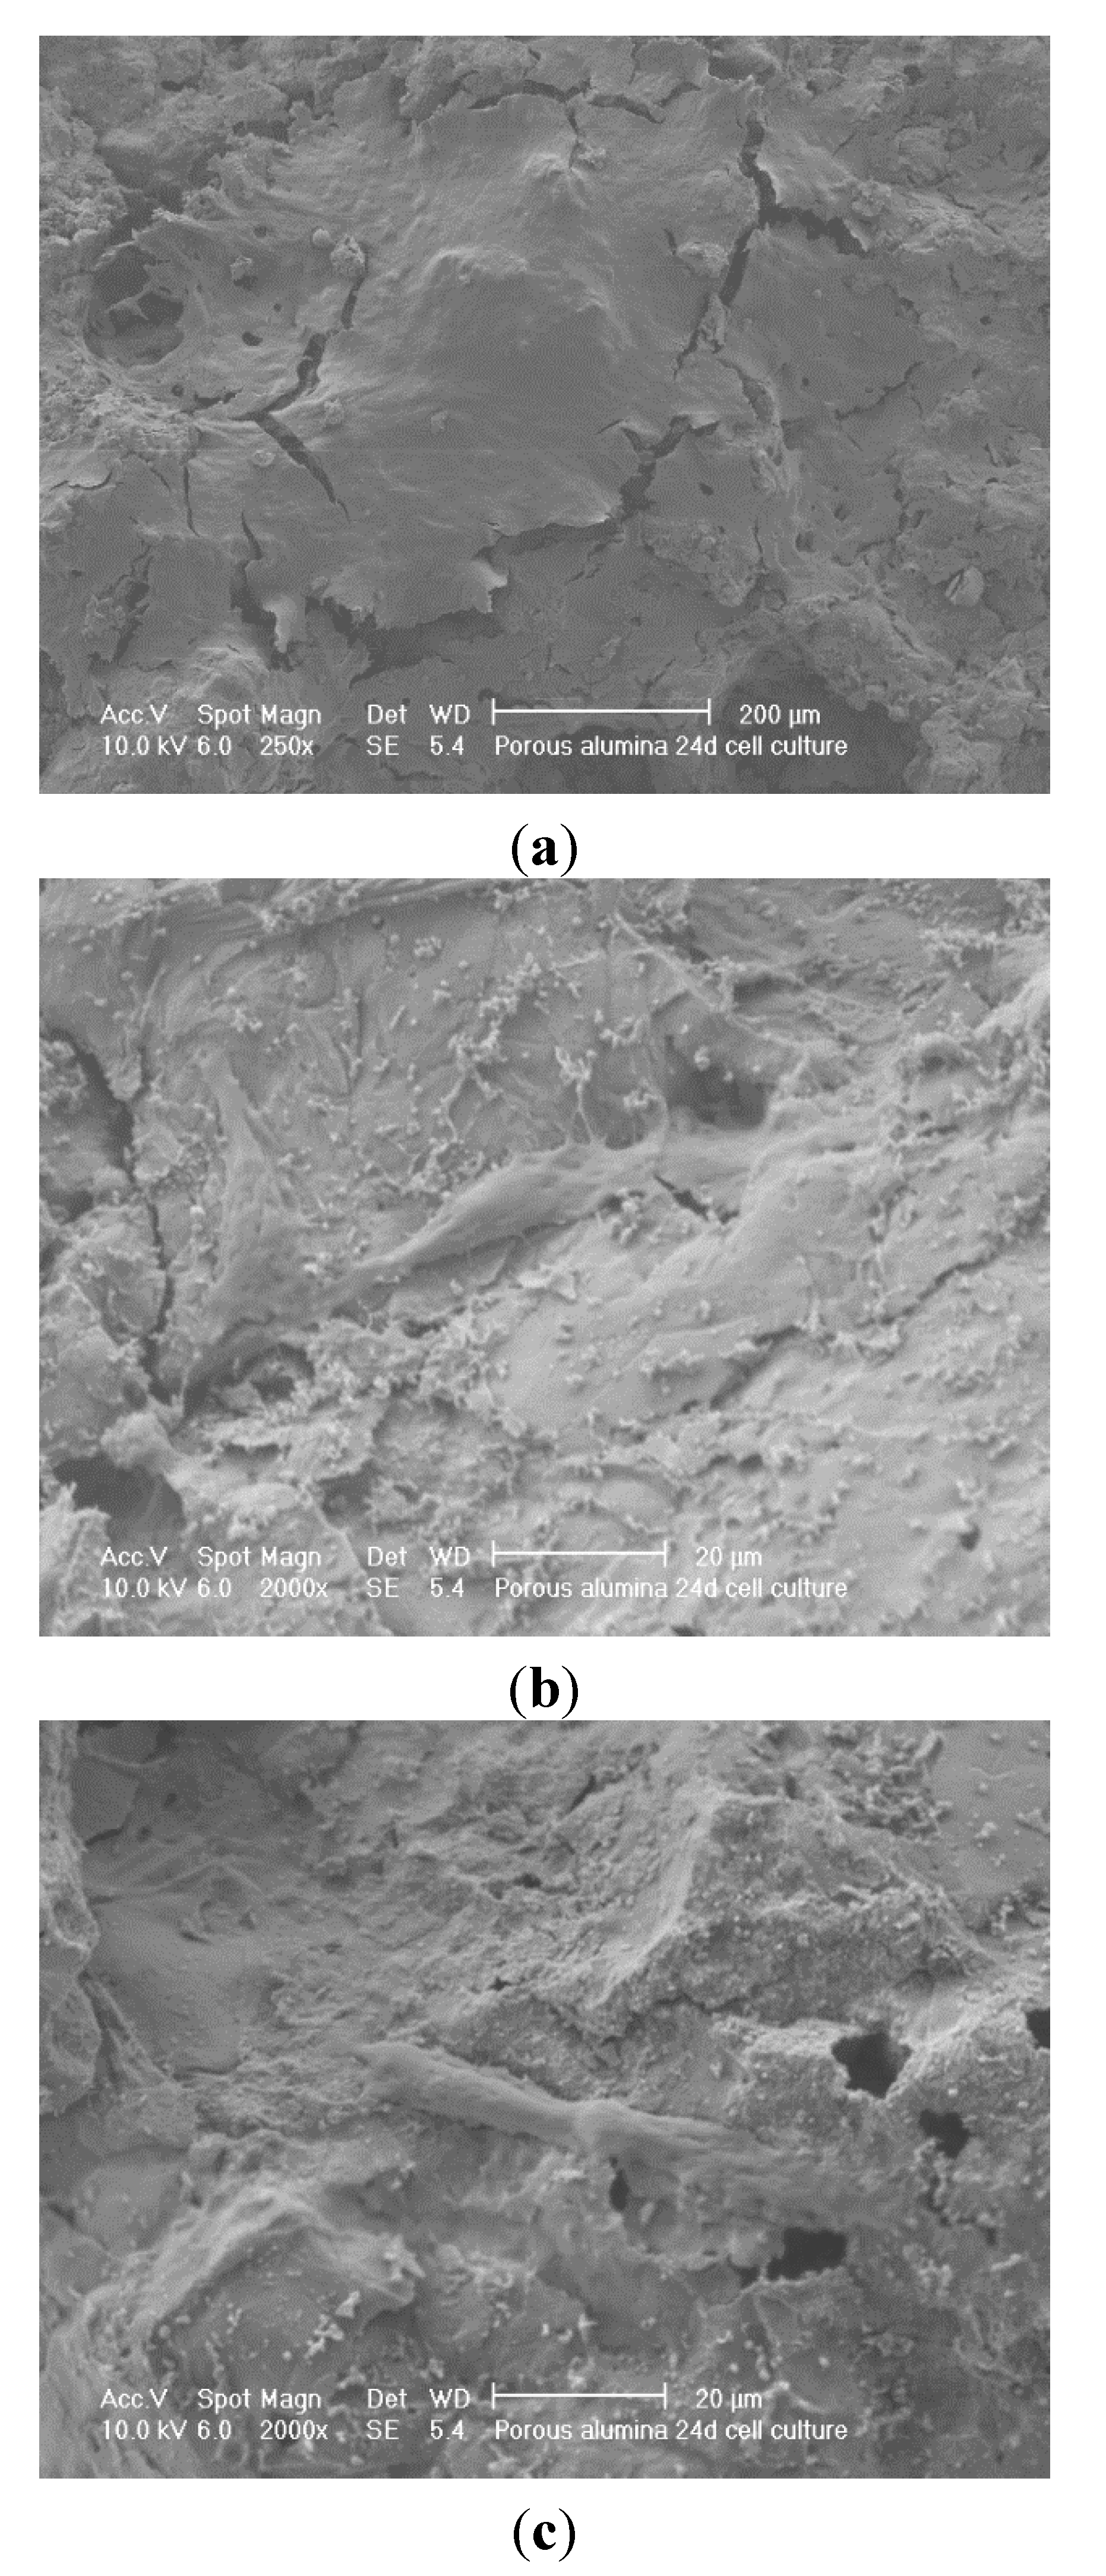
Figure 12 shows SEM micrographs of a 24 day cell culture on porous alumina Sample A.
Figure 13 shows SEM micrographs of a 24 day cell culture on less porous alumina Sample B. There is a confluent layer on the less porous alumina Sample B and very few cells on the porous alumina Sample A.
Figure 12.
SEM micrographs of 24d culture on porous alumina Sample A; (a) no cells on alumina; (b) cells attaching to calcium phosphate particles; (c) single cell on alumina surface.
Figure 12.
SEM micrographs of 24d culture on porous alumina Sample A; (a) no cells on alumina; (b) cells attaching to calcium phosphate particles; (c) single cell on alumina surface.
Figure 13.
SEM micrographs of 24d culture on less porous alumina Sample B; (a) cells attaching in porous region; (b) confluent layer on ceramic surface; (c) cells connecting through a channel over the ceramic surface.
Figure 13.
SEM micrographs of 24d culture on less porous alumina Sample B; (a) cells attaching in porous region; (b) confluent layer on ceramic surface; (c) cells connecting through a channel over the ceramic surface.
It is worth noting here that there was no evidence of cell penetration into the porous alumina from the confocal microscopy. The ideal outcome is a relatively thin confluent layer and significant penetration into the pores of the material. The confluent layer can be seen in
Figure 13b and separate cells growths connecting in
Figure 13c. Very few cells can be seen in
Figure 12, only single cells that do not join in
Figure 12b,c. In
Figure 12b, the cell seems to be attached to the calcium phosphate particles. These calcium phosphate particles were those previously found after heat treatment of the pre-treated and SBF soaked alumina samples.
In previous findings in
Figure 9 the calcium phosphate crystals are far more obvious after heat treatment especially on less porous alumina. It is probable that the osteoblast-like cells were actually attached to these calcium phosphate crystals. It was expected that the calcium phosphate crystals on the surface of the alumina would significantly aid cell attachment and proliferation.
This finding of limited but significant cellular response to calcium phosphate coated alumina, and the enhancement achieved through the calcium phosphate coating, is supported by other researchers. While no published report has addressed cell-culturing of SBF-coated alumina, published reports on calcium phosphate coated alumina coated by other methods support this general finding.
Osteoblastic cell growth has been previously successful on nano-porous alumina, with no calcium phosphate coating, with cells rapidly spreading, flattening and adhering firmly to the surface of the material [
14]. Another study showed a similar result where alumina only and alumina and calcium phosphate multi-component ceramics were tested with an osteoblastic cell line. However, the initial cell-attachment efficiency was better with the calcium phosphate coating in a five day cell culture, and the differentiation of osteoblastic cells was better with the alumina samples with calcium phosphate coatings [
2,
15].
Confocal microscopy was chosen as a technique to view the cell ingrowth through the ceramic sample. The osteoblast-like cells were auto-florescent and therefore a wavelength could be chosen to view the cells only and not the ceramic. Therefore the results display the thickness of the cellular layer and any cell ingrowth into the ceramic and away from the confluent layer will be apparent.
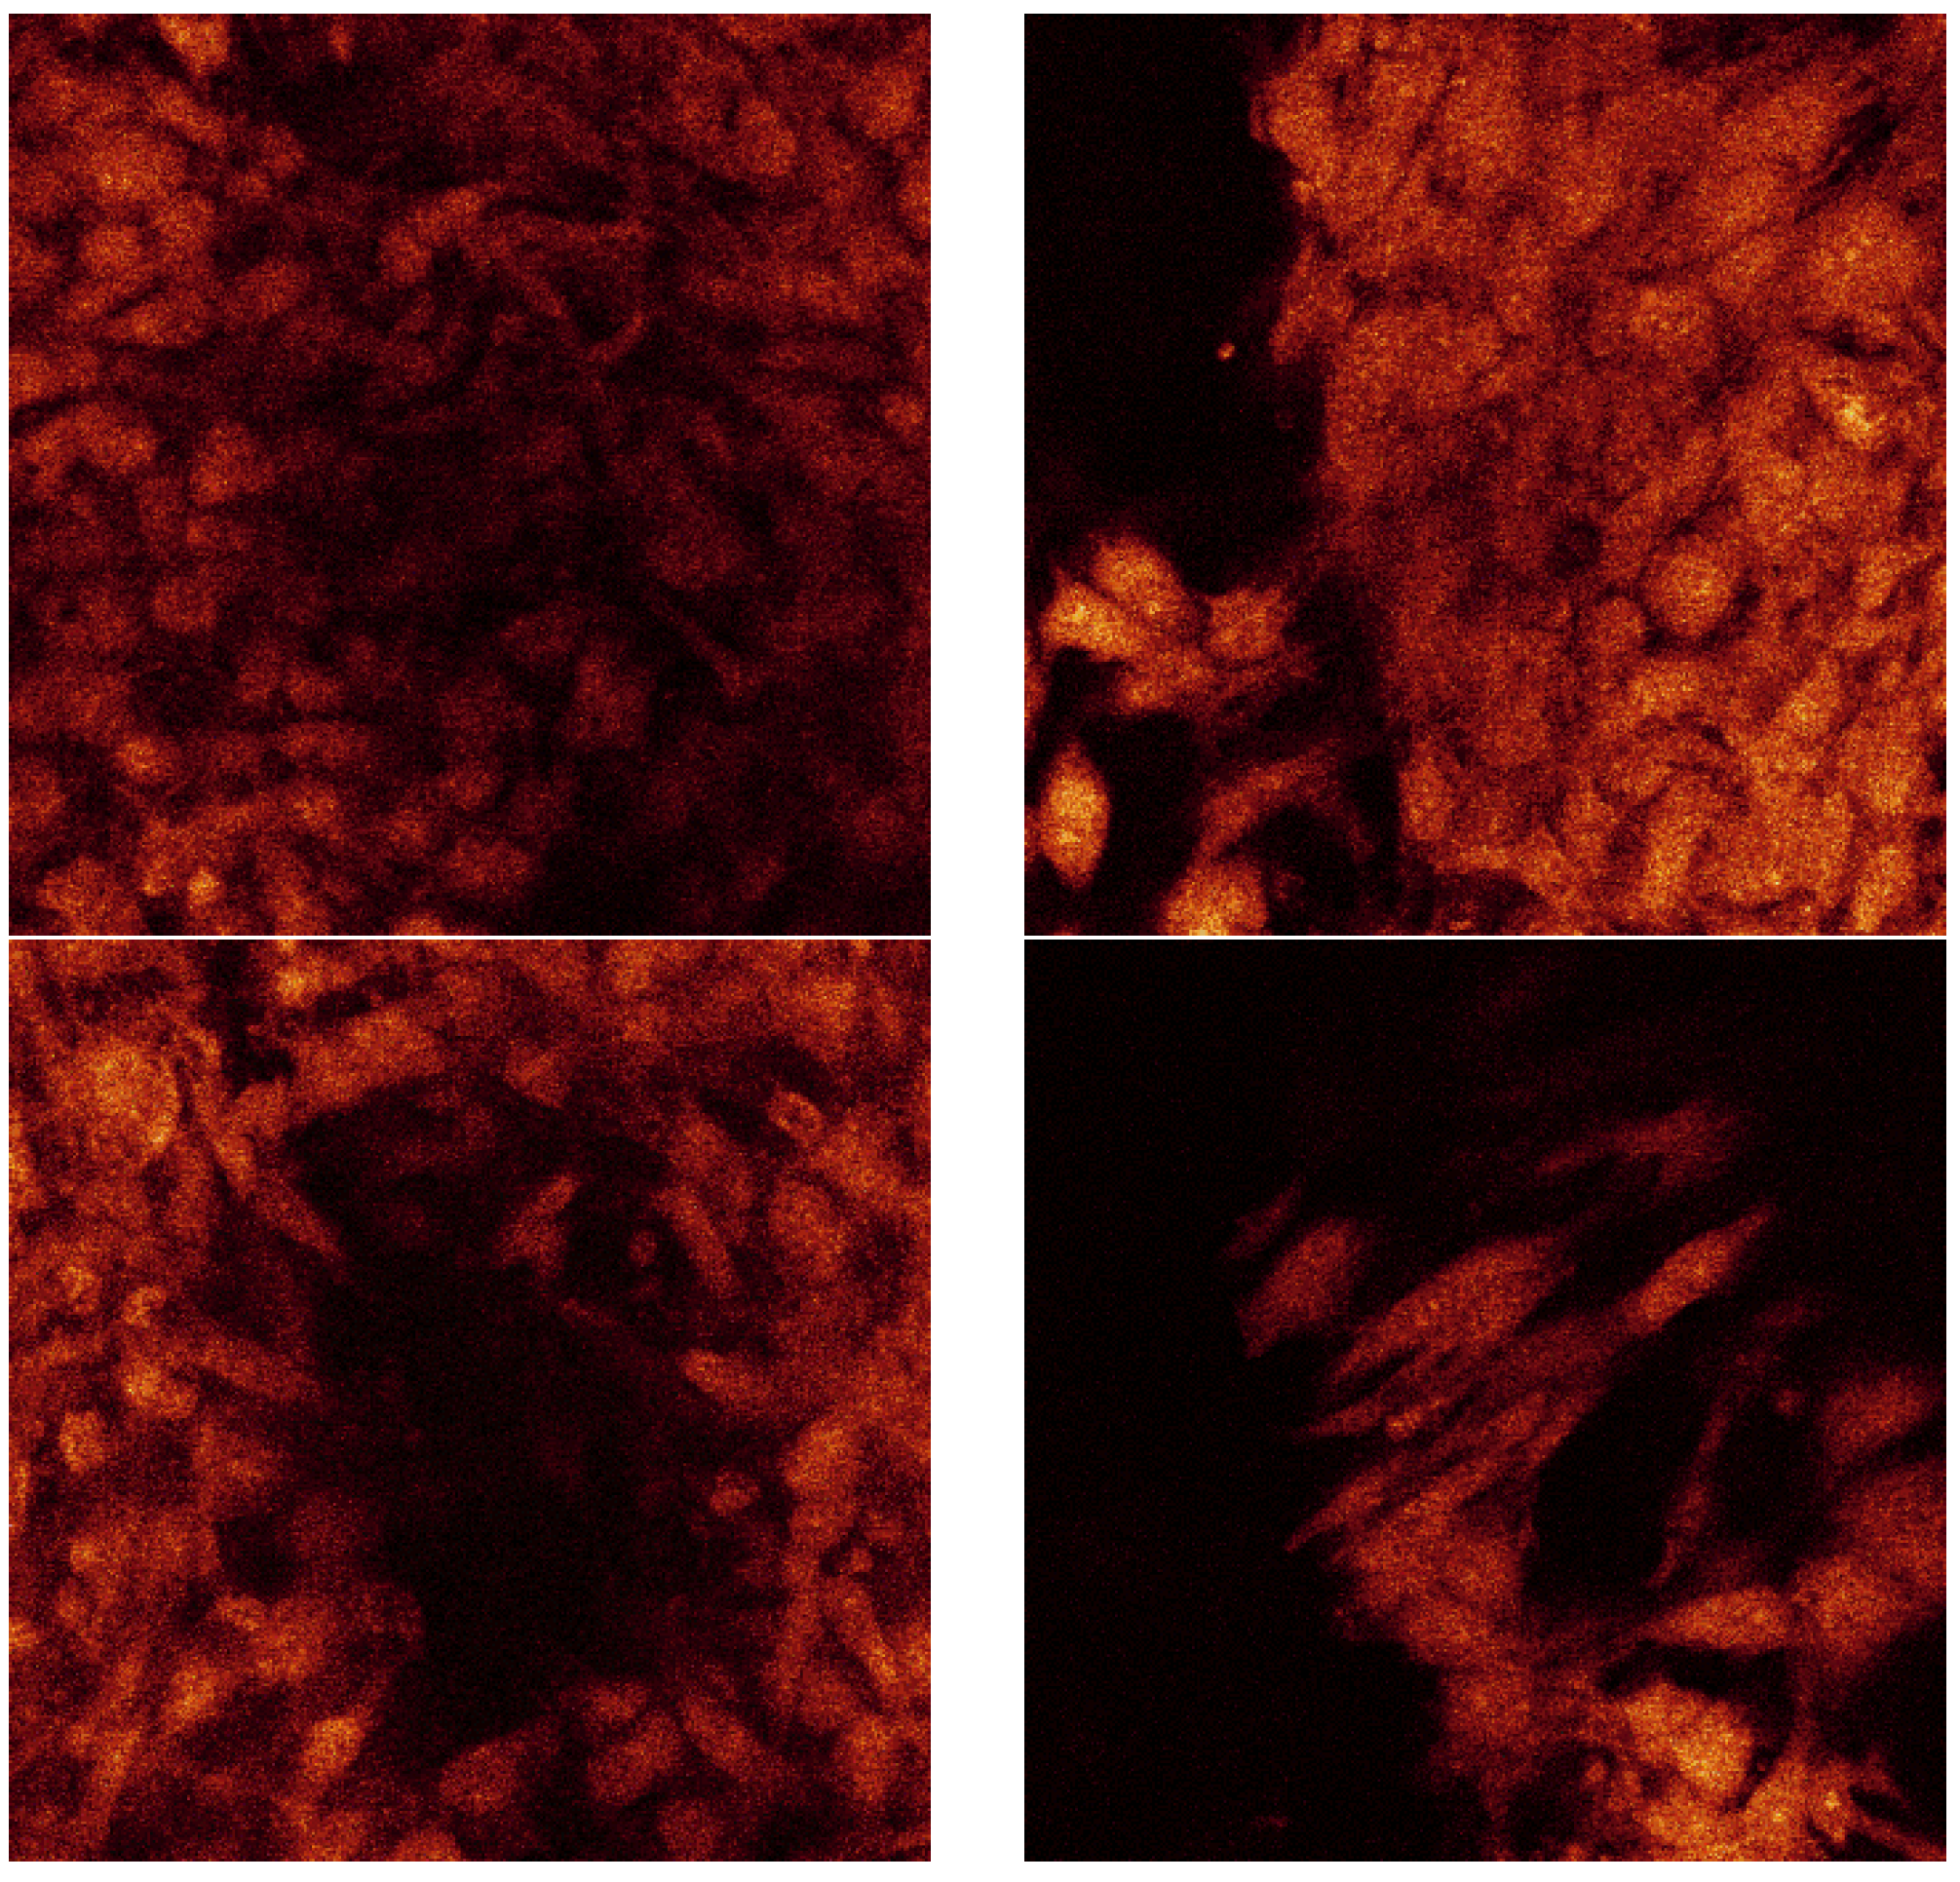
Figure 14 is a confocal raw data series displayed from consistent displacements through the thickness of the less porous alumina Sample B. The dimensions of each of these sections are 238 µm by 238 µm. The section thicknesses are ~0.4 µm as there were 173 Sections through a depth of 69 µm.
Figure 14.
Confocal raw data series taken at random distance through the cell layer on the SBF coating on less porous alumina Sample B.
Figure 14.
Confocal raw data series taken at random distance through the cell layer on the SBF coating on less porous alumina Sample B.
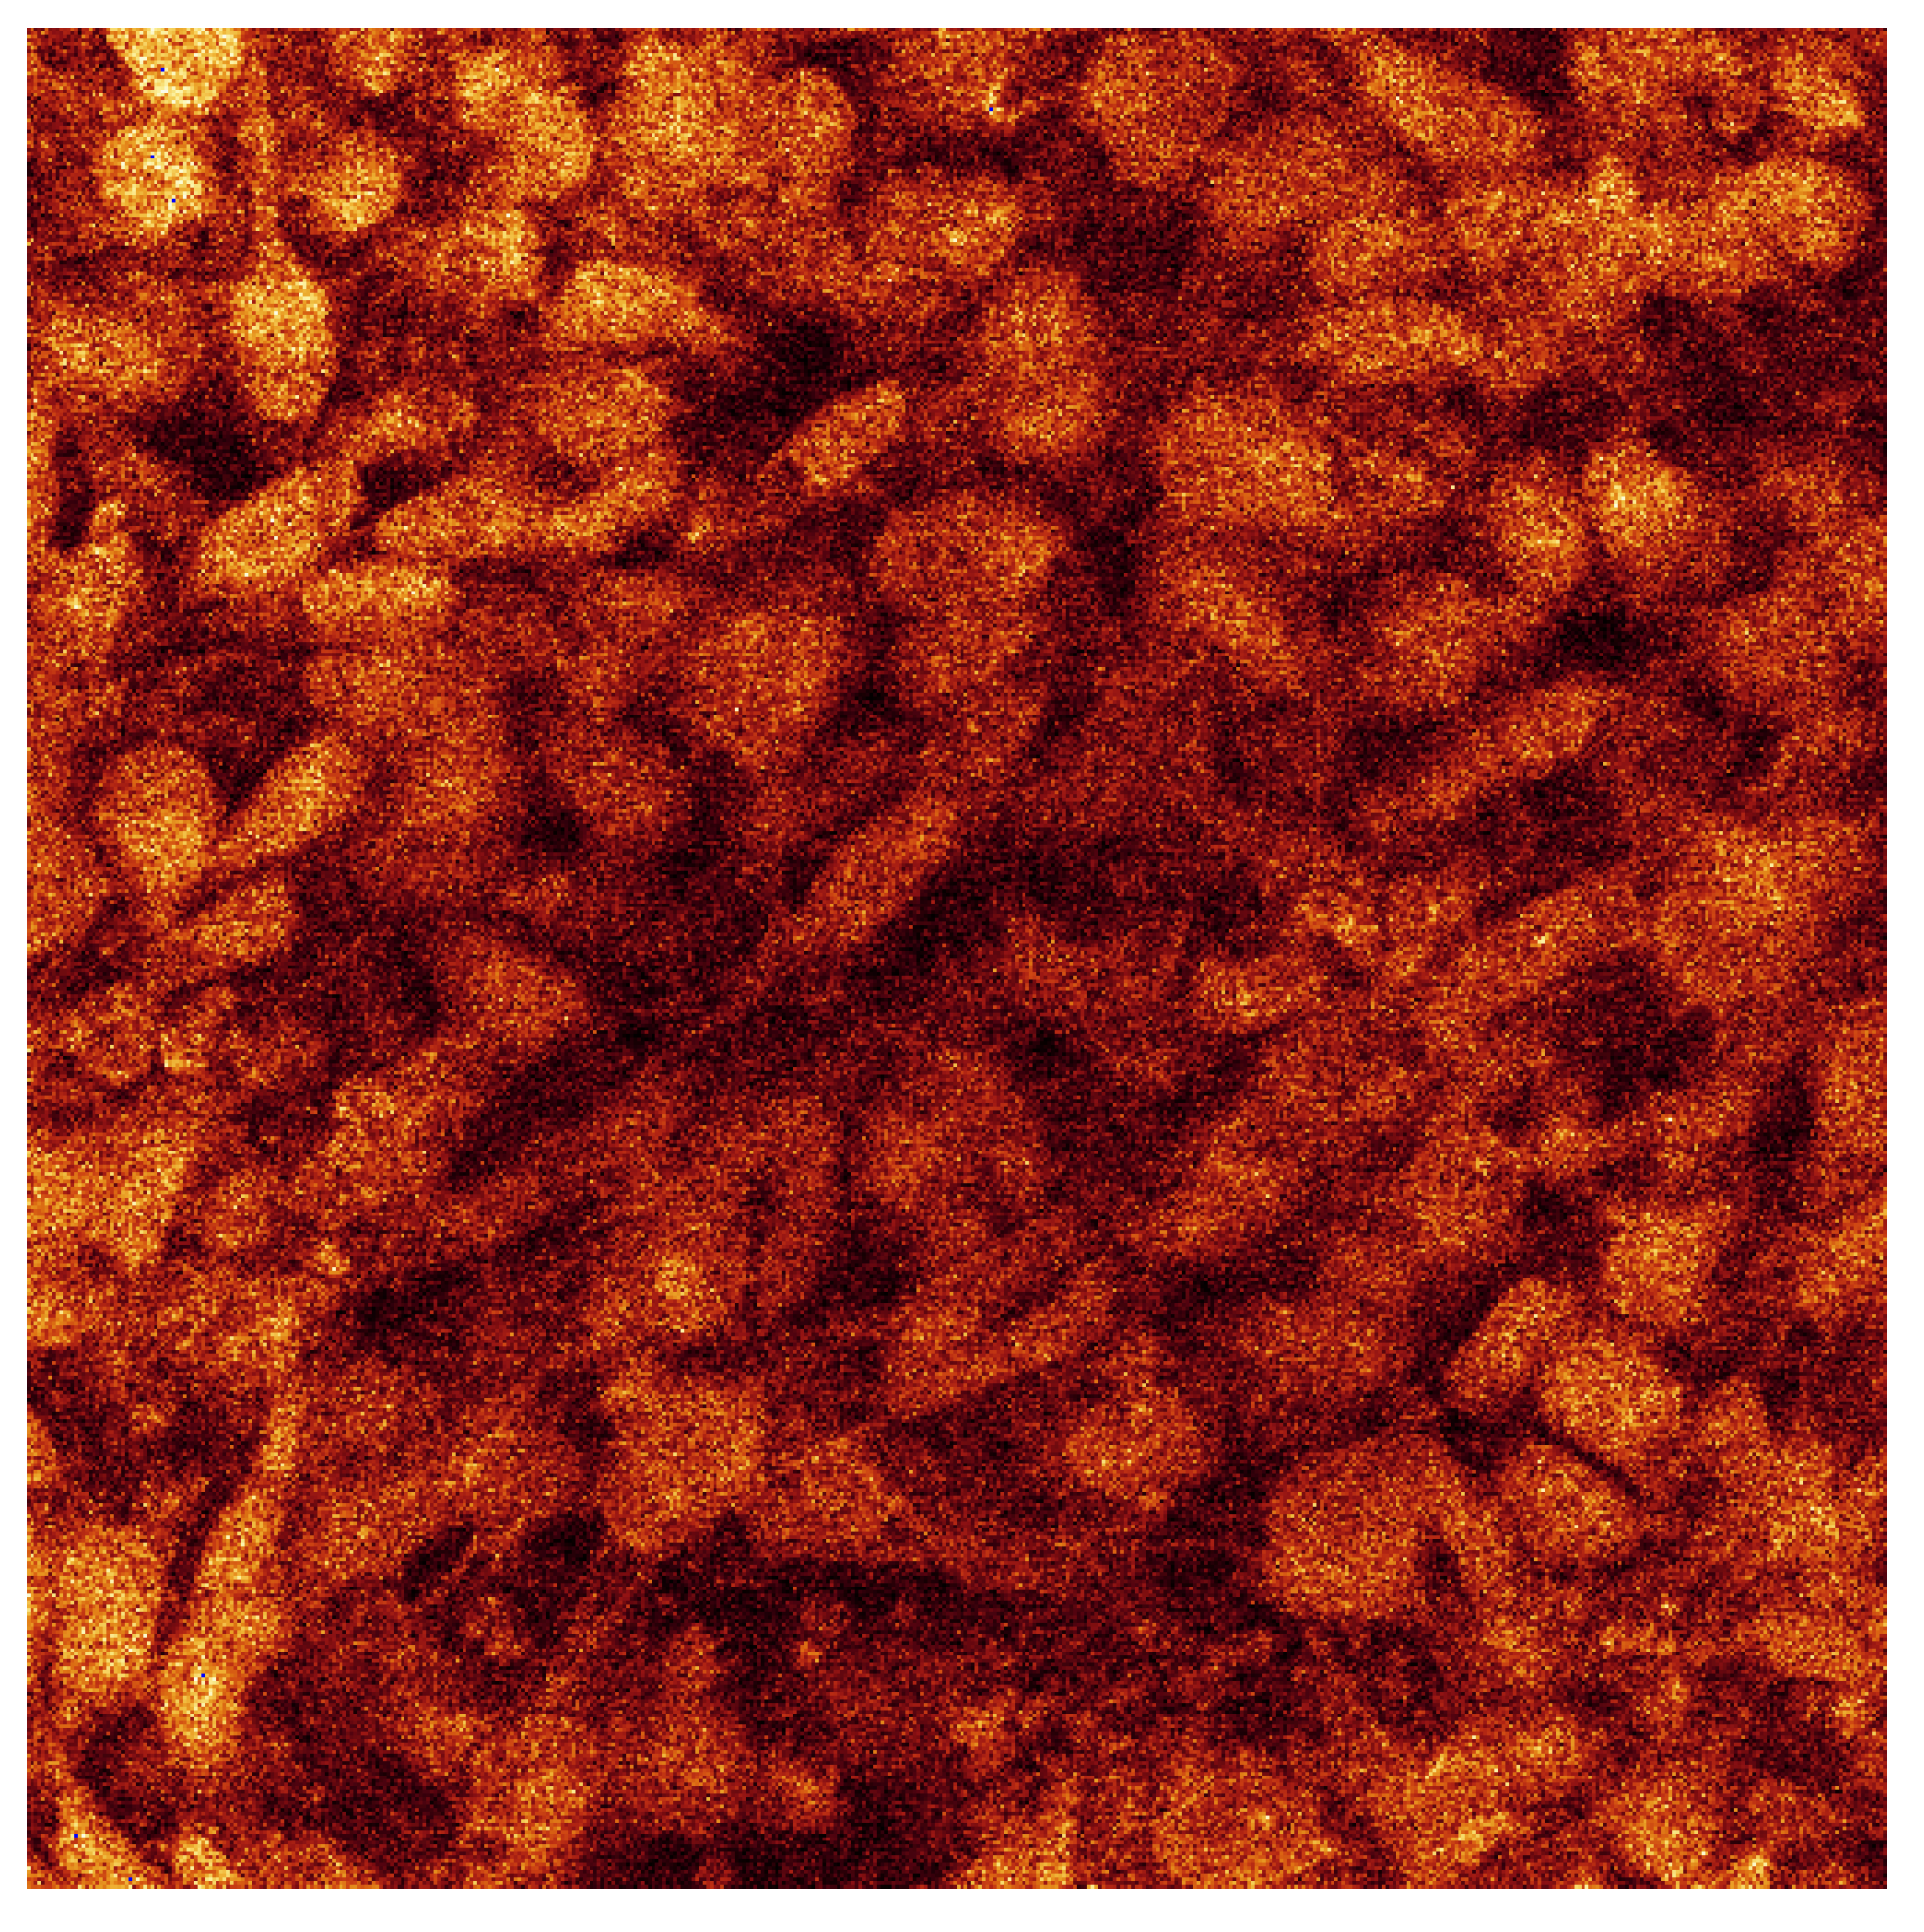
Figure 15 shows the agglomeration of the separate raw data images all in one picture.
Figure 15.
Confocal microscopy image all 173 sections for cell culture on SBF coating on less porous alumina Sample B.
Figure 15.
Confocal microscopy image all 173 sections for cell culture on SBF coating on less porous alumina Sample B.
Figure 16 is the 3D rendered images from the raw data series.
Figure 16.
3D rendered confocal image of less porous alumina Sample B with SBF coating that was sintered with 24d cell culture.
Figure 16.
3D rendered confocal image of less porous alumina Sample B with SBF coating that was sintered with 24d cell culture.
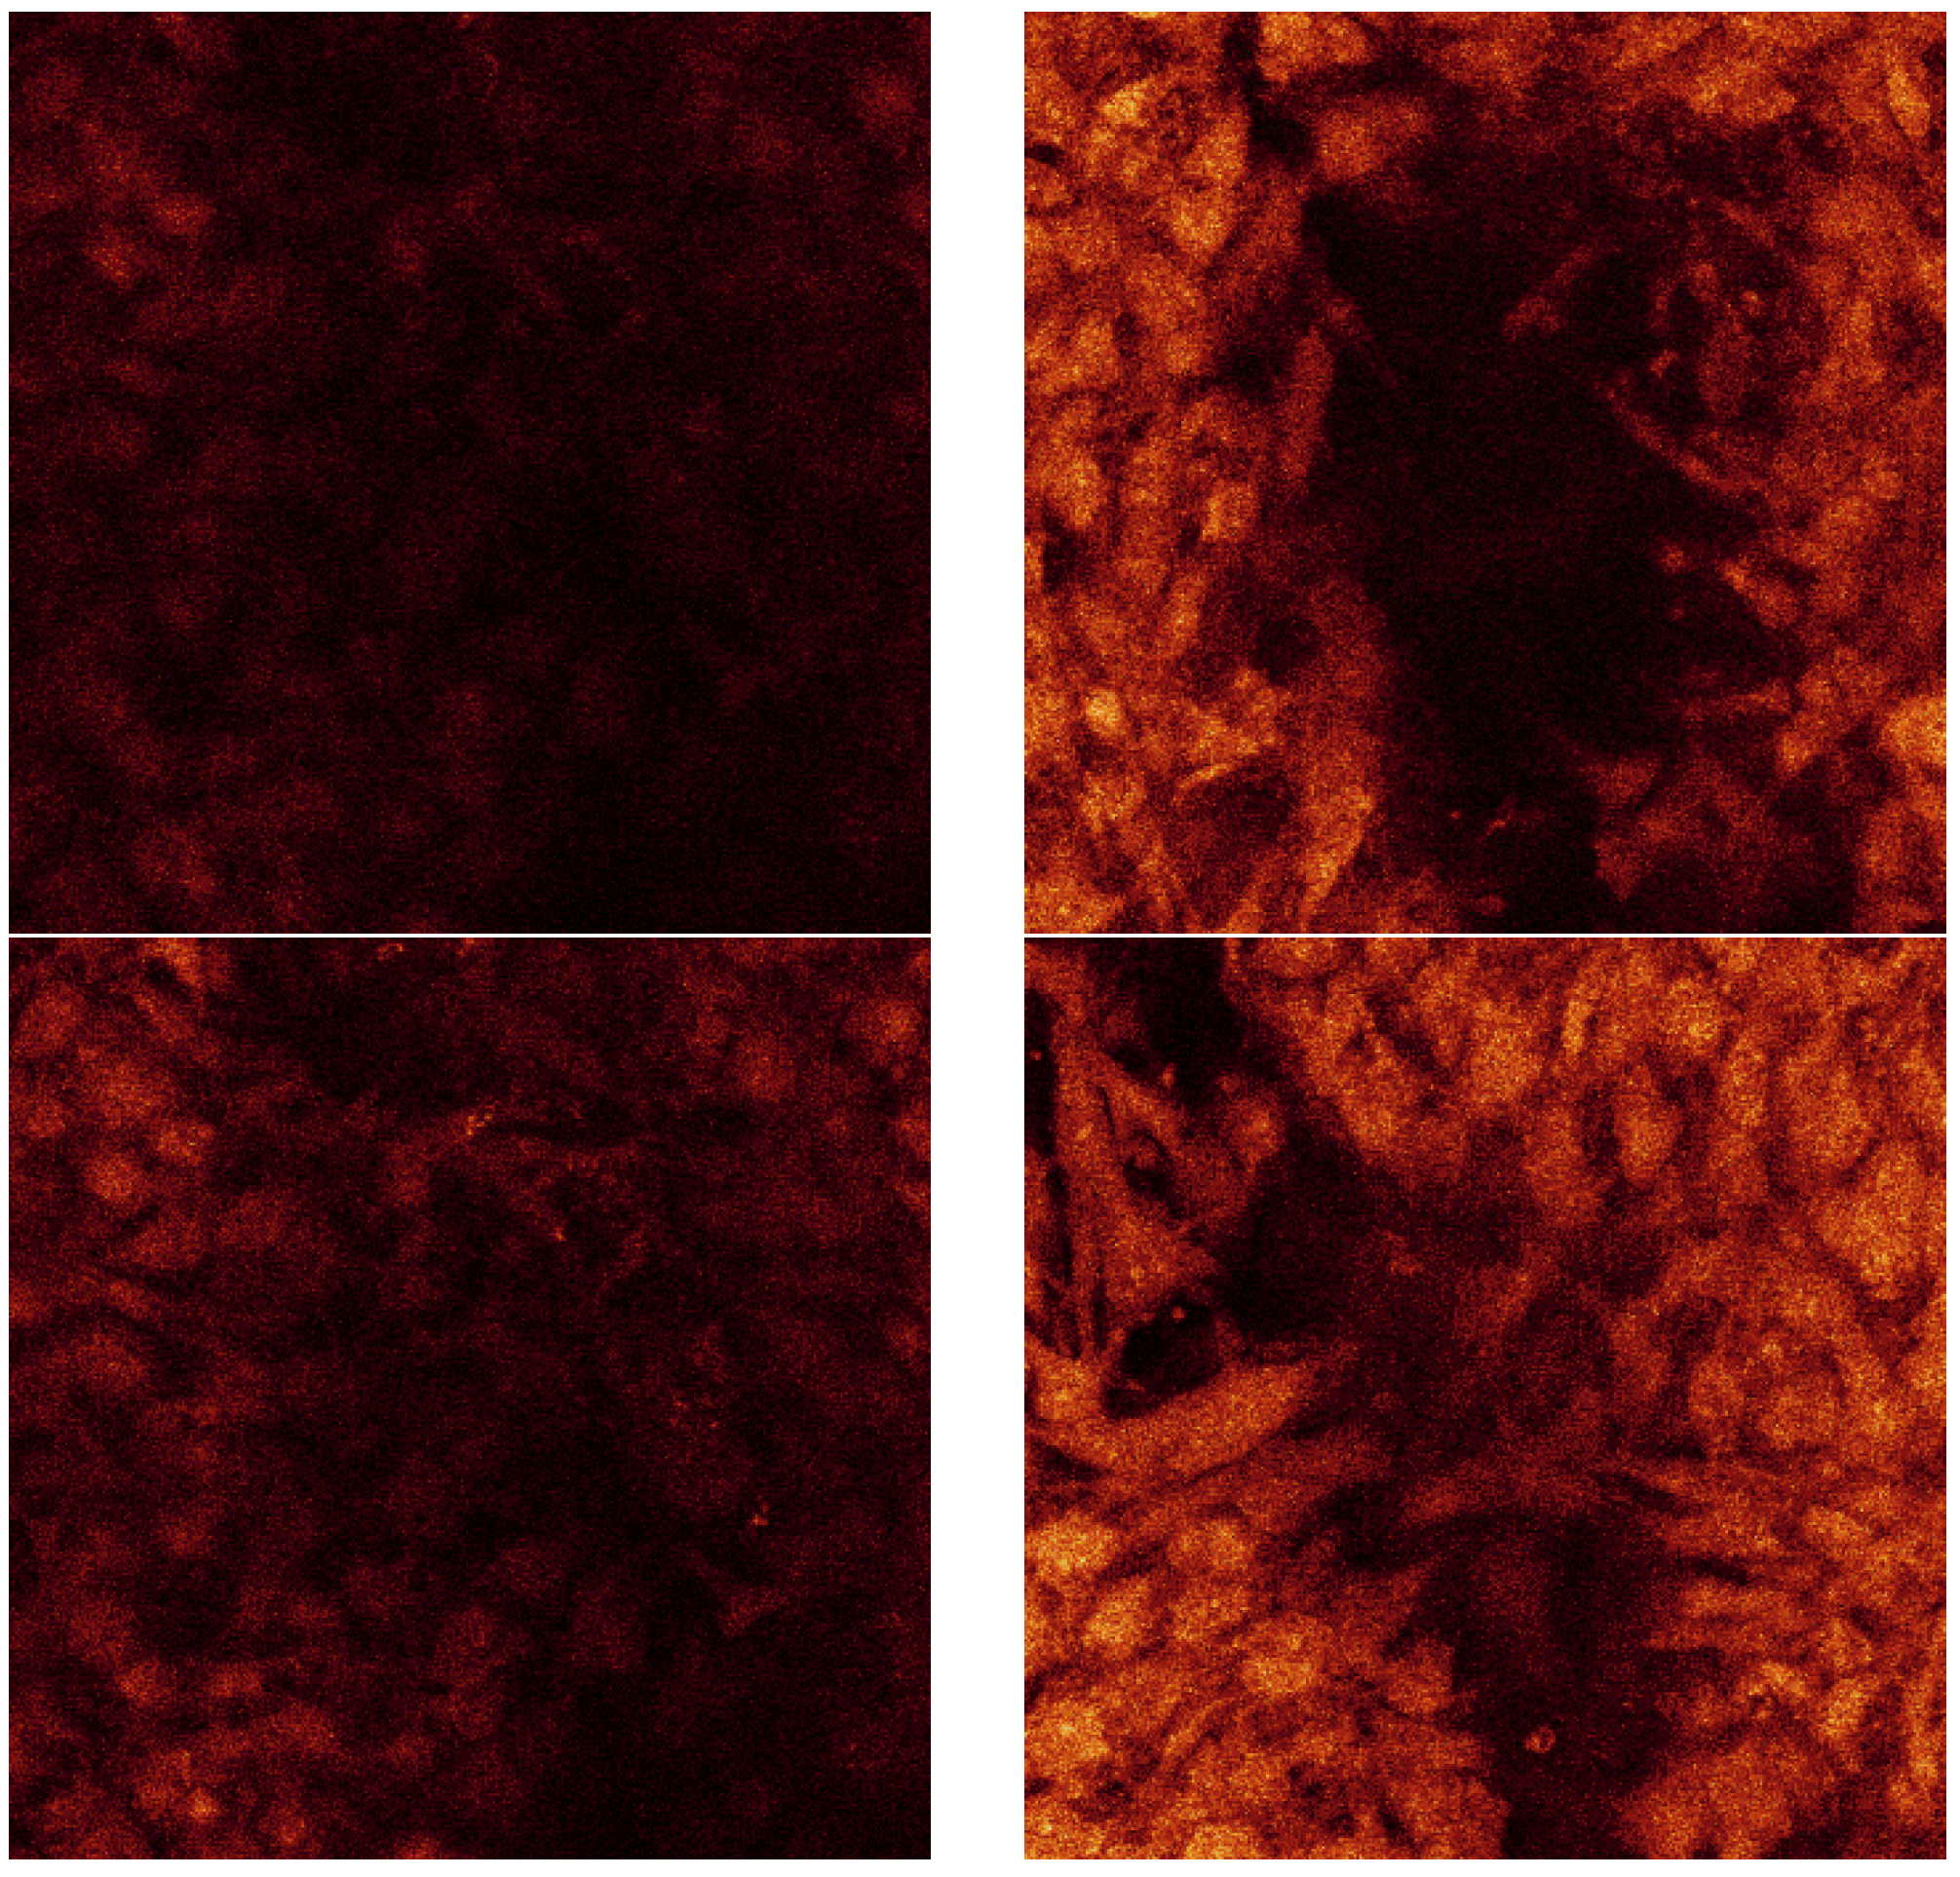
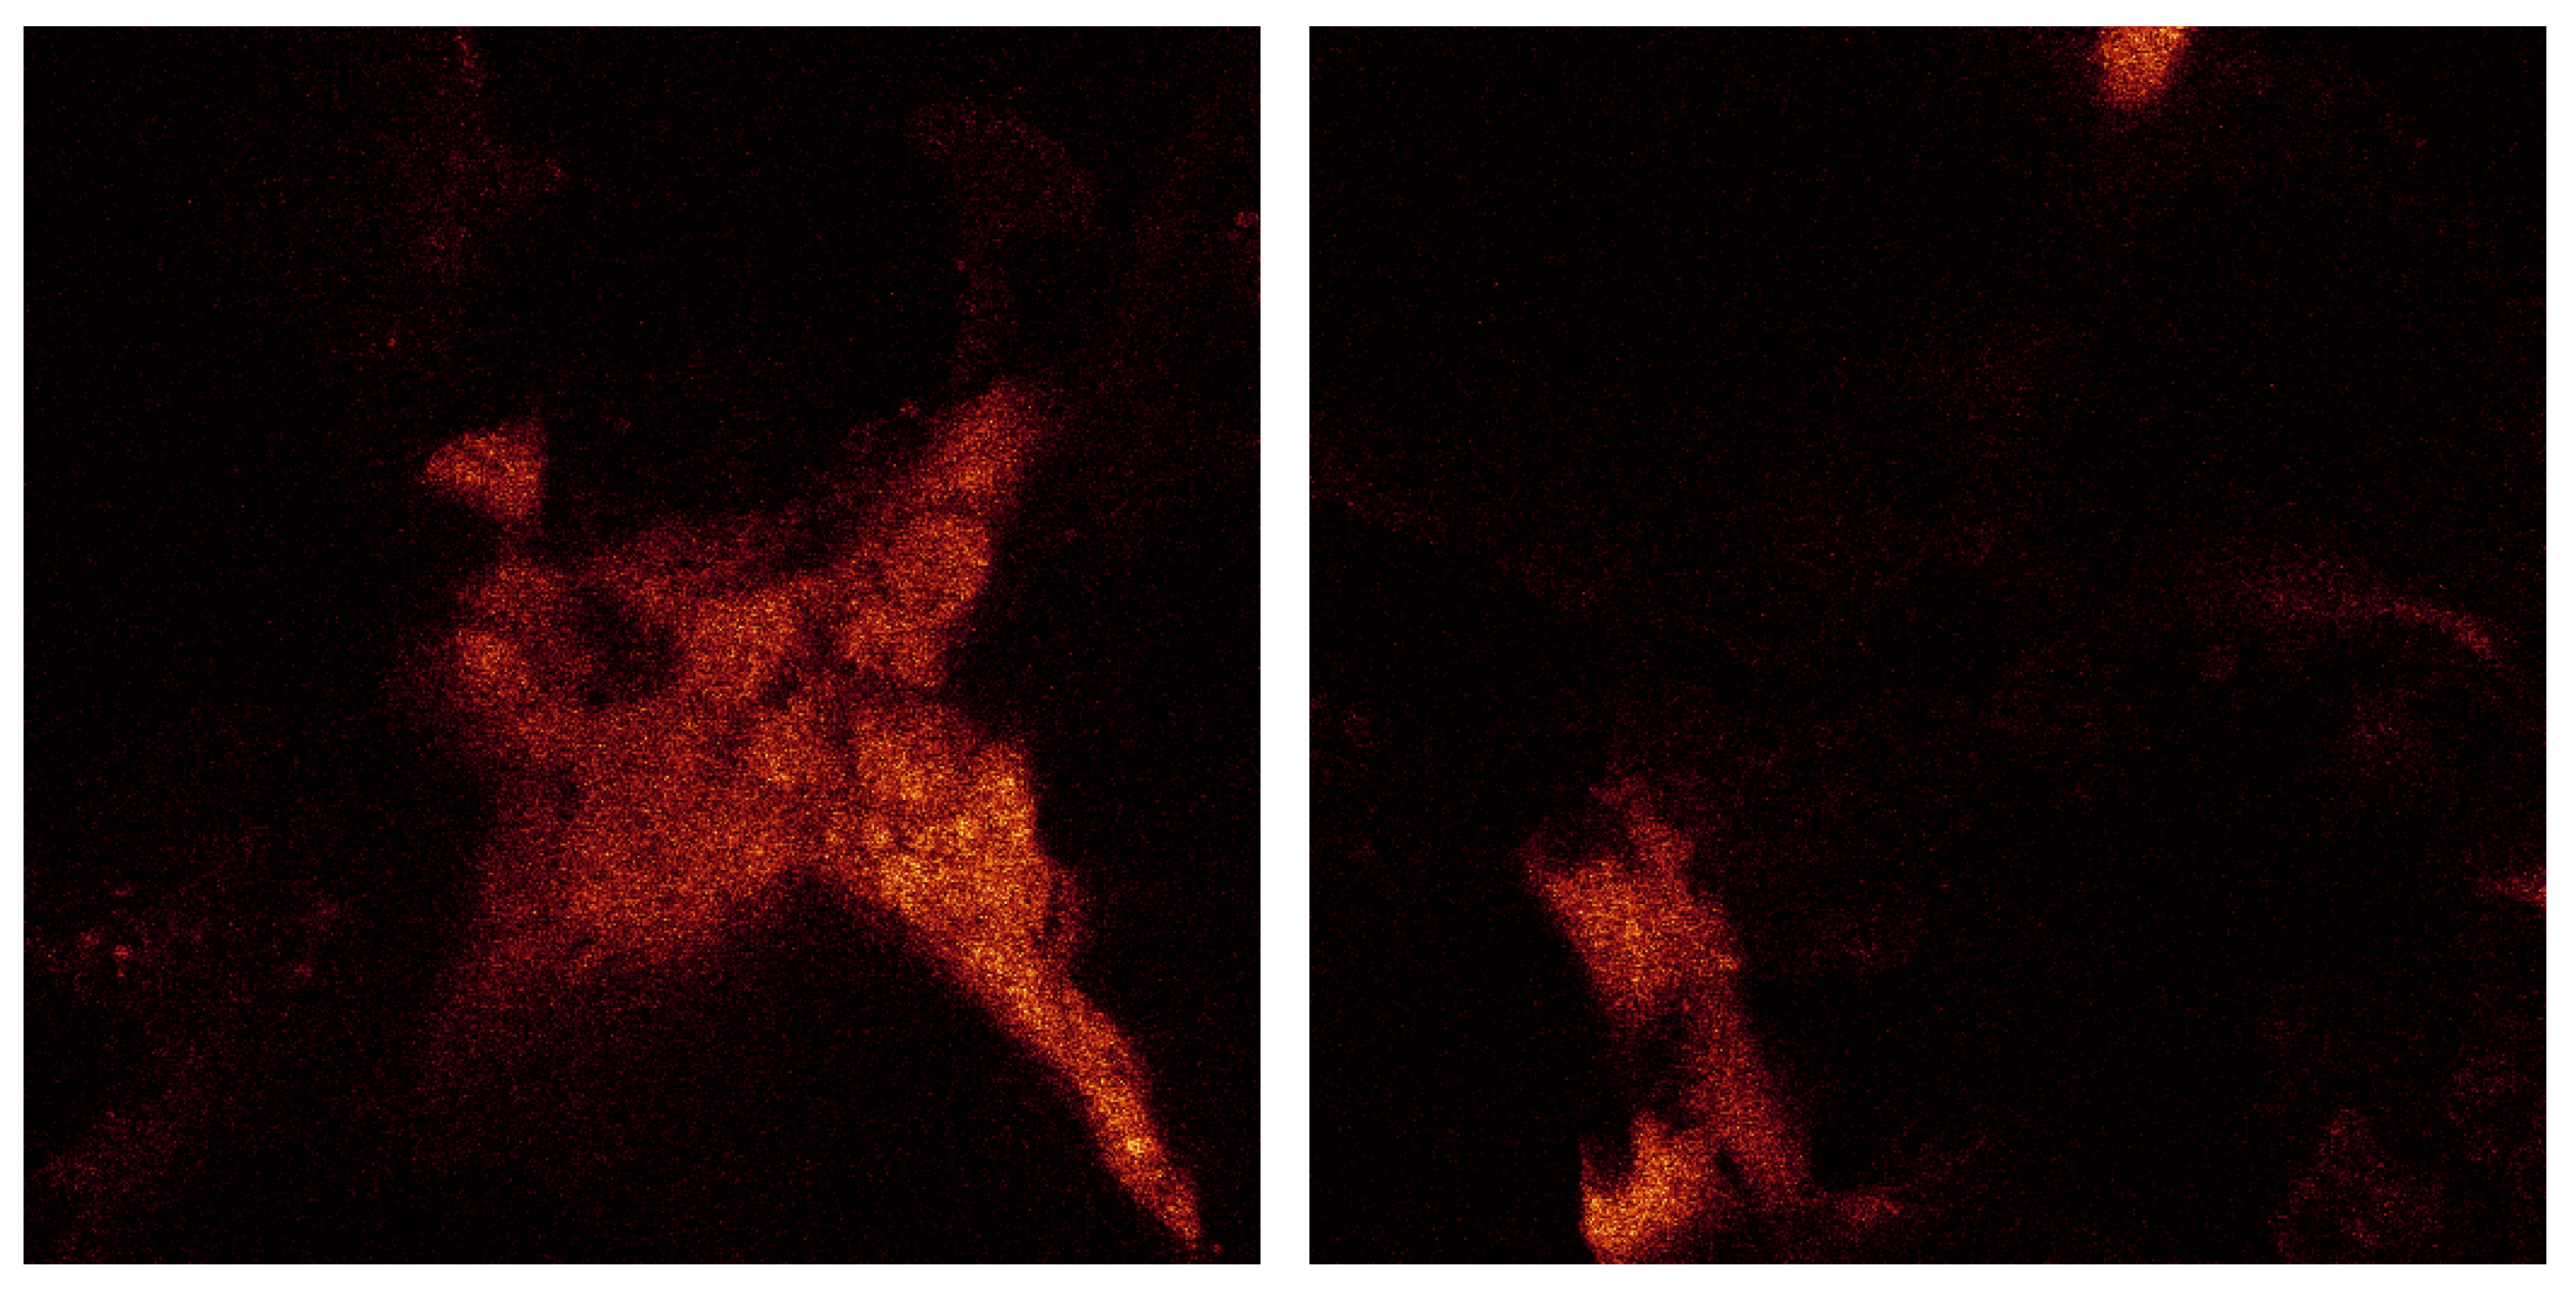
Figure 17 shows the confocal image taken of analysis of the porous alumina Sample A. The image on left has a length and width of 238 µm and cross-section depth of 69 µm. The image on right has a length and width of 238 µm and cross-section depth is 102 µm.
Figure 17.
Confocal microscopy image of cells on SBF coating on porous alumina Sample A. There is very little cell coverage even after 24 day cell culture. Results confirm SEM analysis.
Figure 17.
Confocal microscopy image of cells on SBF coating on porous alumina Sample A. There is very little cell coverage even after 24 day cell culture. Results confirm SEM analysis.
The dimension of each of these sections is 238 µm by 238 µm. For the series displayed in
Figure 14 the section thicknesses are ~0.4 µm as there were 173 sections through a depth of 68 µm. This indicates that the cell layer thickness on the less porous alumina was approximately 68 µm. The alumina sample is not included in this calculation as the confocal image does not scan the ceramic. The cell layer on this sample appears to be thick, especially as viewed on the 3D rendered series in
Figure 16. This series shows the cell morphology as it contours to the surface of the ceramic. It appears that the attached cells are in multiple cell layers. This gives an indication of cell thickness, if a bone cell is approximately 10 µm in dimension and the cell layer is approximately 60 µm, then the cell layer may be up to six cells deep.
The 3D rendered images in
Figure 16 also present information of cell ingrowth. There appears to be only a little cellular ingrowth away from the confluent layer. This is expected as it was a less porous alumina sample that was tested. Large porous regions were not available for cellular ingrowth. Possibly the cells followed the micro-porosity of the surface and therefore matched the surface topography. The cells have covered the alumina sample including a bump in the centre of the images.
In the rendered series, this topography is evident on the cellular growth. The top cell layer is evident by the typical cellular shapes of elongated cells. The underside of the cell layer, the side closest to the ceramic, has a different cellular morphology. The cells that are closest to the ceramic have a more round and less elongated morphology. The spinning series shows this phenomenon well. This is probably contributed to by the alumina surface. This is expected behaviour in a multi-layer.
Confocal analysis was also done on the porous alumina Sample A with less calcium phosphate crystals present after heat treatment. The results show very little cell coverage after the 24 day cell culture. During culture, the cell media in the sample wells did not turn the same pink-orange as the other samples. The alumina component of the sample may have had a negative effect, especially with less calcium phosphate present unlike the less porous alumina samples. Therefore, no further confocal analysis was done on these samples as the cell coverage was poor compared to the less porous alumina sample.


