
Surface Characterization and Photoluminescence Properties of Ce3+,Eu Co-Doped SrF2 Nanophosphor

 ,
,
Abstract
:1. Introduction
2. Results and Discussion
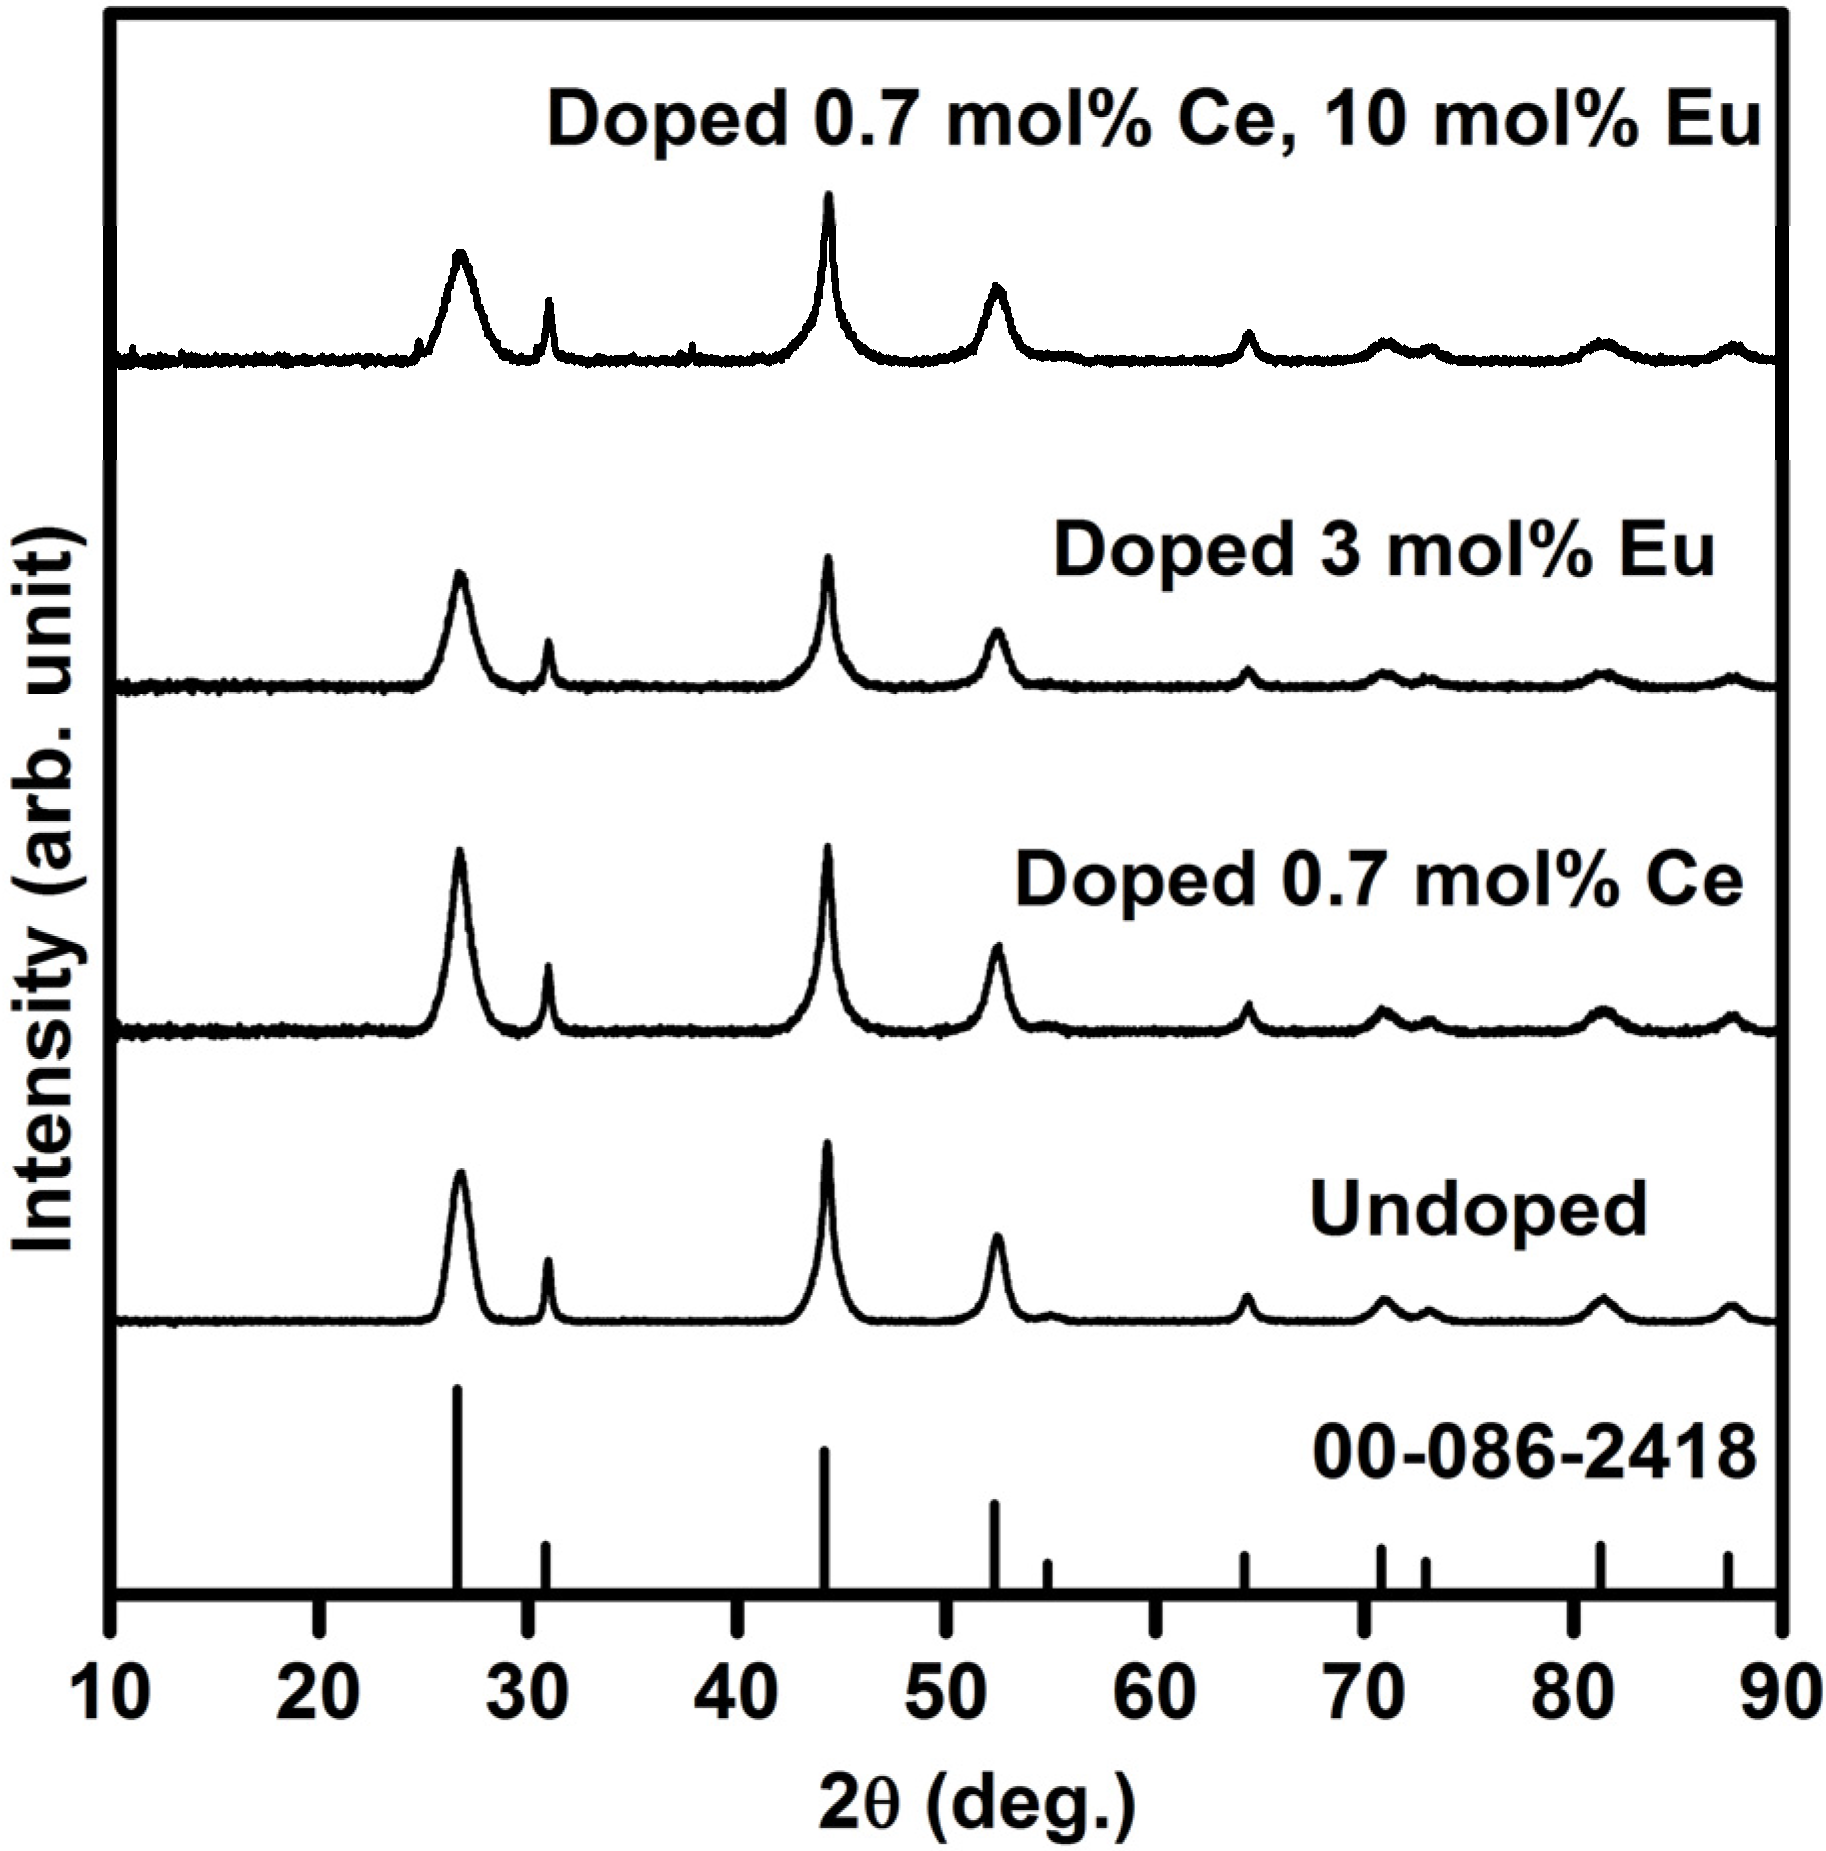
2.1. Structure Analysis
2.1.1. X-Ray Diffraction (XRD)

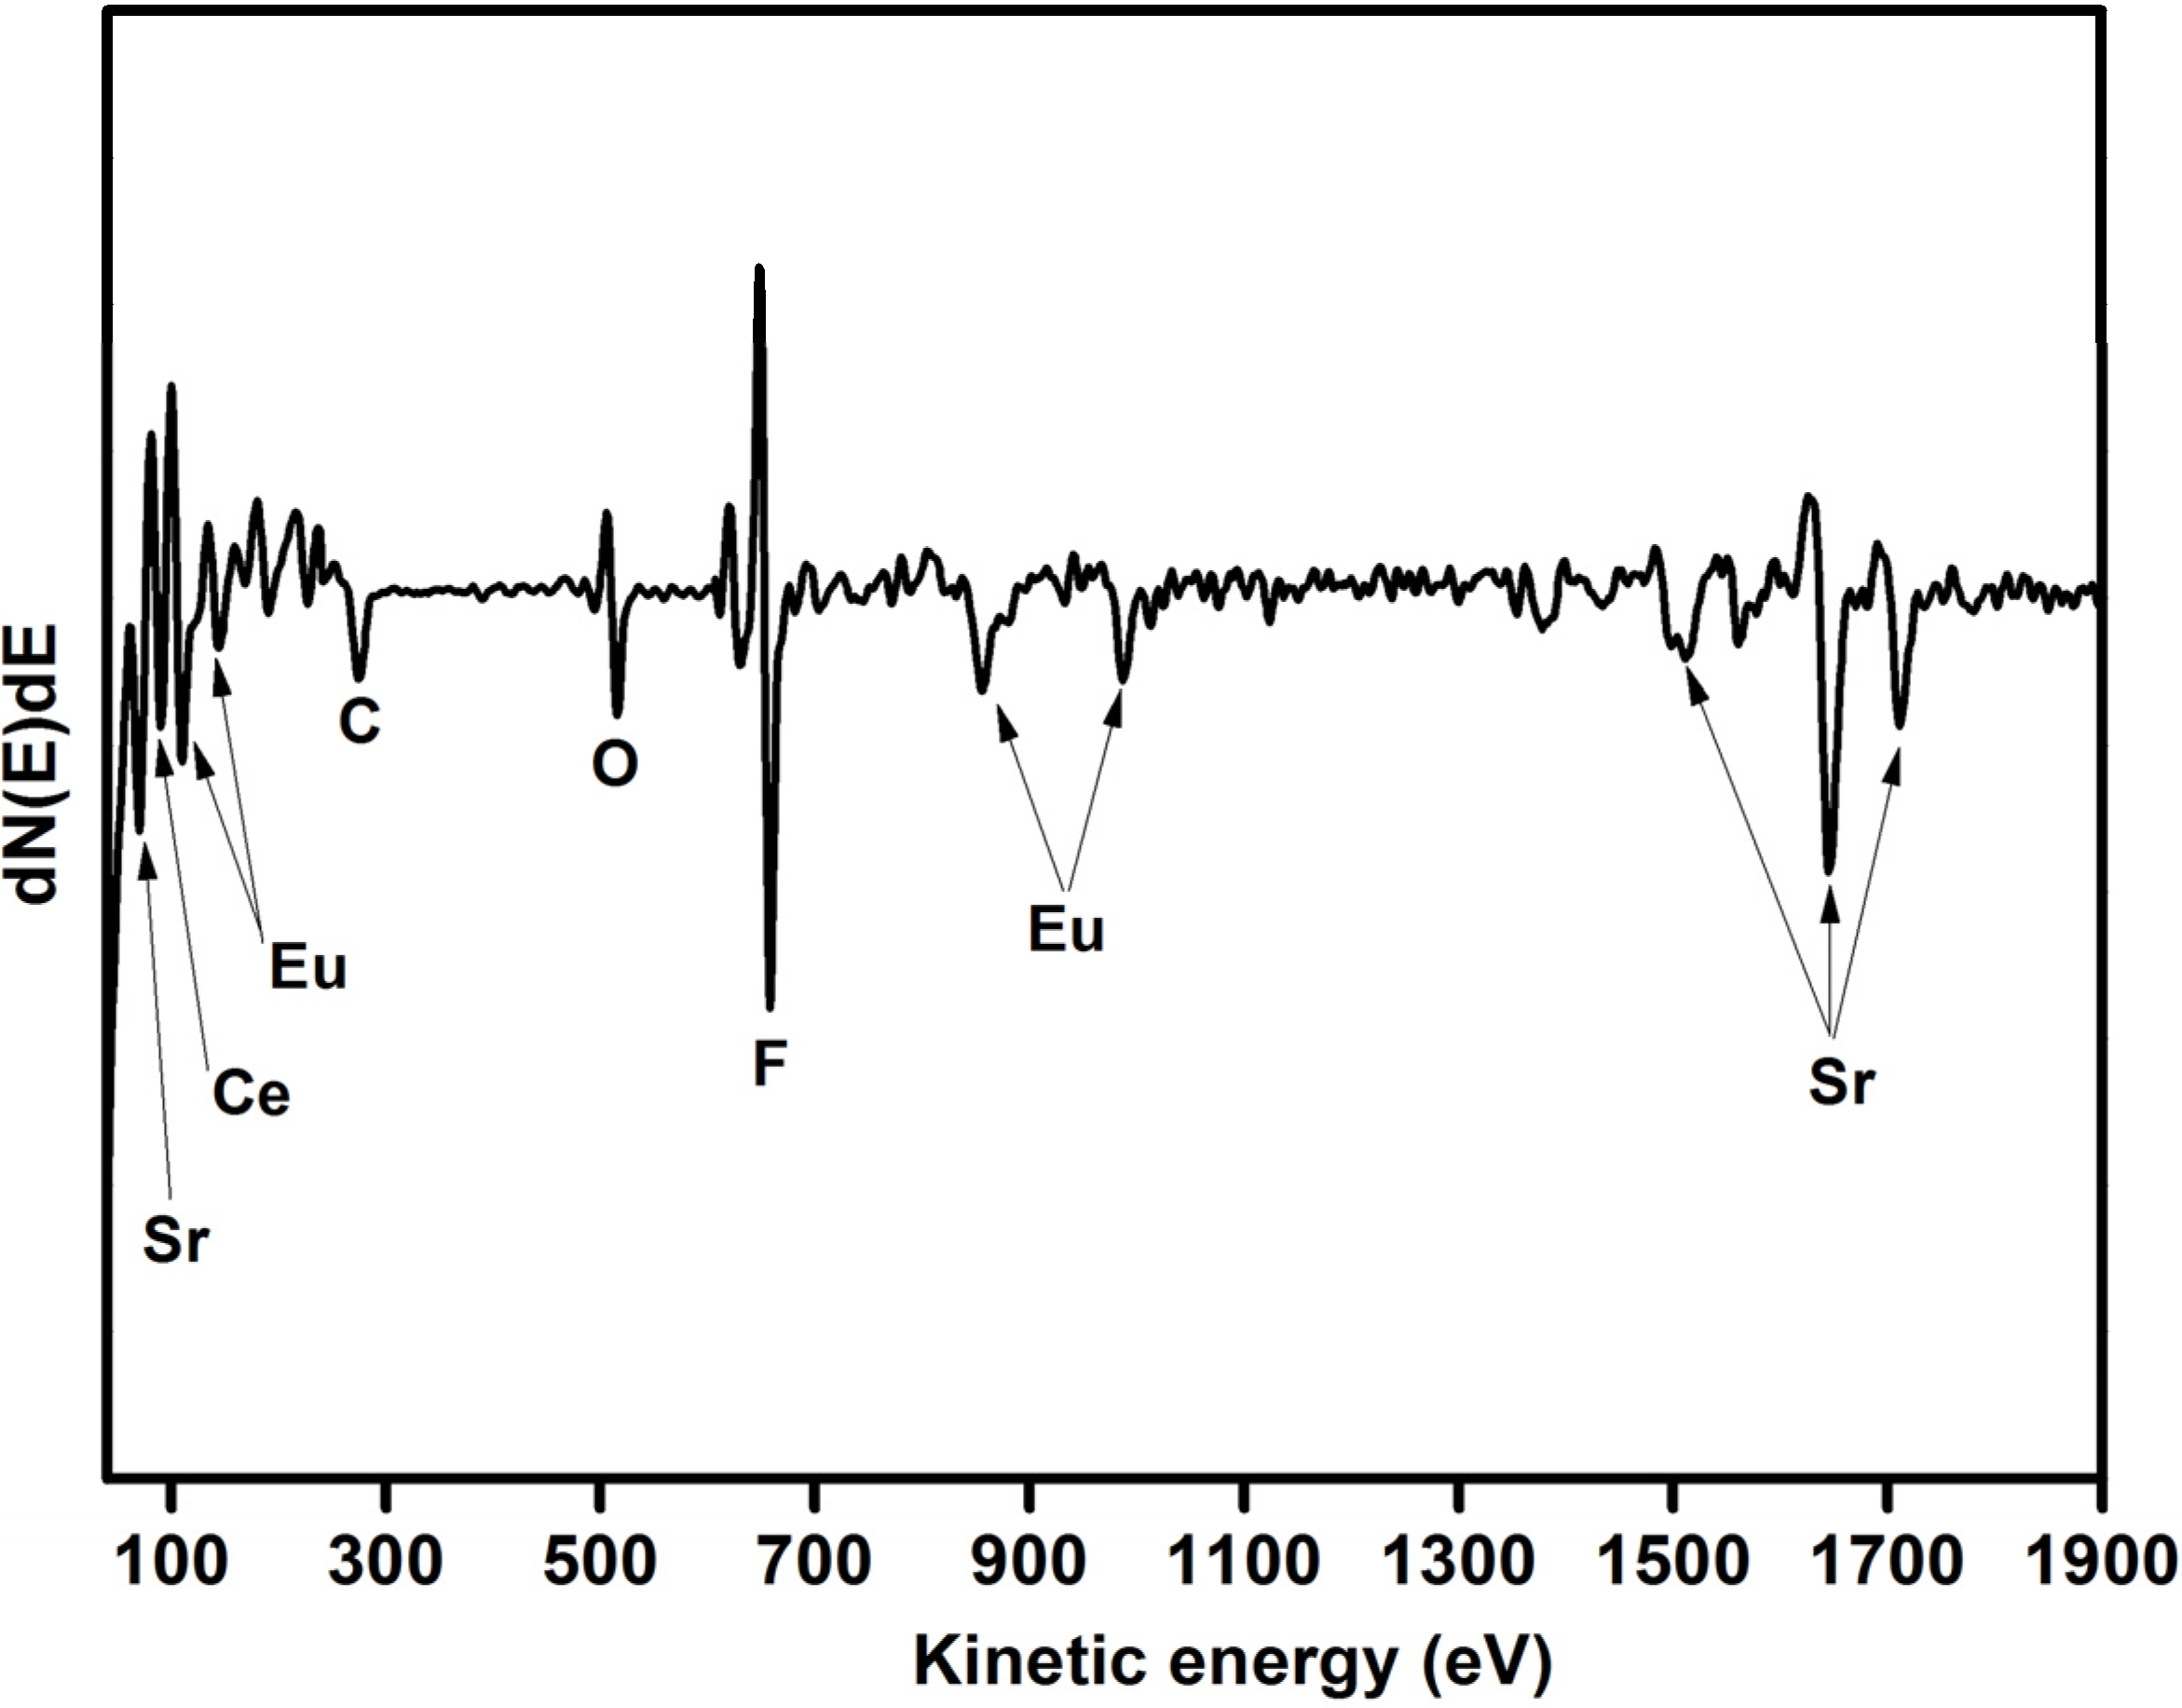
2.1.2. Auger and TOF SIMS analysis
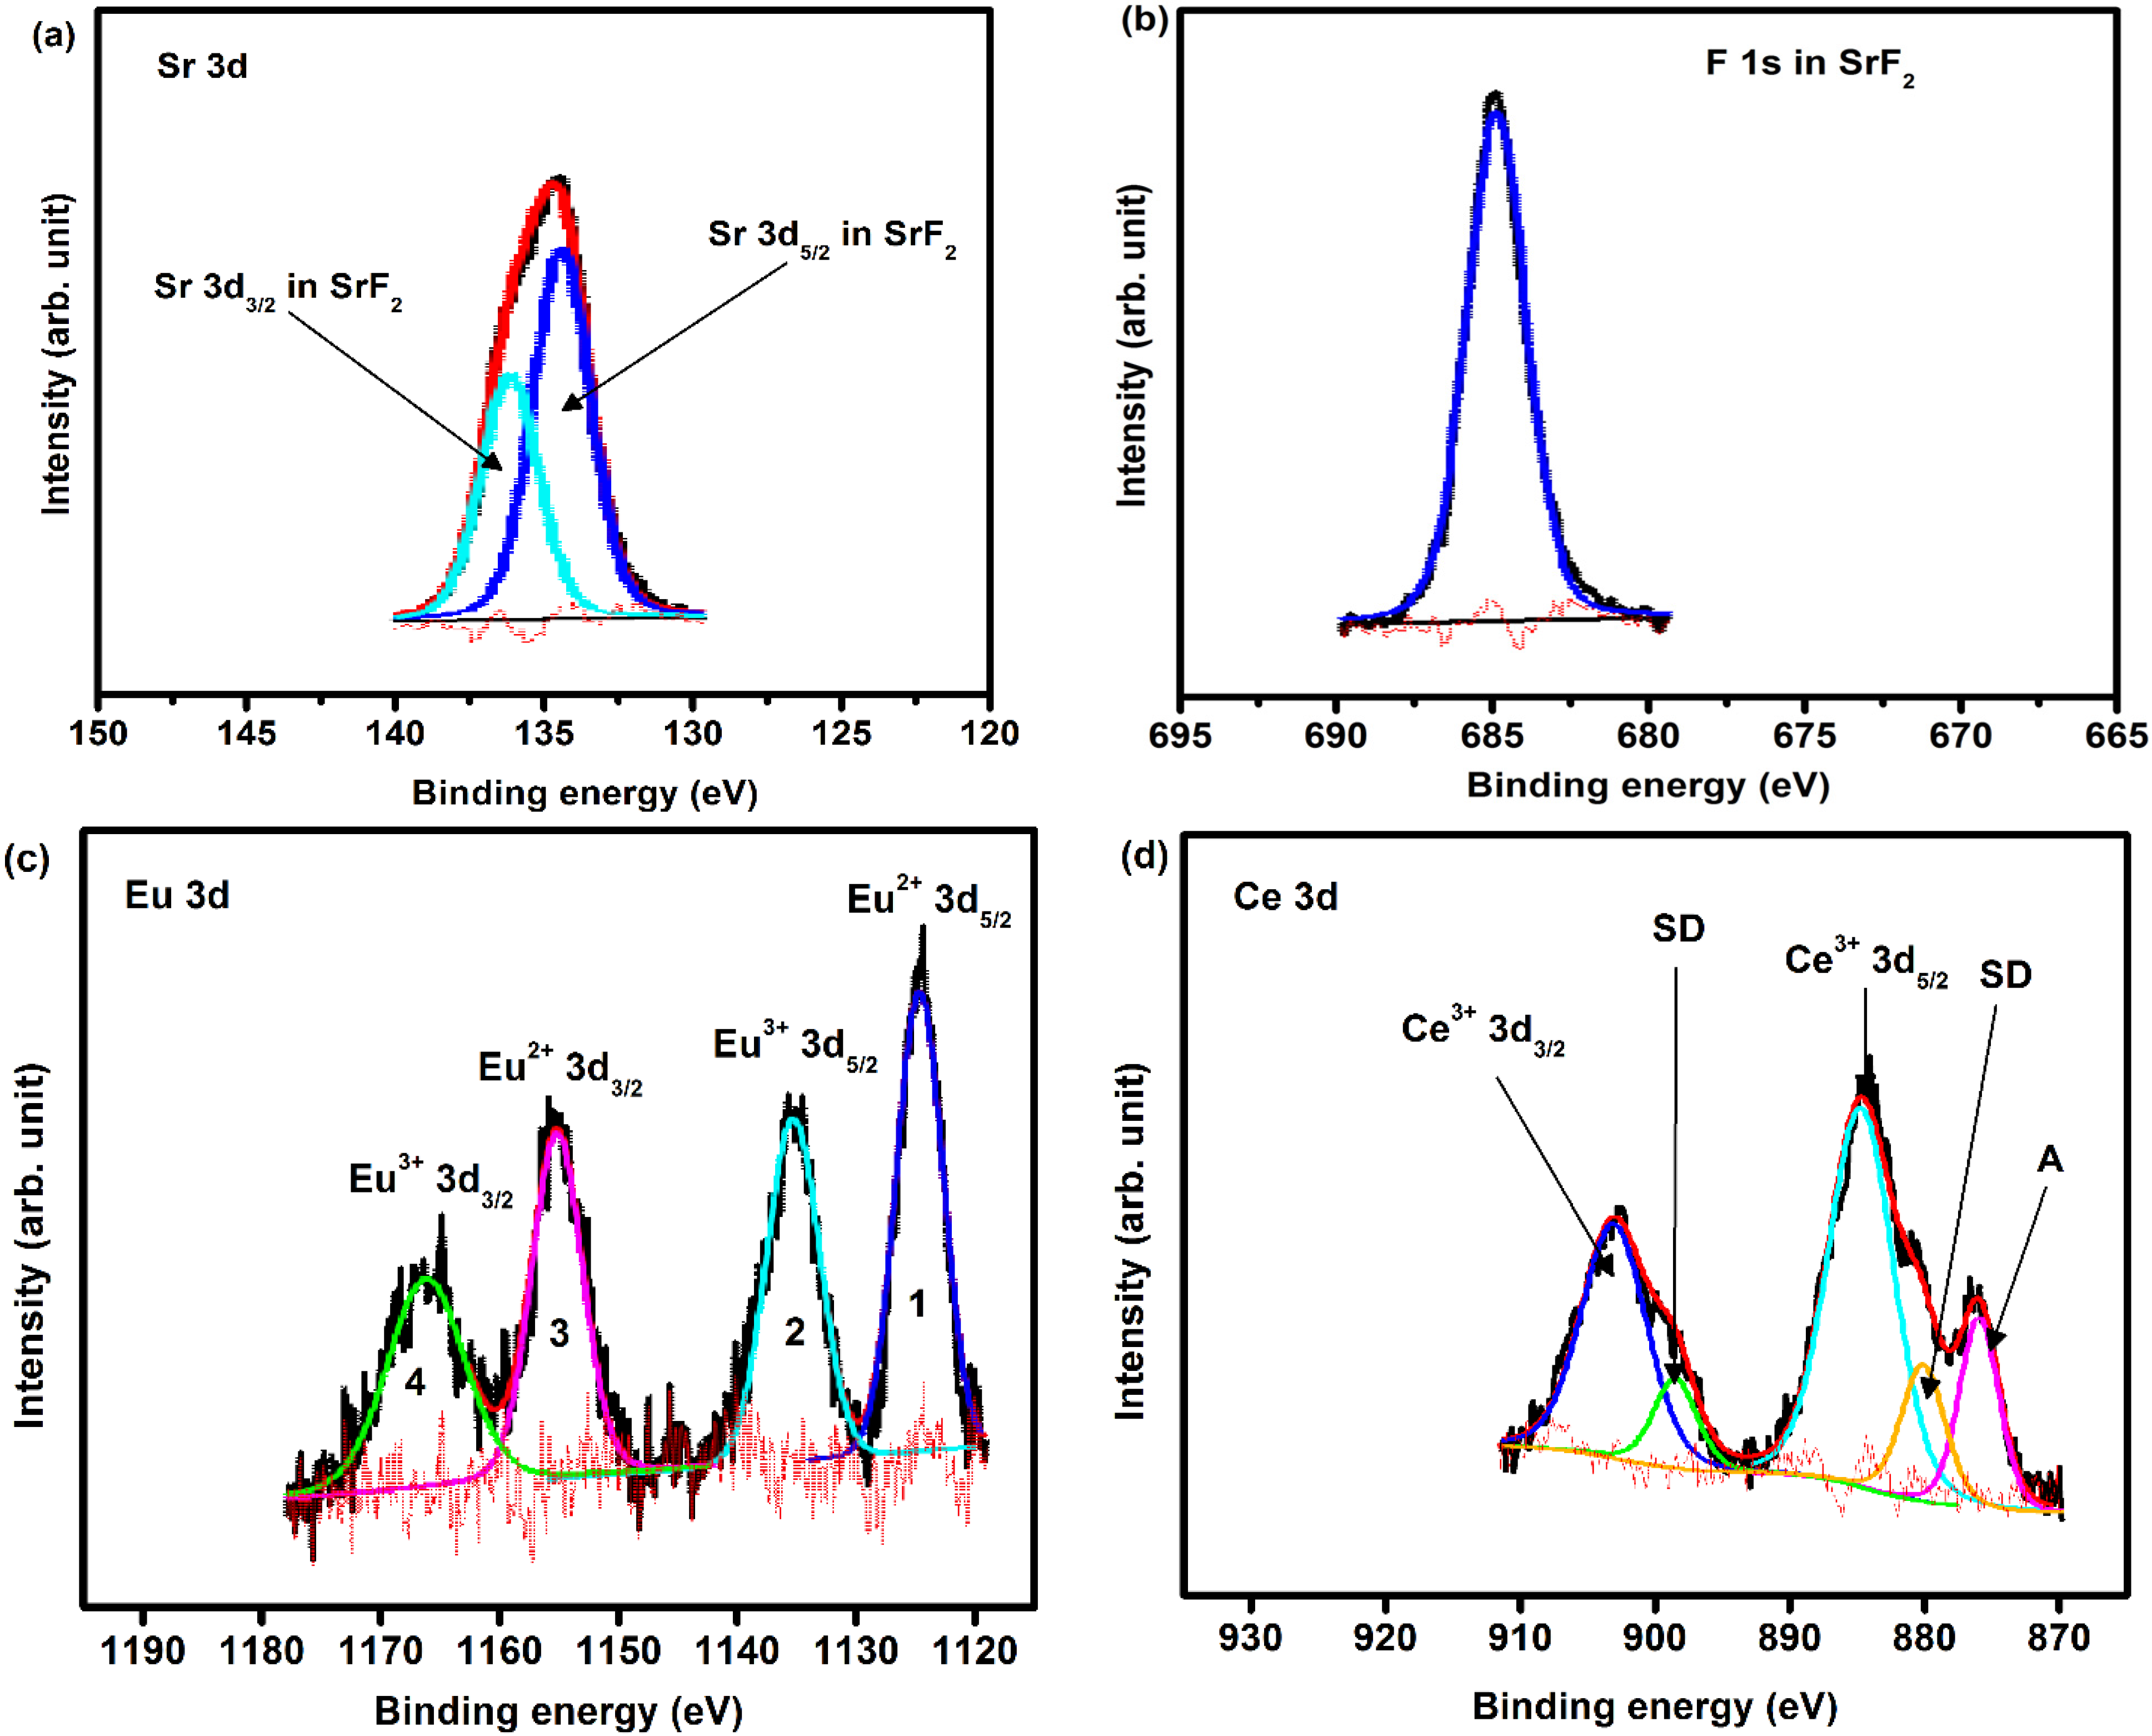
2.1.3. X-ray Photoelectron Spectroscopy (XPS)

| Element | B.E (±0.1 eV) | Area distribution | Interpretation |
|---|---|---|---|
| F1s | 684.7 | 2688 | F in SrF2 |
| Sr3d | 133.5 | 1986 | Sr 3d5/2 in SrF2 |
| 135.3 | 1311 | Sr 3d3/2 in SrF2 | |
| Eu3d | 1123.3 | 1613 | Eu2+ 3d5/2 in fluoride |
| 1133.05 | 1372 | Eu3+ 3d5/2 in fluoride | |
| 1153.2 | 1064 | Eu2+ 3d3/2 in fluoride | |
| Ce3d | 1163.0 | 905 | Eu3+ 3d3/2 in fluoride |
| 880.3 | 1296 | Shake-down satellite | |
| 884.8 | 5141 | Ce3+ 3d5/2 in fluoride | |
| 898.5 | 855 | Shake-down satellite | |
| 903.0 | 3393 | Ce3+ 3d3/2 in fluoride | |
| 876.1 | 1592 | F KL1L1 Auger electron peak |
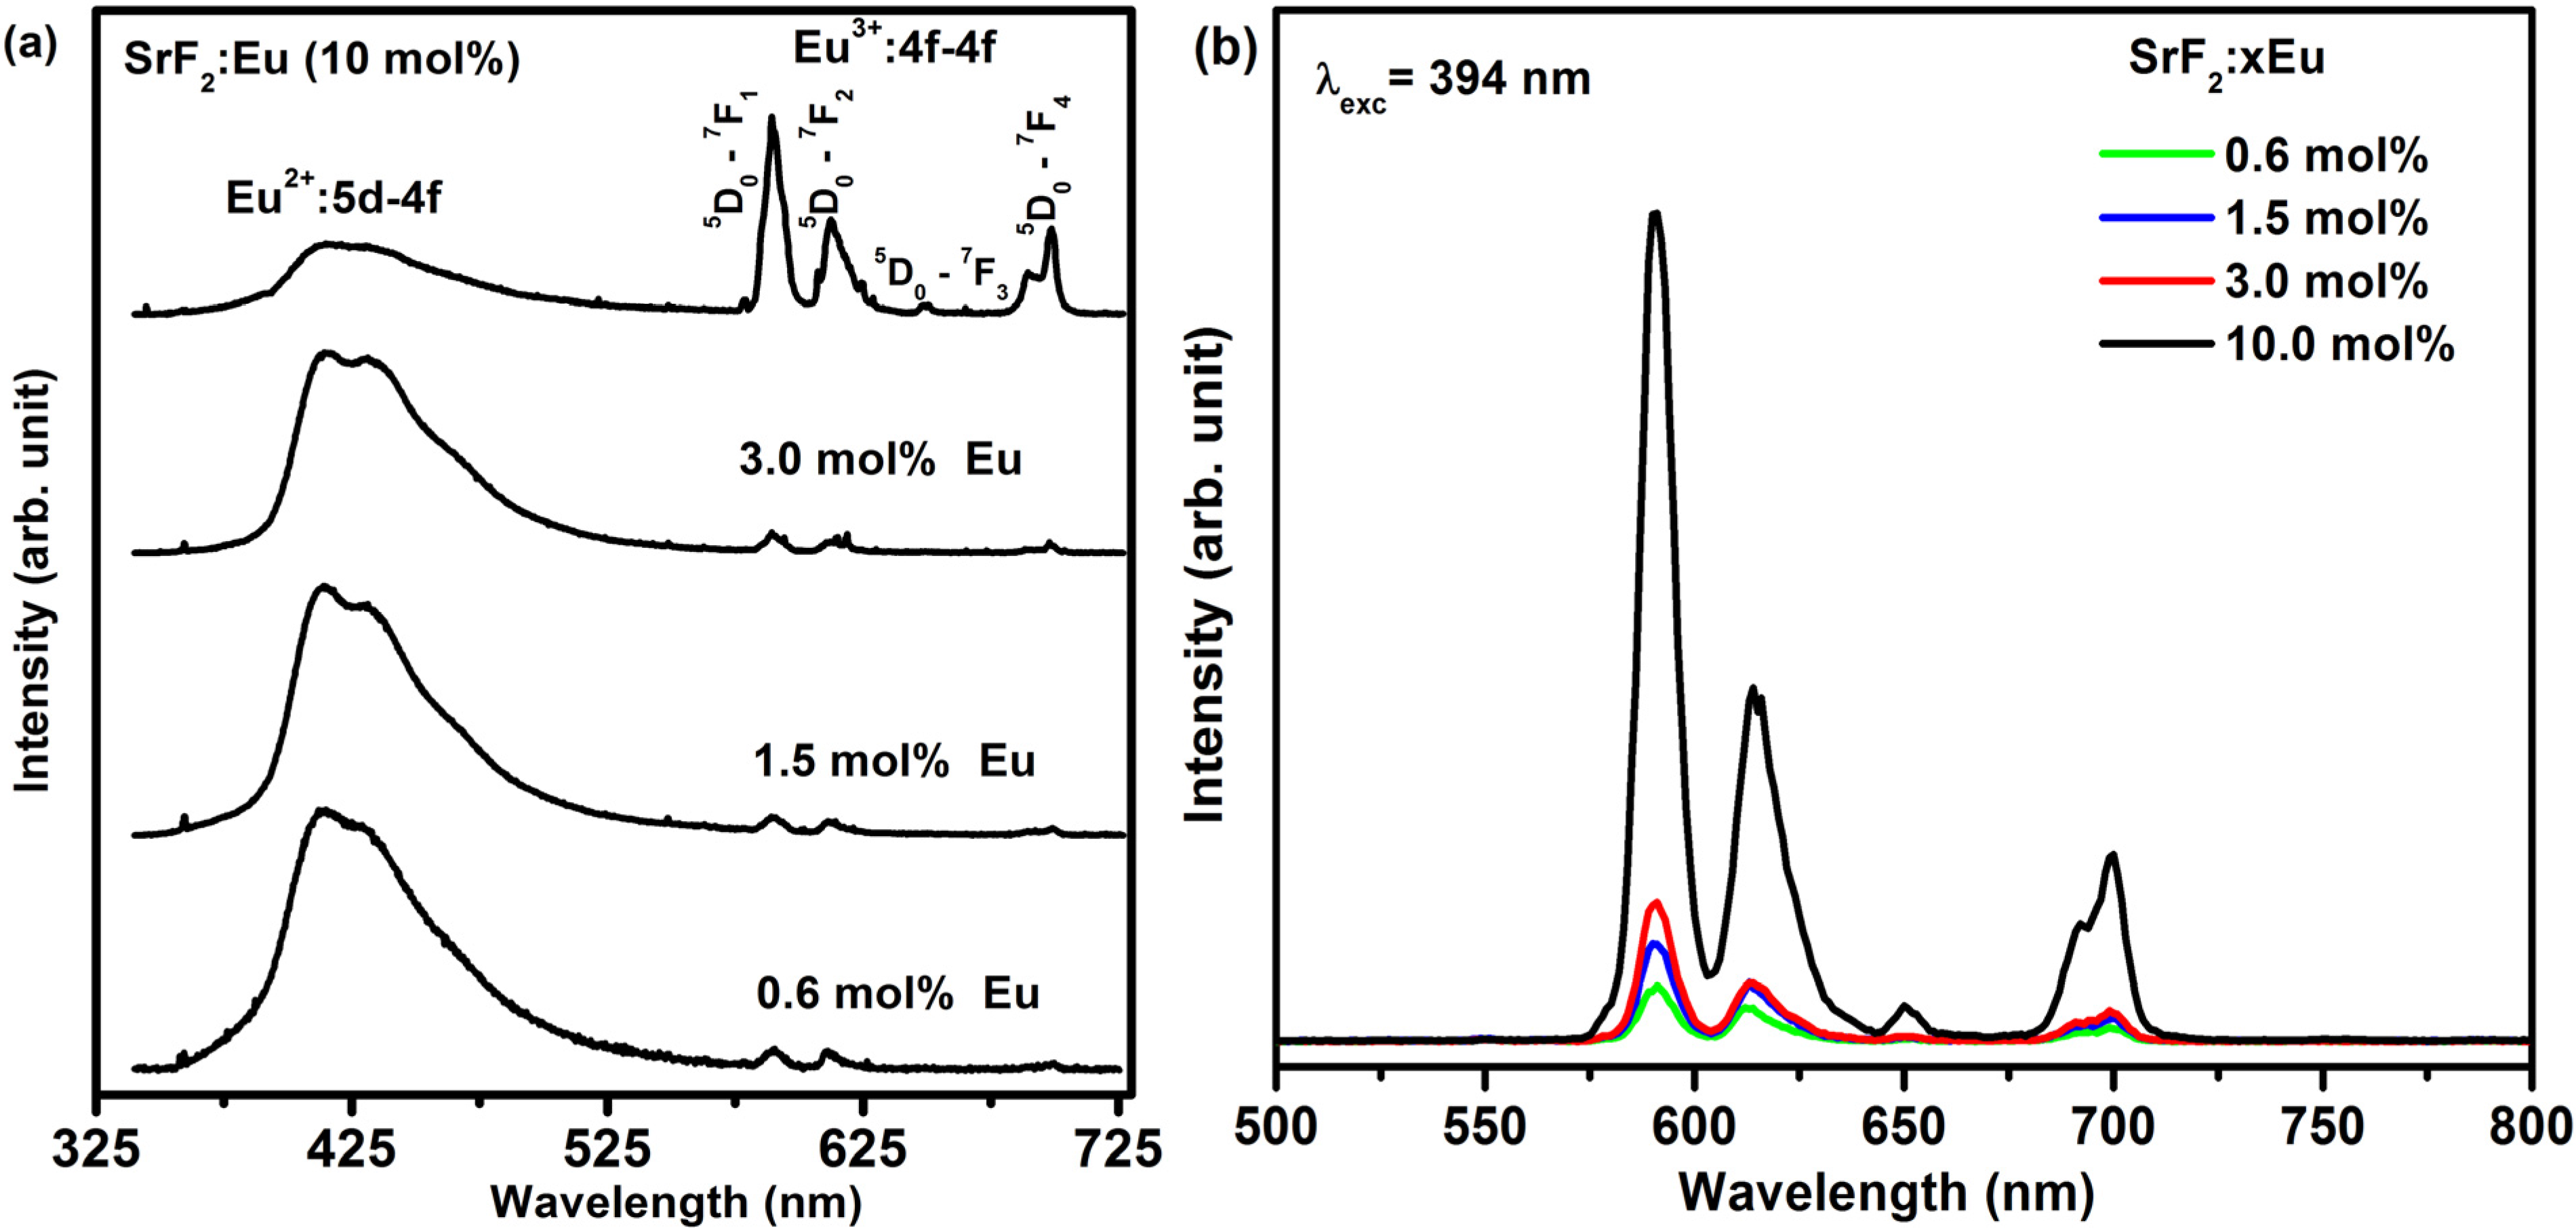
2.2. Photoluminescence Spectroscopy
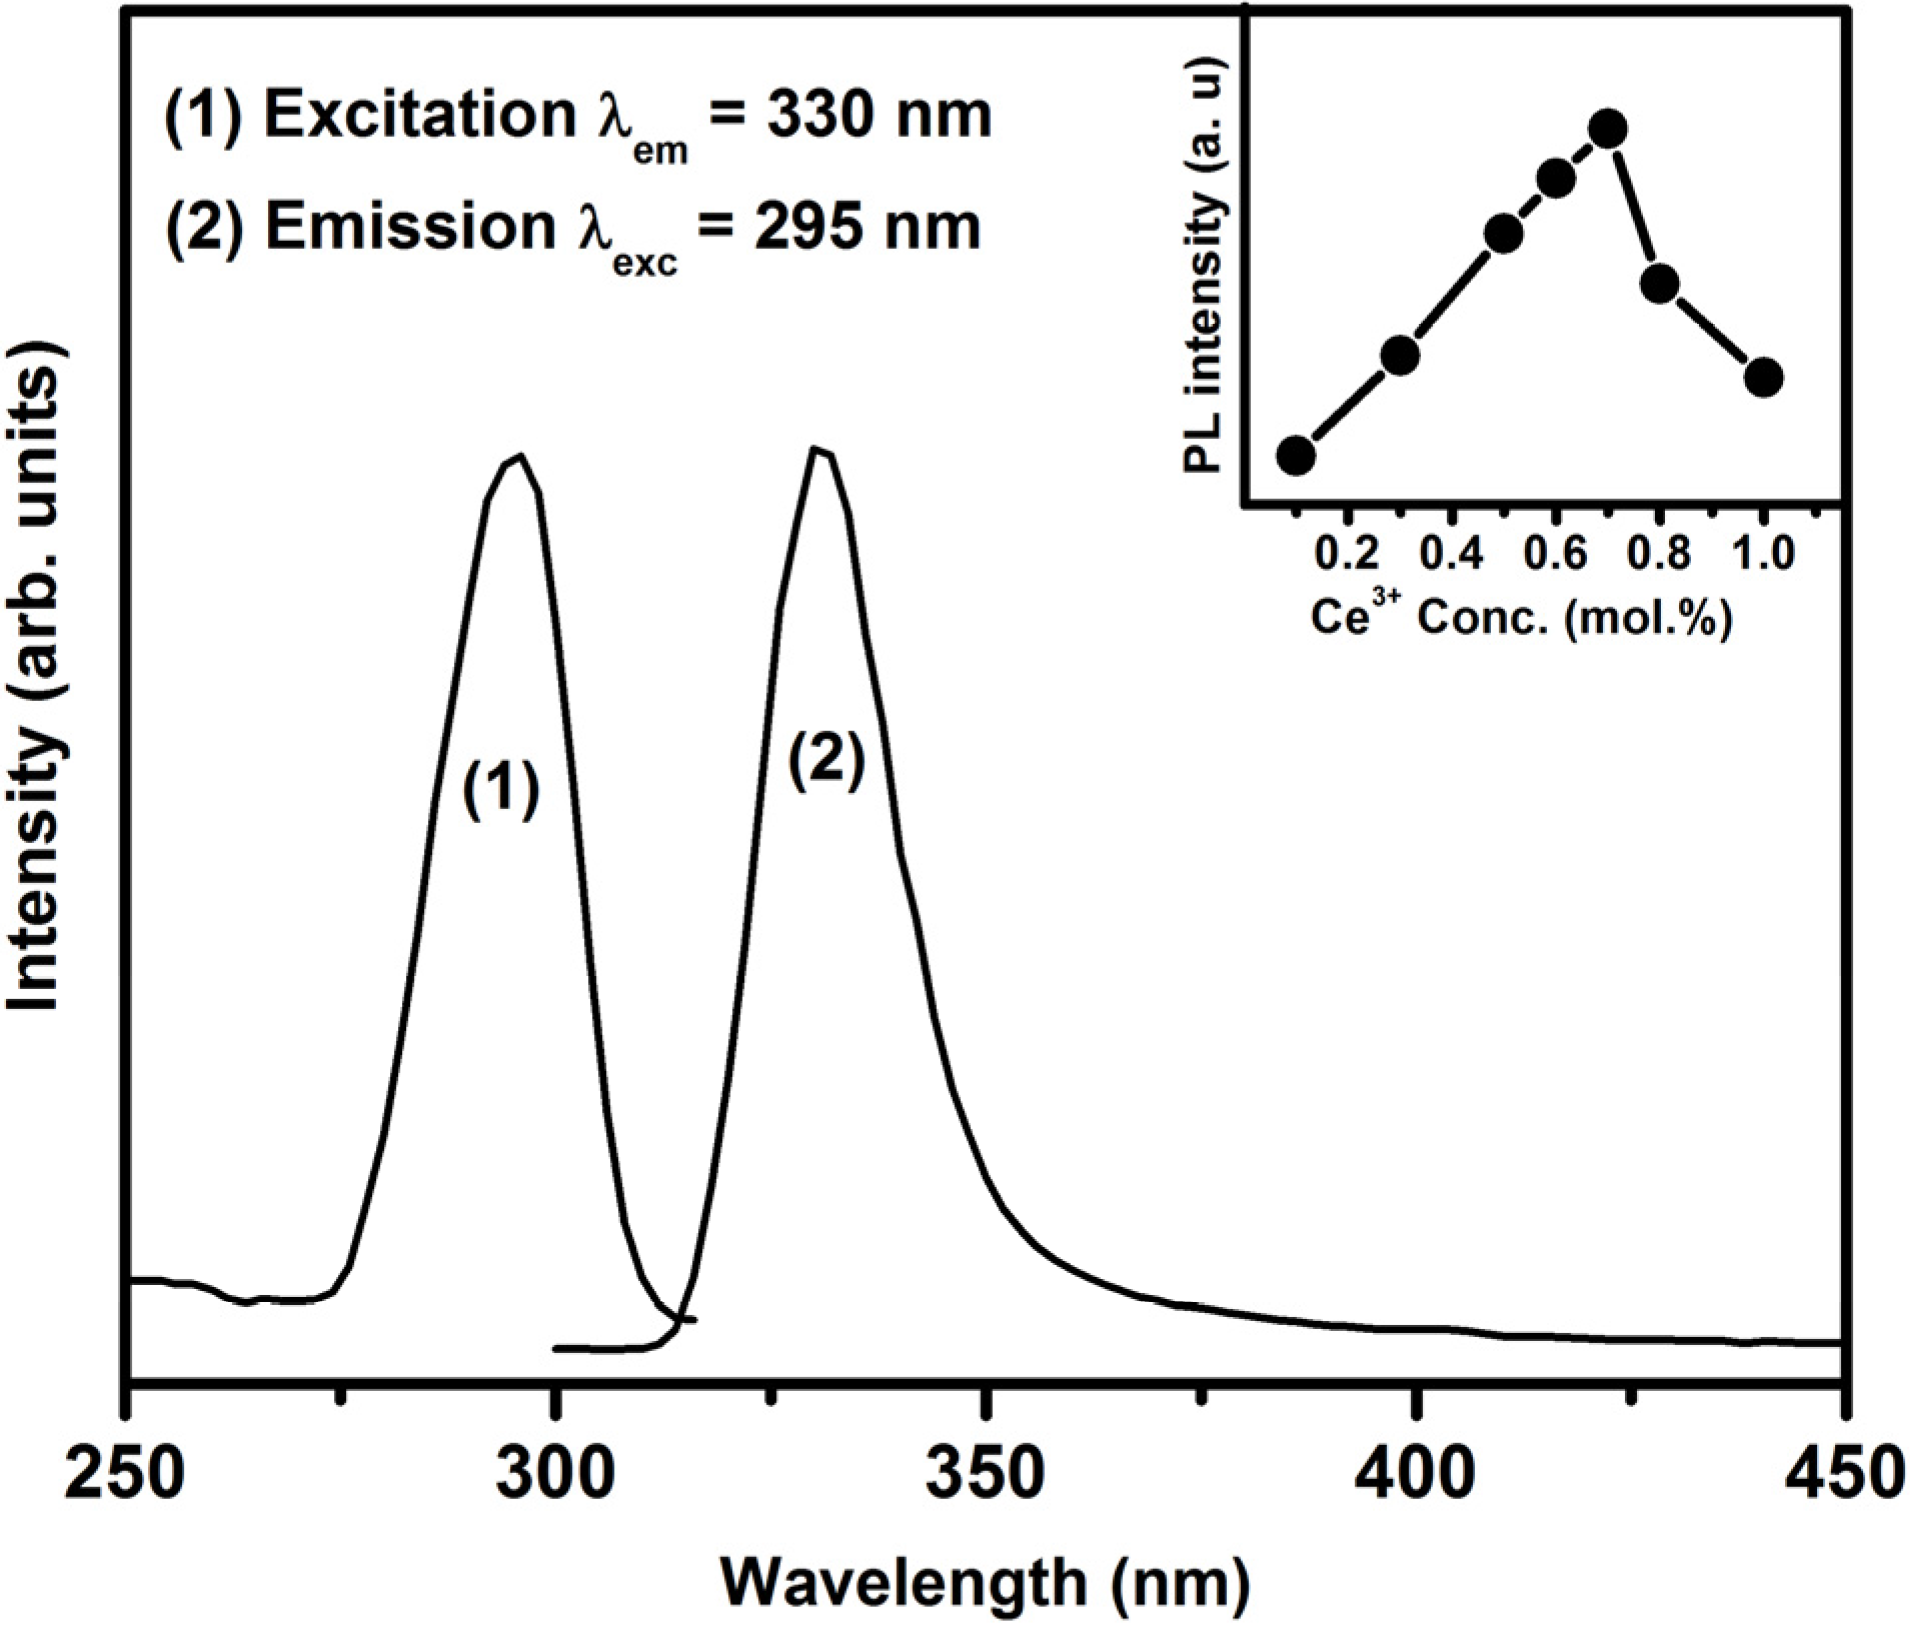
2.2.1. SrF2:Ce3+
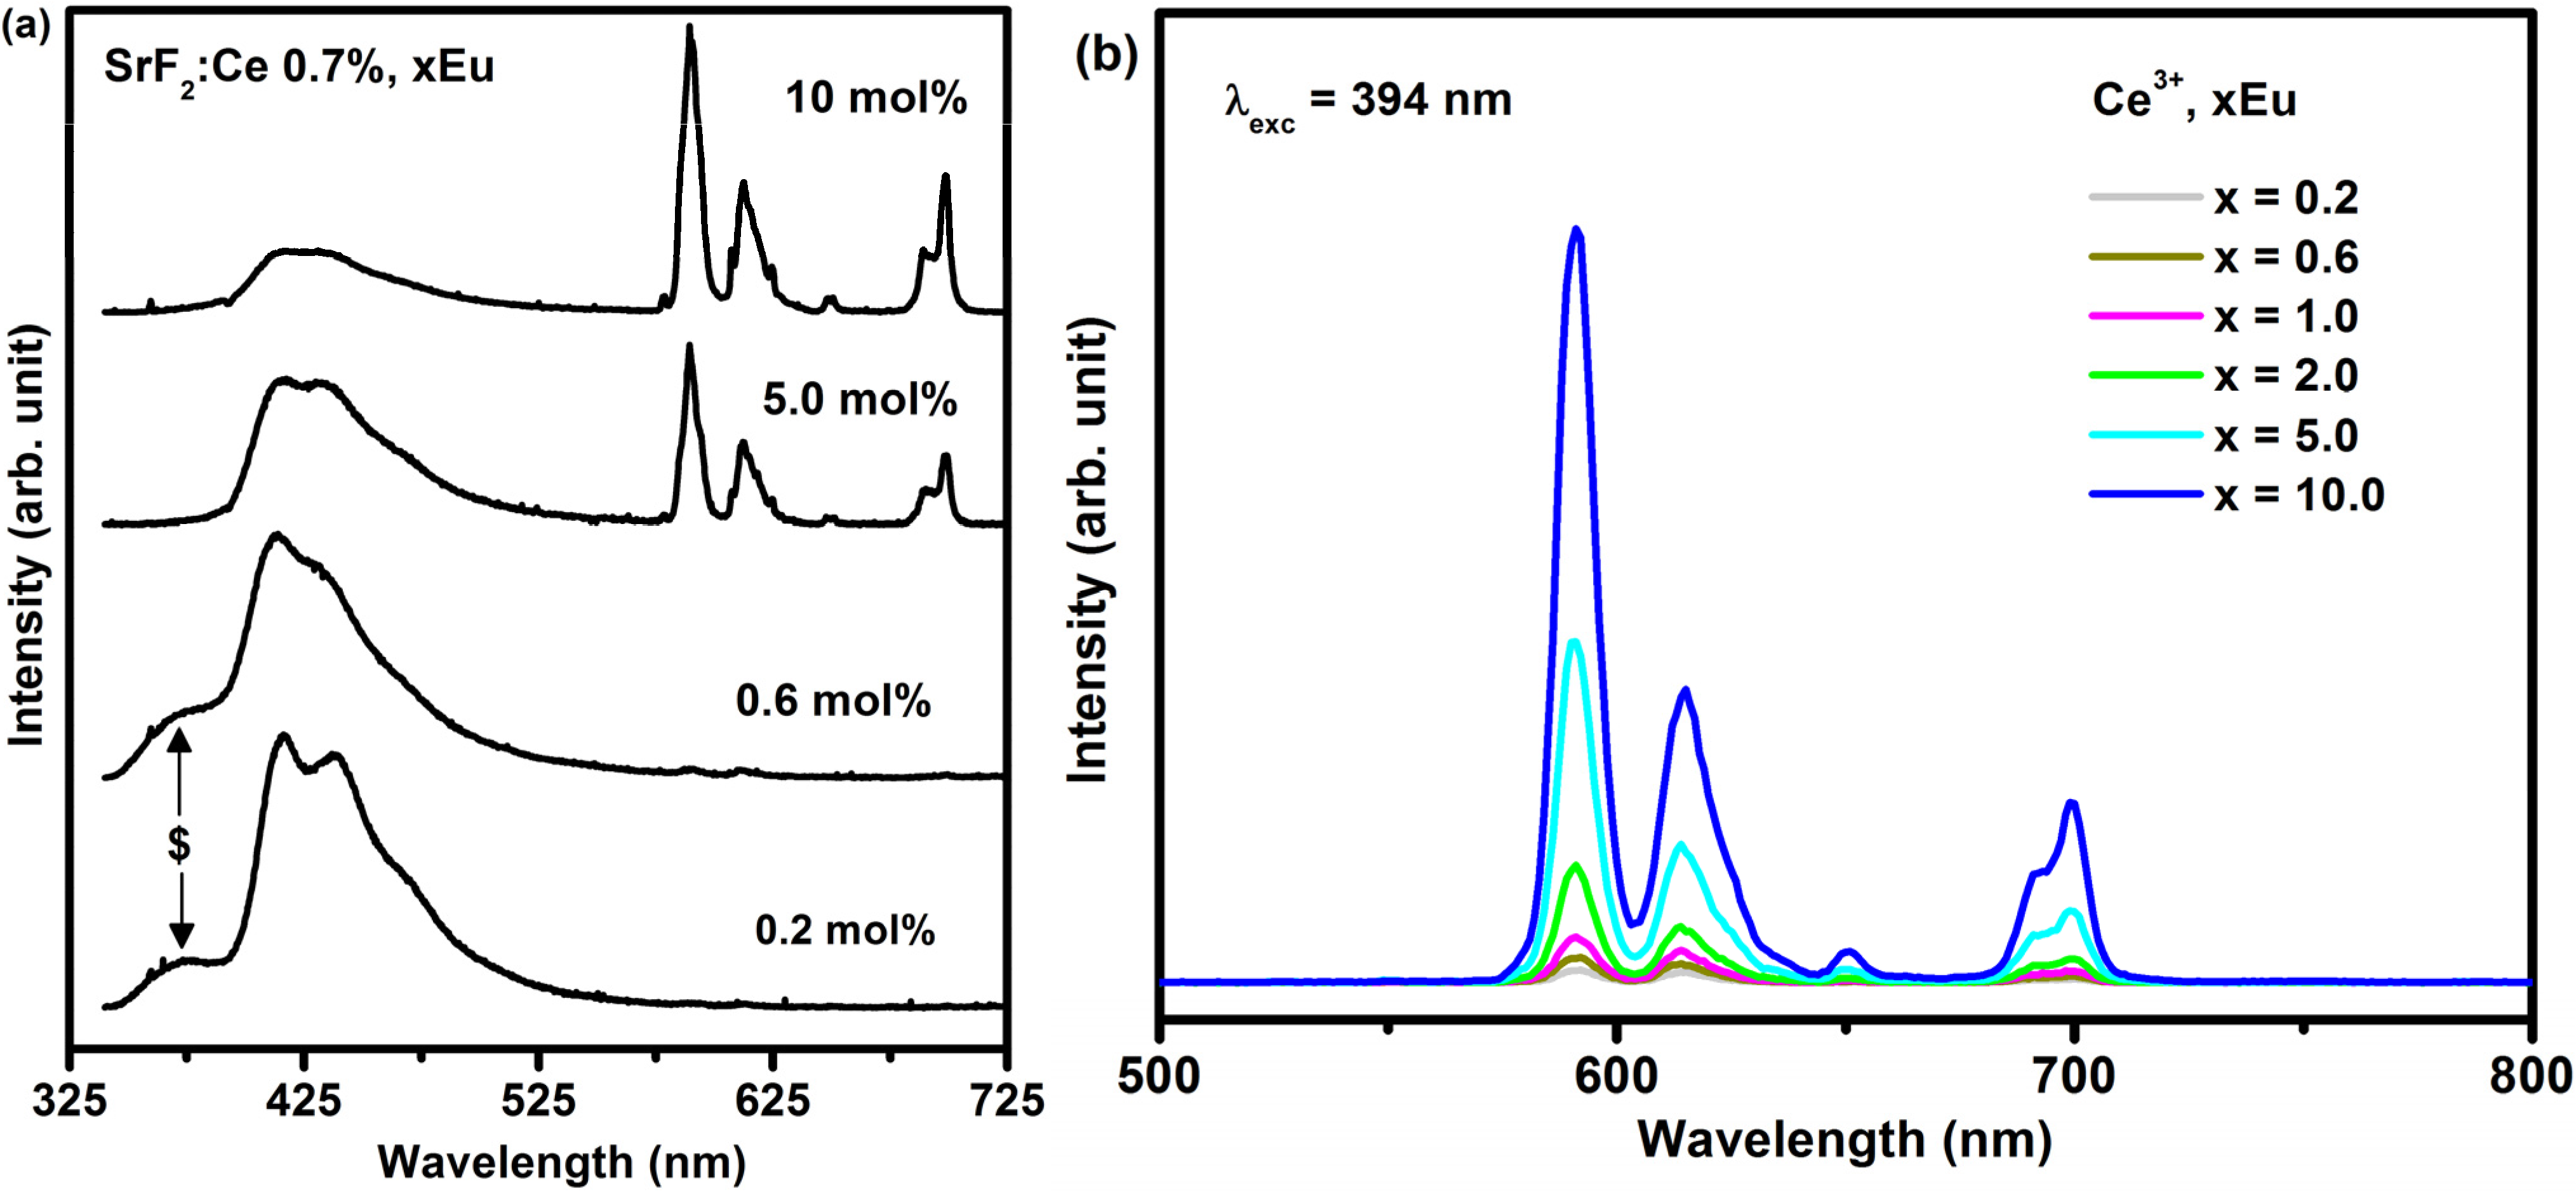
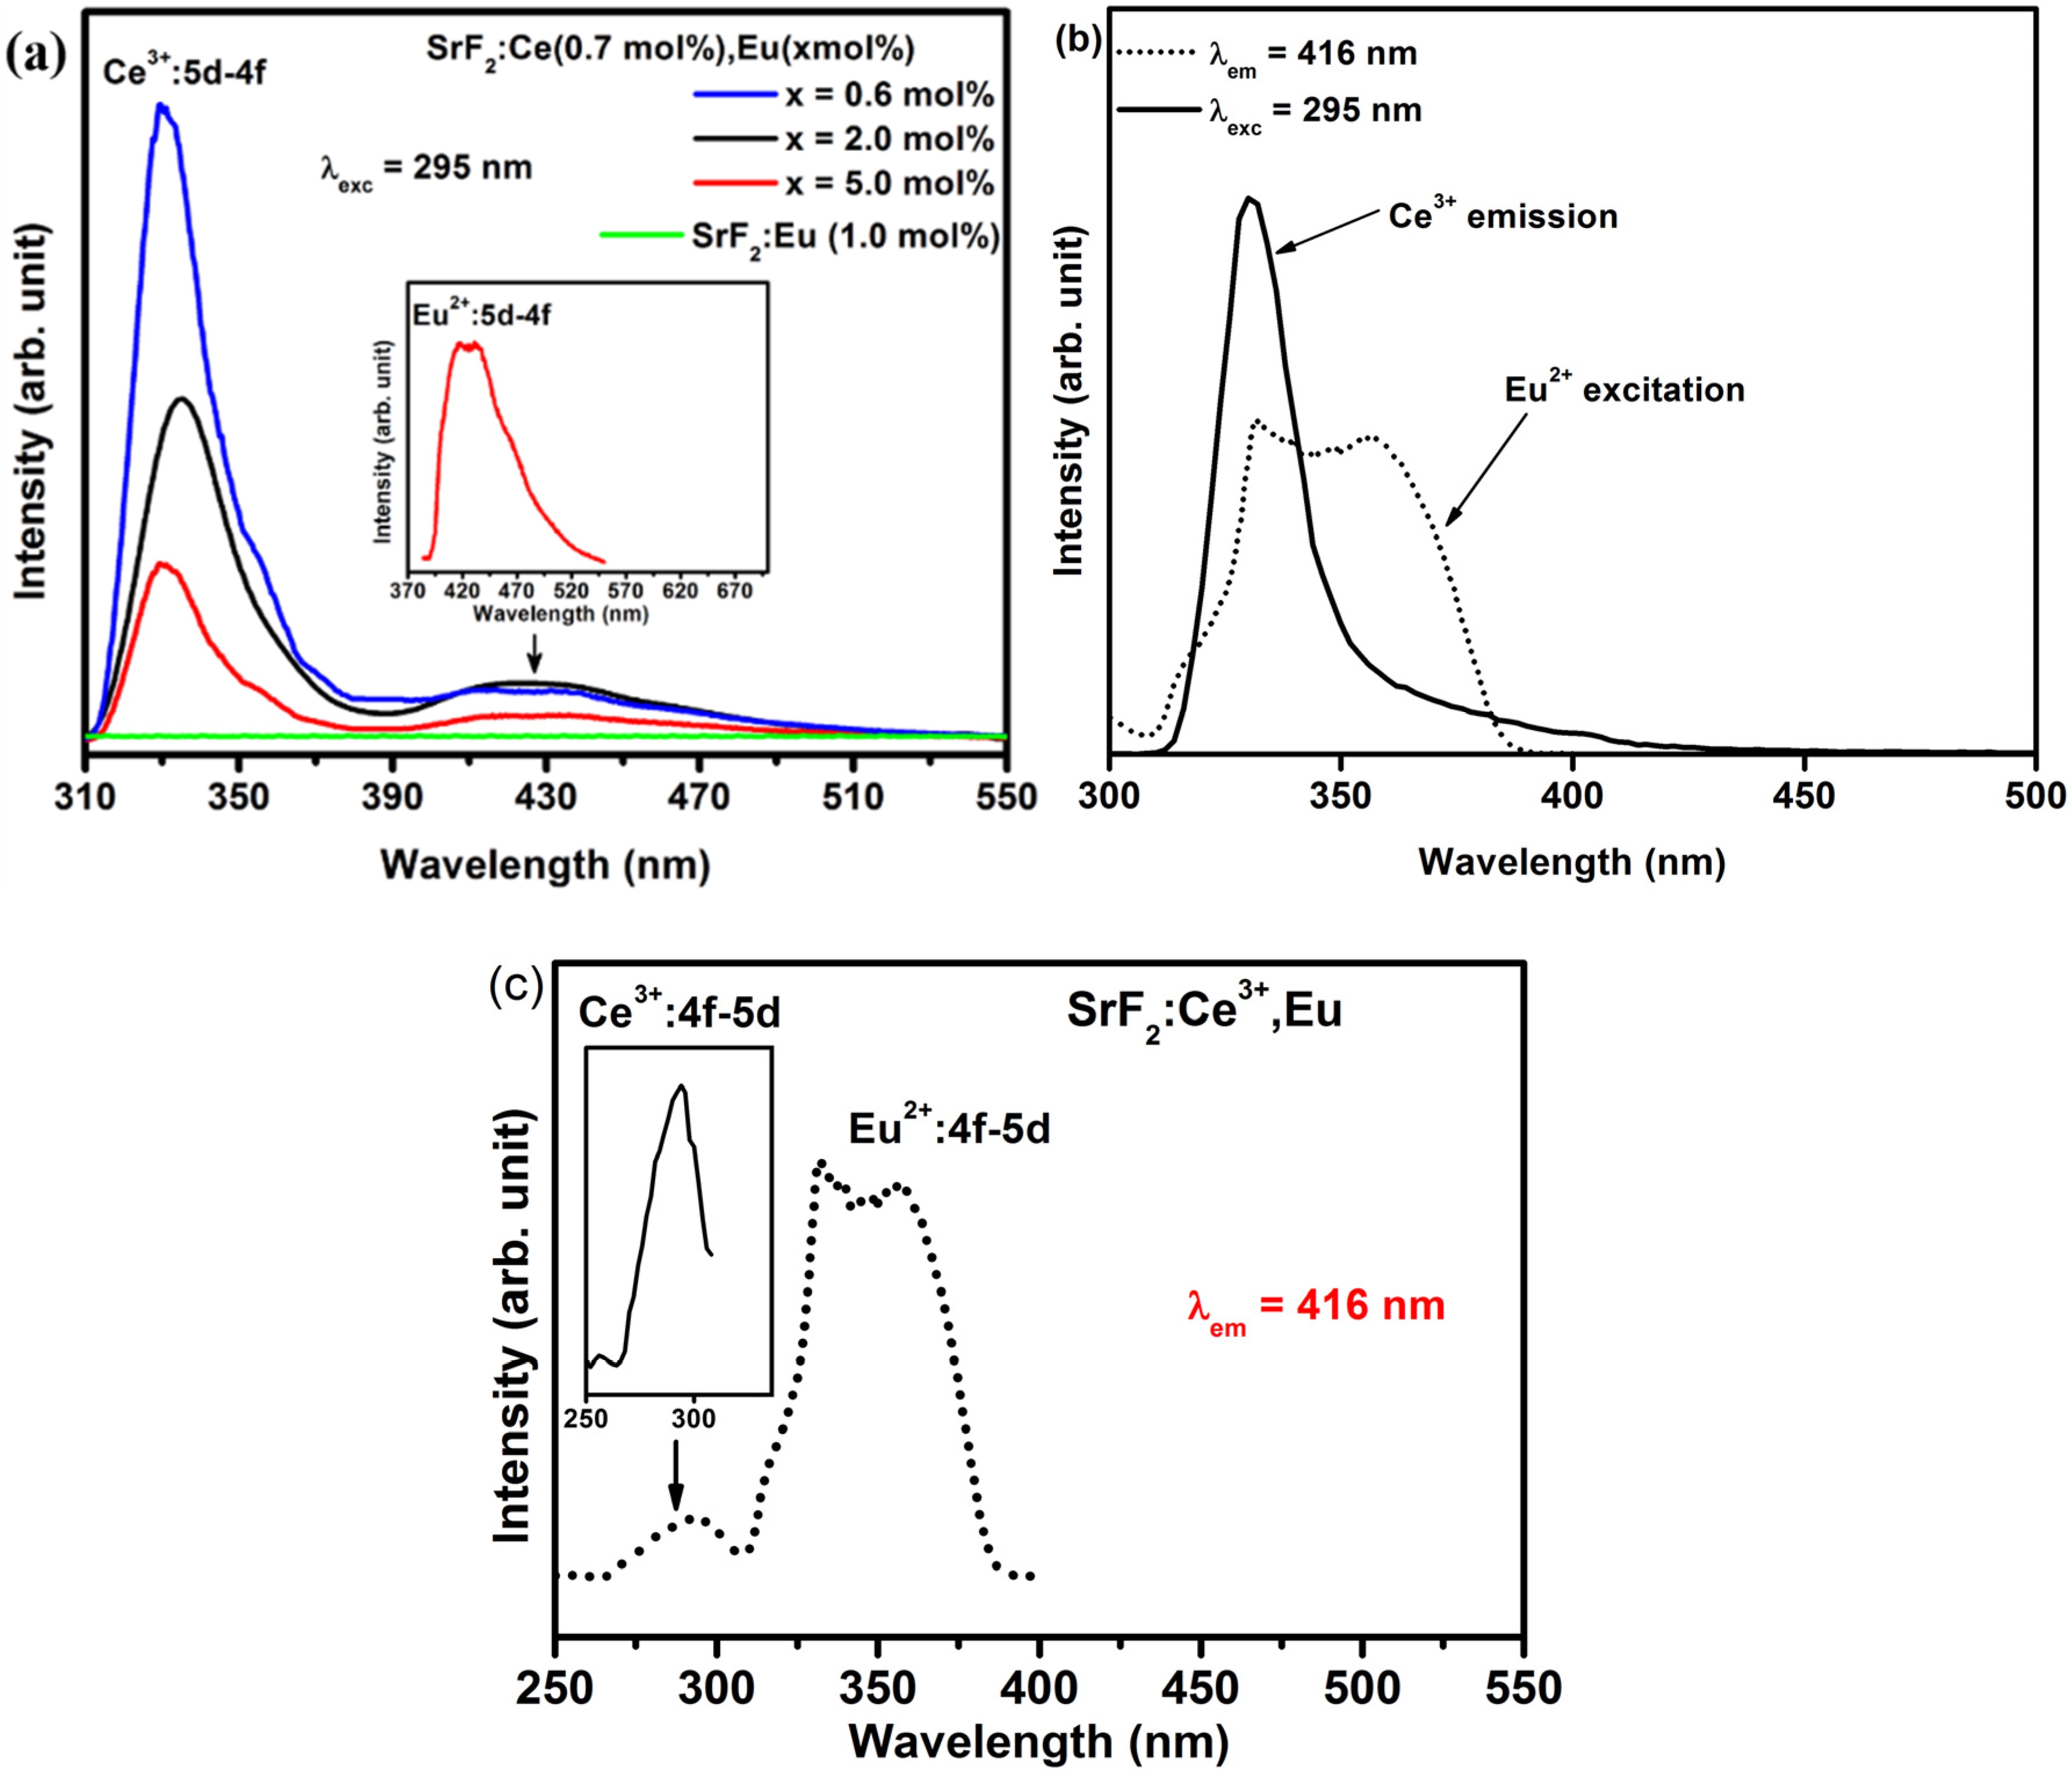
2.2.2. SrF2:Ce,Eu


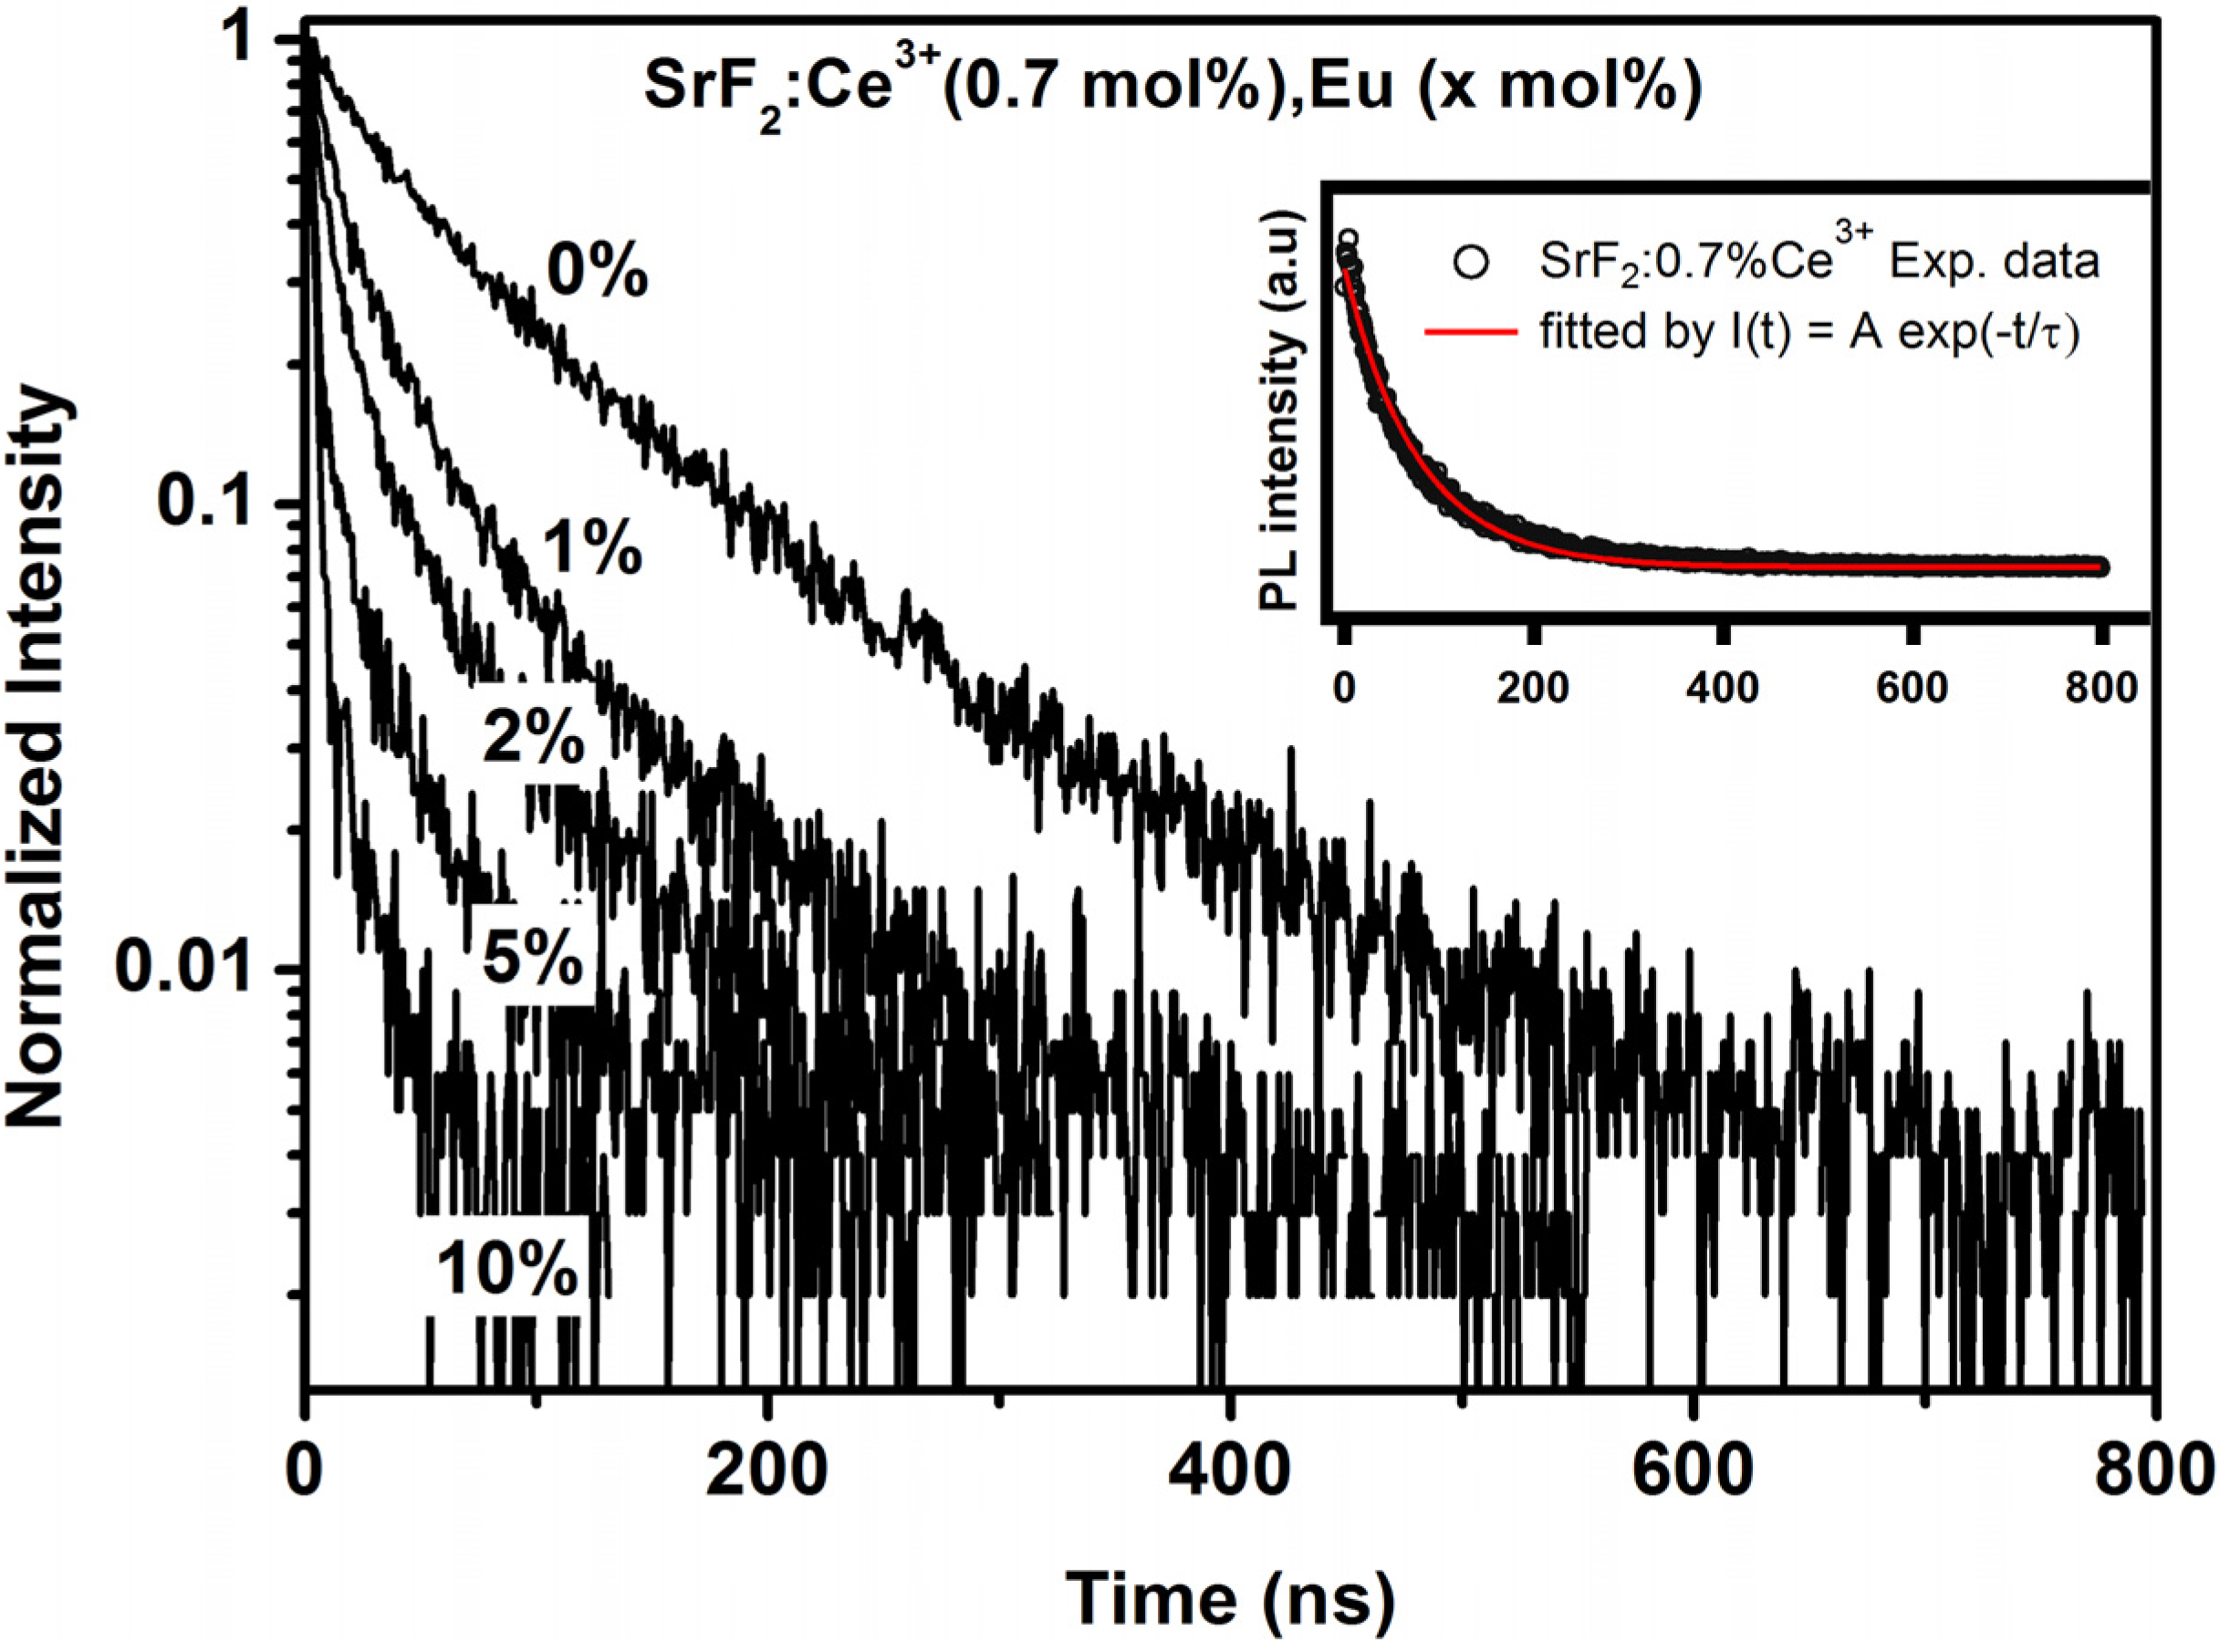
| Eu concentration (mol%) | τ (ns) | ɳET (%) |
|---|---|---|
| 0 | 77.15 | 0 |
| 1 | 46.3 | 40 |
| 2 | 31.9 | 58.6 |
| 5 | 16.05 | 79.2 |
| 10 | 8.2 | 89.4 |
3. Experimental Section
4. Conclusions
Acknowledgments
Author Contributions
Conflicts of Interest
References
- Ivanovskikh, K.V.; Pustovarov, V.A.; Krim, M.; Shulgin, B.V. Time-resolved vacuum ultraviolet spectroscopy of Er3+ ions in the SrF2 crystal. J. Appl. Spectrosc. 2005, 72, 564–568. [Google Scholar] [CrossRef]
- Van der Ende, B.M.; Aarts, L.; Meijerink, A. Near-infrared quantum cutting for photovoltaics. Adv. Mater. 2009, 21, 3073–3077. [Google Scholar]
- Ivanovskikh, K.; Pustovarov, V.; Smirnov, A.; Shulgin, B. Inter- and intraconfigurational luminescence of trivalent rare earth ions doped into strontium fluoride crystals under vacuum ultraviolet excitation. Phys. Stat. Solidi C 2007, 4, 889–892. [Google Scholar] [CrossRef]
- Kristianpoller, N.; Weiss, D.; Chen, R. Optical and dosimetric properties of variously doped SrF2 crystals. Radiat. Meas. 2004, 38, 719–722. [Google Scholar] [CrossRef]
- Shendrik, R.; Radzhabov, E.A.; Nepomnyashchikh, A.I. Scintillation properties of pure and Ce3+-doped SrF2 crystals. Radiat. Meas. 2013, 56, 58–61. [Google Scholar] [CrossRef]
- Shendrik, R.; Radzhabov, E. Emission in CaF2, BaF2, SrF2. IEEE Trans. Nucl. Sci. 2009, 57, 1295–1299. [Google Scholar] [CrossRef]
- Gao, D.; Zheng, H.; Zhang, X.; Fu, Z.; Zhang, Z.; Tian, Y.; Cui, M. Efficient fluorescence emission and photon conversion of LaOF:Eu3+ nanocrystals. Appl. Phys. Lett. 2011, 98, 011907–011909. [Google Scholar] [CrossRef]
- Chung, P.; Chung, H.; Holloway, P.H. Phosphor coatings to enhance Si photovoltaic cell performance. J. Vac. Sci. Technol. A 2007, 25, 61–66. [Google Scholar] [CrossRef]
- Huang, X.Y.; Wang, J.X.; Yu, D.C.; Ye, S.; Zhang, Q.Y.; Sun, X.W. Spectral conversion for solar cell efficiency enhancement using YVO4:Bi3+,Ln3+ (Ln = Dy, Er, Ho, Eu, Sm, and Yb) phosphors. J. Appl. Phys. 2011, 109, 113526–113532. [Google Scholar] [CrossRef]
- Yagoub, M.Y.A.; Swart, H.C.; Noto, L.L.; O’Connell, J.H.; Lee, M.E.; Coetsee, E. The effects of Eu-concentrations on the luminescent properties of SrF2:Eu nanophosphor. J. Lumin. 2014, 156, 150–156. [Google Scholar] [CrossRef]
- Li, Y.C.; Chang, Y.H.; Lin, Y.F.; Chang, Y.S.; Lin, Y.J. Synthesis and luminescent properties of Ln3+ (Eu3+, Sm3+, Dy3+)-doped lanthanum aluminum germanate LaAlGe2O7 phosphors. J. Alloys Compd. 2007, 439, 367–375. [Google Scholar] [CrossRef]
- Jin, Y.; Qin, W.; Zhang, J. Preparation and optical properties of SrF2: Eu3+ nanospheres. J. Fluor. Chem. 2008, 129, 515–518. [Google Scholar] [CrossRef]
- Huang, X.; Han, S.; Huang, W.; Liu, X. Enhancing solar cell efficiency: The search for luminescent materials as spectral converters. Chem. Soc. Rev. 2013, 42, 173–201. [Google Scholar] [CrossRef] [PubMed]
- Rakov, N.; Guimaraes, R.B.; Franceschini, D.F.; Maciel, G.S. Er:SrF2 luminescent powders prepared by combustion synthesis. Mater. Chem. Phys. 2012, 135, 317–321. [Google Scholar] [CrossRef]
- Oprea, C.; Ciupina, V.; Prodan, G. Investigation of nanocrystals using TEM micrographs and electron diffraction technique. Rom. J. Phys. 2008, 53, 223–230. [Google Scholar]
- Seed Ahmed, H.A.A.; Ntwaeaborwa, O.M.; Kroon, R.E. The energy transfer mechanism in Ce,Tb co-doped LaF3 nanoparticles. Curr. Appl. Phys. 2013, 13, 1264–1268. [Google Scholar] [CrossRef]
- Wang, F.; Han, Y.; Lim, C.S.; Lu, Y.; Wang, J.; Xu, J.; Chen, H.; Zhang, C.; Hong, M.; Liu, X. Simultaneous phase and size control of upconversion nanocrystals through lanthanide doping. Nature 2010, 463, 1061–1065. [Google Scholar] [CrossRef] [PubMed]
- Childs, K.D.; Carlson, B.A.; LaVanier, L.A.; Moulder, J.F.; Paul, D.F.; Stickle, W.F.; Watson, D.G. Handbook of Auger Electron Spectroscopy, 3rd ed.; Physical Electronics: Eden Peairie, MN, USA, 1995. [Google Scholar]
- Kroon, R.E.; Swart, H.C.; Ntwaeaborwa, O.M.; Seed Ahmed, H.A.A. Ce decay curves in Ce, Tb co-doped LaF3 and the energy transfer mechanism. Phys. B 2014, 439, 83–87. [Google Scholar] [CrossRef]
- Van Wijngaarden, J.T.; Scheidelaar, S.; Vlugt, T.J.H.; Reid, M.F.; Meijerink, A. Energy transfer mechanism for downconversion in the (Pr3+, Yb3+) couple. Phys. Rev. B 2010, 81, 155112–155117. [Google Scholar] [CrossRef]
- Vasquez, R.P. SrF2 by XPS. Surf. Sci. Spectr. 1992, 1, 24–30. [Google Scholar] [CrossRef]
- Vercaemst, R.; Poelman, D.; van Meirhaeghe, R.L.; Fiermans, L.; Laflere, W.H.; Cardon, F. An XPS study of the dopants’ valence states and the composition of CaS1–xSex:Eu and SrS1–xSex:Ce thin film electroluminescent devices. J. Lumin. 1995, 63, 19–30. [Google Scholar] [CrossRef]
- Lu, D.; Sugano, M.; Sun, X.Y.; Su, W. X-ray photoelectron spectroscopy study on Ba1−xEuxTiO3. Appl. Surf. Sci. 2005, 242, 318–325. [Google Scholar] [CrossRef]
- Zhang, J.; Yang, M.; Jin, H.; Wang, X.; Zhao, X.; Liu, X.; Peng, L. Self-assembly of LaBO3:Eu twin microspheres synthesized by a facile hydrothermal process and their tunable luminescence properties. Mater. Res. Bull. 2012, 47, 247–252. [Google Scholar] [CrossRef]
- Lässer, R.; Fuggle, J.C.; Beyss, M.; Campagna, M. X-ray photoemission from Ce core levels of CePd3, CeSe, CeAl2 and CeCu2Si2. Phys. B C 1980, 102, 360–366. [Google Scholar] [CrossRef]
- Gamza, M.; Slebarski, A.; Rosner, H. Electronic structure of Ce5Rh4Sn10 from XPS and band structure calculations. Eur. Phys. J. B 2008, 63, 1–9. [Google Scholar] [CrossRef]
- Zhang, C.; Hou, Z.; Chai, R.; Cheng, Z.; Xu, Z.; Li, C.; Huang, L.; Lin, J. Mesoporous SrF2 and SrF2:Ln3+ (Ln = Ce, Tb, Yb, Er) Hierarchical microspheres: Hydrothermal synthesis, growing mechanism, and luminescent properties. J. Phys. Chem. C 2010, 114, 6928–6936. [Google Scholar] [CrossRef]
- Dorenbos, P. Energy of the first 4f7 → 4f65d transition of Eu2+ in inorganic compounds. J. Lumin. 2003, 104, 239–260. [Google Scholar] [CrossRef]
- Dorenbos, P. Valence stability of lanthanide ions in inorganic compounds. Chem. Mater. 2005, 17, 6452–6456. [Google Scholar] [CrossRef]
- Baran, A.; Barzowska, J.; Grinberg, M.; Mahlik, S.; Szczodrwksi, K.; Zorenko, Y. Binding energy of Eu2+ and Eu3+ ions in β-Ca2SiO4 doped with europium. Opt. Mater. 2013, 35, 2017–2114. [Google Scholar] [CrossRef]
- Biswas, K.; Sontakke, A.D.; Sen, R.; Annapurna, K. Luminescence properties of dual valence Eu doped nano-crystalline BaF2 embedded glass-ceramics and observation of Eu2+→Eu3+ energy transfer. J. Fluoresc. 2012, 22, 745–752. [Google Scholar] [CrossRef] [PubMed]
- Pandey, C.; Dhopte, S.M.; Muthal, P.L.; Kondawar, V.K.; Moharil, S.V. Eu3+↔Eu2+ redox reactions in bulk and nano CaF2:Eu. Radiat. Eff. Defects Solids 2007, 162, 651–658. [Google Scholar] [CrossRef]
- Wang, X.; Wu, N.; Shimizu, M.; Sakakura, M.; Shimotsuma, Y.; Miura, K.; Zhou, S.; Qiu, J.; Hirao, K. Space selective reduction of europium ions via SrF2 crystals induced by high repetition rate femtosecond laser. J. Ceram. Soc. Jpn. 2011, 119, 939–941. [Google Scholar] [CrossRef]
- Caldino, U.G.; Gruz, C.D.; Monoz, G.H.; Rubio, J.O. Ce3+→Eu2+ energy transfer in CaF2. Solid State Commun. 1989, 4, 347–351. [Google Scholar] [CrossRef]
- Zhou, J.; Xia, Z.; You, H.; Shen, K.; Yang, M.; Liao, L. Synthesis and tunable luminescence properties of Eu2+ and Tb3+-activated Na2Ca4(PO4)3F phosphors based on energy. J. Lumin. 2013, 135, 20–25. [Google Scholar] [CrossRef]
- Katsumata, T.; Nabae, T.; Sasajima, K.; Komuro, S.; Morikawa, T. Effects of composition on the long phosphorescent SrAl2O4 : Eu2 +, Dy3 + Phosphor Crystals. J. Electrochem. Soc. 1997, 144, L243–L245. [Google Scholar] [CrossRef]
- Peng, J.; Hou, S.; Liu, X.; Feng, J.; Yu, X.; Xing, Y.; Su, Z. Hydrothermal synthesis and luminescence properties of hierarchical SrF2 and SrF2:Ln3+ (Ln = Er, Nd, Yb, Eu, Tb) micro/nanocomposite architectures. Mater. Res. Bull. 2012, 47, 328–332. [Google Scholar] [CrossRef]
© 2015 by the authors; licensee MDPI, Basel, Switzerland. This article is an open access article distributed under the terms and conditions of the Creative Commons Attribution license (http://creativecommons.org/licenses/by/4.0/).
Share and Cite
Yagoub, M.Y.A.; Swart, H.C.; Noto, L.L.; Bergman, P.; Coetsee, E. Surface Characterization and Photoluminescence Properties of Ce3+,Eu Co-Doped SrF2 Nanophosphor. Materials 2015, 8, 2361-2375. https://doi.org/10.3390/ma8052361
Yagoub MYA, Swart HC, Noto LL, Bergman P, Coetsee E. Surface Characterization and Photoluminescence Properties of Ce3+,Eu Co-Doped SrF2 Nanophosphor. Materials. 2015; 8(5):2361-2375. https://doi.org/10.3390/ma8052361
Chicago/Turabian StyleYagoub, Mubarak Y. A., Hendrik C. Swart, Luyanda L. Noto, Peber Bergman, and Elizabeth Coetsee. 2015. "Surface Characterization and Photoluminescence Properties of Ce3+,Eu Co-Doped SrF2 Nanophosphor" Materials 8, no. 5: 2361-2375. https://doi.org/10.3390/ma8052361