
Collagen Fibrils in Skin Orient in the Direction of Applied Uniaxial Load in Proportion to Stress while Exhibiting Differential Strains around Hair Follicles

Abstract
:1. Introduction
2. Results and Discussion
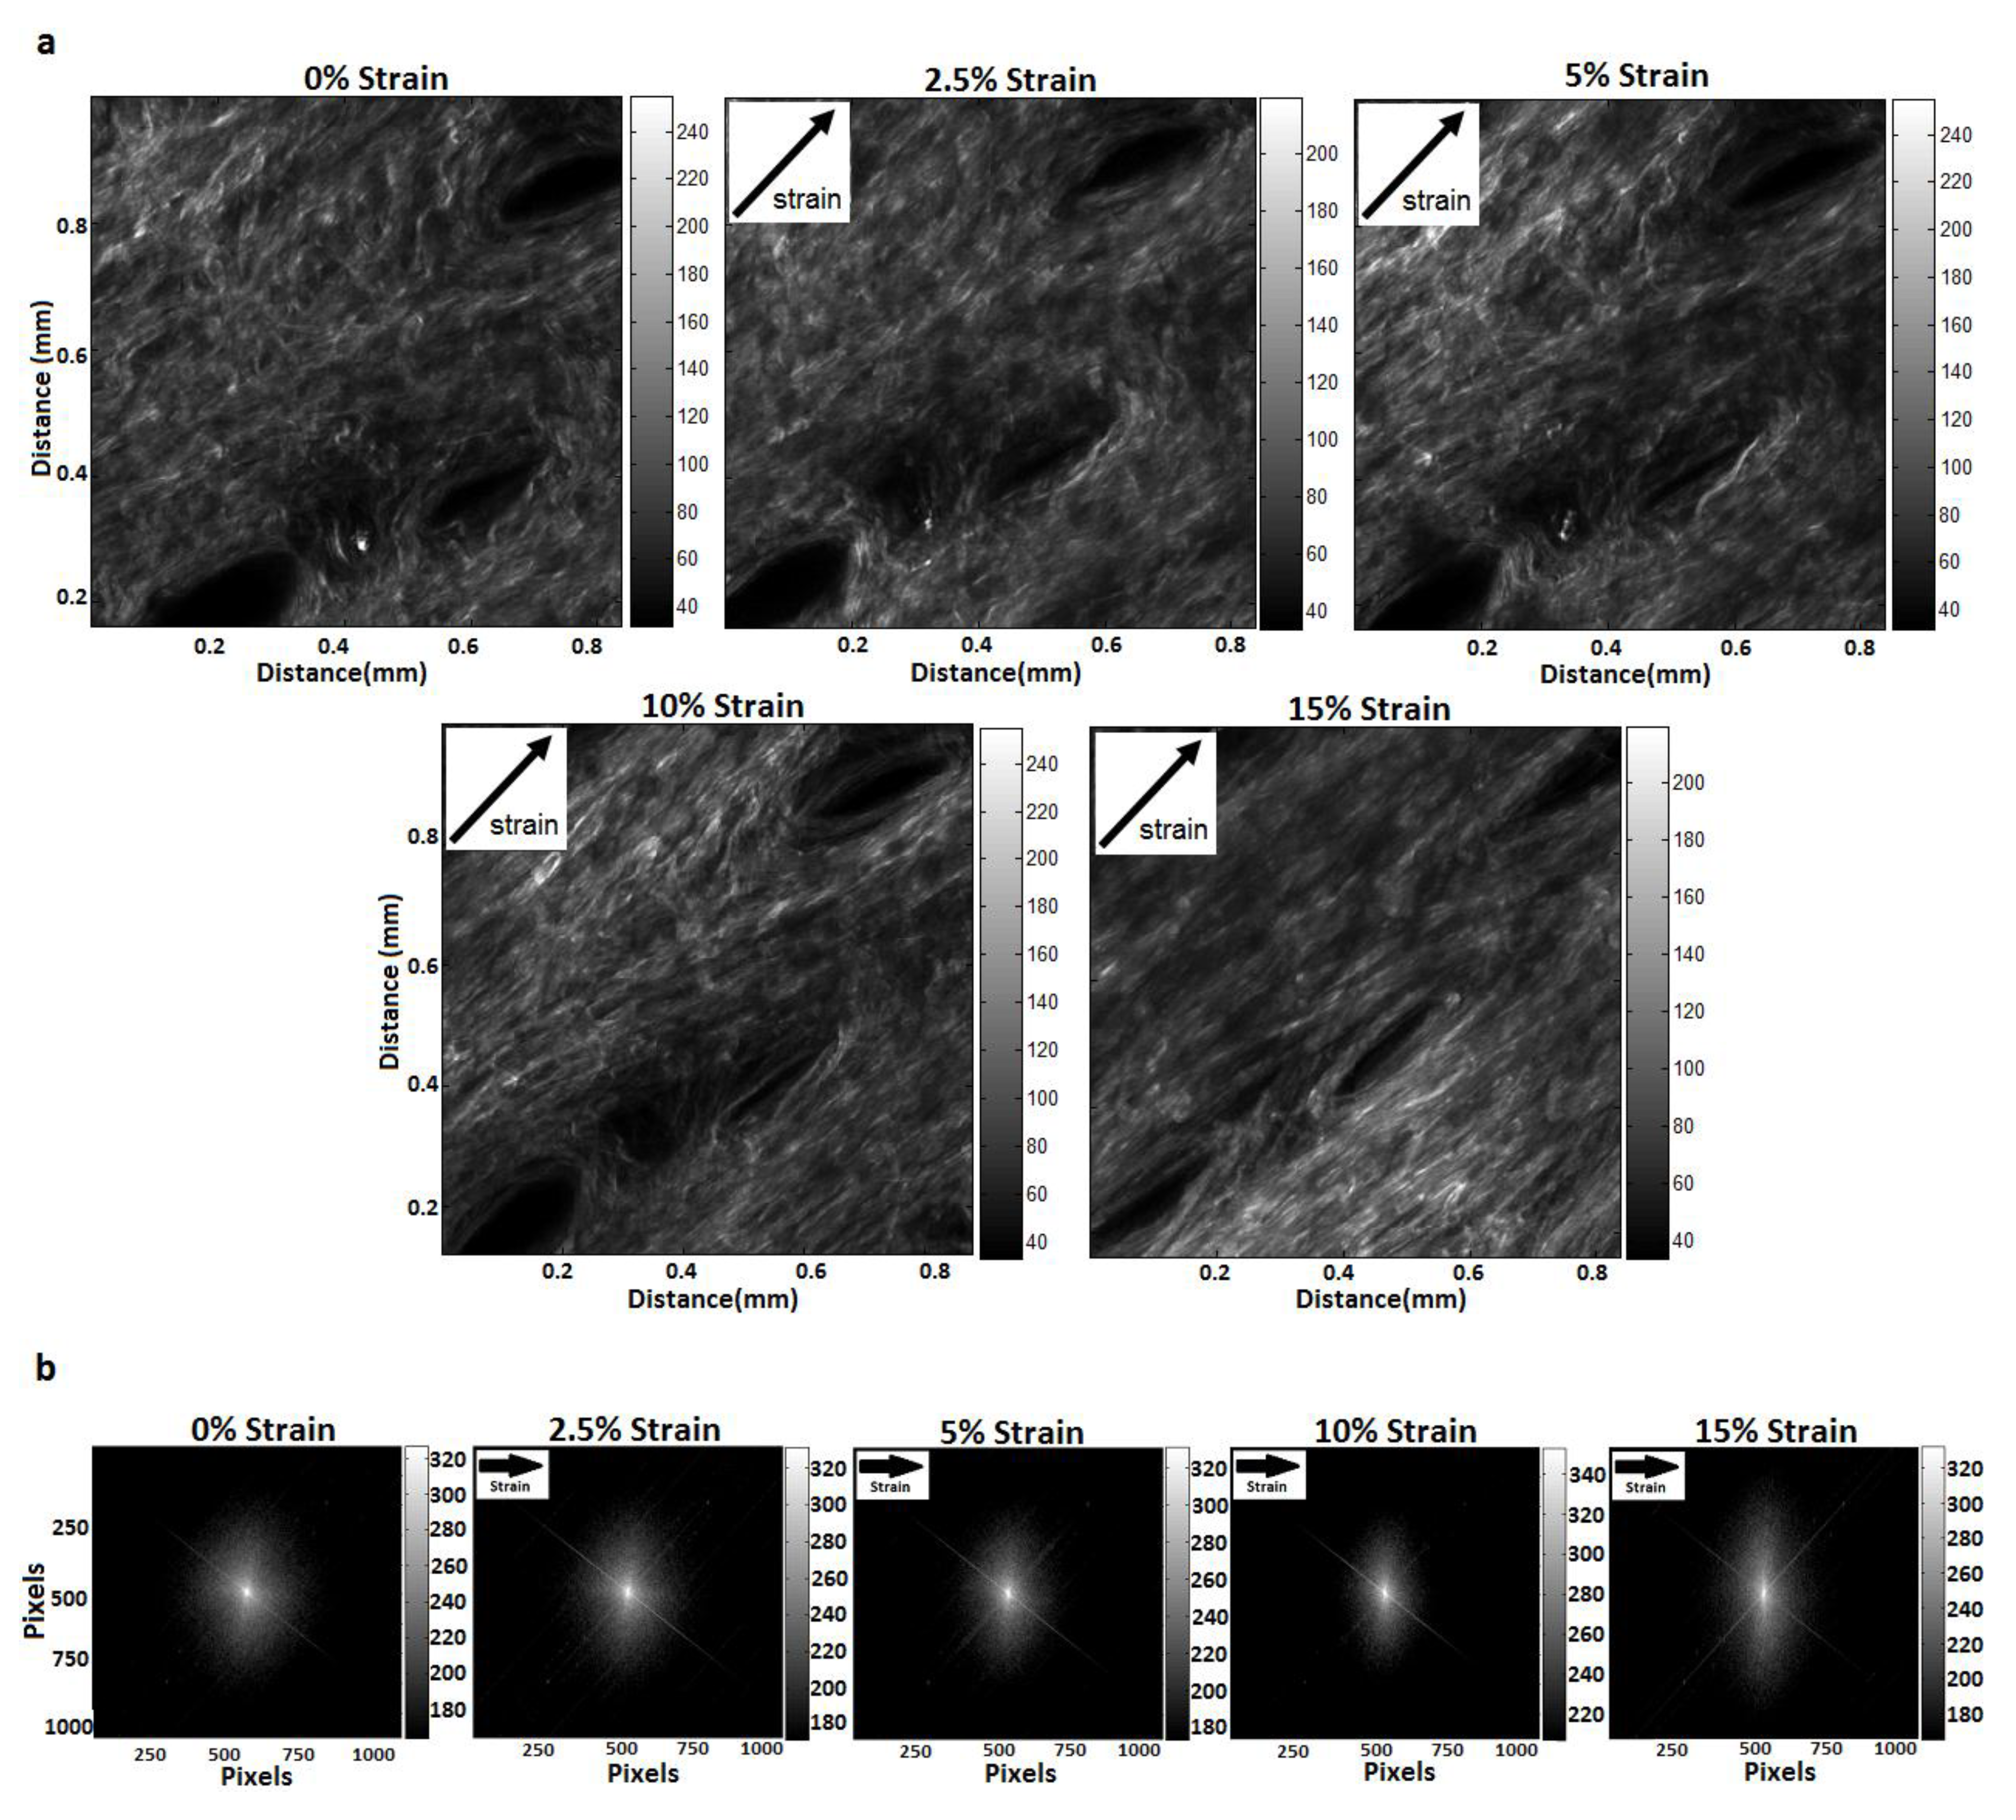
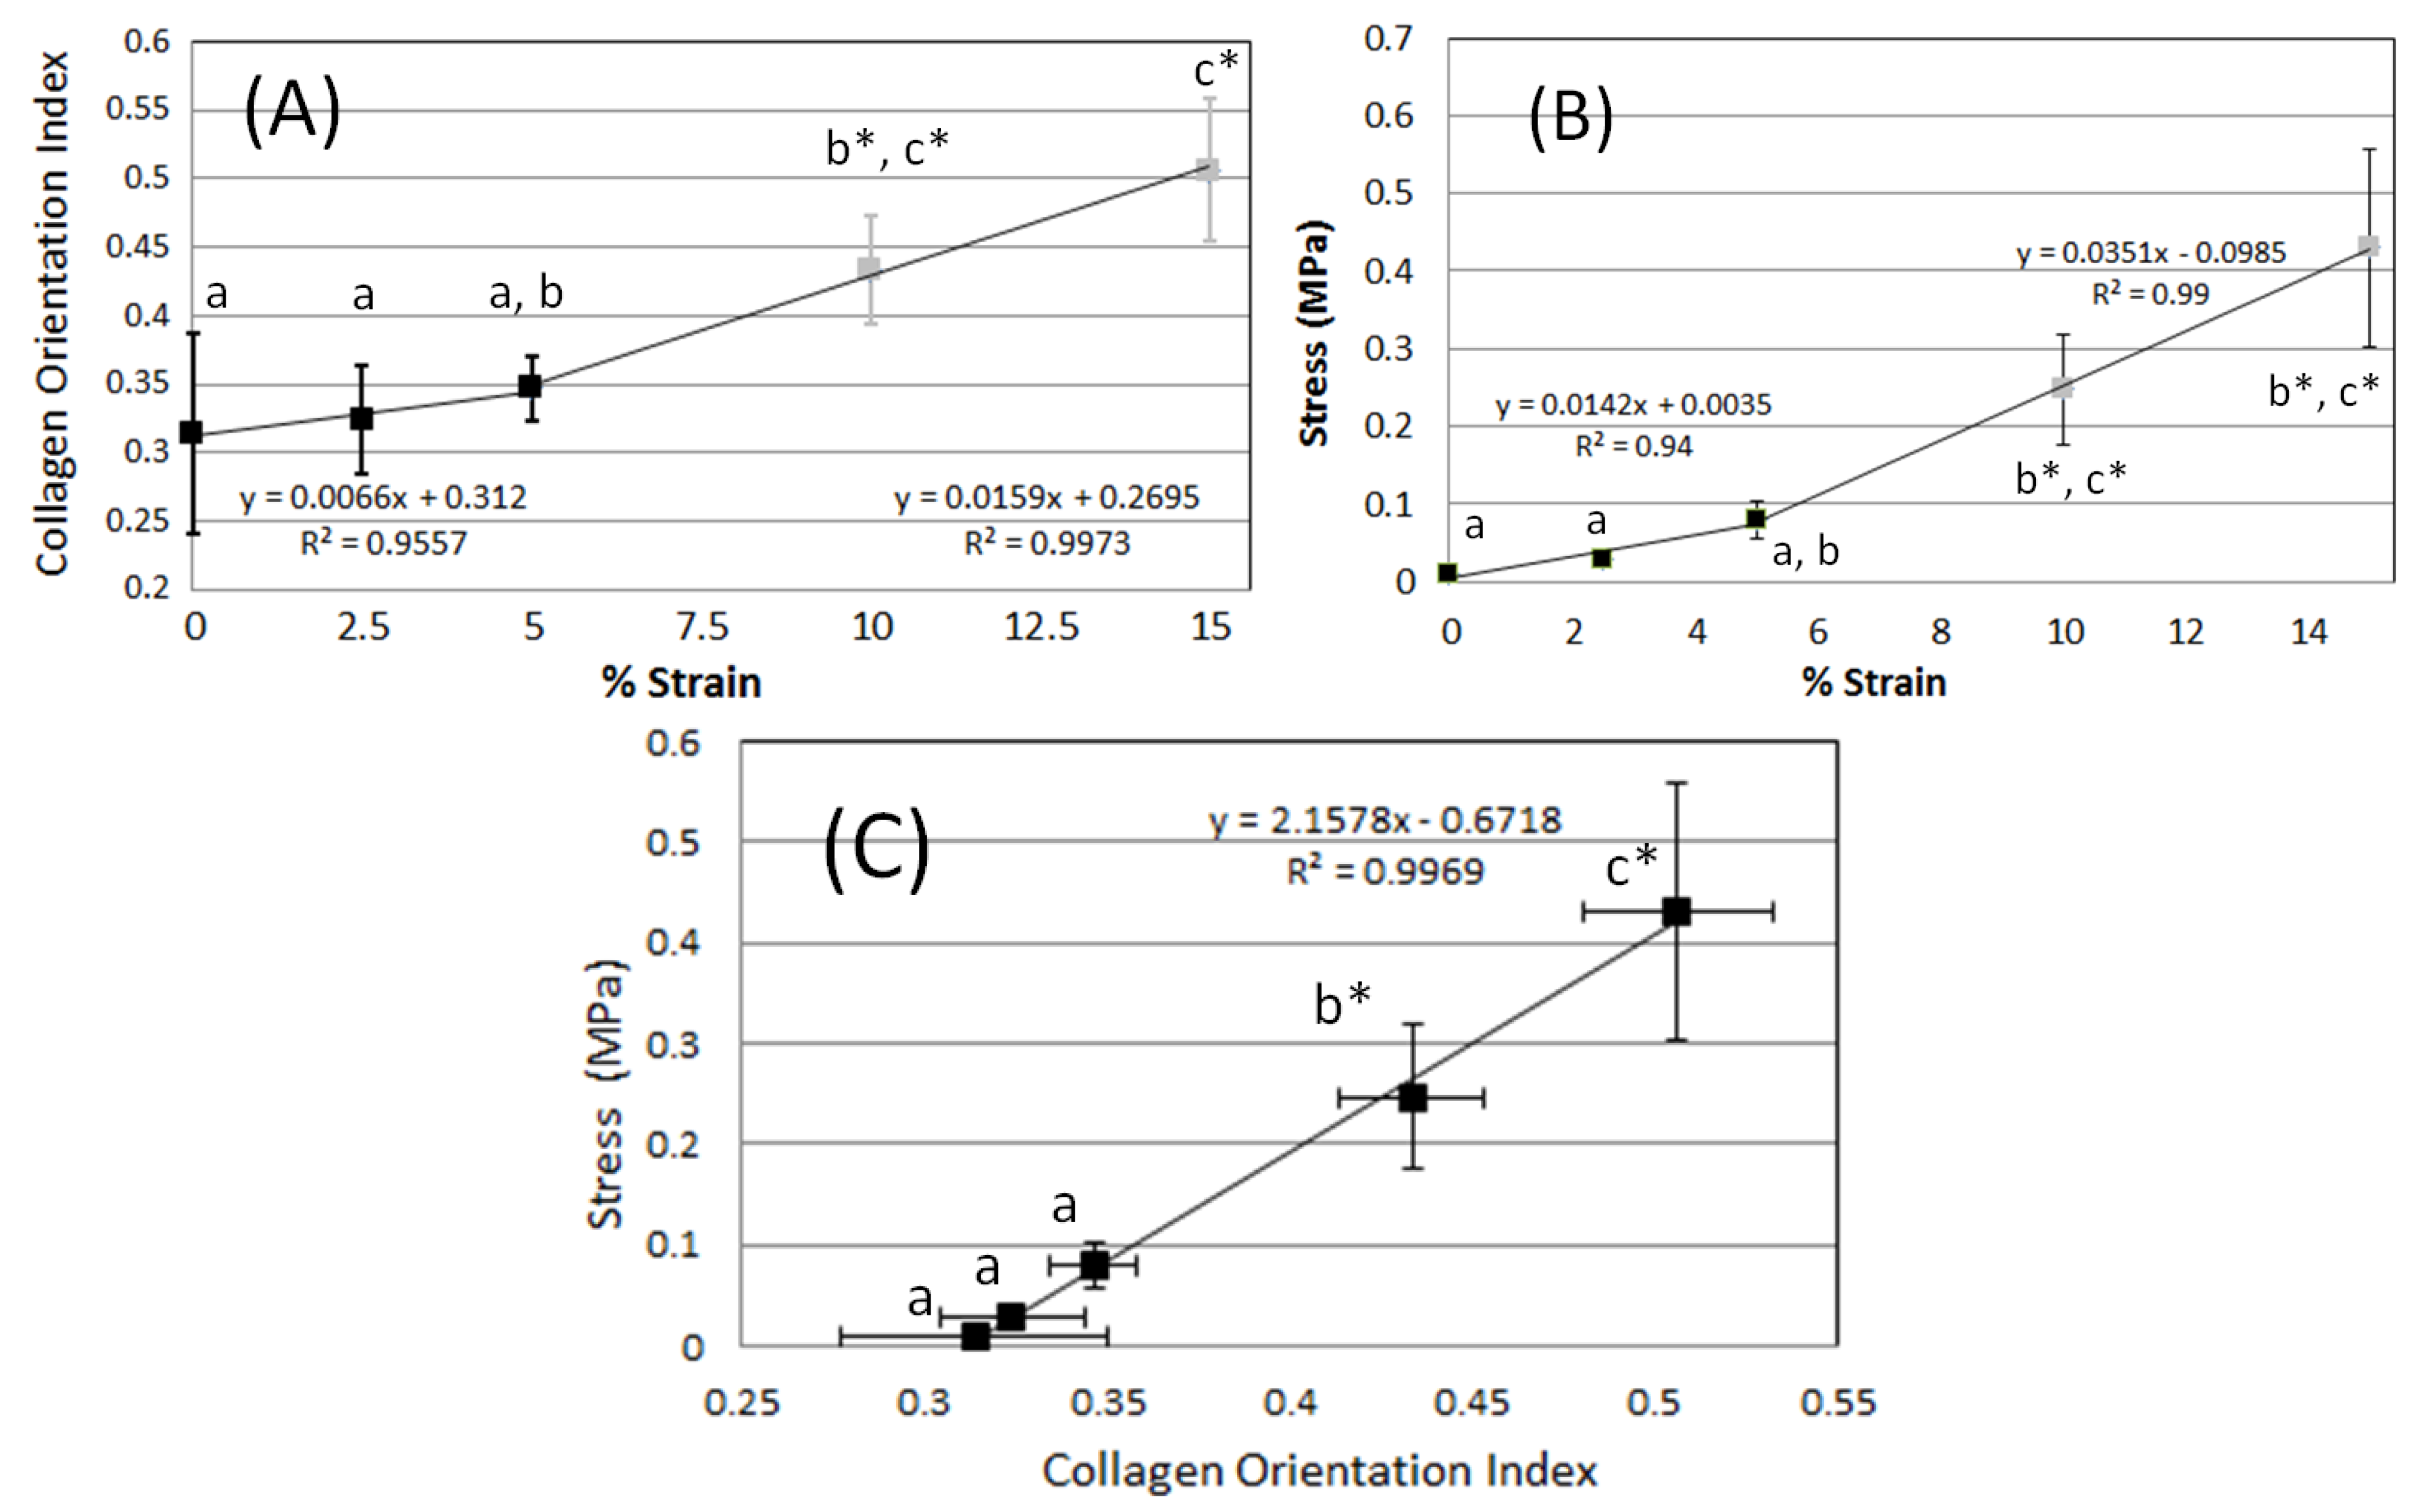
2.1. FFT Analysis of Global Deformation

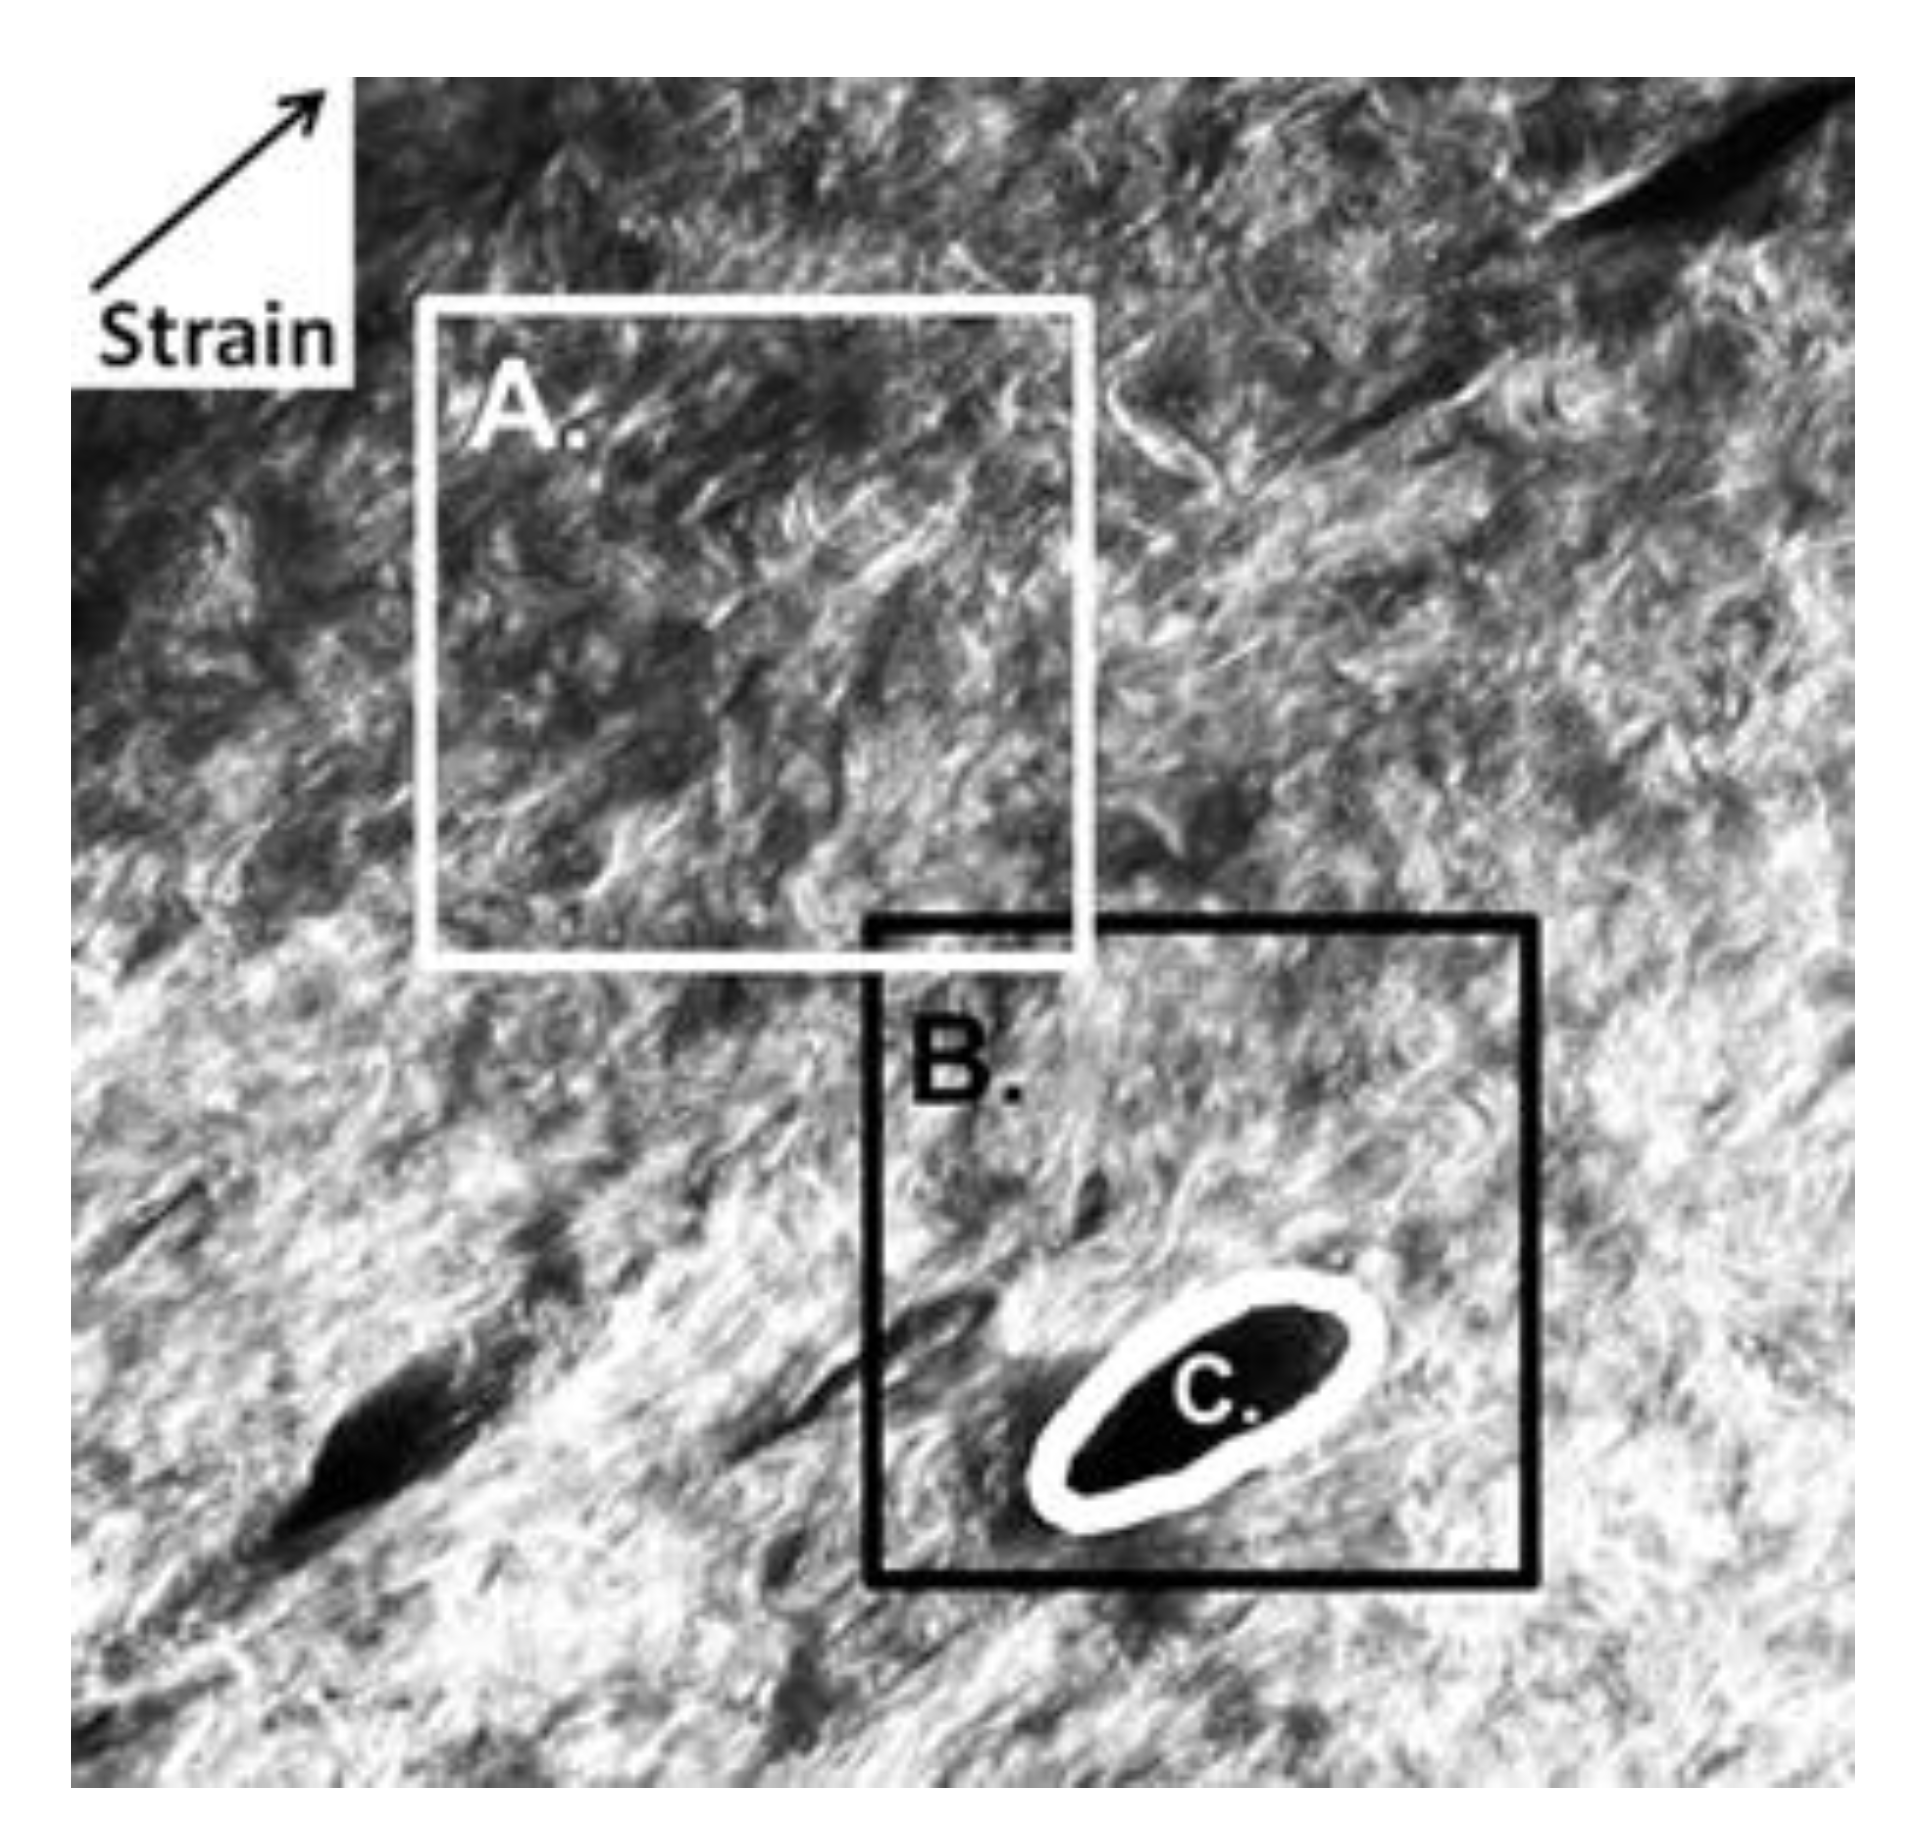
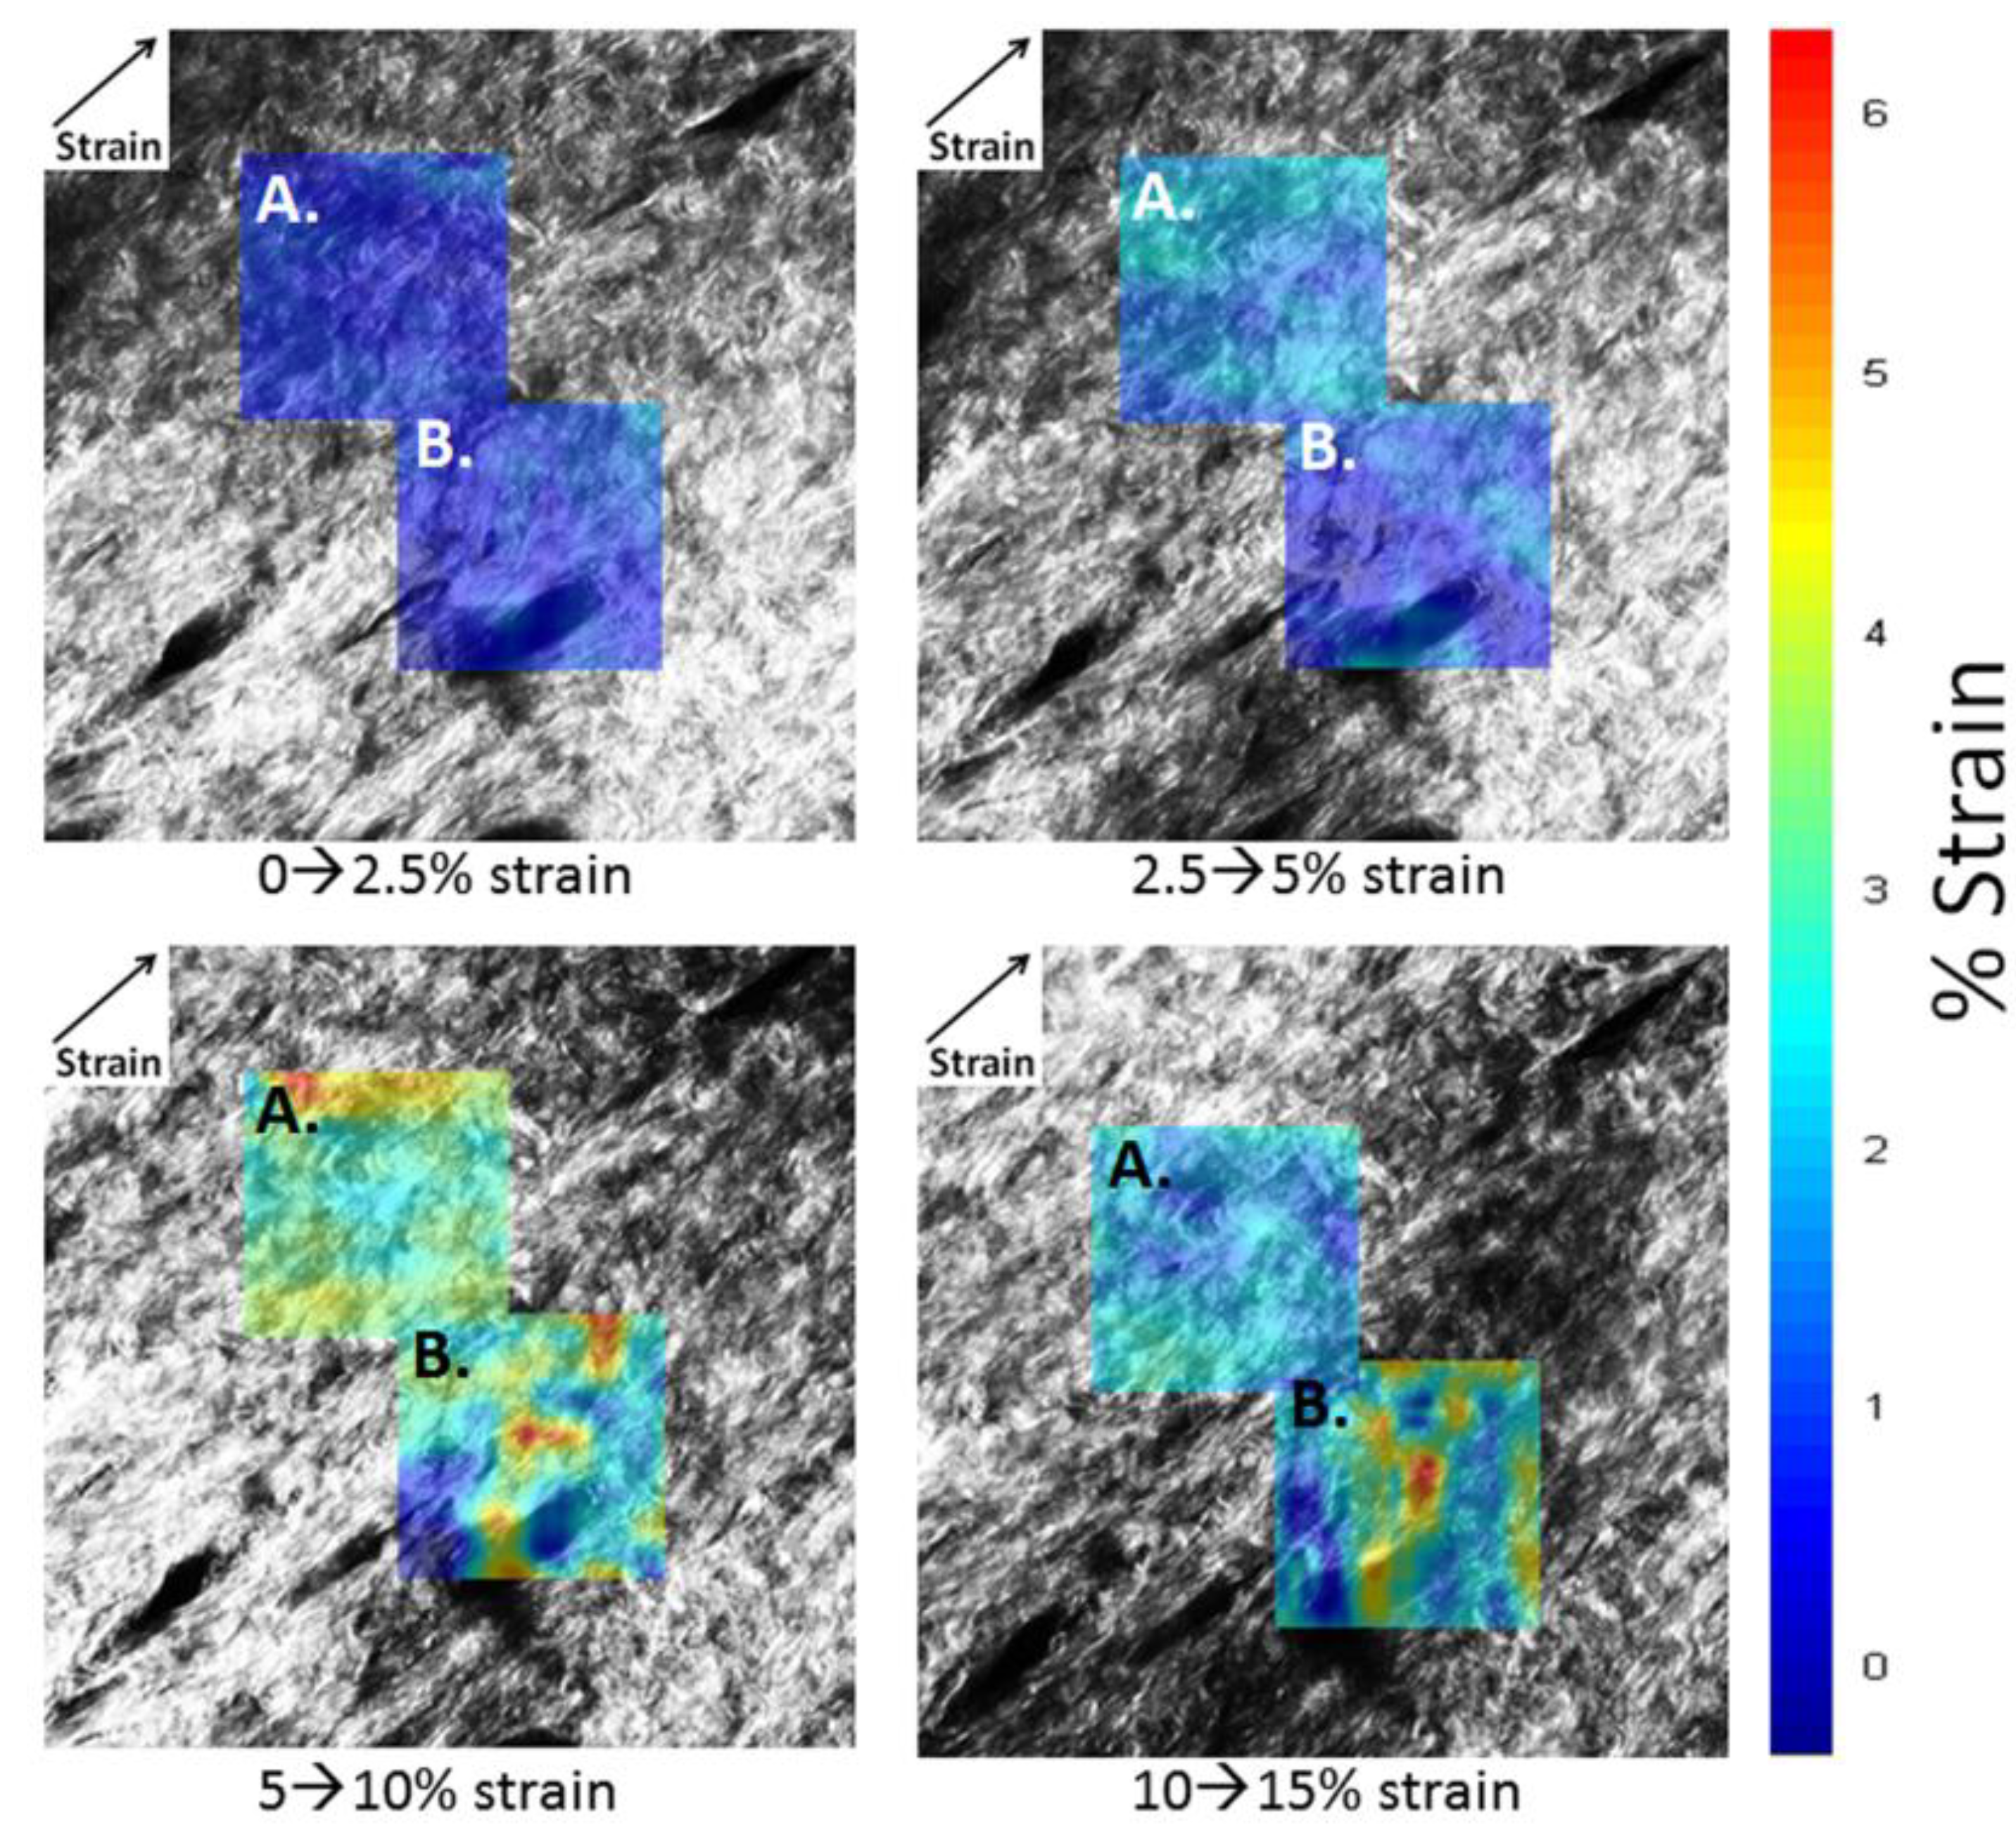
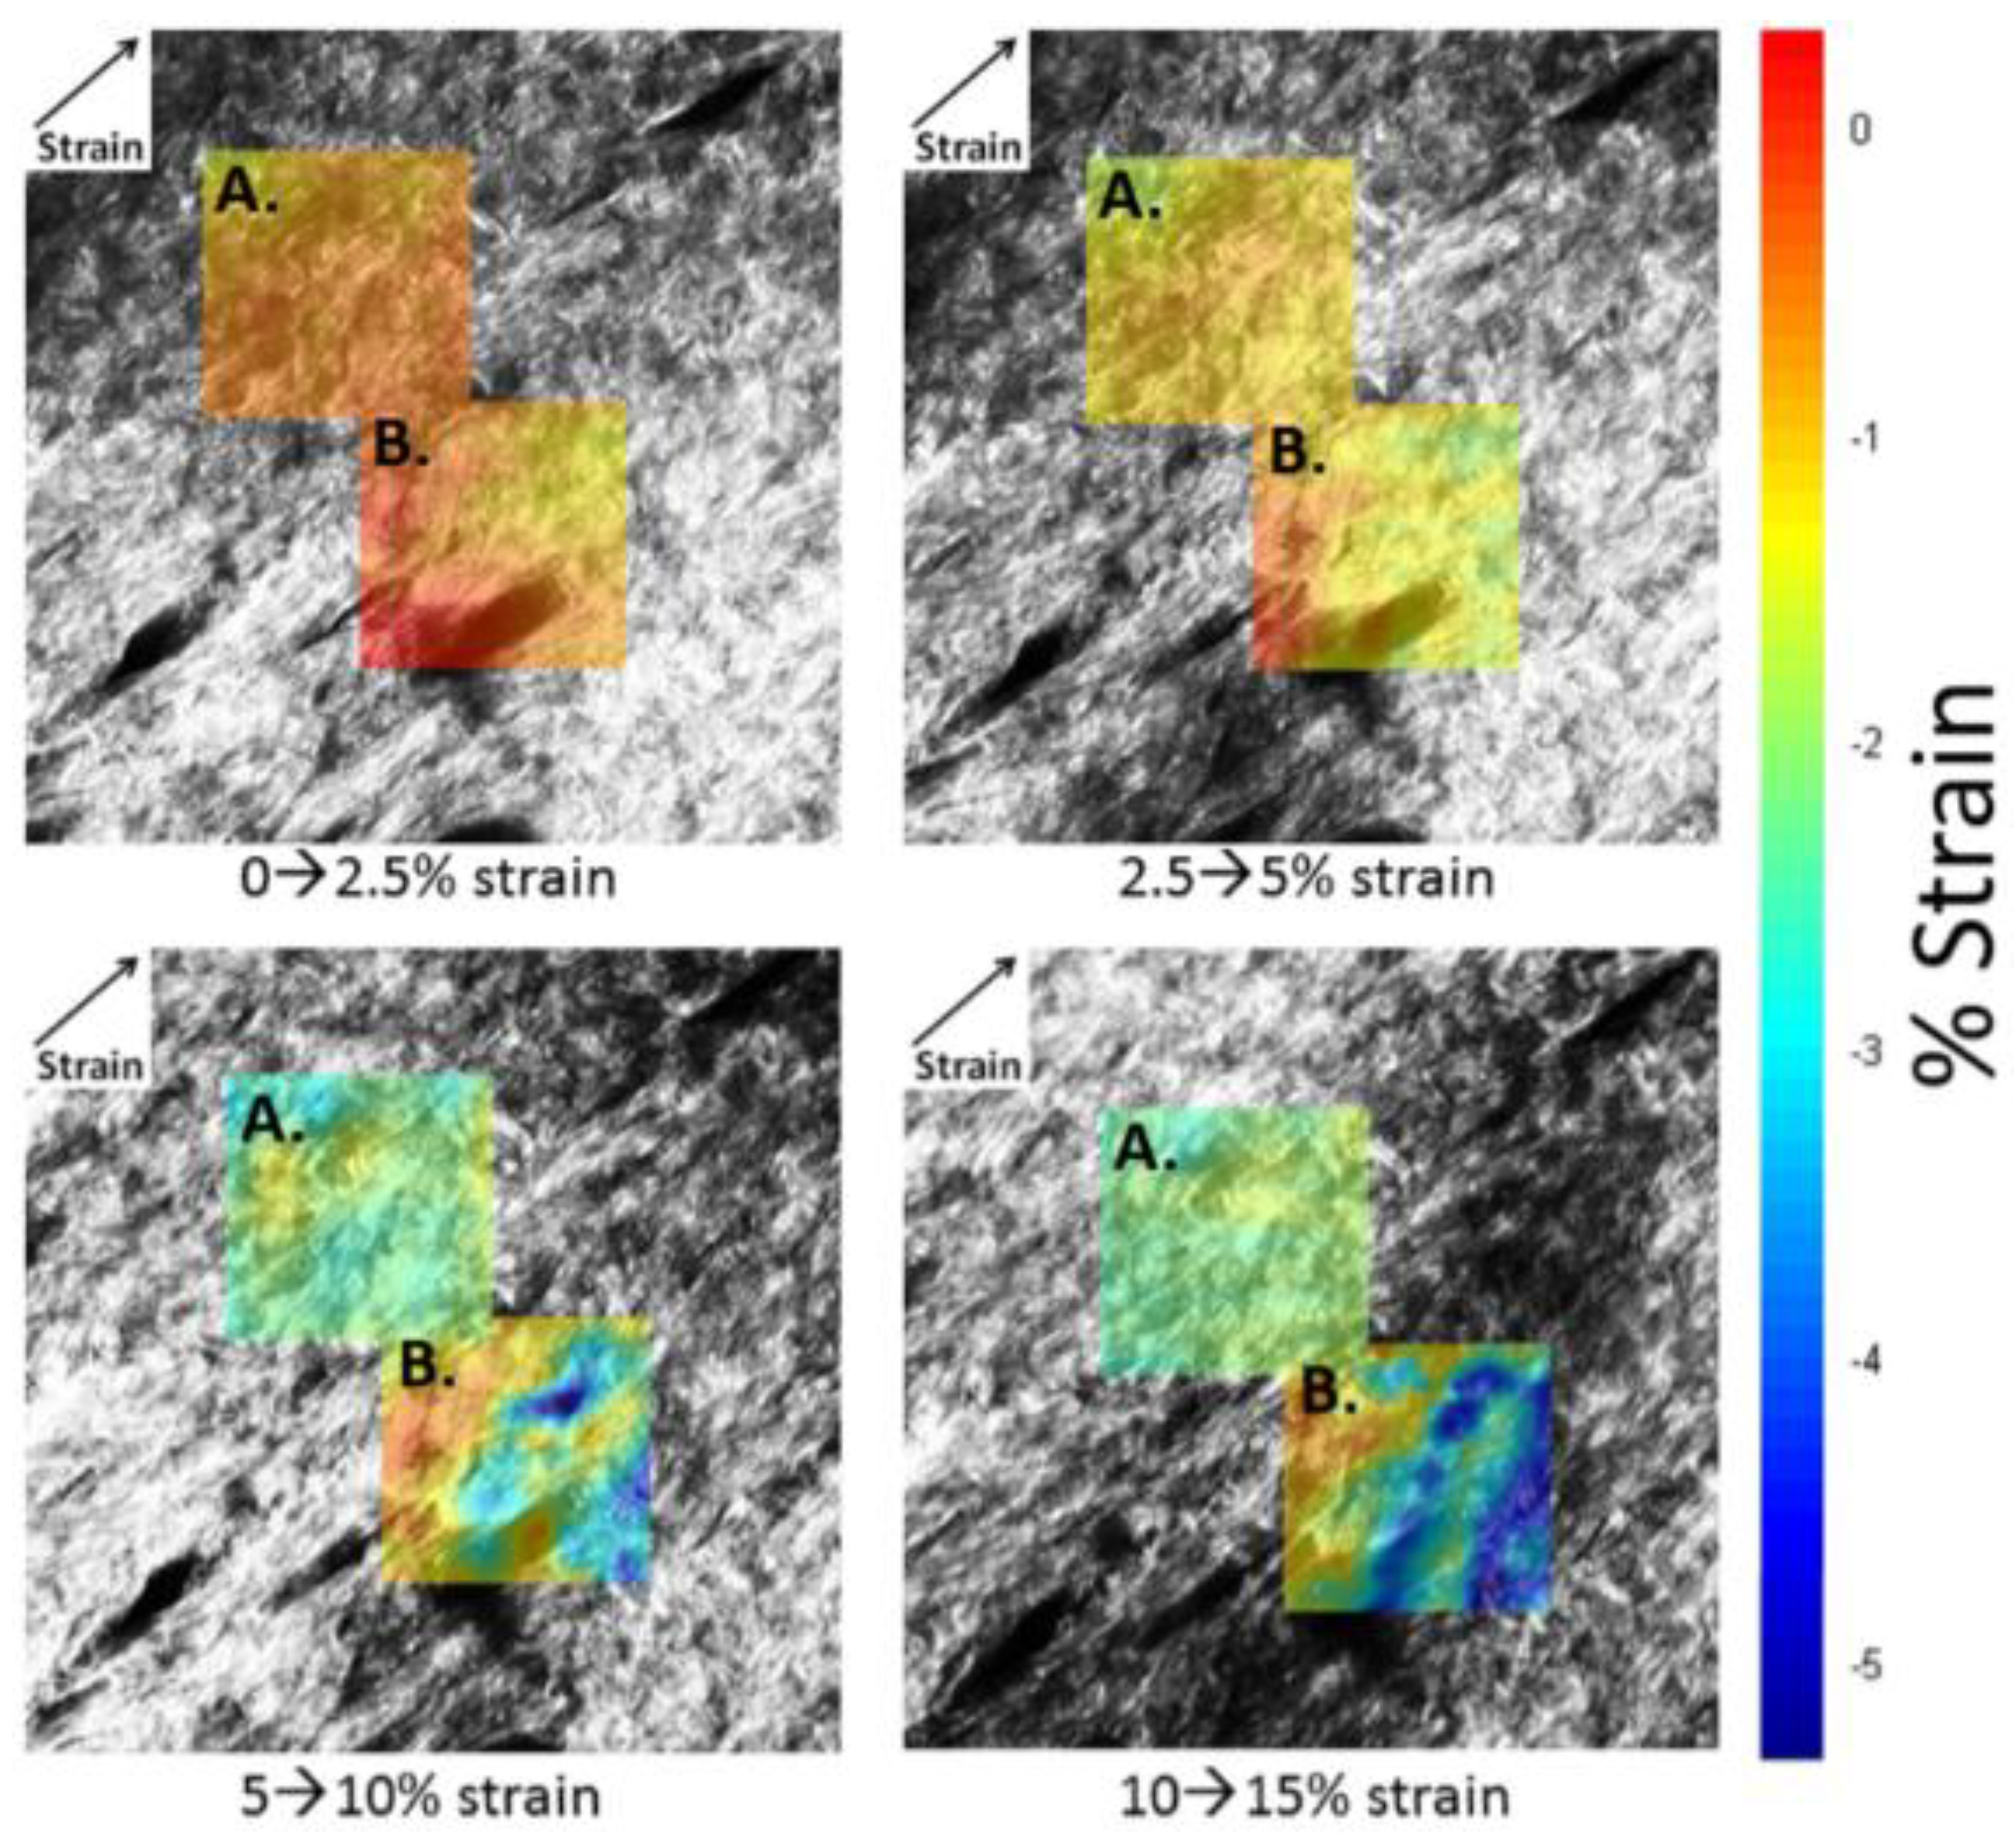
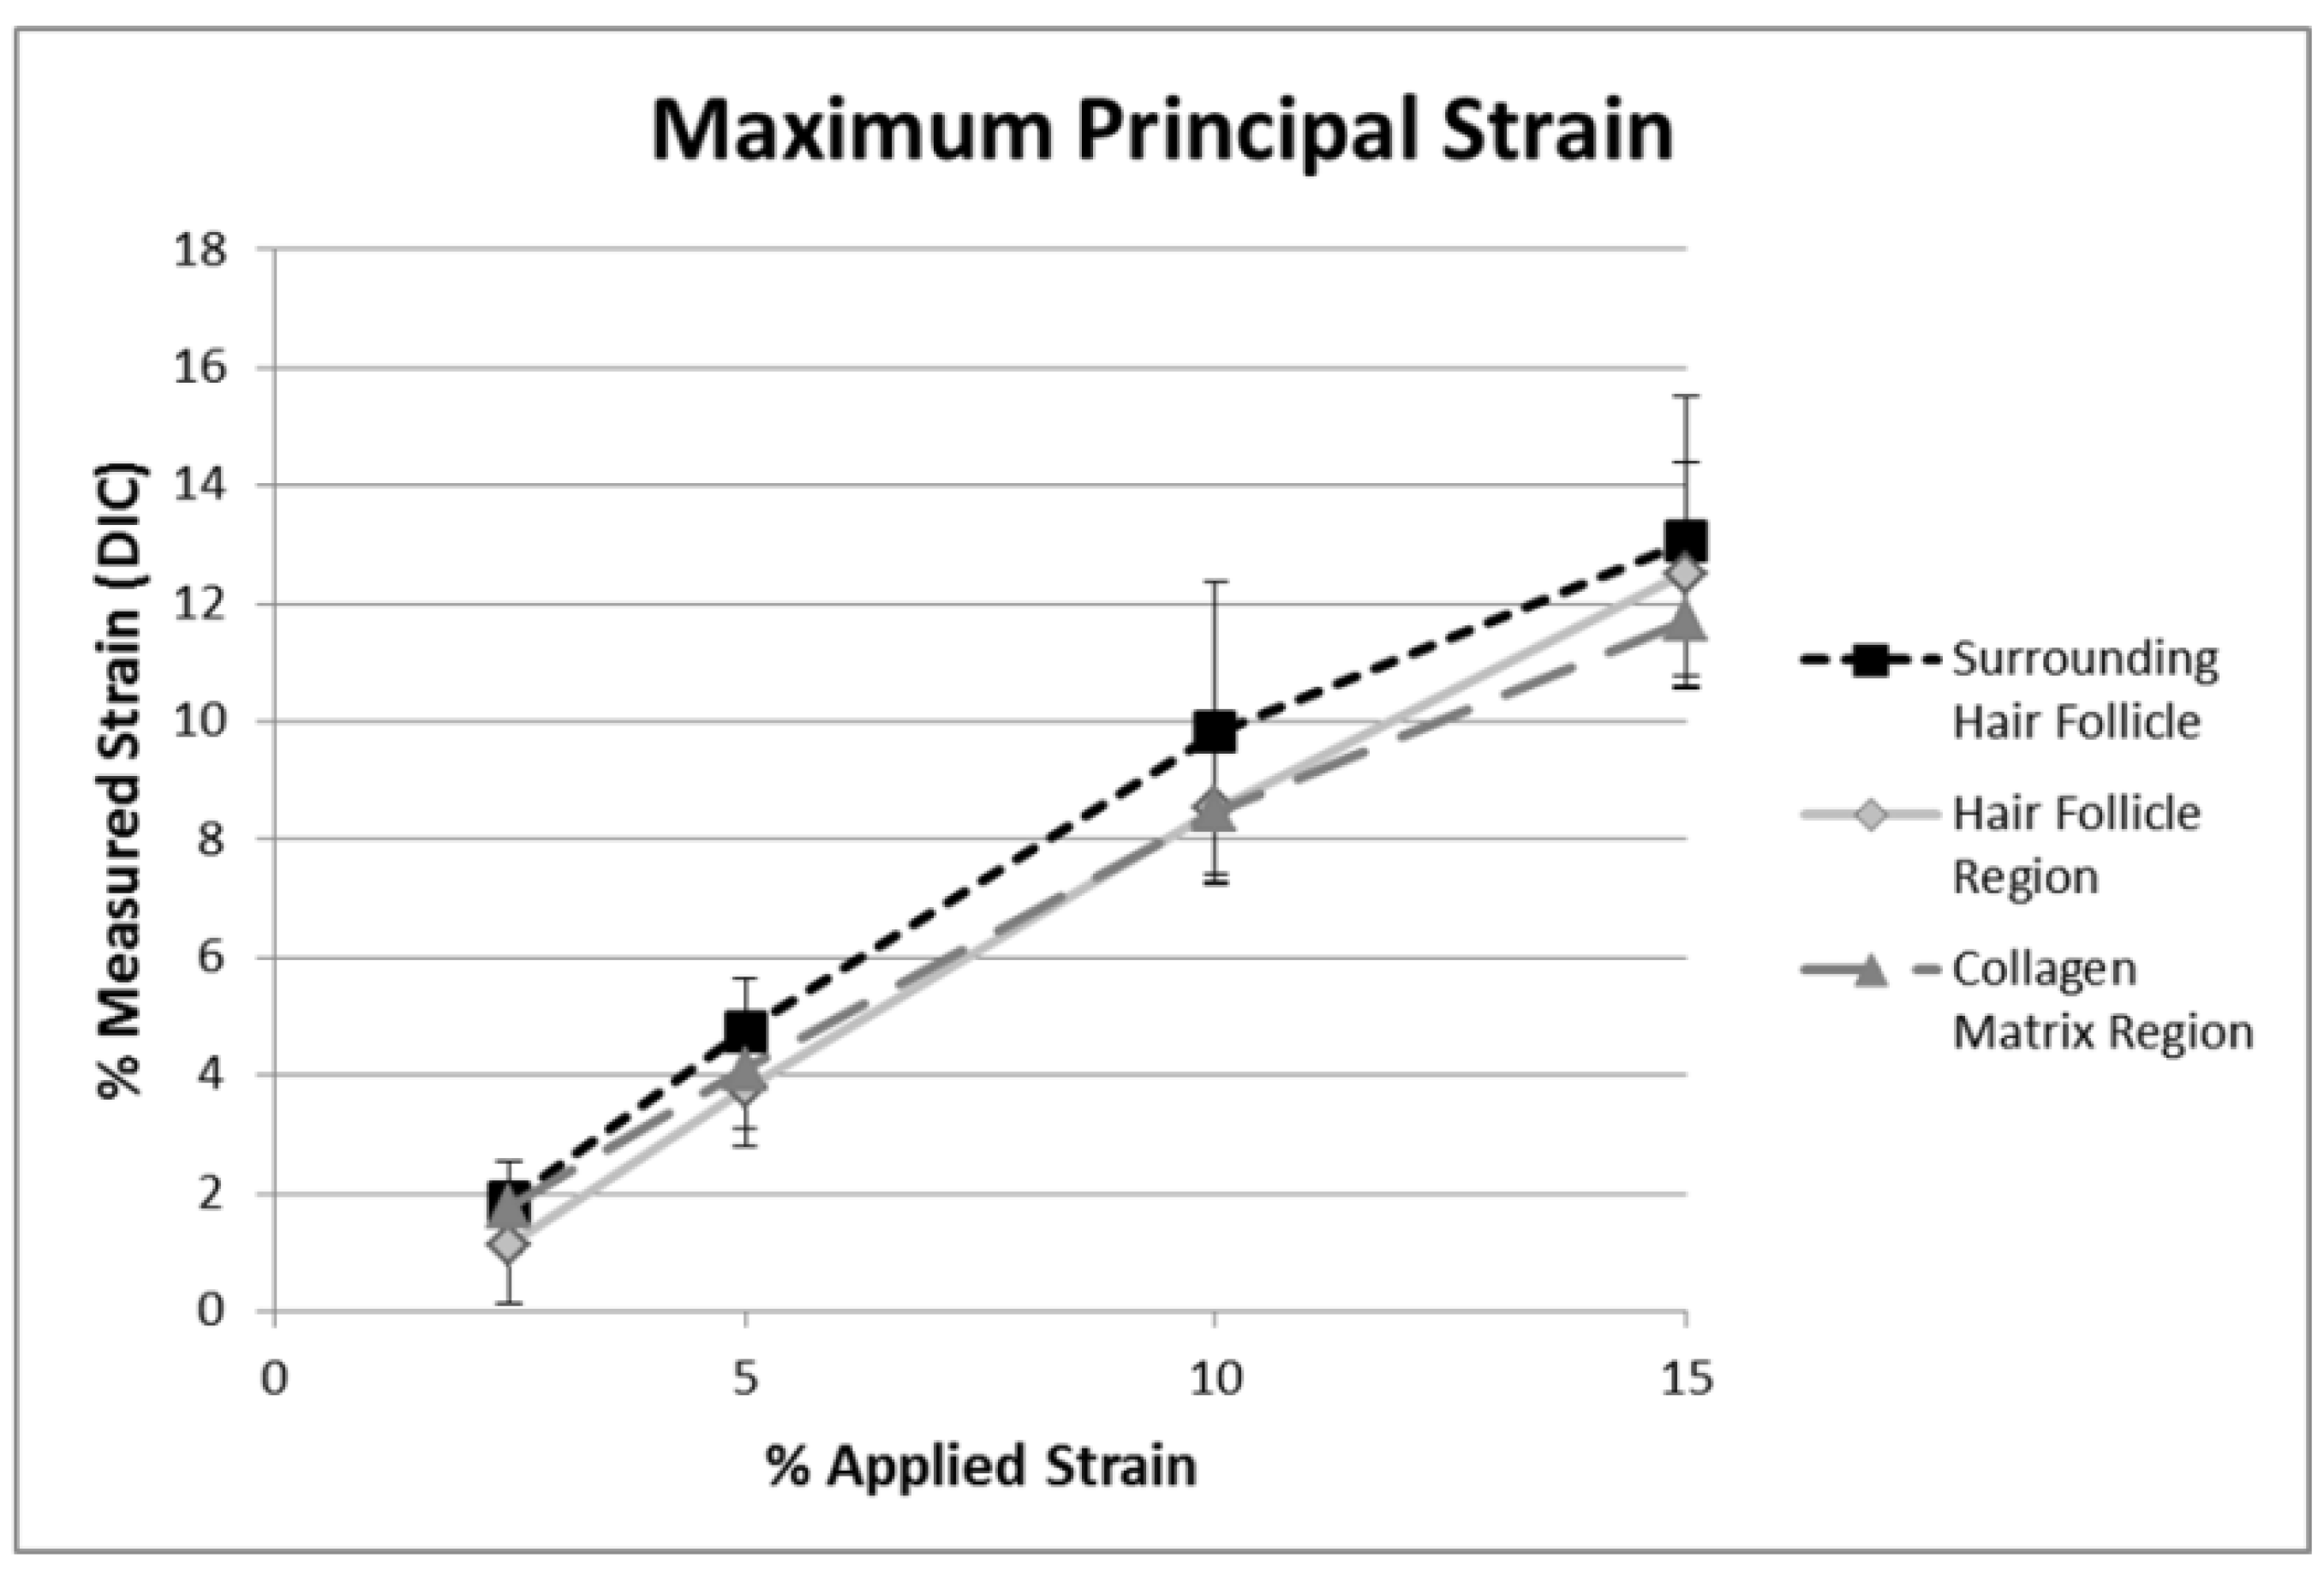
2.2. DIC Analysis of Local Deformation by Strain Maps


2.3. Analysis and Limitations
3. Experimental Section
3.1. Sample Preparation
3.2. Imaging
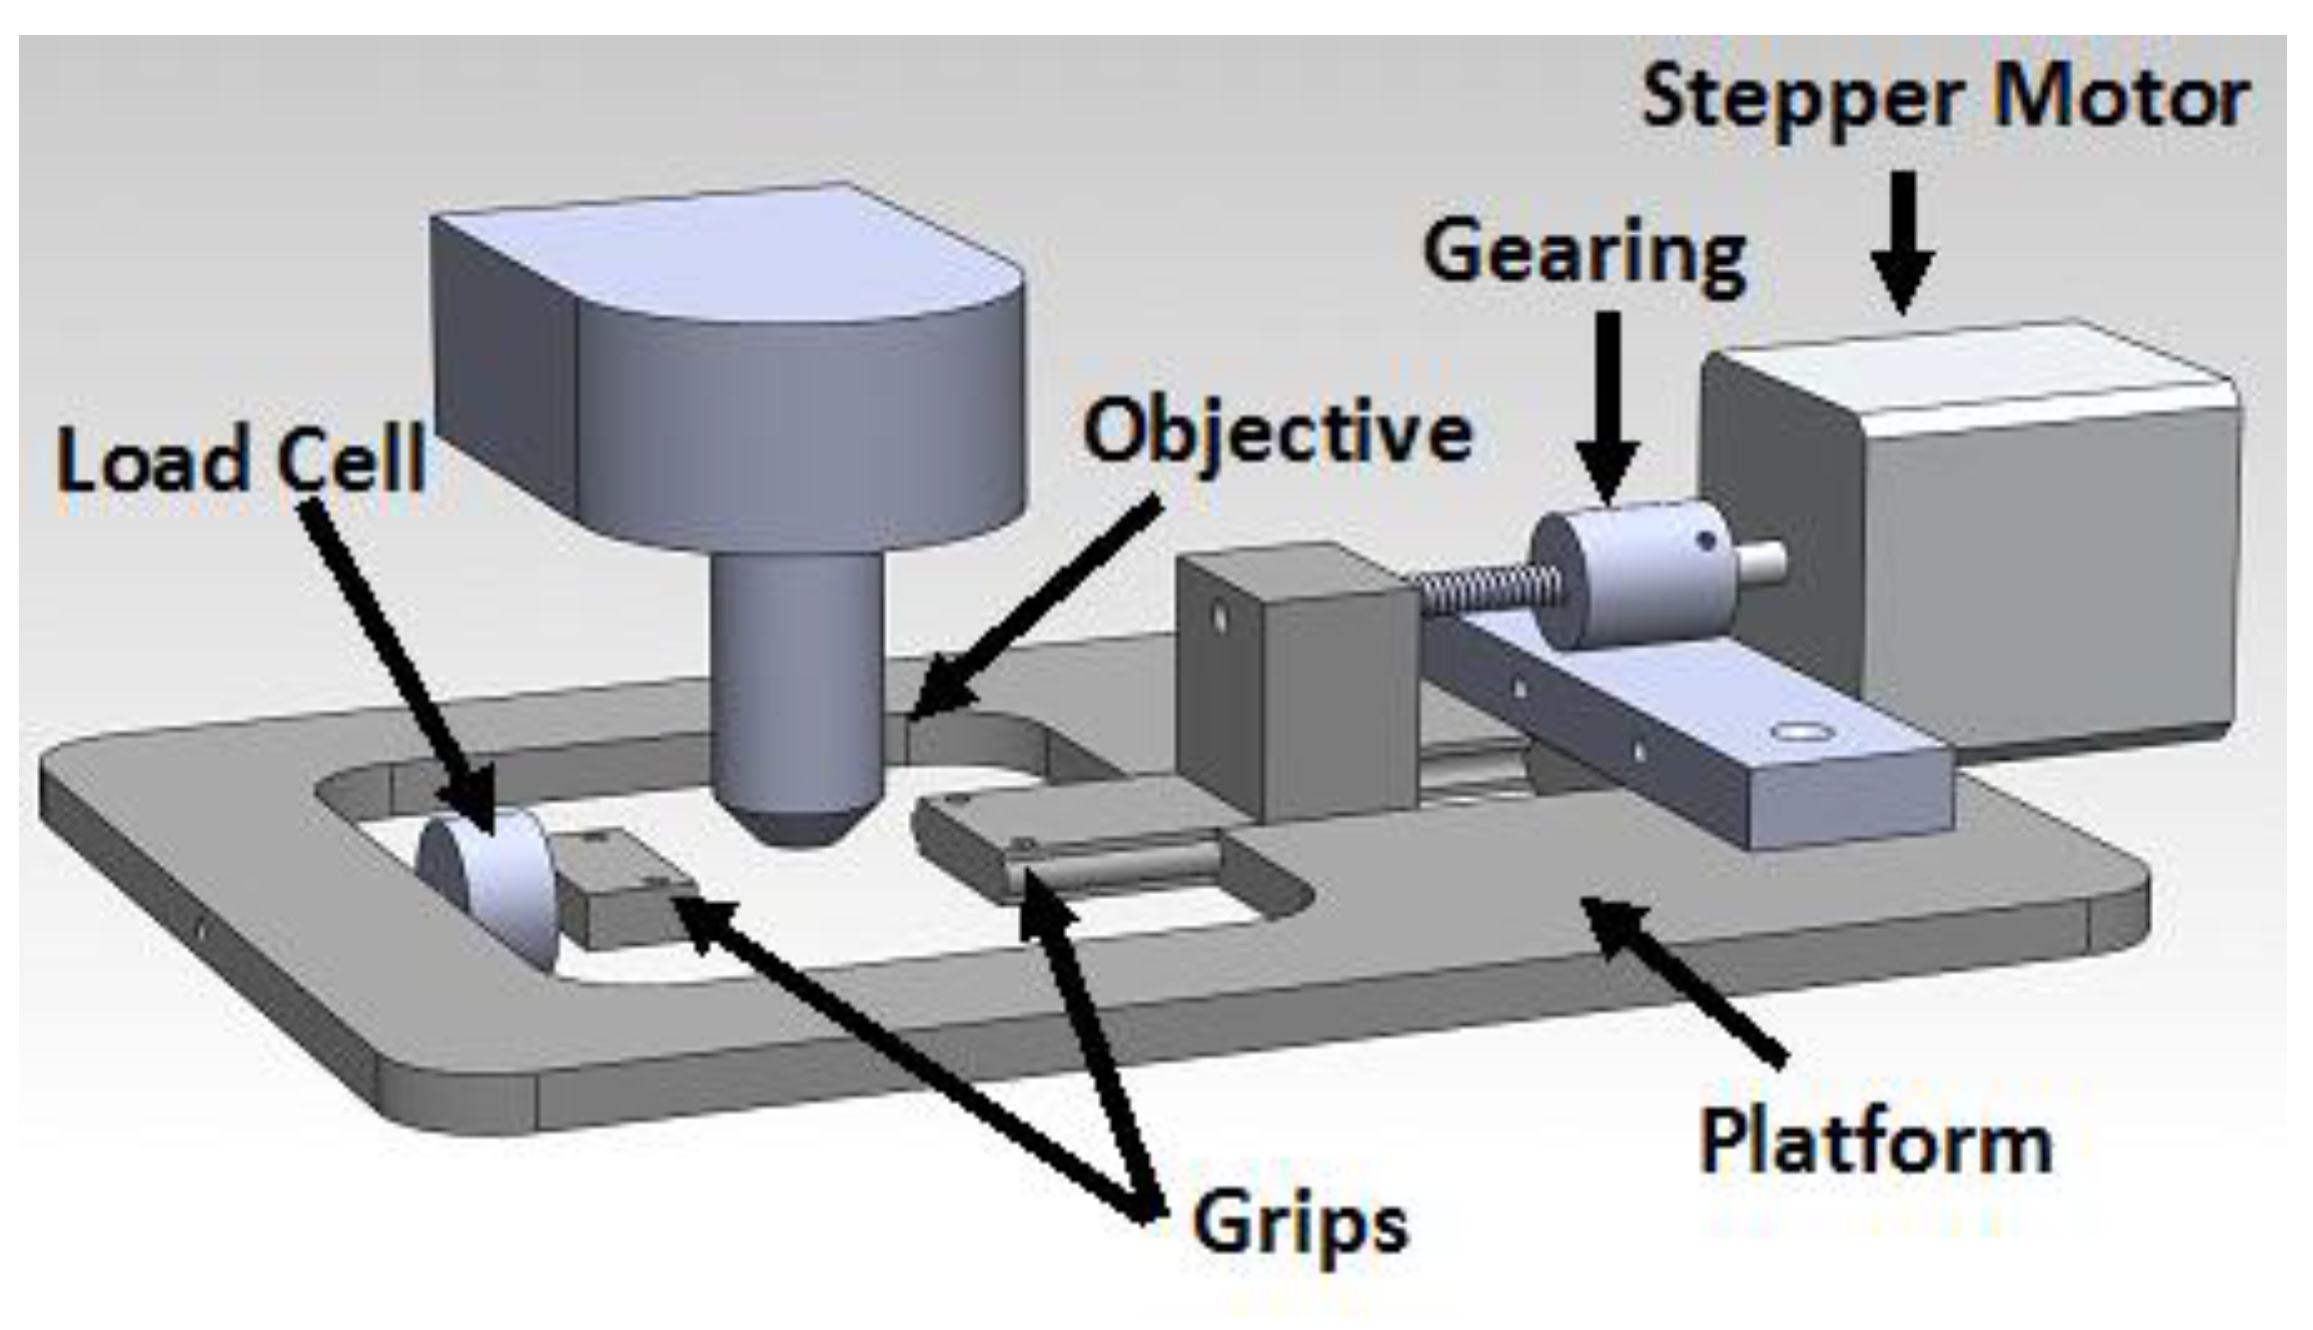
3.3. Stretching

3.4. Fourier Transform Power Spectra Analysis (FFT)

3.5. Digital Image Correlation (DIC)
ε 0%→5% = ε 0%→2.5% + ε 2.5%→5%
ε 0%→10% = ε 0%→2.5% + ε 2.5%→5% + ε 5%→10%
ε 0%→15% = ε 0%→2.5% + ε 2.5%→5% + ε 5%→10% + ε 10%→15%
3.6. Statistics
4. Conclusions
Supplementary Materials
Acknowledgments
Author Contributions
Conflicts of Interest
References
- Brinckmann, P.; Frobin, W.; Leivseth, G. Musculoskeletal Biomechanics; Thieme: Stuttgart, NY, USA, 2002; p. 243. [Google Scholar]
- Silver, F.H.; Freeman, J.W.; de Vore, D. Viscoelastic properties of human skin and processed dermis. Skin Res. Technol. 2001, 7, 18–23. [Google Scholar] [CrossRef] [PubMed]
- Daly, C.H. Biomechanical properties of dermis. J. Invest. Dermatol. 1982, 79, 17s–20s. [Google Scholar] [CrossRef] [PubMed]
- Williams, R.M.; Zipfel, W.R.; Webb, W.W. Interpreting second-harmonic generation images of collagen i fibrils. Biophys. J. 2005, 88, 1377–1386. [Google Scholar] [CrossRef] [PubMed]
- Auada, M.P.; Adam, R.L.; Leite, N.J.; Puzzi, M.B.; Cintra, M.L.; Rizzo, W.B.; Metze, K. Texture analysis of the epidermis based on fast fourier transformation in sjogren-larsson syndrome. Anal. Quant. Cytol. Histol. 2006, 28, 219–227. [Google Scholar] [PubMed]
- Cicchi, R.; Kapsokalyvas, D.; de Giorgi, V.; Maio, V.; van Wiechen, A.; Massi, D.; Lotti, T.; Pavone, F.S. Scoring of collagen organization in healthy and diseased human dermis by multiphoton microscopy. J. Biophoton. 2010, 3, 34–43. [Google Scholar] [CrossRef]
- Lu, K.; Chen, J.; Zhuo, S.; Zheng, L.; Jiang, X.; Zhu, X.; Zhao, J. Multiphoton laser scanning microscopy of localized scleroderma. Skin Res. Technol. 2009, 15, 489–495. [Google Scholar] [CrossRef] [PubMed]
- Levitt, J.M.; McLaughlin-Drubin, M.E.; Munger, K.; Georgakoudi, I. Automated biochemical, morphological, and organizational assessment of precancerous changes from endogenous two-photon fluorescence images. PLoS One 2011, 6, e24765. [Google Scholar] [CrossRef] [PubMed]
- Wu, S.; Li, H.; Yang, H.; Zhang, X.; Li, Z.; Xu, S. Quantitative analysis on collagen morphology in aging skin based on multiphoton microscopy. J. Biomed. Opt. 2011, 16, 040502. [Google Scholar] [CrossRef] [PubMed]
- Zhu, X.; Zhuo, S.; Zheng, L.; Lu, K.; Jiang, X.; Chen, J.; Lin, B. Quantified characterization of human cutaneous normal scar using multiphoton microscopy. J. Biophoton. 2010, 3, 108–116. [Google Scholar] [CrossRef]
- Greco, V.; Chen, T.; Rendl, M.; Schober, M.; Pasolli, H.A.; Stokes, N.; Dela Cruz-Racelis, J.; Fuchs, E. A two-step mechanism for stem cell activation during hair regeneration. Cell Stem Cell 2009, 4, 155–169. [Google Scholar] [CrossRef] [PubMed]
- Tiede, S.; Kloepper, J.E.; Bodo, E.; Tiwari, S.; Kruse, C.; Paus, R. Hair follicle stem cells: Walking the maze. Eur. J. Cell Biol. 2007, 86, 355–376. [Google Scholar] [CrossRef] [PubMed]
- Bruck, H.A.; McNeill, S.R.; Sutton, M.A.; Peters, W.H., III. Digital image correlation using newton-raphson method of partial differential correction. Exp. Mech. 1989, 29, 261–267. [Google Scholar] [CrossRef]
- Chu, T.C.; Ranson, W.F.; Sutton, M.A. Applications of digital-image-correlation techniques to experimental mechanics. Exp. Mech. 1985, 25, 232–244. [Google Scholar] [CrossRef]
- Ni Annaidh, A.; Bruyere, K.; Destrade, M.; Gilchrist, M.D.; Ottenio, M. Characterization of the anisotropic mechanical properties of excised human skin. J. Mech. Behav. Biomed. Mater. 2012, 5, 139–148. [Google Scholar]
- Staloff, I.A.; Guan, E.; Katz, S.; Rafailovitch, M.; Sokolov, A.; Sokolov, S. An in vivo study of the mechanical properties of facial skin and influence of aging using digital image speckle correlation. Skin Res. Technol. 2008, 14, 127–134. [Google Scholar] [CrossRef] [PubMed]
- Wentzell, S.; Sterling Nesbitt, R.; Macione, J.; Kotha, S. Measuring strain using digital image correlation of second harmonic generation images. J. Biomech. 2013, 46, 2032–2038. [Google Scholar] [CrossRef] [PubMed]
- Abraham, T.; Fong, G.; Scott, A. Second harmonic generation analysis of early achilles tendinosis in response to in vivo mechanical loading. BMC Musculoskel Dis. 2011, 12, 26. [Google Scholar] [CrossRef]
- Frisch, K.E.; Duenwald-Kuehl, S.E.; Kobayashi, H.; Chamberlain, C.S.; Lakes, R.S.; Vanderby, R. Quantification of collagen organization using fractal dimensions and fourier transforms. Acta Histochem. 2012, 114, 140–144. [Google Scholar] [CrossRef] [PubMed]
- Fung, D.T.; Sereysky, J.B.; Basta-Pljakic, J.; Laudier, D.M.; Huq, R.; Jepsen, K.J.; Schaffler, M.B.; Flatow, E.L. Second harmonic generation imaging and fourier transform spectral analysis reveal damage in fatigue-loaded tendons. Ann. Biomed. Eng. 2010, 38, 1741–1751. [Google Scholar] [CrossRef] [PubMed]
- Sinclair, E.B.; Andarawis-Puri, N.; Ros, S.J.; Laudier, D.M.; Jepsen, K.J.; Hausman, M.R. Relating applied strain to the type and severity of structural damage in the rat median nerve using second harmonic generation microscopy. Muscle Nerve 2012, 46, 899–907. [Google Scholar] [CrossRef] [PubMed]
- Alavi, S.H.; Ruiz, V.; Krasieva, T.; Botvinick, E.L.; Kheradvar, A. Characterizing the collagen fiber orientation in pericardial leaflets under mechanical loading conditions. Ann. Biomed. Eng. 2013, 41, 547–561. [Google Scholar] [CrossRef] [PubMed]
- Jor, J.W.; Nash, M.P.; Nielsen, P.M.; Hunter, P.J. Estimating material parameters of a structurally based constitutive relation for skin mechanics. Biomech. Model. Mechanobiol. 2011, 10, 767–778. [Google Scholar] [CrossRef] [PubMed]
- Brown, I.A. A scanning electron microscope study of the effects of uniaxial tension on human skin. Br. J. Dermatol. 1973, 89, 383–393. [Google Scholar] [CrossRef] [PubMed]
- Basil-Jones, M.M.; Edmonds, R.L.; Cooper, S.M.; Kirby, N.; Hawley, A.; Haverkamp, R.G. Collagen fibril orientation and tear strength across ovine skins. J. Agric. Food Chem. 2013, 61, 12327–12332. [Google Scholar] [CrossRef] [PubMed]
- Basil-Jones, M.M.; Edmonds, R.L.; Cooper, S.M.; Haverkamp, R.G. Collagen fibril orientation in ovine and bovine leather affects strength: A small angle x-ray scattering (saxs) study. J. Agric. Food Chem. 2011, 59, 9972–9979. [Google Scholar] [CrossRef] [PubMed]
- Annaidh, A.N.; Bruyere, K.; Destrade, M.; Gilchrist, M.D.; Maurini, C.; Ottenio, M.; Saccomandi, G. Automated estimation of collagen fibre dispersion in the dermis and its contribution to the anisotropic behaviour of skin. Ann. Biomed. Eng. 2012, 40, 1666–1678. [Google Scholar] [CrossRef] [PubMed]
- Chen, H.; Liu, Y.; Zhao, X.F.; Lanir, Y.; Kassab, G.S. A micromechanics finite-strain constitutive model of fibrous tissue. J. Mech. Phys. Solids 2011, 59, 1823–1837. [Google Scholar] [CrossRef] [PubMed]
- Jor, J.W.Y.; Parker, M.D.; Taberner, A.J.; Nash, M.P.; Nielsen, P.M.F. Computational and experimental characterization of skin mechanics: Identifying current challenges and future directions. Wires Syst. Biol. Med. 2013, 5, 539–556. [Google Scholar] [CrossRef]
- Lokshin, O.; Lanir, Y. Micro and macro rheology of planar tissues. Biomaterials 2009, 30, 3118–3127. [Google Scholar] [CrossRef] [PubMed]
- Raub, C.B.; Suresh, V.; Krasieva, T.; Lyubovitsky, J.; Mih, J.D.; Putnam, A.J.; Tromberg, B.J.; George, S.C. Noninvasive assessment of collagen gel microstructure and mechanics using multiphoton microscopy. Biophys. J. 2007, 92, 2212–2222. [Google Scholar] [CrossRef] [PubMed]
- Balbir-Gurman, A.; Denton, C.P.; Nichols, B.; Knight, C.J.; Nahir, A.M.; Martin, G.; Black, C.M. Non-invasive measurement of biomechanical skin properties in systemic sclerosis. Ann. Rheum. Dis. 2002, 61, 237–241. [Google Scholar] [CrossRef] [PubMed]
- Gusachenko, I.; Tran, V.; Houssen, Y.G.; Allain, J.M.; Schanne-Klein, M.C. Polarization-resolved second-harmonic generation in tendon upon mechanical stretching. Biophys. J. 2012, 102, 2220–2229. [Google Scholar] [CrossRef] [PubMed] [Green Version]
- Smith, D.R.; Winters, D.G.; Bartels, R.A. Submillisecond second harmonic holographic imaging of biological specimens in three dimensions. Proc. Natl. Acad. Sci. USA 2013, 110, 18391–18396. [Google Scholar] [CrossRef] [PubMed]
- Macione, J.; Nesbitt, S.; Pandit, V.; Kotha, S. Design and analysis of a novel mechanical loading machine for dynamic in vivo axial loading. Rev. Sci. Instrum. 2012, 83, 025113. [Google Scholar] [CrossRef] [PubMed]
- Van Zuijlen, P.P.; Ruurda, J.J.; van Veen, H.A.; van Marle, J.; van Trier, A.J.; Groenevelt, F.; Kreis, R.W.; Middelkoop, E. Collagen morphology in human skin and scar tissue: No adaptations in response to mechanical loading at joints. Burns 2003, 29, 423–431. [Google Scholar]
- Xia, D.; Zhang, S.; Hjortdal, J.O.; Li, Q.; Thomsen, K.; Chevallier, J.; Besenbacher, F.; Dong, M. Hydrated human corneal stroma revealed by quantitative dynamic atomic force microscopy at nanoscale. ACS Nano 2014, 8, 6873–6882. [Google Scholar] [CrossRef] [PubMed]
© 2015 by the authors; licensee MDPI, Basel, Switzerland. This article is an open access article distributed under the terms and conditions of the Creative Commons Attribution license (http://creativecommons.org/licenses/by/4.0/).
Share and Cite
Nesbitt, S.; Scott, W.; Macione, J.; Kotha, S. Collagen Fibrils in Skin Orient in the Direction of Applied Uniaxial Load in Proportion to Stress while Exhibiting Differential Strains around Hair Follicles. Materials 2015, 8, 1841-1857. https://doi.org/10.3390/ma8041841
Nesbitt S, Scott W, Macione J, Kotha S. Collagen Fibrils in Skin Orient in the Direction of Applied Uniaxial Load in Proportion to Stress while Exhibiting Differential Strains around Hair Follicles. Materials. 2015; 8(4):1841-1857. https://doi.org/10.3390/ma8041841
Chicago/Turabian StyleNesbitt, Sterling, Wentzell Scott, James Macione, and Shiva Kotha. 2015. "Collagen Fibrils in Skin Orient in the Direction of Applied Uniaxial Load in Proportion to Stress while Exhibiting Differential Strains around Hair Follicles" Materials 8, no. 4: 1841-1857. https://doi.org/10.3390/ma8041841