1. Introduction
Fabrication of a provisional prosthesis or restoration is an essential procedure for all indirect restoration and an important stage in prosthodontics [
1]. Provisional restorations protect prepared teeth, stabilize the maxillary and mandibular teeth’s relationship, address the patient’s aesthetic concerns and keep the patient comfortable from the initial tooth preparation appointment to the cementation of the permanent restoration [
2]. In addition, they allow evaluation of the tooth preparation, maintain gingival health, and serve as an adjunct to periodontal therapy and as an assessment of the patient’s oral hygiene. Commonly used materials for provisional restoration are methacrylate resins and bis-acryl resin [
3].
Polymethyl methacrylate (PMMA) and polyethyl methacrylate (PEMA) are methacrylate resins. They were the first available provisional methacrylate restorative material in dentistry. They stain easily due to their porosity and are color unstable. PMMA first appeared around 1940 and remains the most common material for fabrication of provisional restorations and dentures [
3]. It is strong and lightweight with a high coefficient of thermal expansion. It is relatively inexpensive and capable of high polish. However, it has a strong odor, poor durability and high polymerization shrinkage.
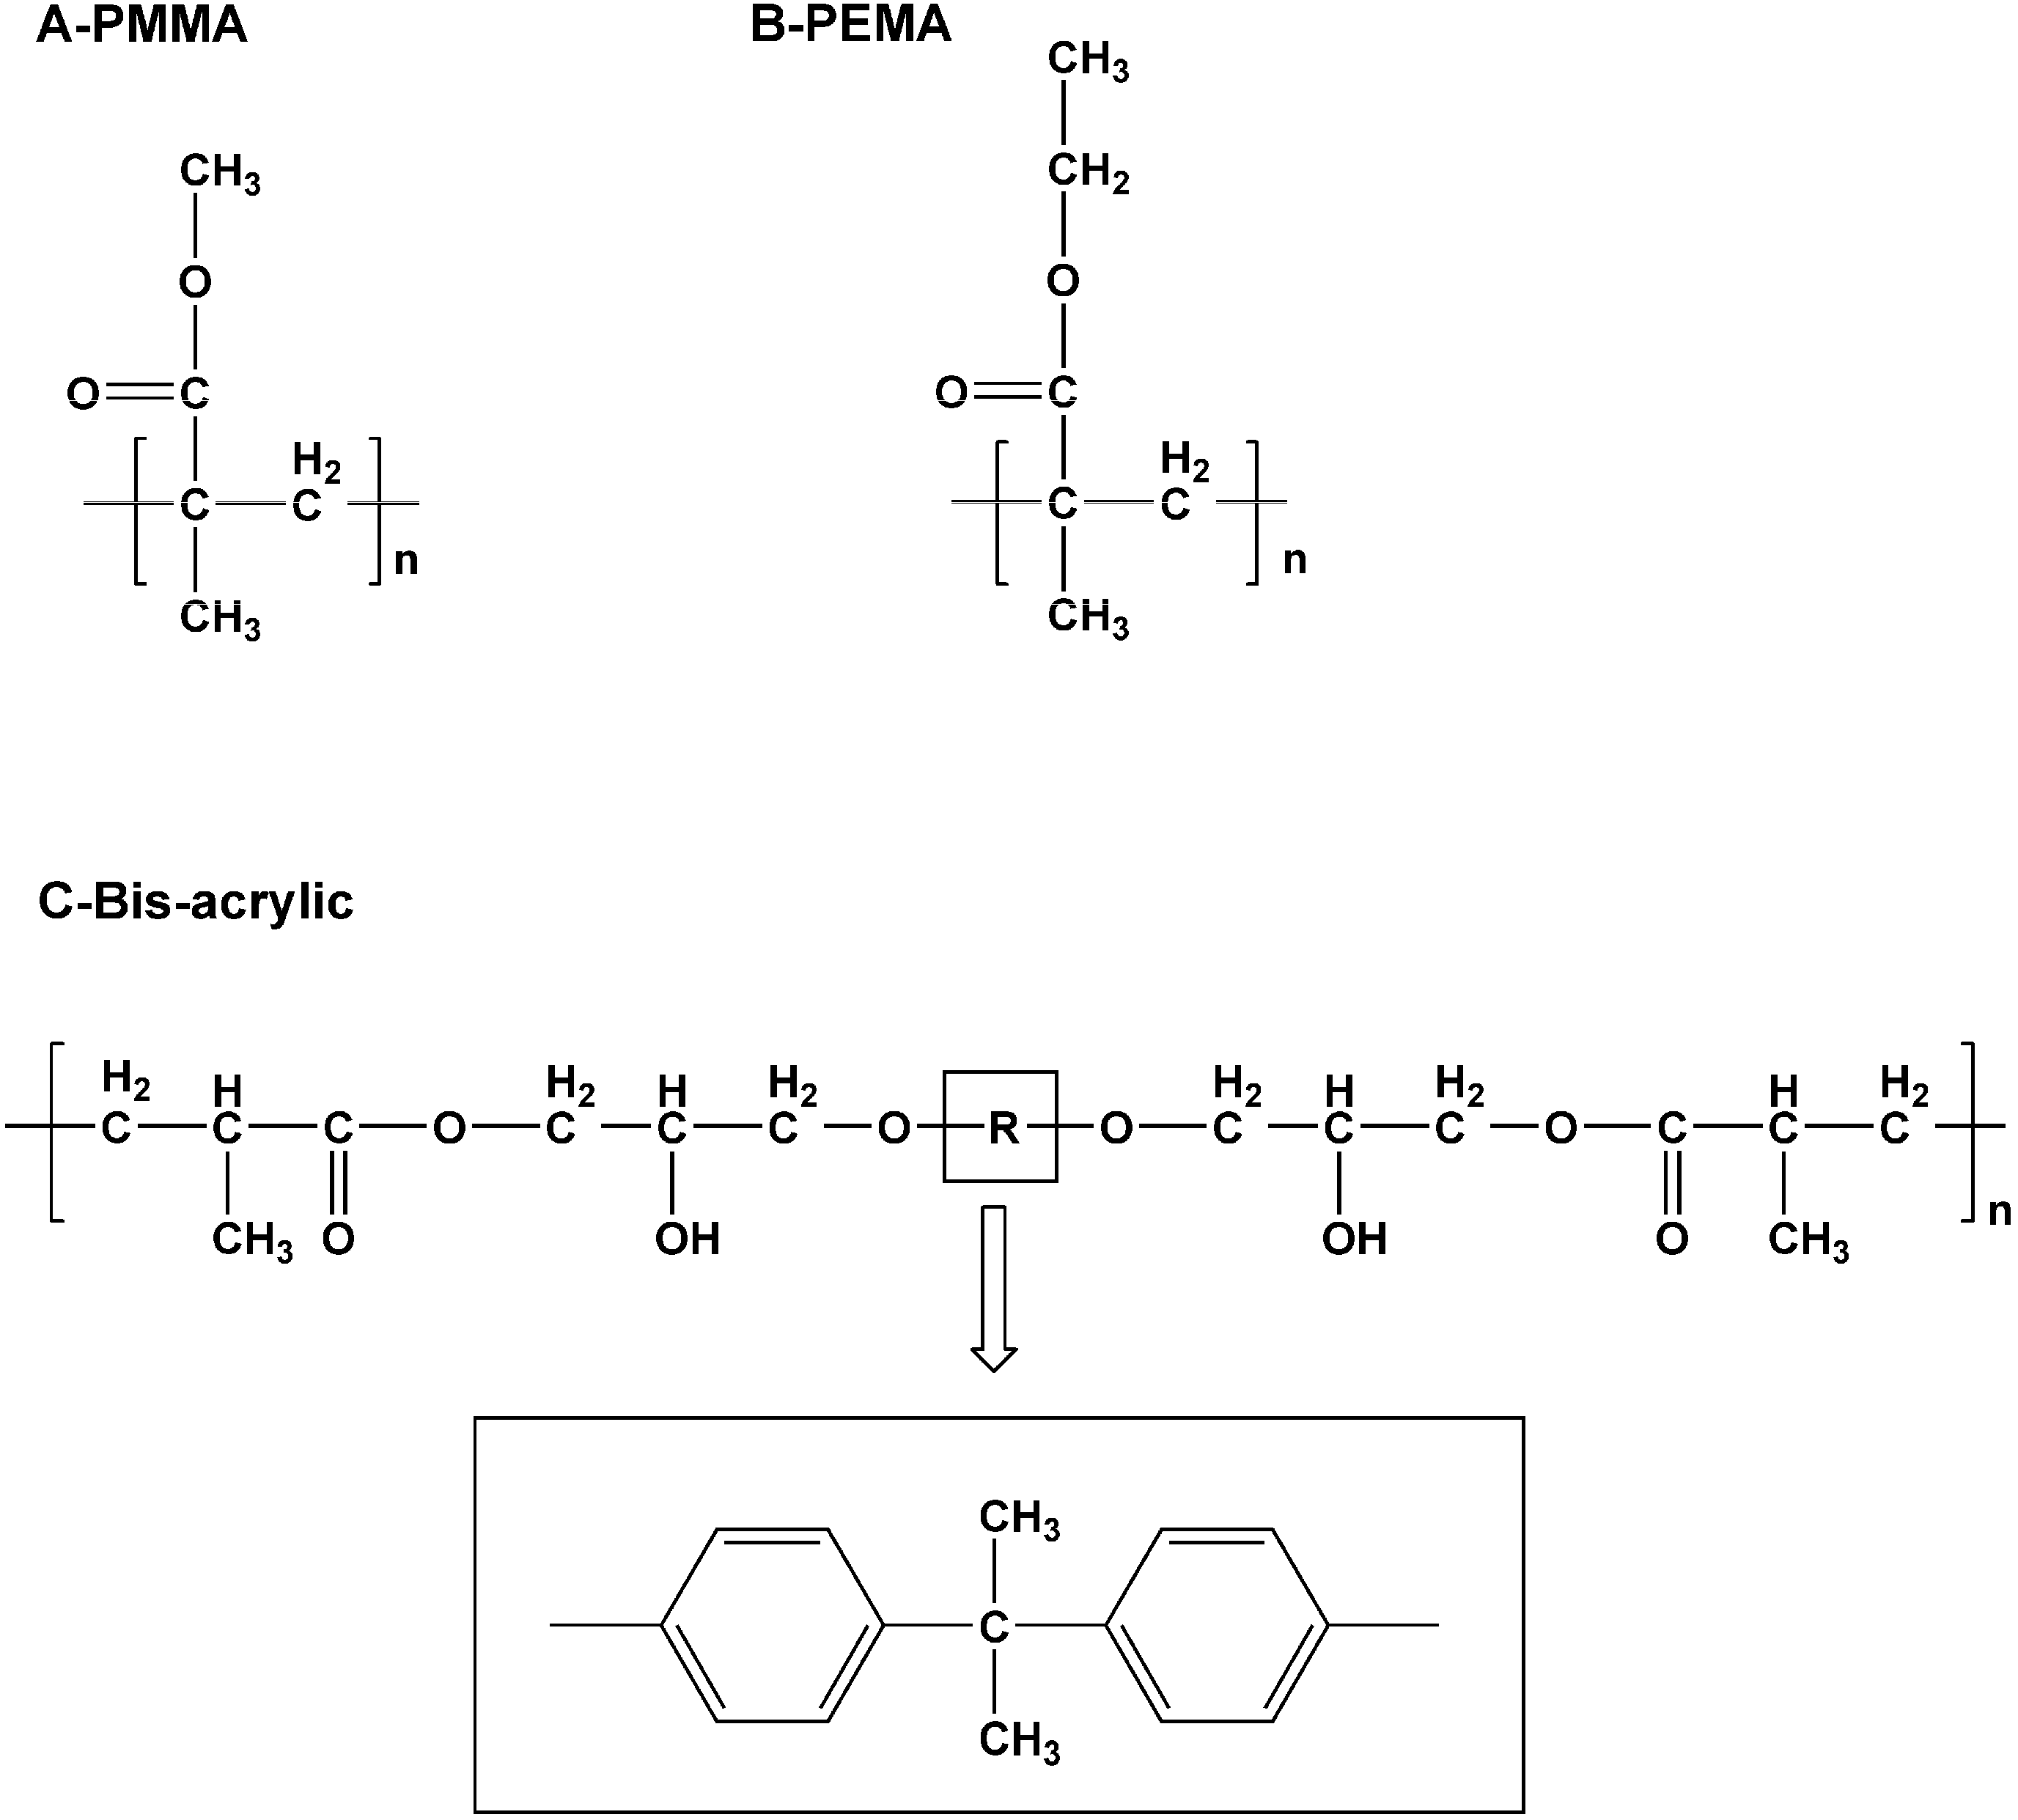
PEMA was introduced in the 1960s. An ethyl-group instead of a methyl-group was presented as the repeating unit in its molecular formula (
Figure 1A,B). Although not as strong, durable, and abrasion-resistant as PMMA, it is a better selection for direct interim prosthesis fabrication [
3]. It has a less pungent odor, less heat generation and less shrinkage on setting than PMMA. It is also more biocompatible and has low polymerization shrinkage [
4]. Some dentists prefer it when fabricating direct provisional restoration chair side.
Bis-acrylic or bis-acrylate composite is different from methacrylate resins. It is similar to composite restorative materials because it is made of bis-acryl resin and inorganic fillers. The latter reduce polymerization shrinkage [
5]. Bis-acrylic has a high strength because its monomers have a high molecular weight (
Figure 1C). Compared with methacrylate resins, bis-acrylic composite has superior flexural strength and surface hardness, higher wear resistance, better marginal adaptation and lower shrinkage. However, the rigid core of the aromatic group (R in
Figure 1C) makes the backbone stiff. It also prevents rotation, hindering complete polymerization [
3]. Moreover, provisional bis-acrylic resin restorations for long span bridges and teeth with minimal preparation are too susceptible to fracture [
6,
7].
An ideal provisional restoration should be strong, durable, and adapt accurately to the margin. Therefore, the material used should resist fracture, offer a smooth, good-looking surface profile, be color-stable to resist staining from food and beverages and have an accurate marginal adaptation to protect the tooth. These properties are influenced by the curing temperature of the materials [
8]. In addition, while the properties of provisional restoration depend on the type of material used, they appear to be not material specific but product specific [
9]. The addition of fine particle sizes can also enhance polish ability and smoothness of the cured provisional restorative material. In clinical situations, some dentists prefer soaking the restoration into warm water to hasten curing.
This study aimed to evaluate the effect of heat treatment on the flexural strength, surface profile, color stability and marginal discrepancy of four commonly used provisional restorative materials. This study was designed to evaluate physical properties of four common commercially available provisional materials cured at 23 °C, 37 °C and 60 °C, temperatures found in the clinic, the mouth or a warm water bath. The results might help clinicians choose appropriate materials for fabricating provisional restorations for their patients.
Figure 1.
Repeating units of Polymethyl methacrylate (PMMA) (A); polyethyl methacrylate (PEMA) (B); and Bis-acrylic (C).
Figure 1.
Repeating units of Polymethyl methacrylate (PMMA) (A); polyethyl methacrylate (PEMA) (B); and Bis-acrylic (C).
3. Experimental Section
This study investigated two commercially available methacrylate resin (PMMA and PEMA) and two bis-acrylic composite materials (
Table 6).
Table 6.
Provisional restorative materials used in this study.
Table 6.
Provisional restorative materials used in this study.
| Product | Manufacturer | Ingredient | Shade |
|---|
| DuraLay | Reliance Dental Mfg. Co., Chicago, IL, USA | PMMA | 62 |
| Trim II | Bosworth Co., Chicago, IL, USA | PEMA | 62 |
| Luxatemp Star | DMG, Hamburg, Germany | Bis-acrylic composites | A3 |
| Protemp 4 | 3M ESPE, Seefeld, Germany | Bis-acrylic composites | A3 |
Specimens were chemically cured in a water bath according to their manufacturers’ instructions at 23, 37, or 60 °C. The temperatures correspond to that of ex vivo, in vivo, and warm water bath in clinical scenarios. We considered a gap of 0.3 mm as the clinically significant marginal discrepancy; and estimated the mean and the standard deviation of the width of the gaps of the tested samples at 0.2 mm and 0.1 mm, respectively. The sample size required was 10 (α = 0.05, power = 0.80).
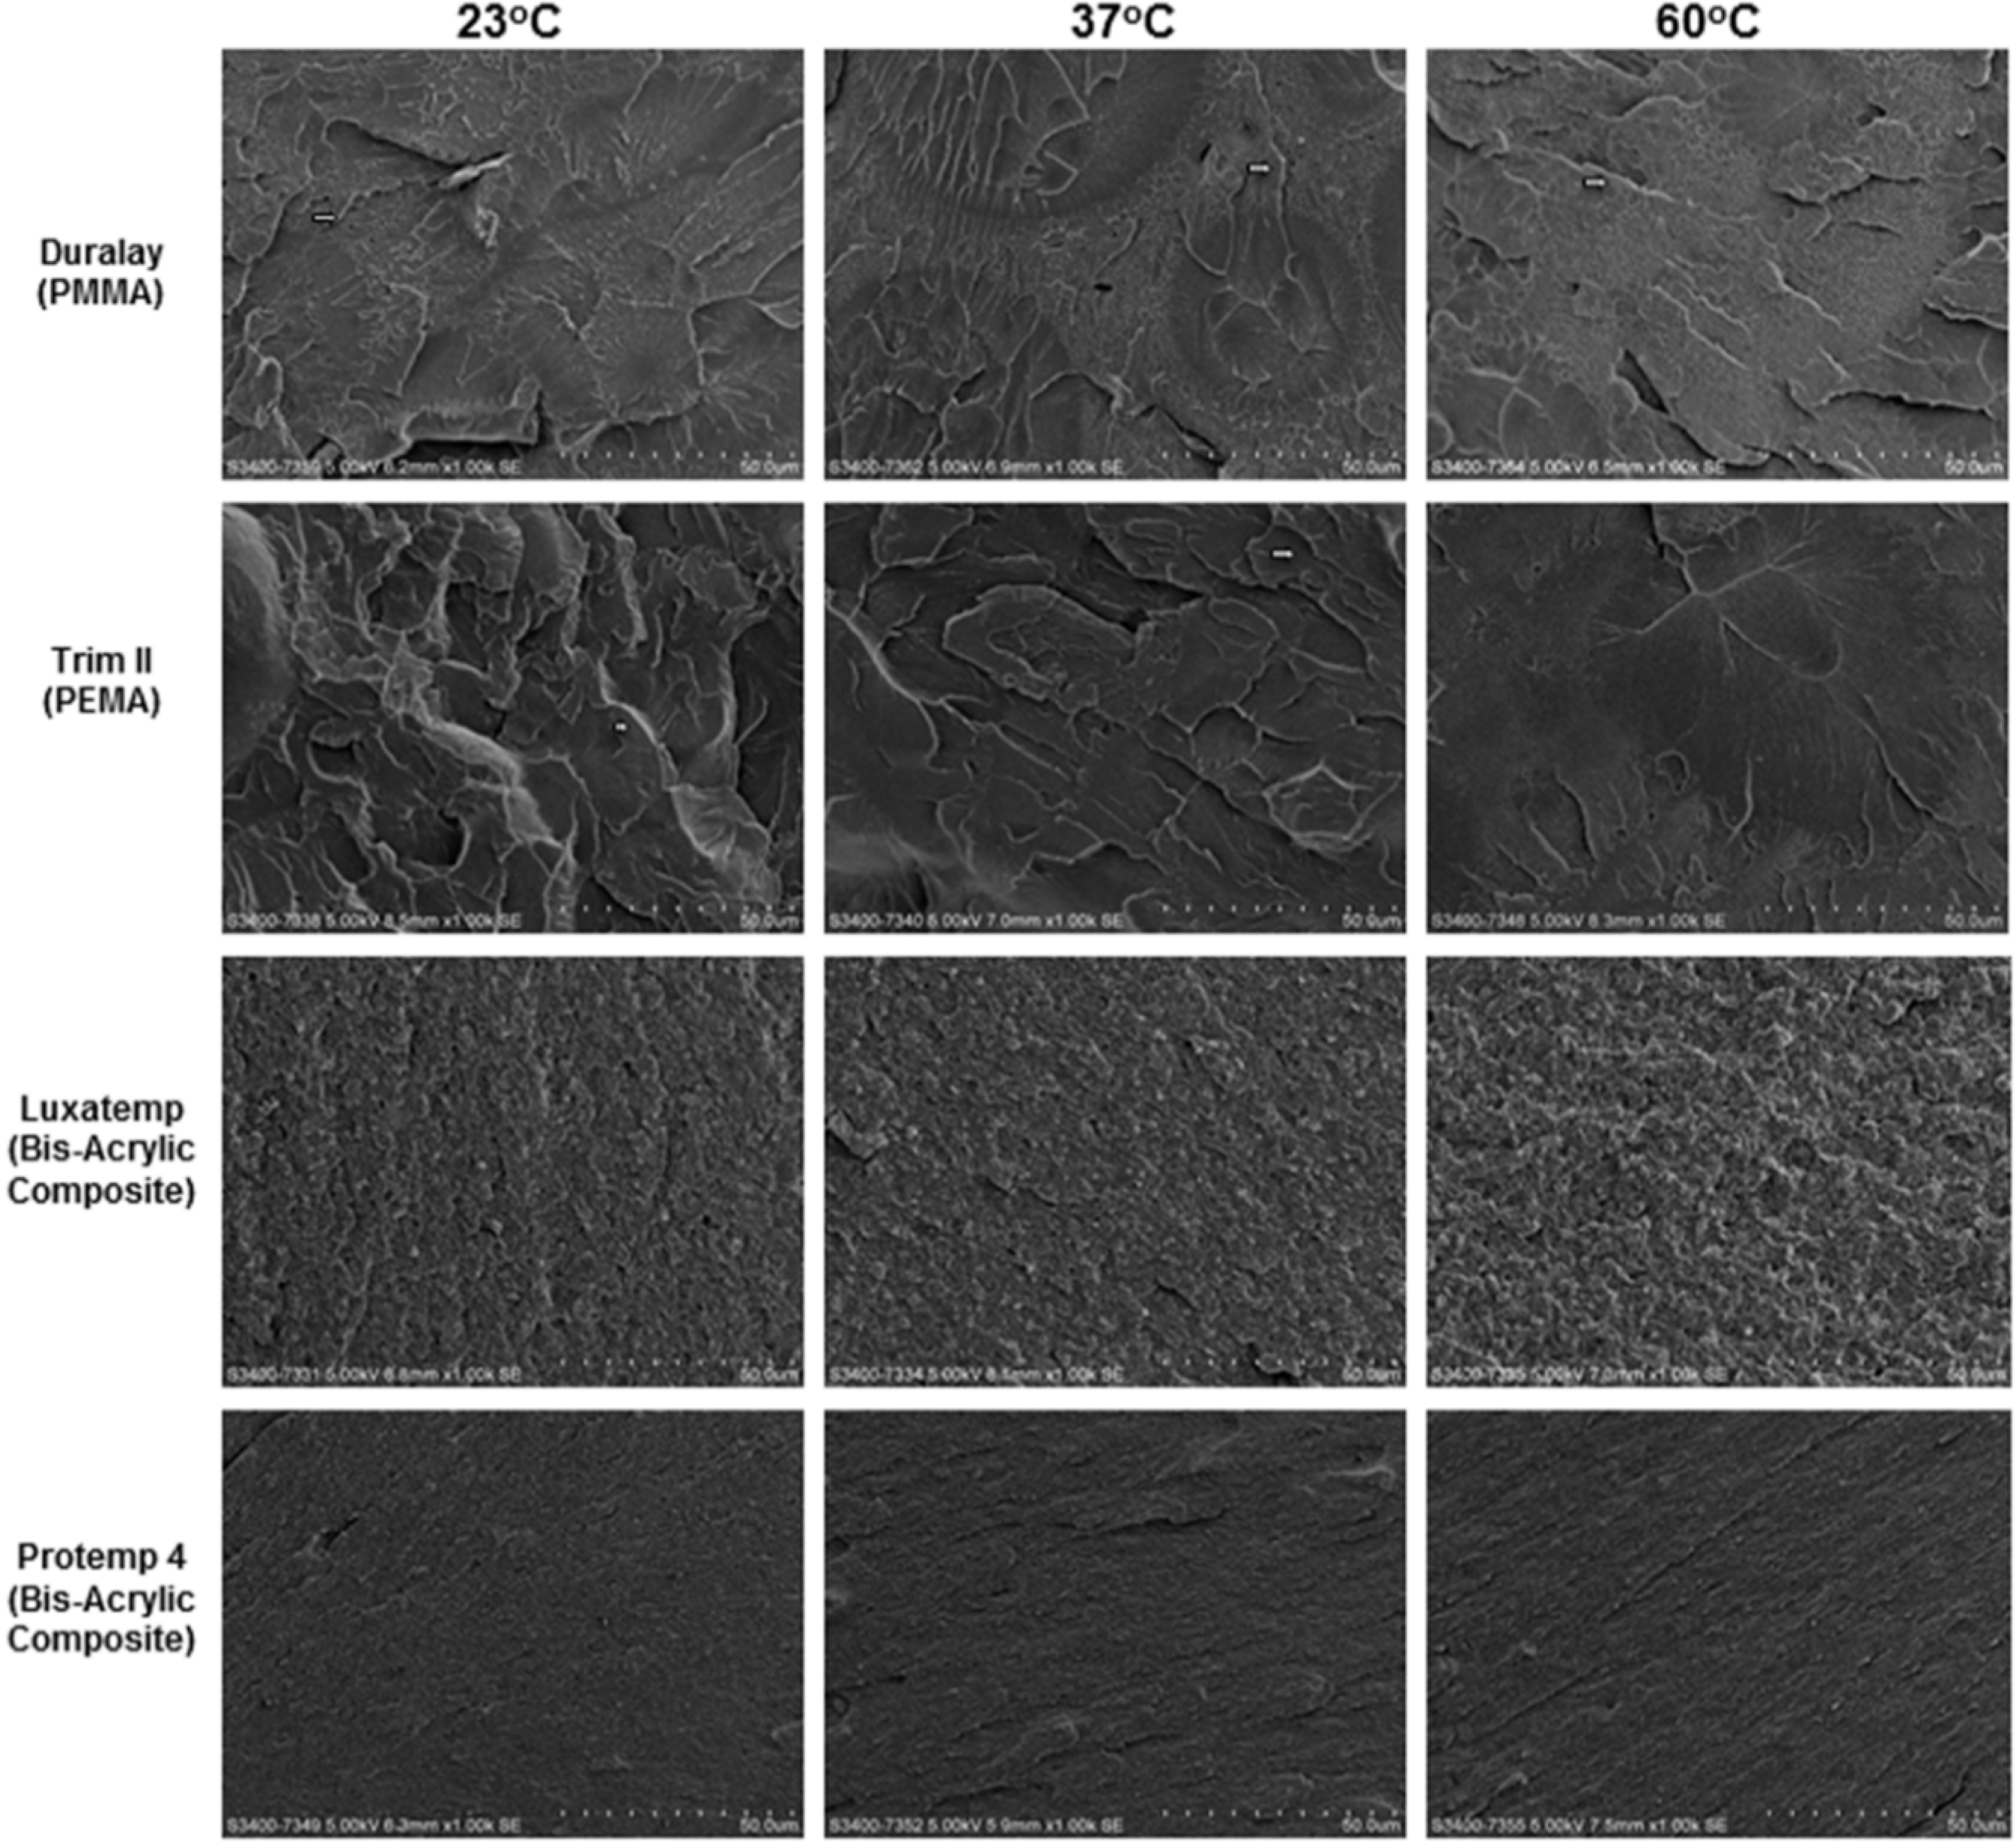
3.1. Flexural Strength and Fracture Surface Morphology
Ten rectangular specimen beams in each group with the dimensions of 25 × 2 × 2 mm
3 were fabricated with a custom-made stainless steel mold. The specimens were then thermocycled in distilled water at temperatures of 5 °C and 55 °C for 3000 cycles, with a dwell time of 20 s in each water bath to simulate
in vitro thermal changes that occur in the oral cavity [
24]. After the thermocycling, a three-point bending test with a universal testing machine (ElectroPulsTM E3000, Instron, Norwood, MA, USA) determined the flexural strength of each specimen. A load weighed on the specimen surface at a crosshead speed of 1 mm/min until failure. The following equation calculated flexural strength (
F):
P was the load at fracture; L the test span; b the thickness of the sample; h the height of the sample. Fractographic examination was performed to assess the cause of failure by studying the characteristics of the fracture surface. Scanning electron microscopy (SEM) (Hitachi S-3400 FEG Scanning Electron Microscope, Hitachi Ltd., Tokyo, Japan) at 5 kV in high-vacuum mode revealed the fracture surface morphologies of the specimens.
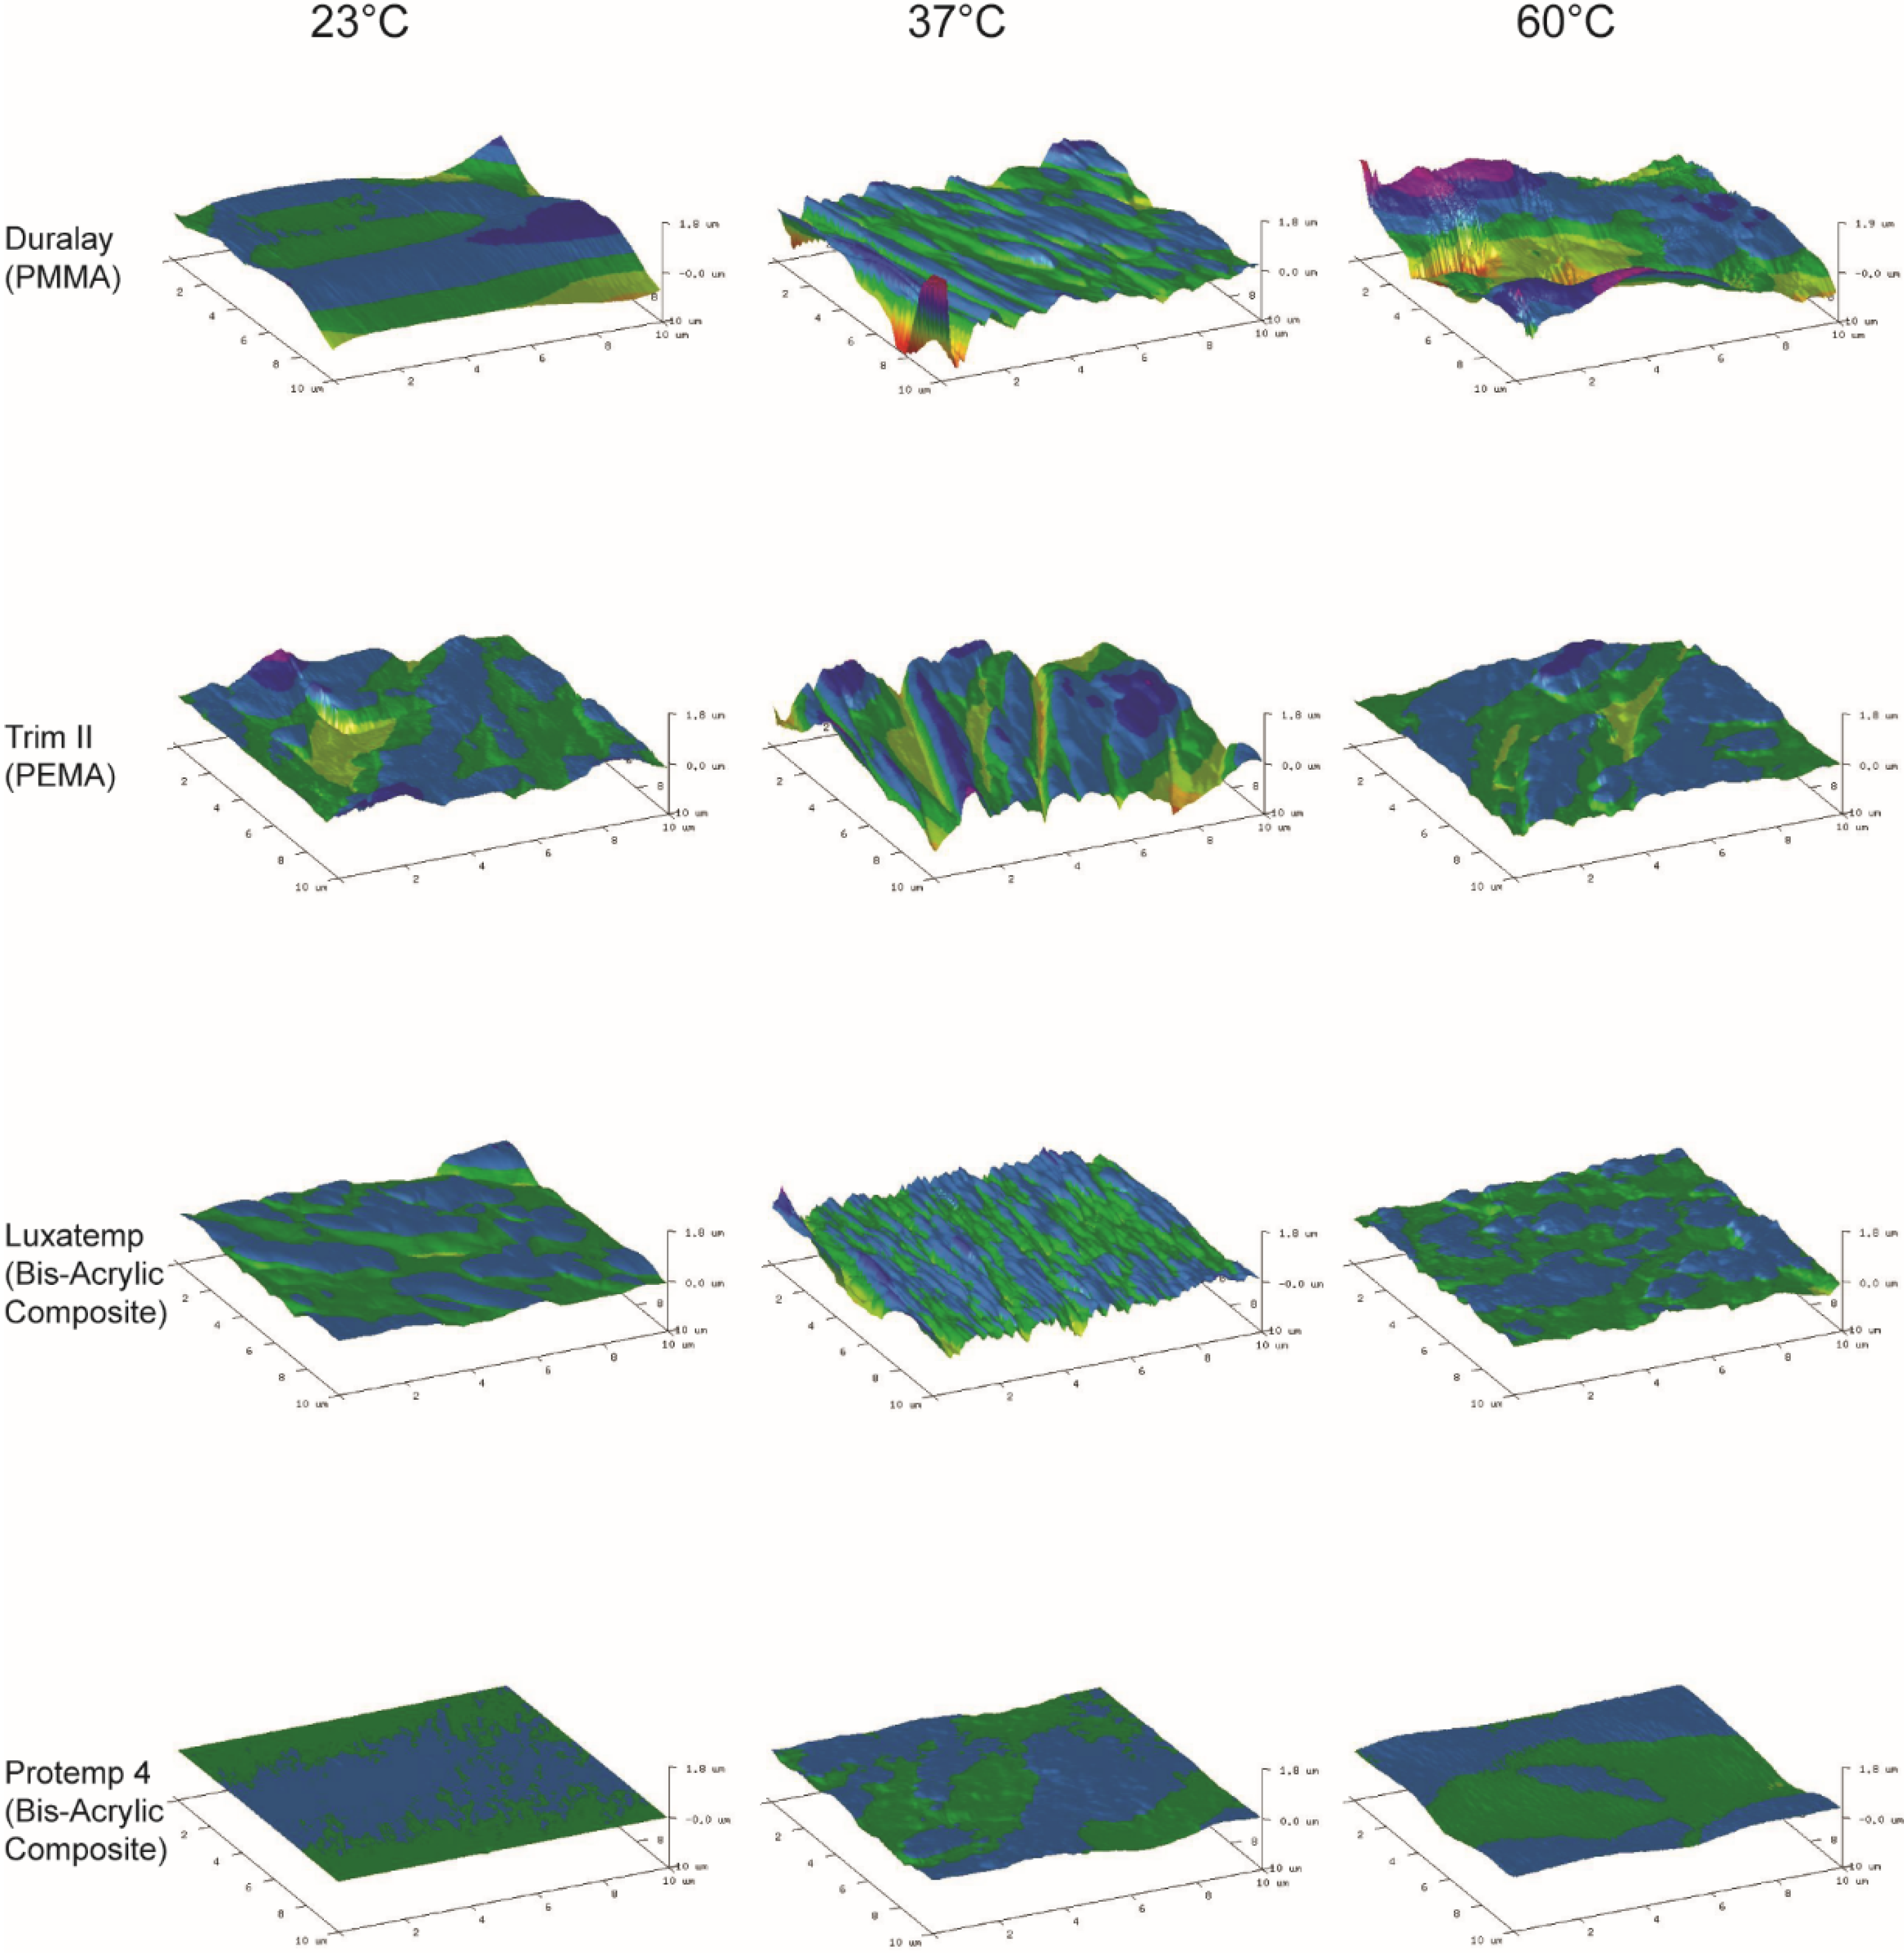
3.2. Surface Profile and Roughness
Atomic force microscopy (AFM) (Dimension Edge, Bruker, CA, USA) was used to evaluate the surface topography and surface roughness of experimental materials. Three rectangular specimens were from each group were prepared to 5 × 5 × 2 mm
3 using a custom-made Teflon mould followed by polishing to 4000-grit using a polisher (Ecomet 6 variable speed polisher, Buehler, IL, USA) before testing. AFM analysis was conducted using a tapping model etched silicon probe. Images were analyzed using NanoScope Analysis 1.40 (Bruker, CA, USA) and 3D images were normalized in scale Z [
25]. Surface roughness was defined as the arithmetical average of the surface height relative to the mean height (Ra). A high value of Ra represents a rough surface [
26]. Ten areas of 2 × 2 µm
2 were randomly chosen from upper, middle, lower, left and right areas in each specimen for evaluation and a mean value of Ra was calculated for each specimen.
3.3. Color Stability
The specimens used in the Ra test then went through a color stability test, involving coffee. The test dissolved 20 g of coffee powder (Café extra forte, Melitta, Brazil) into 1000 mL of boiled distilled water, stirring every 30 min for 10 s until it cooled to 37 °C, then filtered it through a filter paper (0.6 μm, Whatman
®, Buckinghamshire, UK). The specimens were immersed in the coffee solution and kept at 37 °C in an incubator. The coffee solution was replaced every 24 h. Color stability was evaluated by comparing the color of the specimens before and after the incubation in the coffee solution at 37 °C for 28 days. Each specimen was fixed on a stand with standard lighting units (Kaiser RB2 Lighting Unit, Kaiser Fototechnik, London, UK) for color assessment. A fixed lens (focal length: 50 mm, F-Stop: 5.6, ISO Speed Ratings: 400) took images of the specimens mounted on top of the stand. The images were imported into Photoshop CS (Adobe Systems, San Jose, CA, USA). Measurements were taken at the top, middle and bottom area of each. White balance was calibrated according to a white calibration standard. Color changes were characterized using the Commission Internationale d’Eclairge
L*
a*
b* color space (CIELAB) [
15]. Parameter
L* represents the degree of grey and corresponds to lightness. Parameter
a* represents the red-green axis, whereas
b* is a parameter for the blue-yellow axis. Total color differences are expressed by the formula
where the initial (
i) and final (
f) are color descriptors for before and after coffee immersion.
3.4. Evaluation of Marginal Discrepancy
The method for evaluation of marginal discrepancy was adopted from a previous study by Balkenhol
et al. [
14,
25]. The laboratory procedures of fabricating the specimen crown for evaluation simulated chair side fabrication of provisional restoration. The first stage in fabricating the provisional crowns involved taking a vinyl polysiloxane impression (Imprint 3, 3M ESPE, St Paul, MN, USA) of the “normal teeth” dies, which were fabricated as premolar size with a diameter of 8 mm and a 3° taper to the vertical axis. Then they were replaced with the “prepared teeth” dies of 5 mm in diameter. There was 1.5 mm width shoulder representing shoulder preparation. The height was 8.5 mm, equivalent to uniform reduction of tooth structure circumferentially and occlusally by 1.5 mm [
27]. The “prepared teeth” dental dies also tapered at an angle of 3°. The provisional restoration material was dispensed into the impression, which was then placed back to the test model with “prepared teeth” dies, under a load of 500 g. The impression was removed from the model after initial setting. The crown was soaked into a water bath for 1 min at 23, 37, or 60 °C. Ten crowns were prepared for each provisional restoration material and temperature. The polymerized crowns were replaced on “prepared teeth” dies by exerting a force of about 100 g using a dead weight of 100 g. The test model was tilted through 90° so that the margin of provisional crowns could be determined on two opposite sides of the dies. The measurement points were selected every 60° of circumference around the crown’s marginal line, using a traveling microscope (Leitz WetzLar, Wetzlar, Germany) at 30× magnification.
3.5. Statistical Analysis
The Shapiro-Wilk test was used to test the normality of the data. Two-way analysis of variance (ANOVA) with main effect compared the effects of different materials and curing temperatures (as two predicting variables) on flexural strength, surface roughness, color change and marginal discrepancy of the specimens. Bonferroni adjustment for multiple testing reduced the chance of type I error. The computer software SPSS Statistics—Version 20.0 (IBM Corporation, Armonk, NY, USA) performed analysis. The level of statistical significance for all tests was 0.05.


