UV Spectrometric Indirect Analysis of Brominated MWCNTs with UV Active Thiols and an Alkene—Reaction Kinetics, Quantification and Differentiation of Adsorbed Bromine and Oxygen

Abstract
:
1. Introduction

2. Results and Discussion
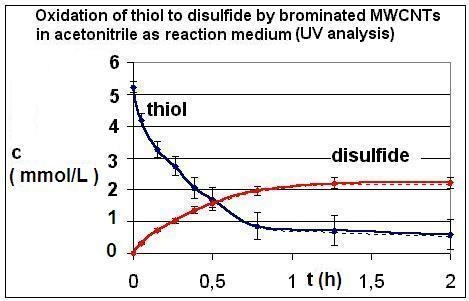
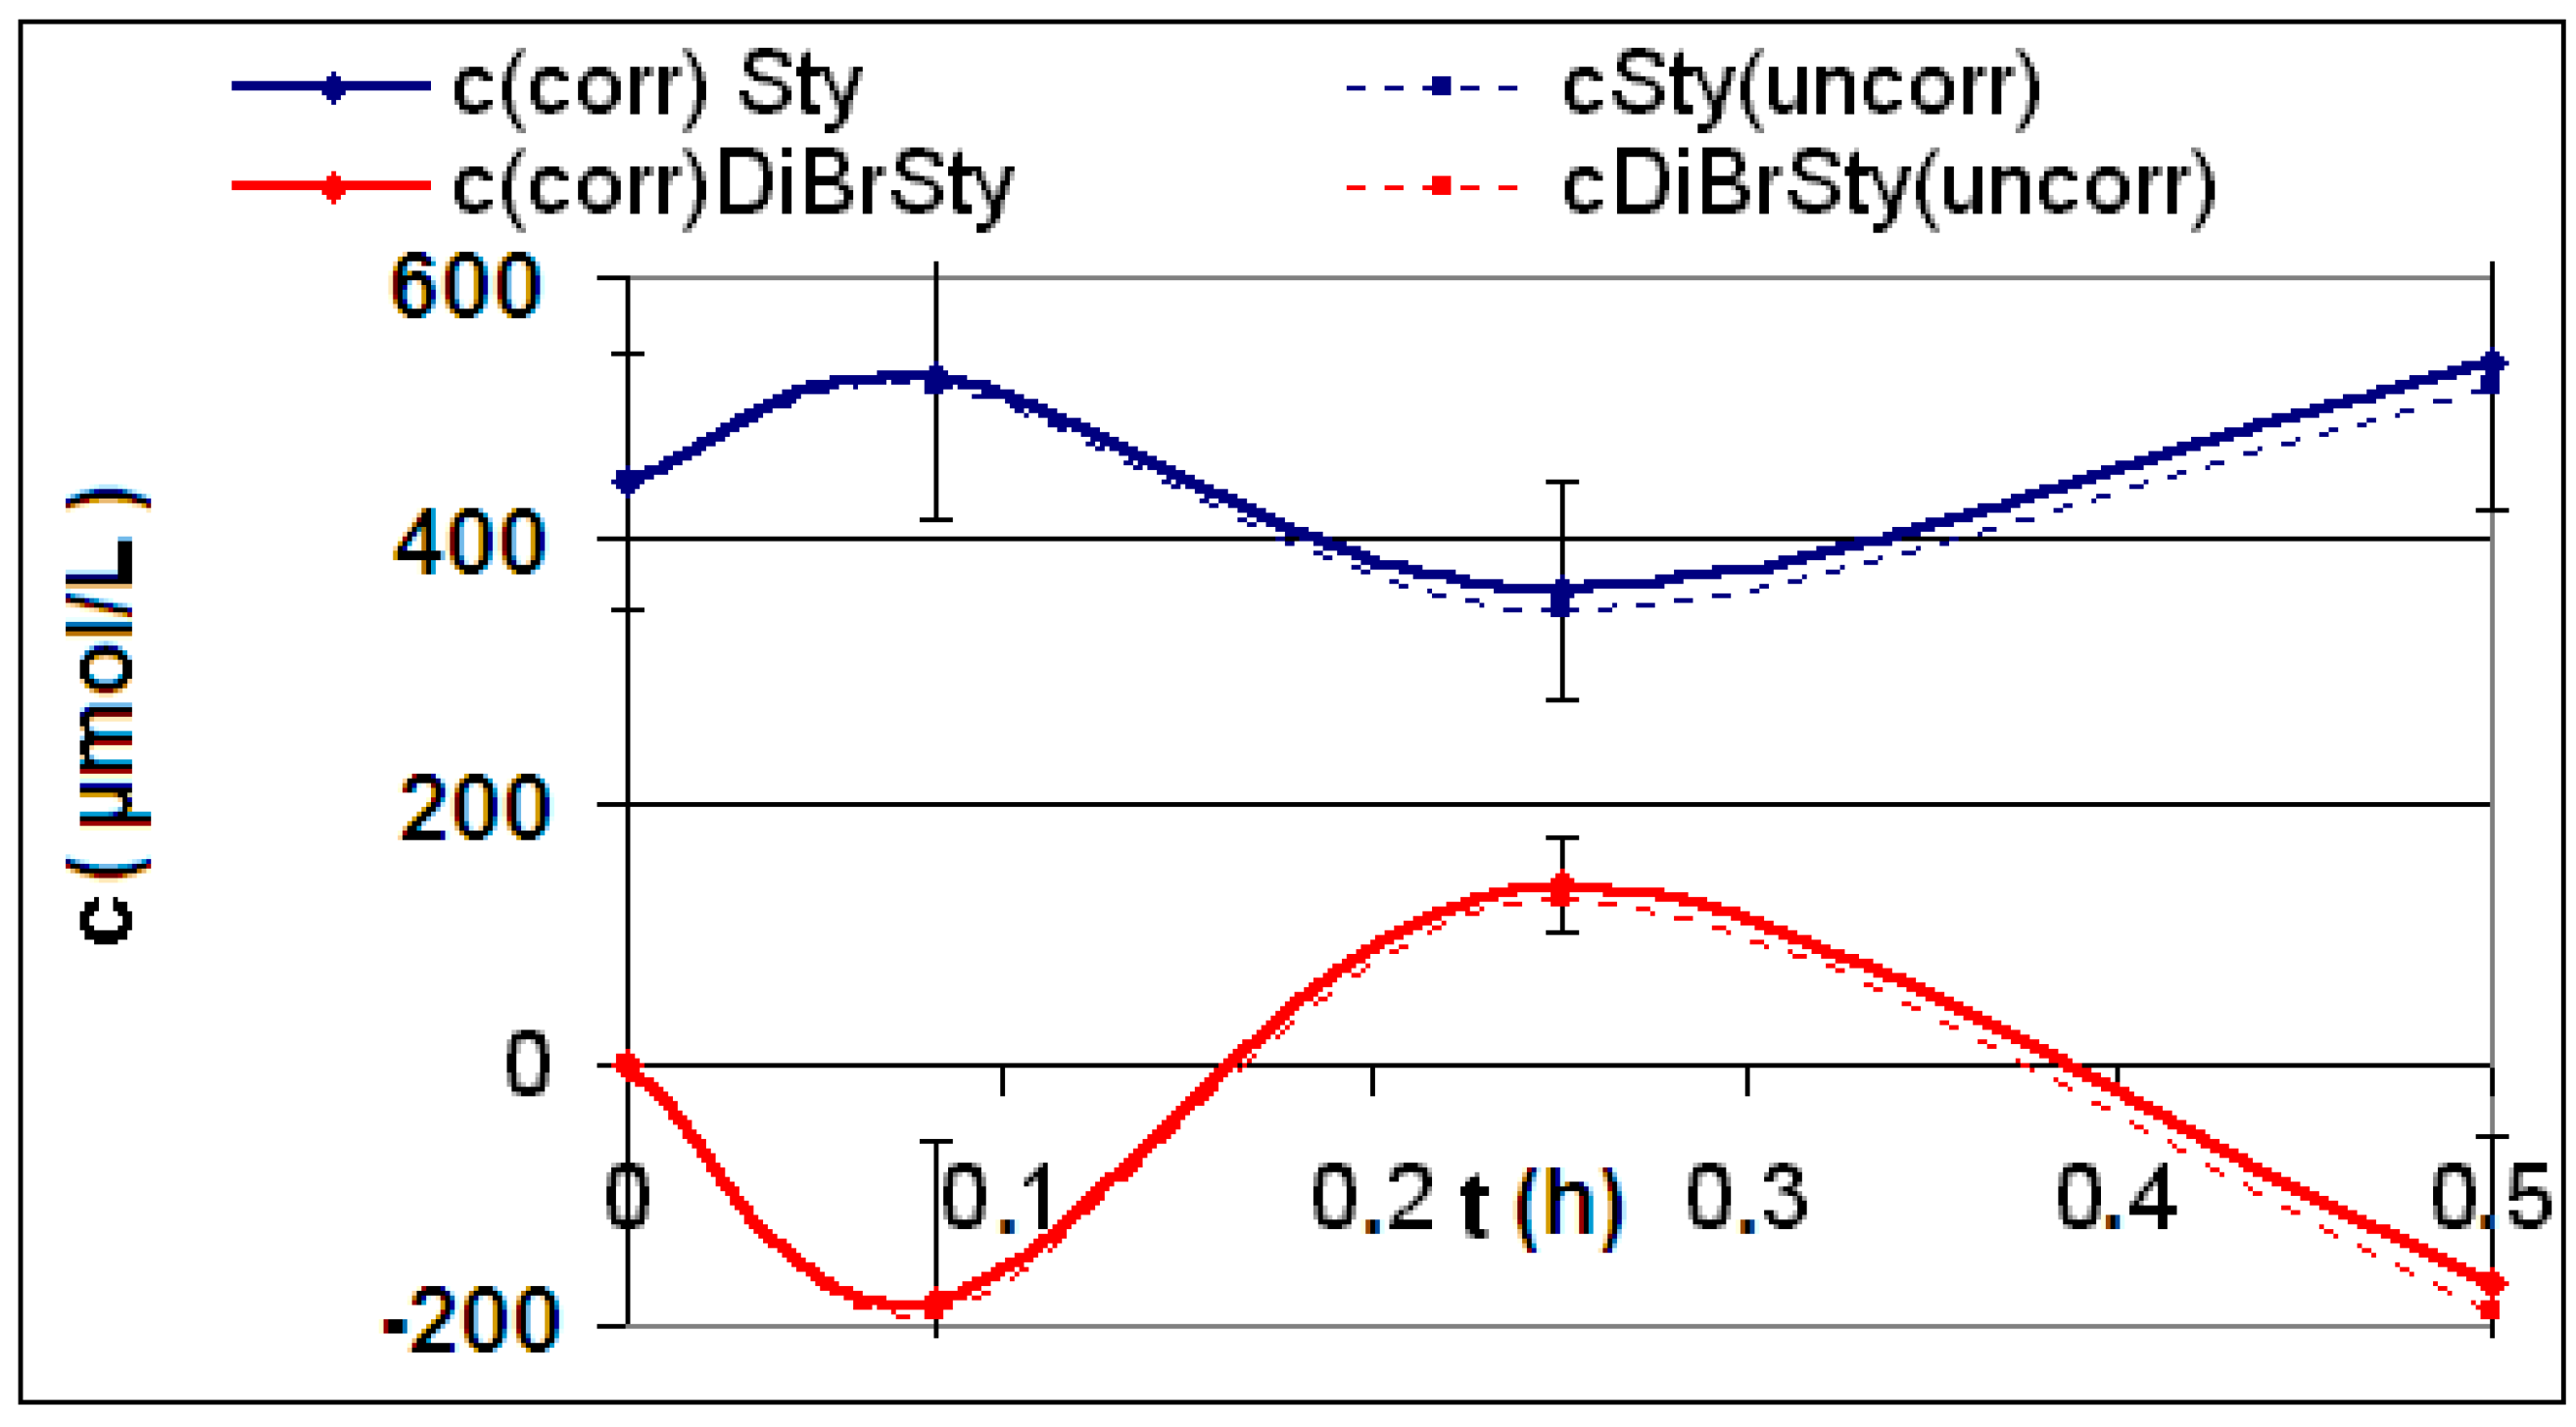
2.1. Results of the Analyses of Brominated MWCNTs

| R No. | Reagent | CNT sample with weight mC and Vj and f | β (μmol/g) | k (L∙mol−1∙h−1), single param. + temperature | τ (h), above: from k below: from a, b, c | Iteration parameters a, b, c multiparameter fitting | |
|---|---|---|---|---|---|---|---|
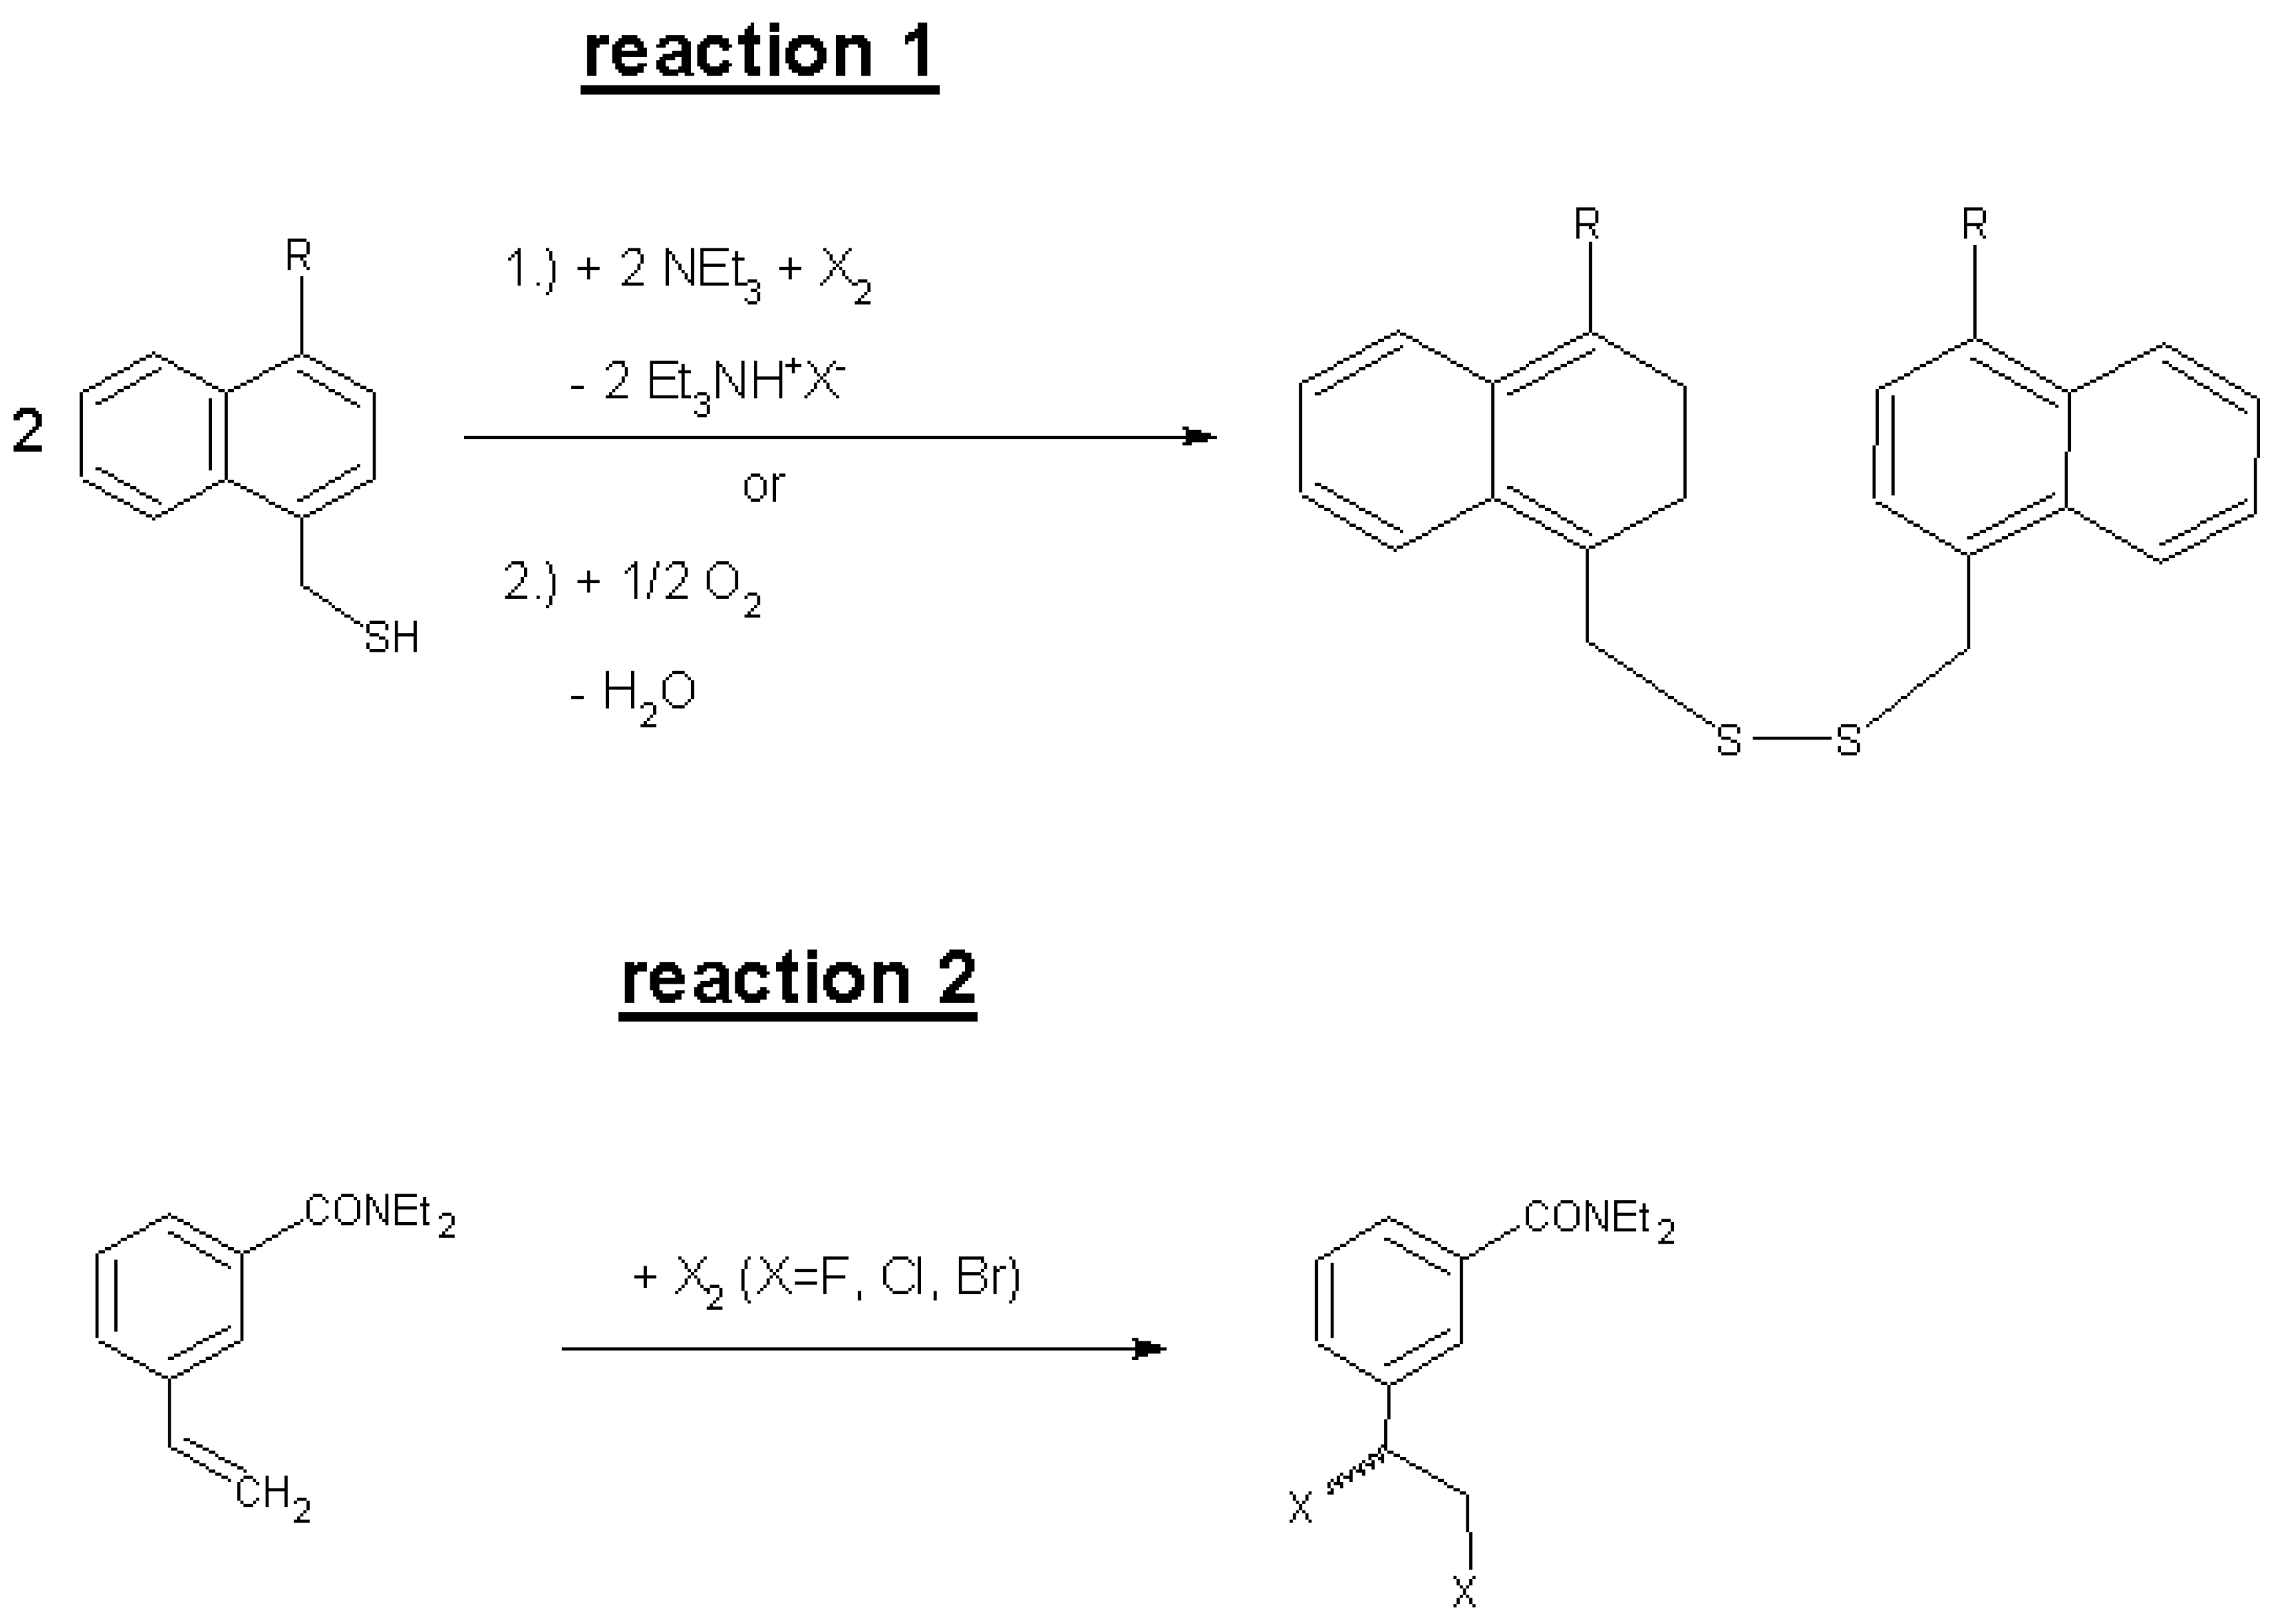
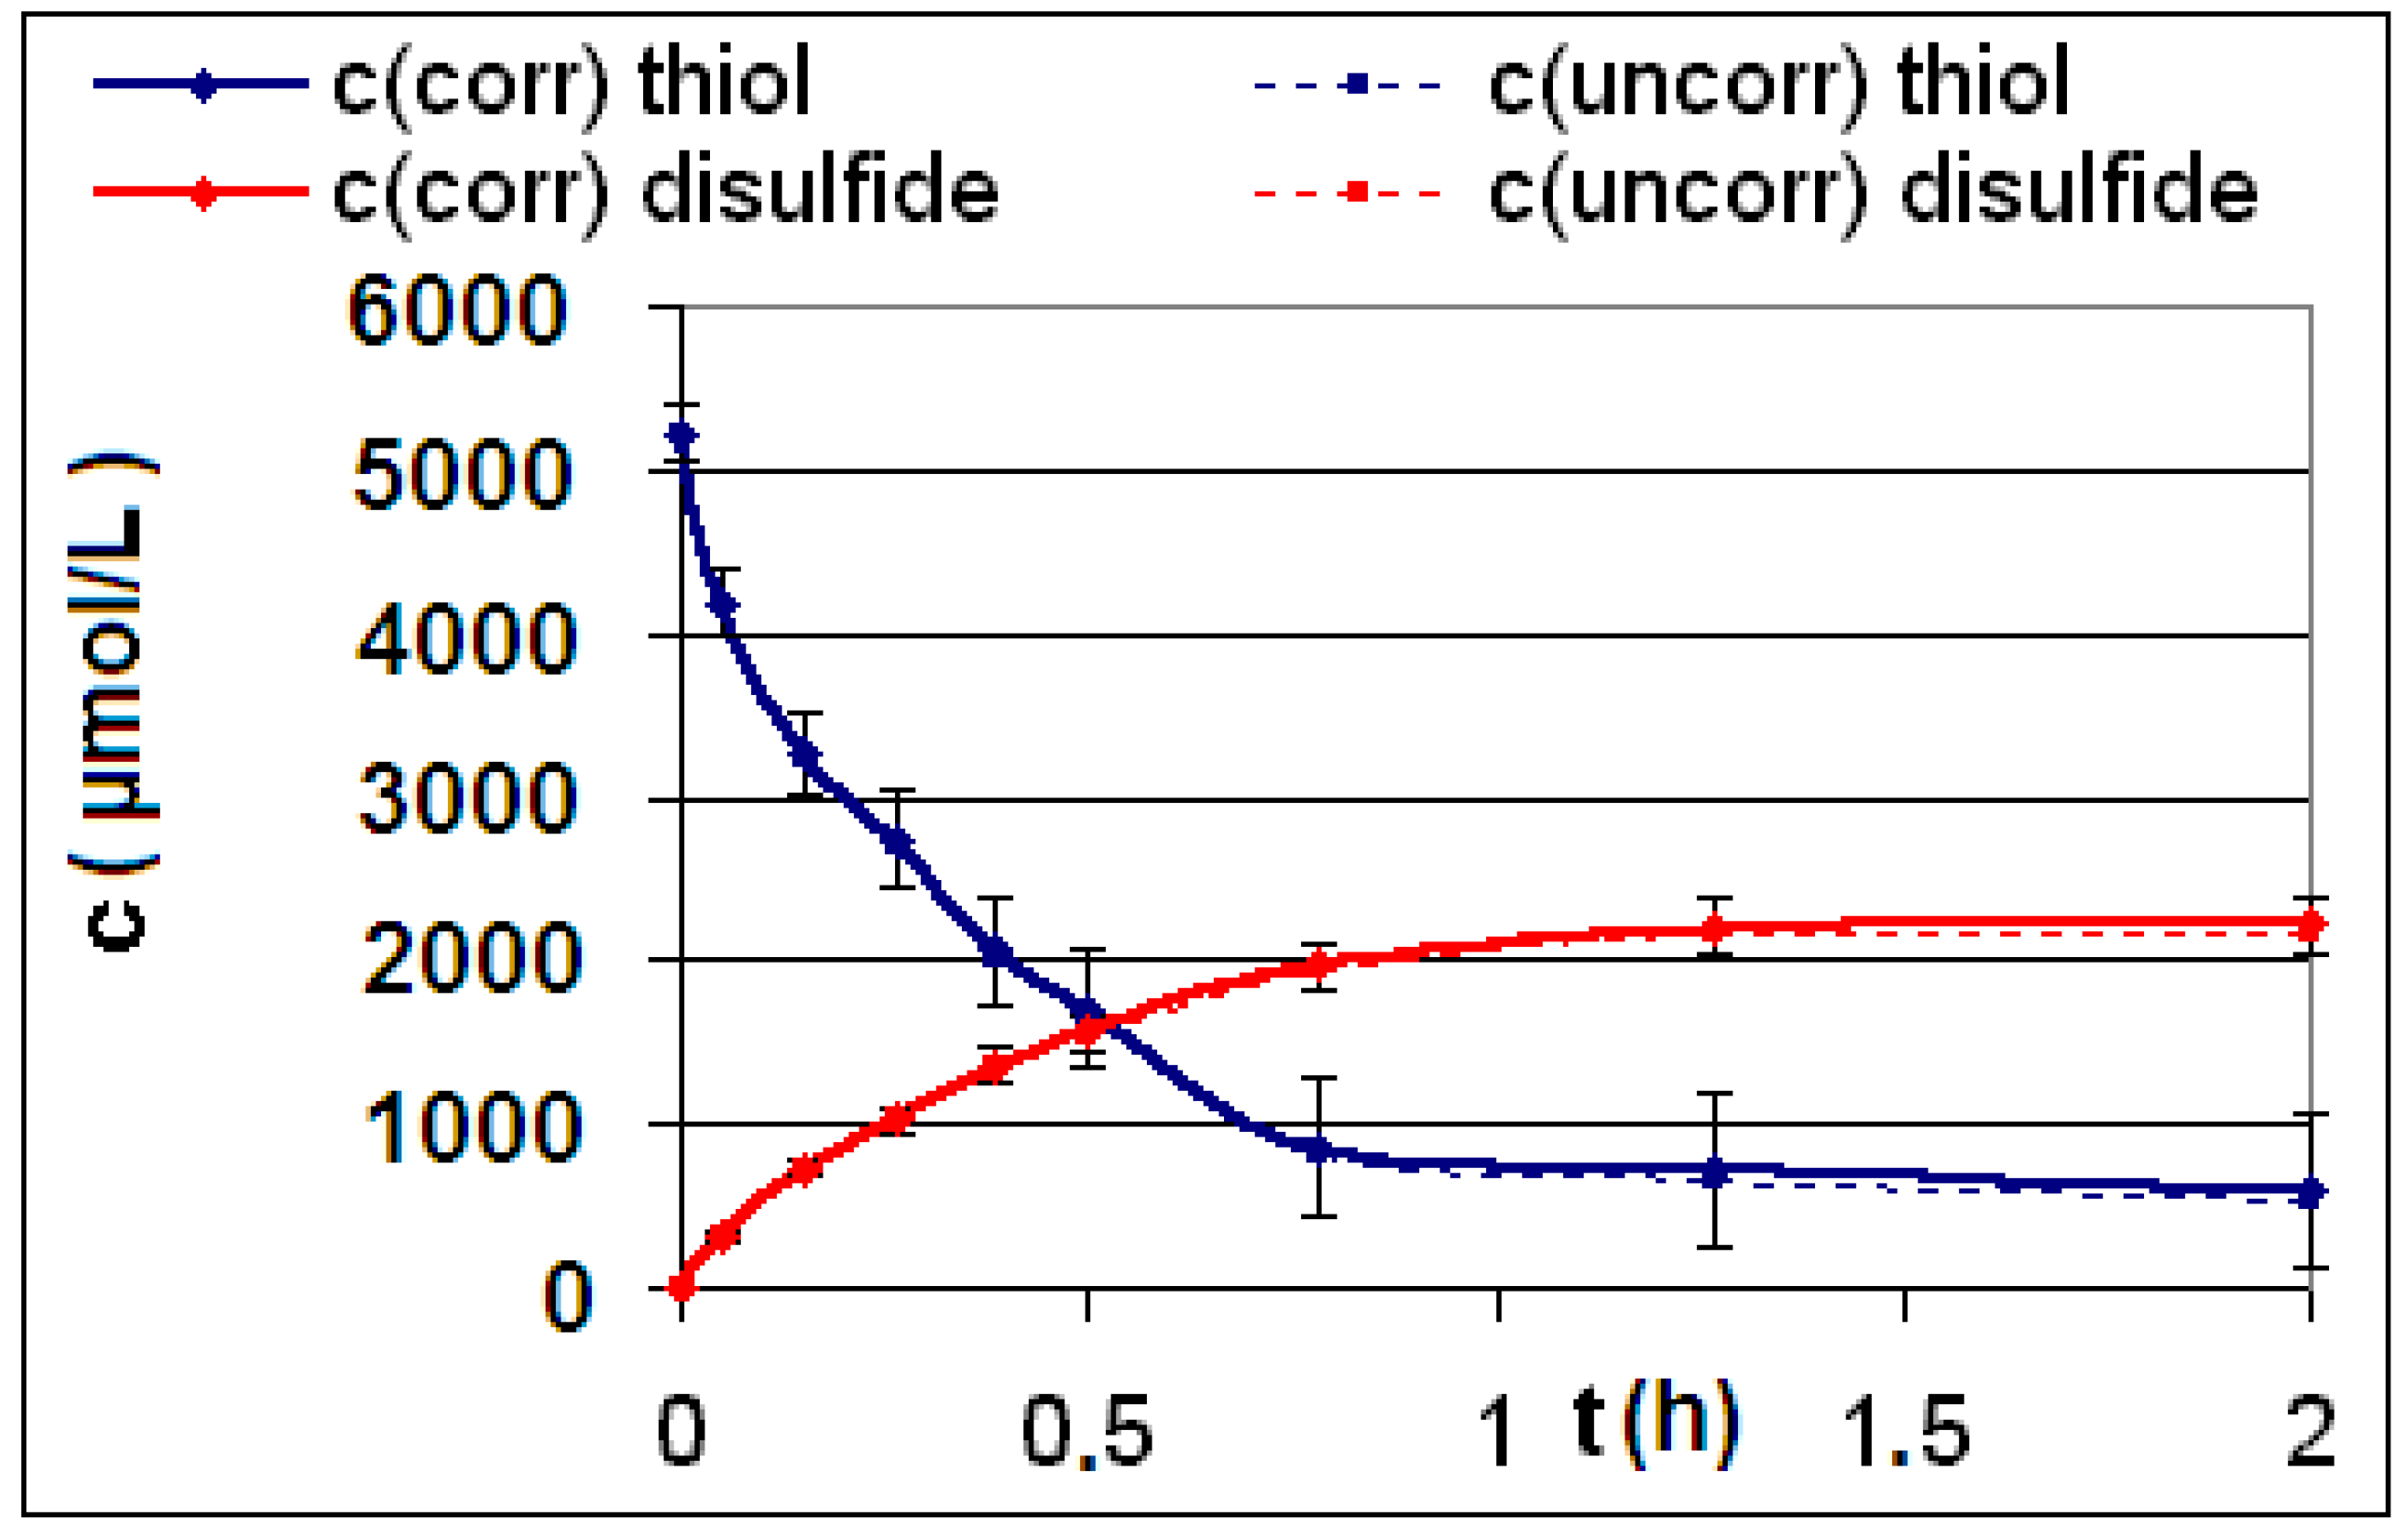
| R4 | 4-(2,2,2-Trifluoro-ethoxy-methyl)-1-naph-tha-linemethanthiol (11) + 1.00 mL tri-ethylamine | 0.0127 g CNT1 f = 40, Vj = 0.000250 L | 5601 ± 87 P = (RFS)2 ≅ 1* Br2 | 275 ± 16 P T = 297 K 138 ± 12 A T = 297 K | 1.328 ± 0.077 P | a (L∙mol−1∙h−3) | −8.834 A |
| 1.709 A | b (L∙mol−1∙h−2) | 117.7 A | |||||
| c (L∙mol−1∙h−1) | −72.48 A | ||||||
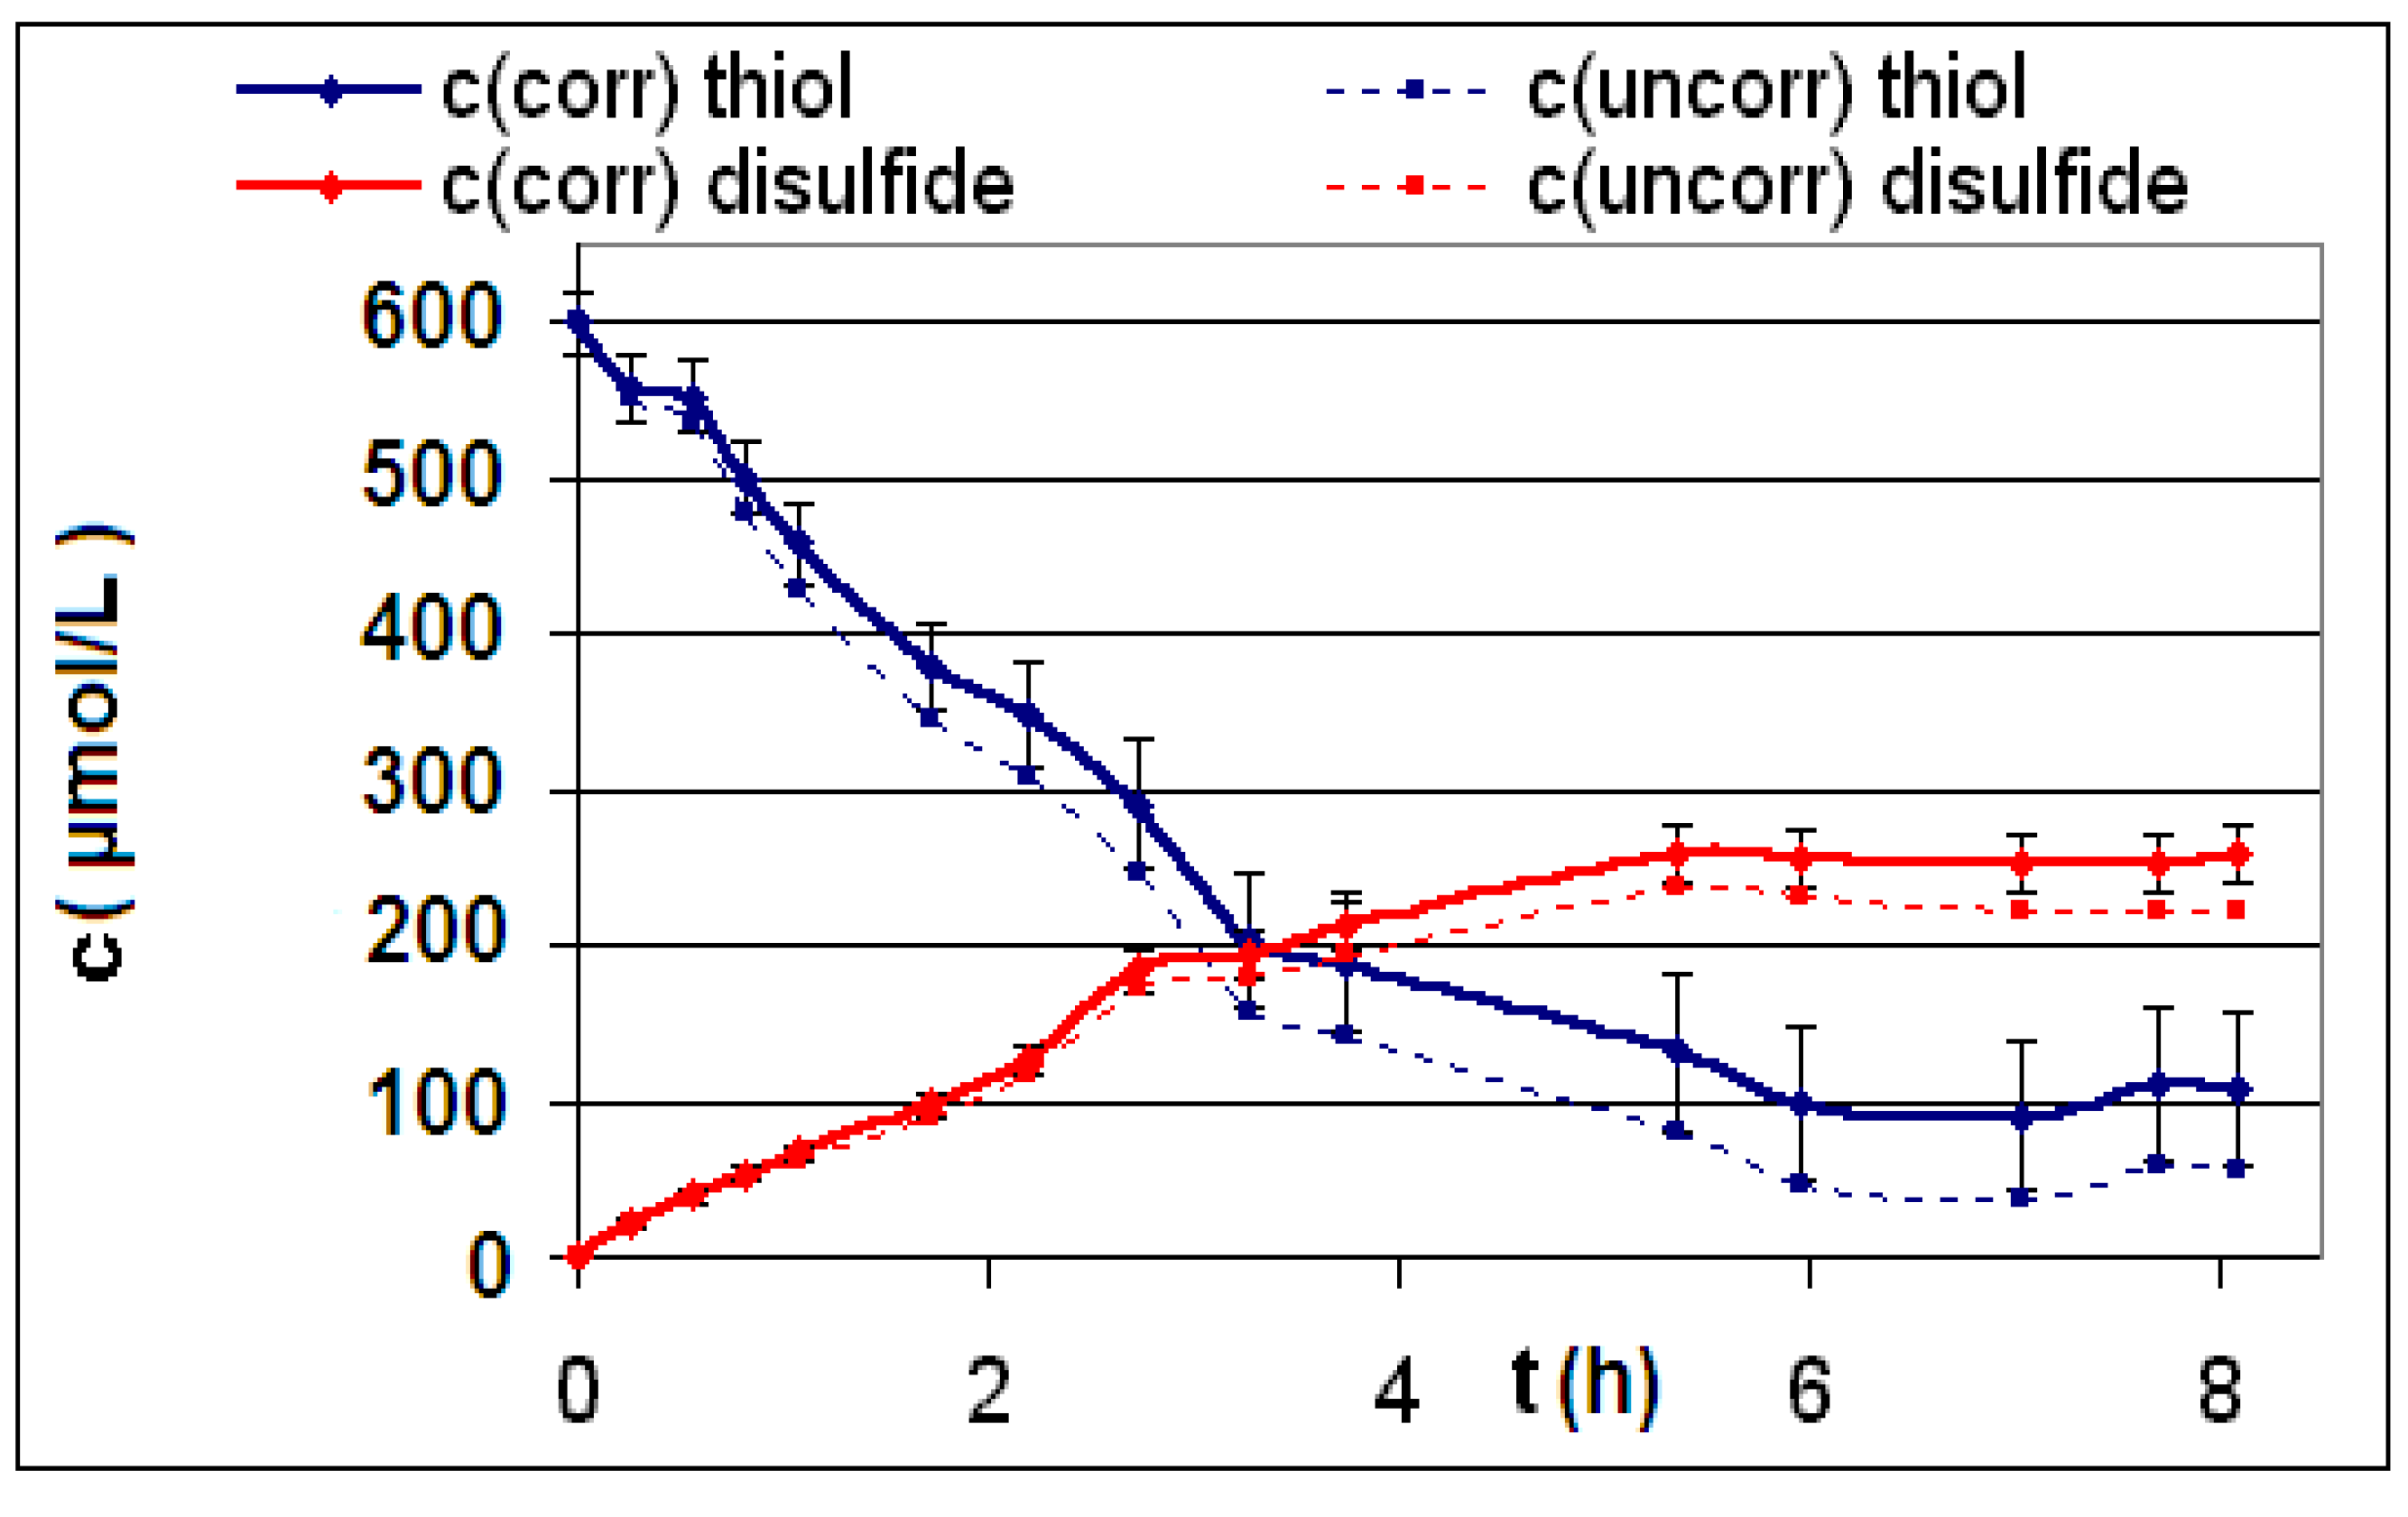
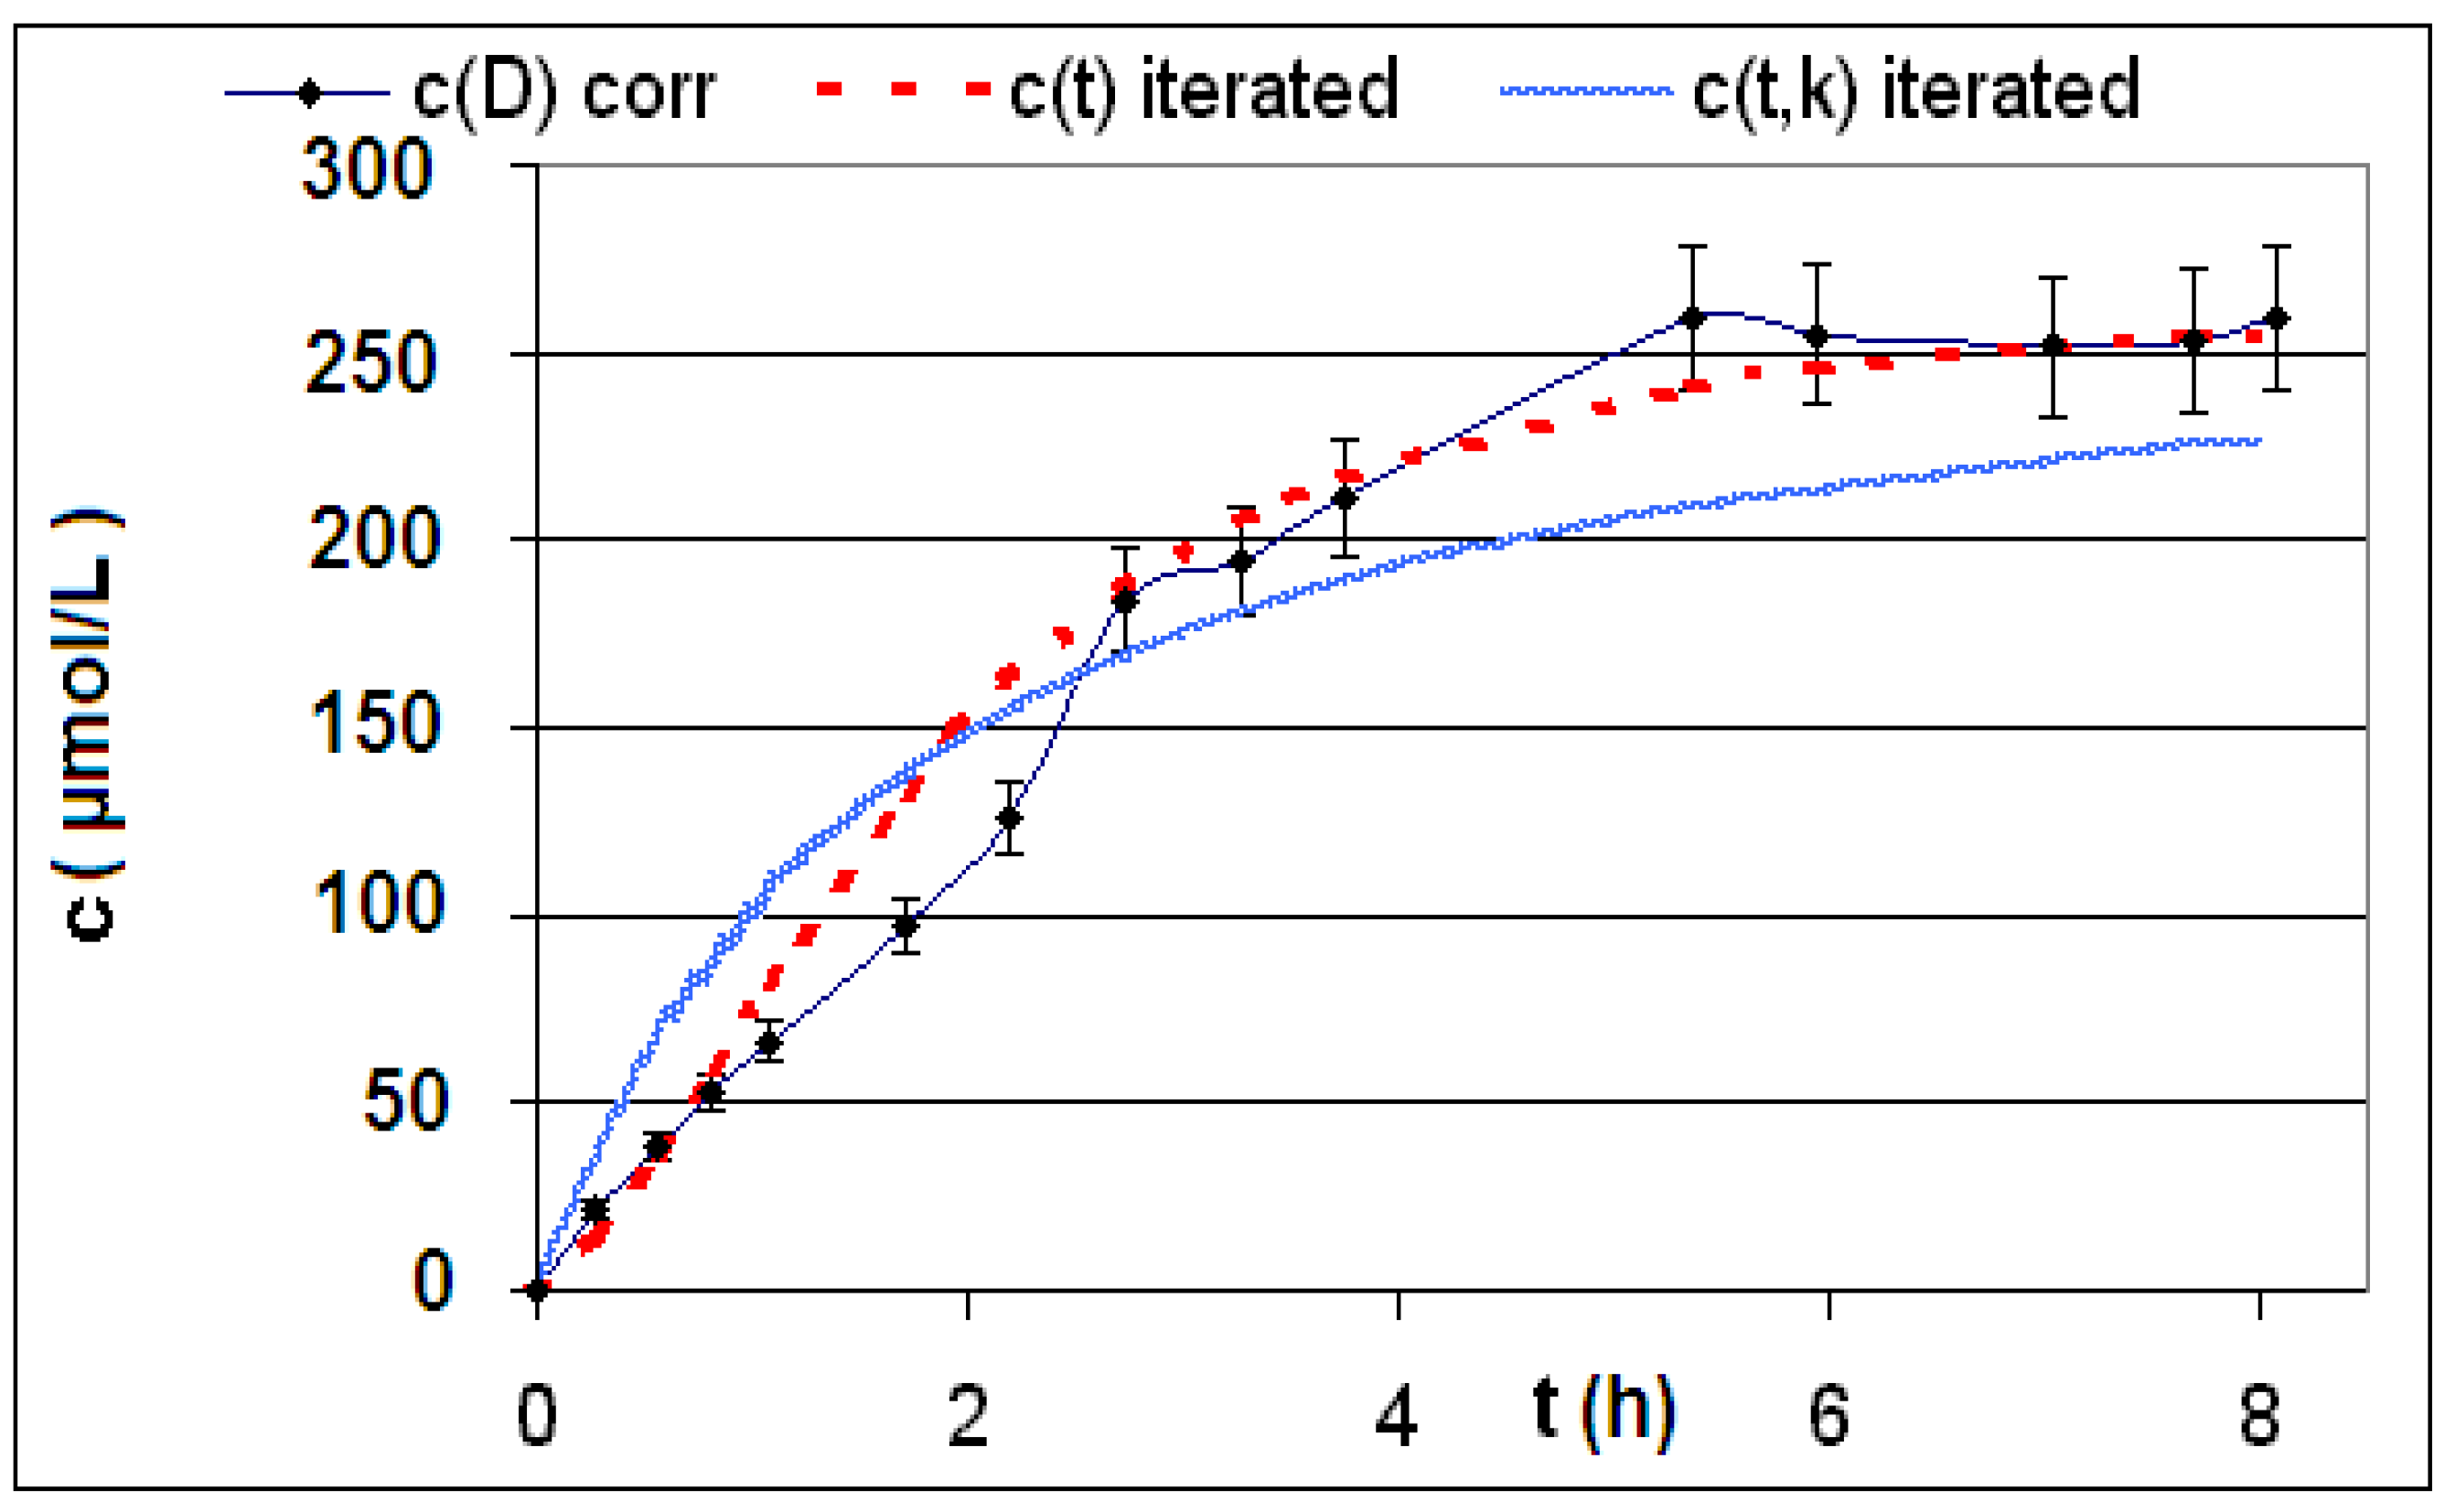
| R5 | 1-Naphthaline-methan-thiol (16) + 1.0 mL tri-ethylamine | 0.0589 g CNT3 f = 37, Vj = 0.000270 L | 3388 ± 165 P = (RS)2 ≅ 1* Br2 | 1535 ± 154 P T = 295 K | 0.232 ± 0.023 P | a (L∙mol−1∙h−3) | 8883 P |
| 0.250 P | b (L∙mol−1∙h−2) | −6854 P | |||||
| c (L∙mol−1∙h−1) | 2582 P | ||||||
| R6 | 1-Naphthaline-methan-thiol (16) + 1.0 mL tri-ethylamine | 0.0940 g CNT0 f = 5, Vj = 0.00100 L | 207 ± 20 P = (RS)2 ≅ 2* O2 | 2041 ± 117 P T = 296 K | 1.531 ± 0.088 P | a (L∙mol−1∙h−3) | 0 P |
| 1.682 P | b (L∙mol−1∙h−2) | 795.6 P | |||||
| c (L∙mol−1∙h−1) | 518.6 P | ||||||
| R No. | Reagent | CNT sample with weight mC and Vj and f | β (μmol/g) | k (L∙mol−1∙h−1) single param. + temperature | τ (h) | Iteration parameters a, b, c multiparameter fitting | |
|---|---|---|---|---|---|---|---|
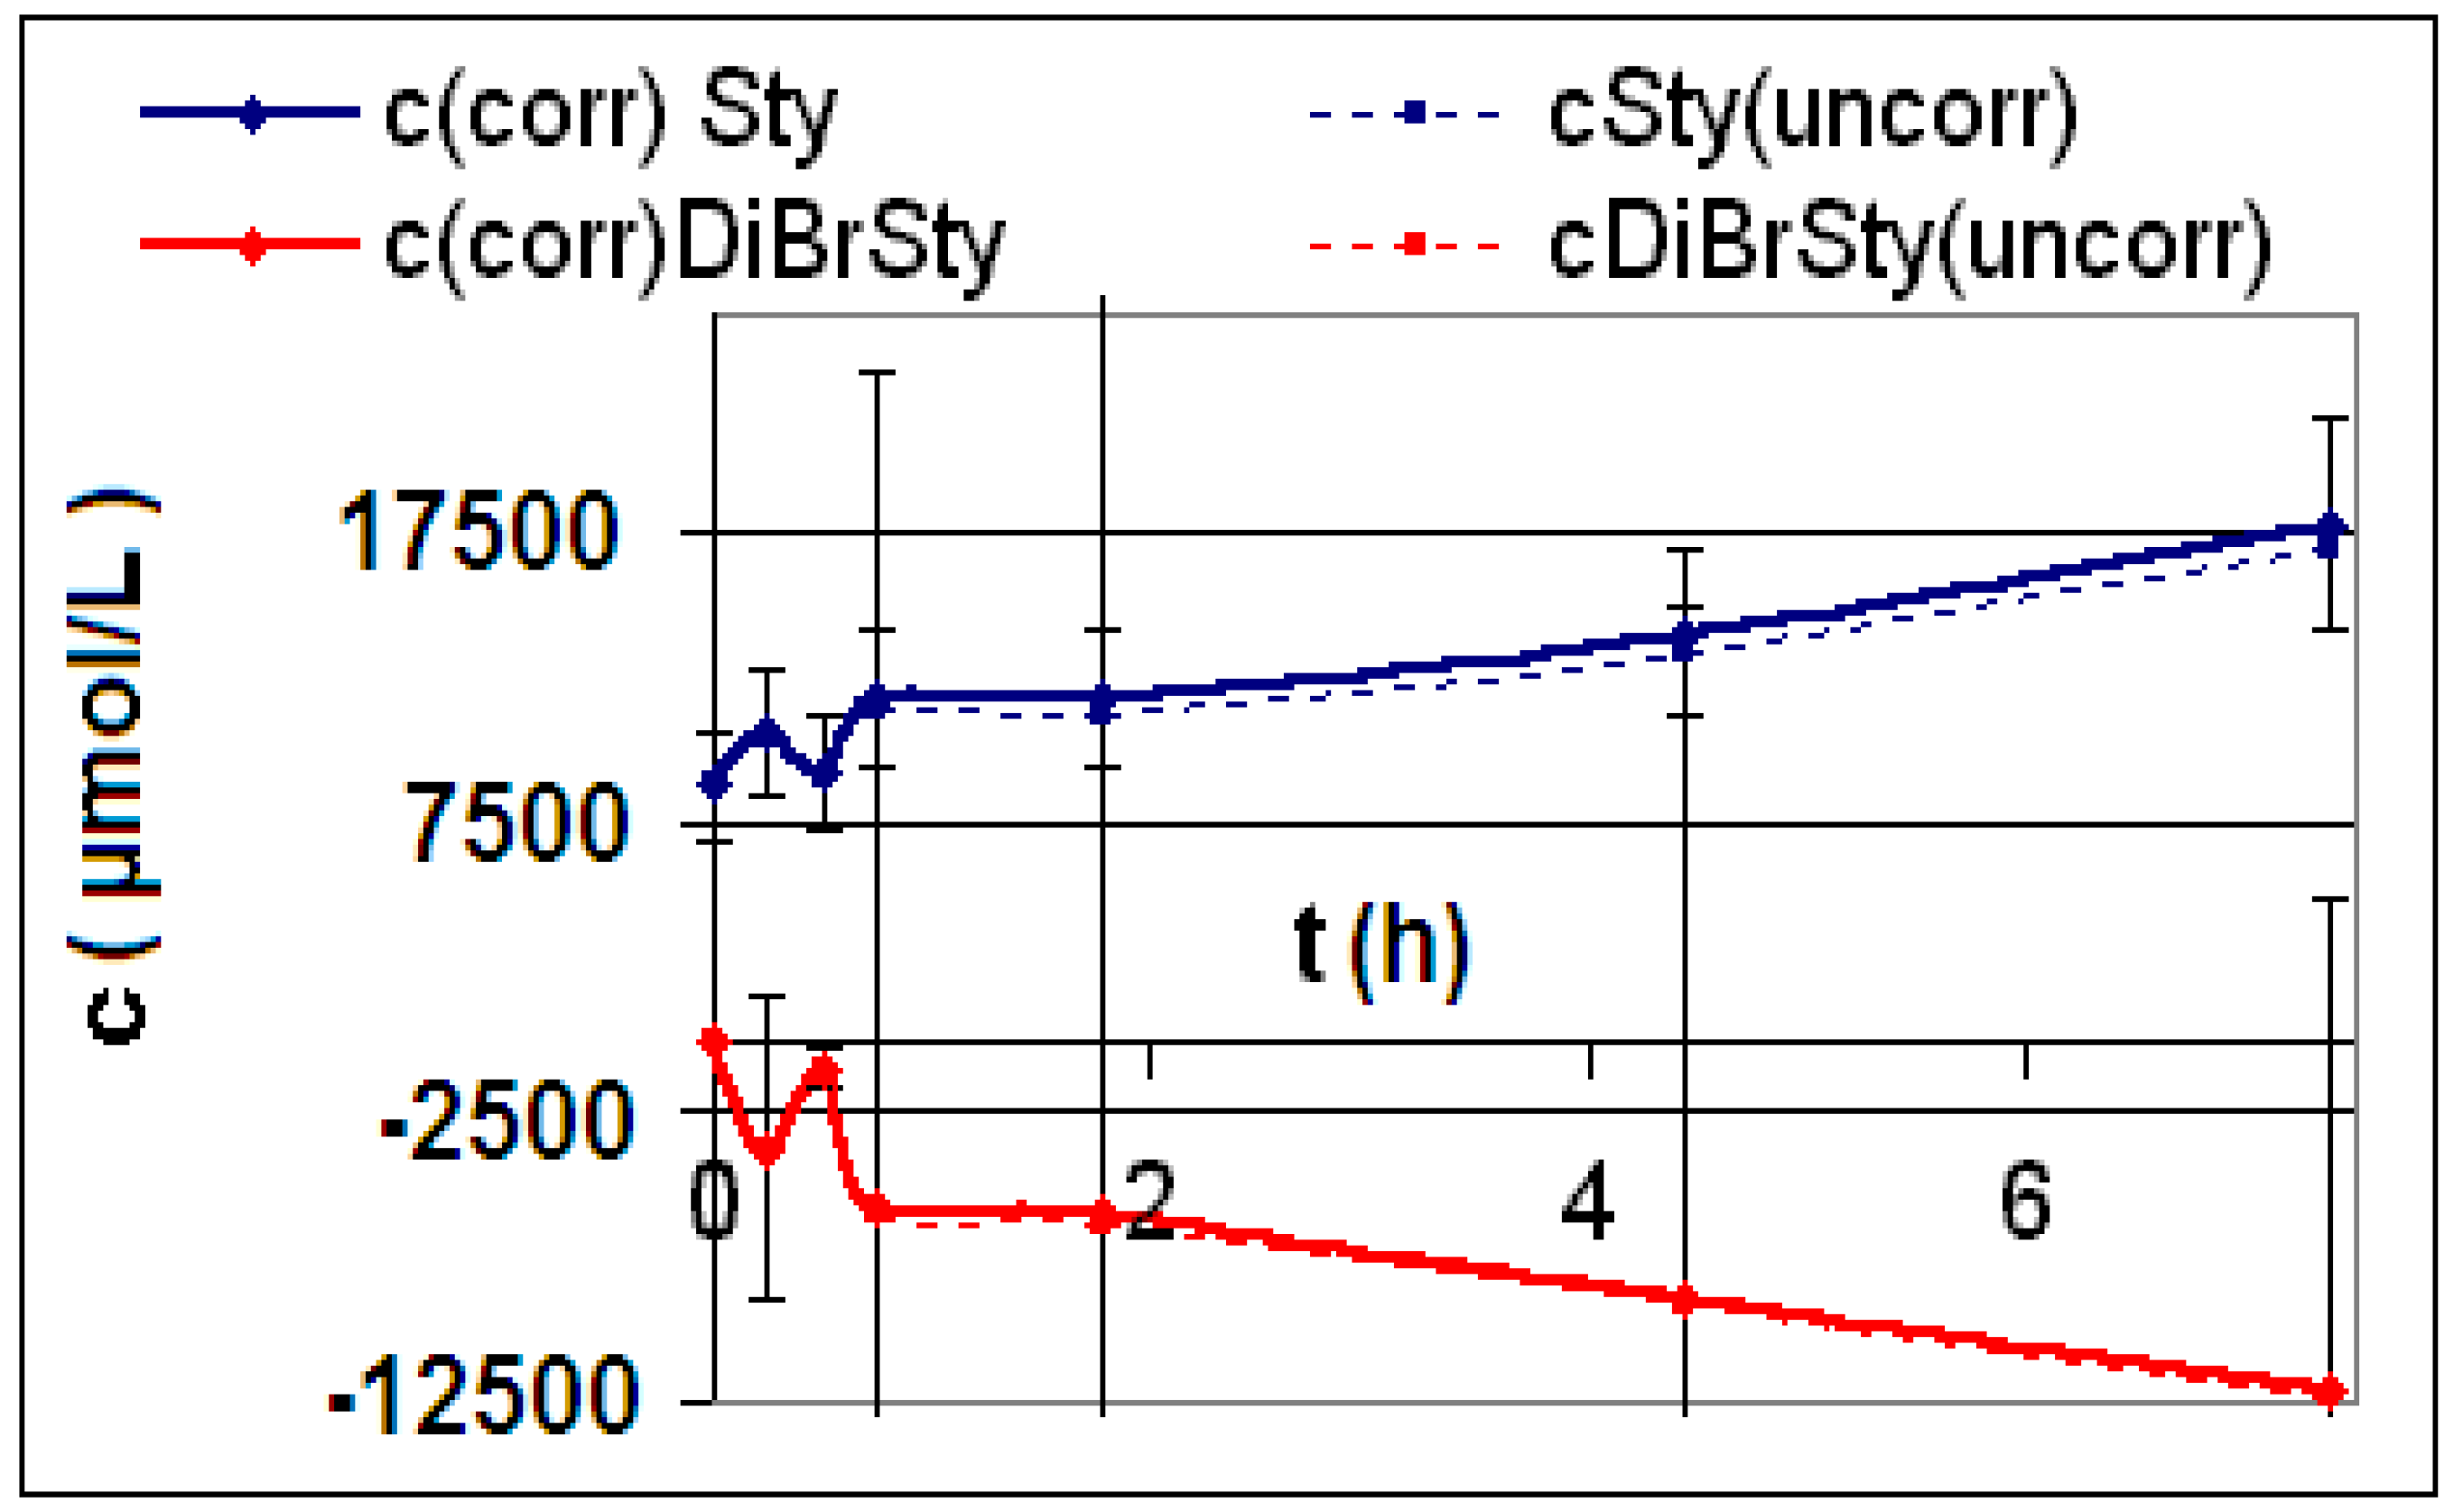
| R1 | 3-Vinyl-N,N-diethylbenzamide (13) | 0.1216 g CNT1 f = 200, Vj = 0.00100 L | 0 | 0 T = 295 K | ∞ | a (L∙mol−1∙h−3) | 0 |
| ∞ | b (L∙mol−1∙h−2) | 0 | |||||
| c (L∙mol−1∙h−1) | 0 | ||||||
| R2 | 3-Vinyl-N,N-diethylbenzamide (13) | 0.1585 g CNT2 f = 200, Vj = 0.00100 L | 0 | 0 T = 295 K | ∞ | a (L∙mol−1∙h−3) | 0 |
| ∞ | b (L∙mol−1∙h−2) | 0 | |||||
| c (L∙mol−1∙h−1) | 0 | ||||||
| R3 | 3-Vinyl-N,N-diethylbenzamide (13) | 0.1249 g CNT3 f = 10, Vj = 0.00100 L | 0 | 0 T = 296 K | ∞ | a (L∙mol−1∙h−3) | 0 |
| ∞ | b (L∙mol−1∙h−2) | 0 | |||||
| c (L∙mol−1∙h−1) | 0 | ||||||
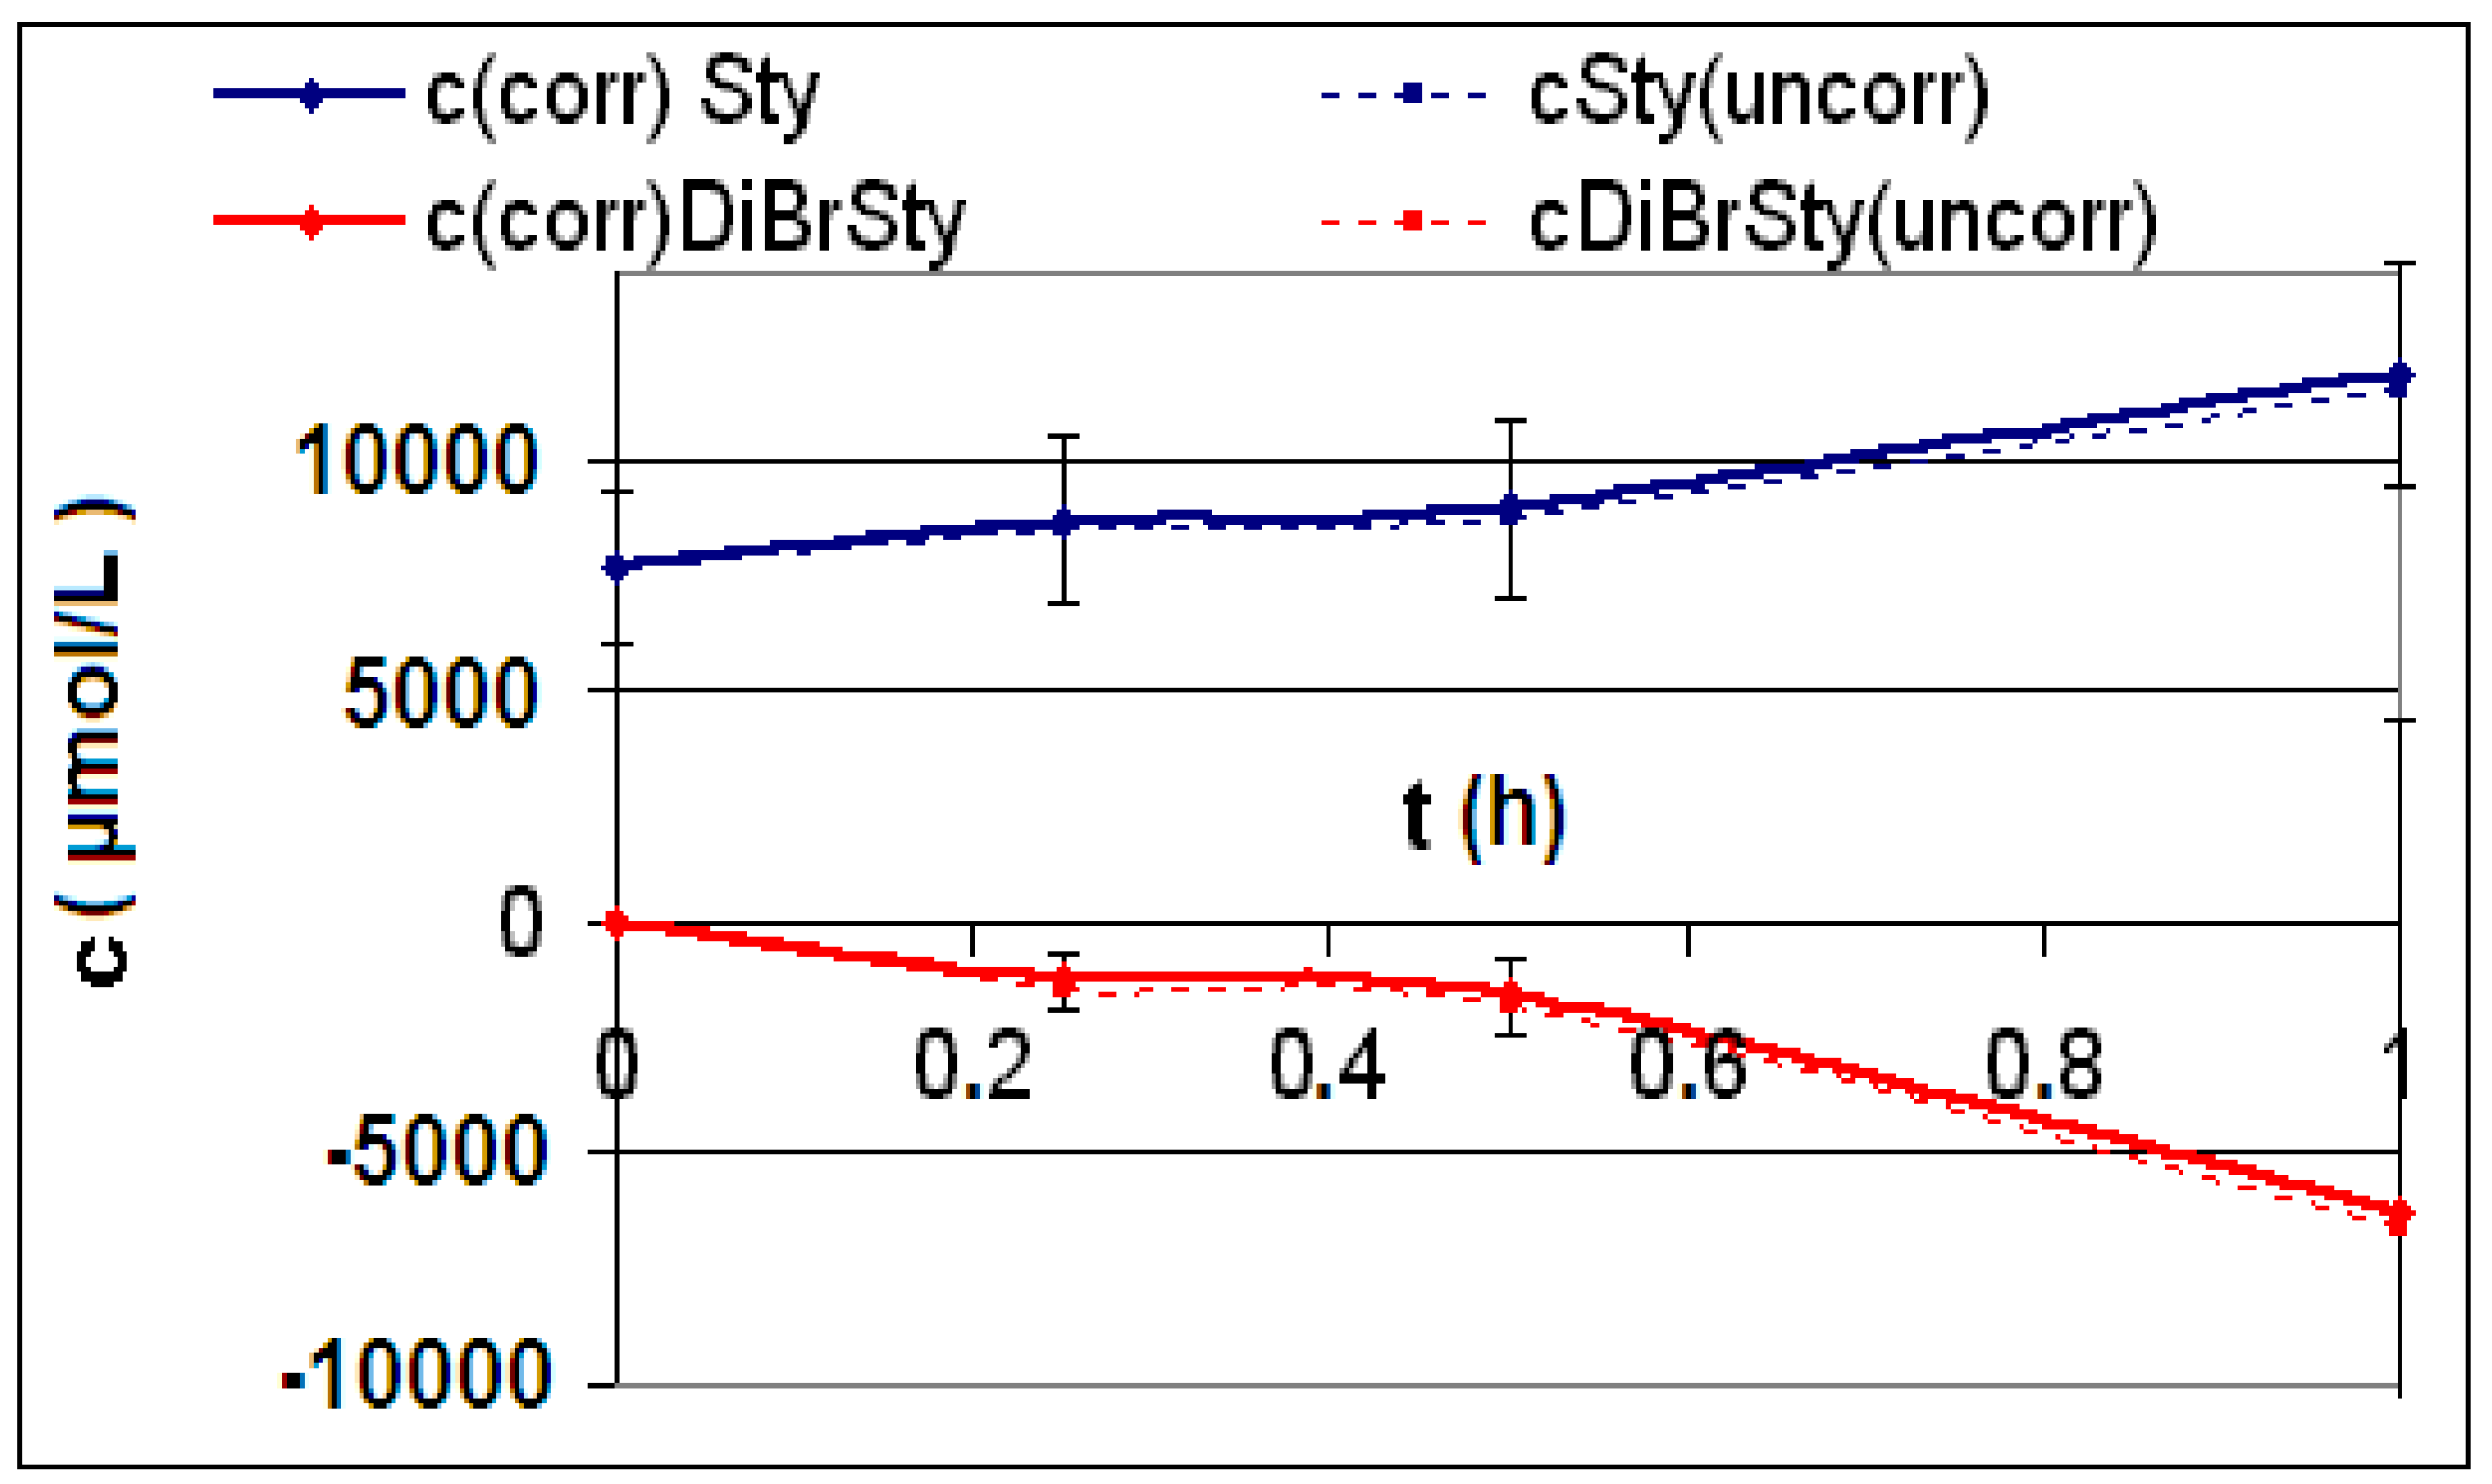
| Reaction | Corrected and uncorrected concentration profiles c(t) | Corrected concentration profile and iterated curves |
|---|---|---|
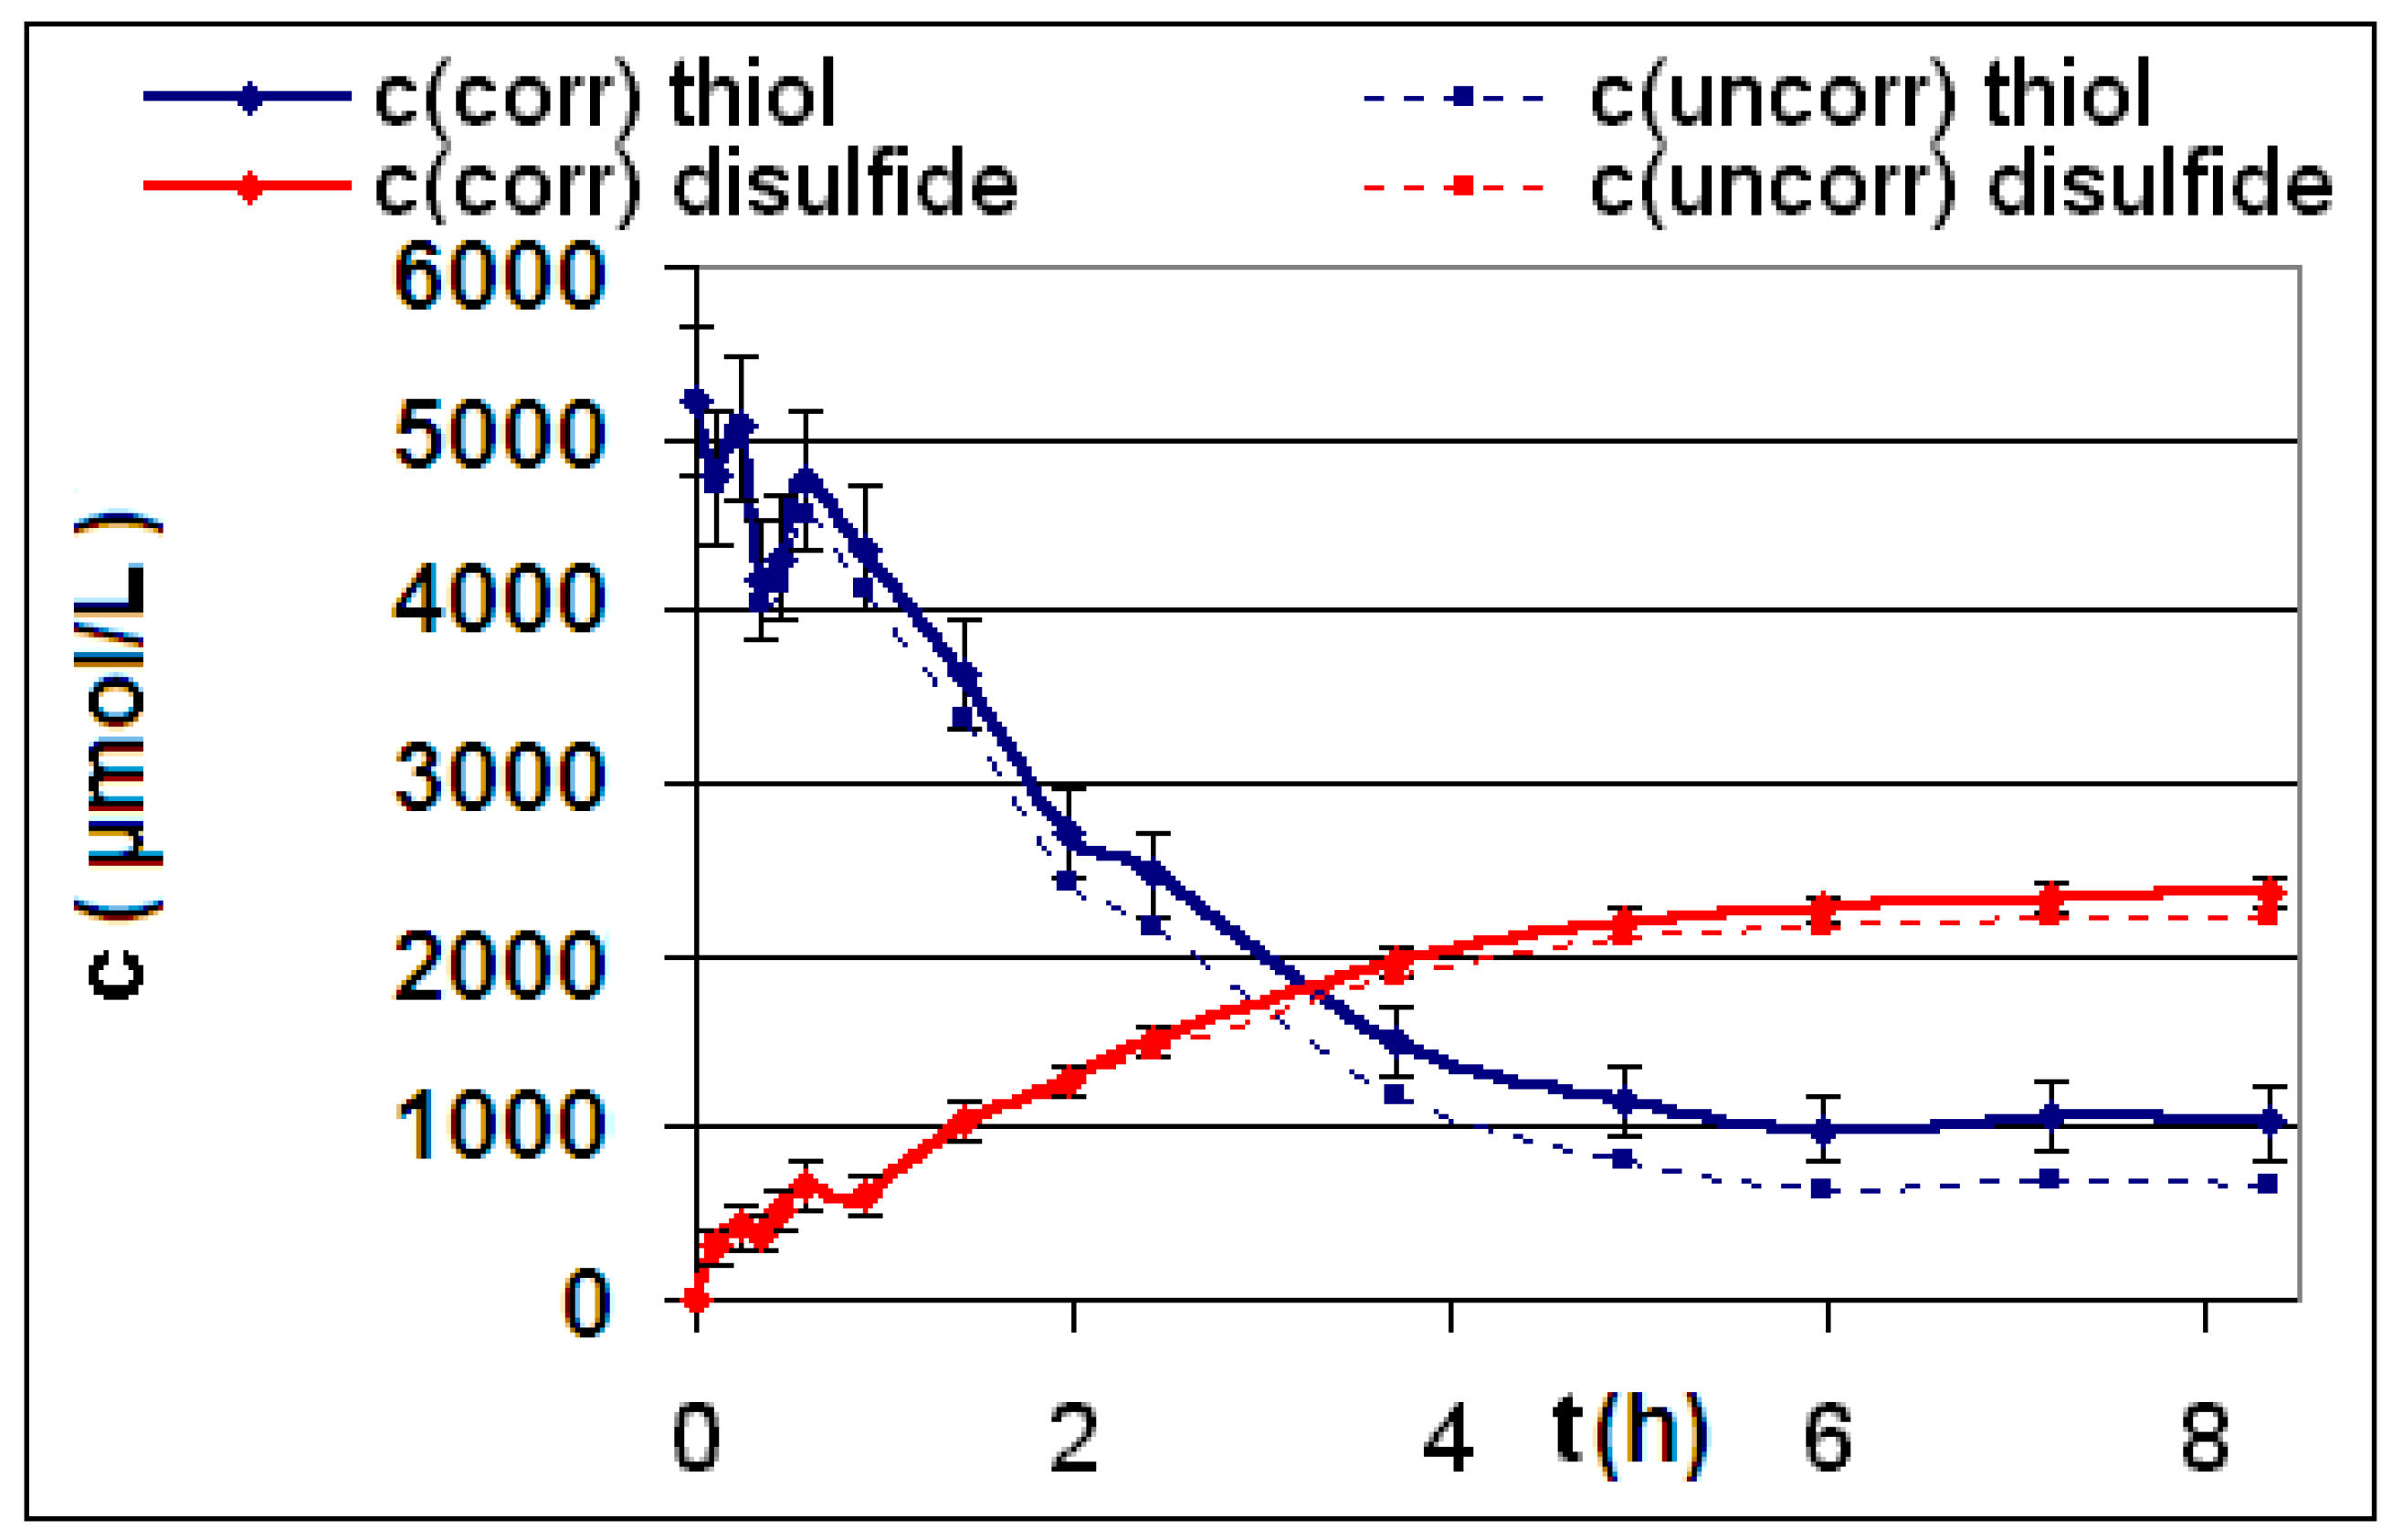
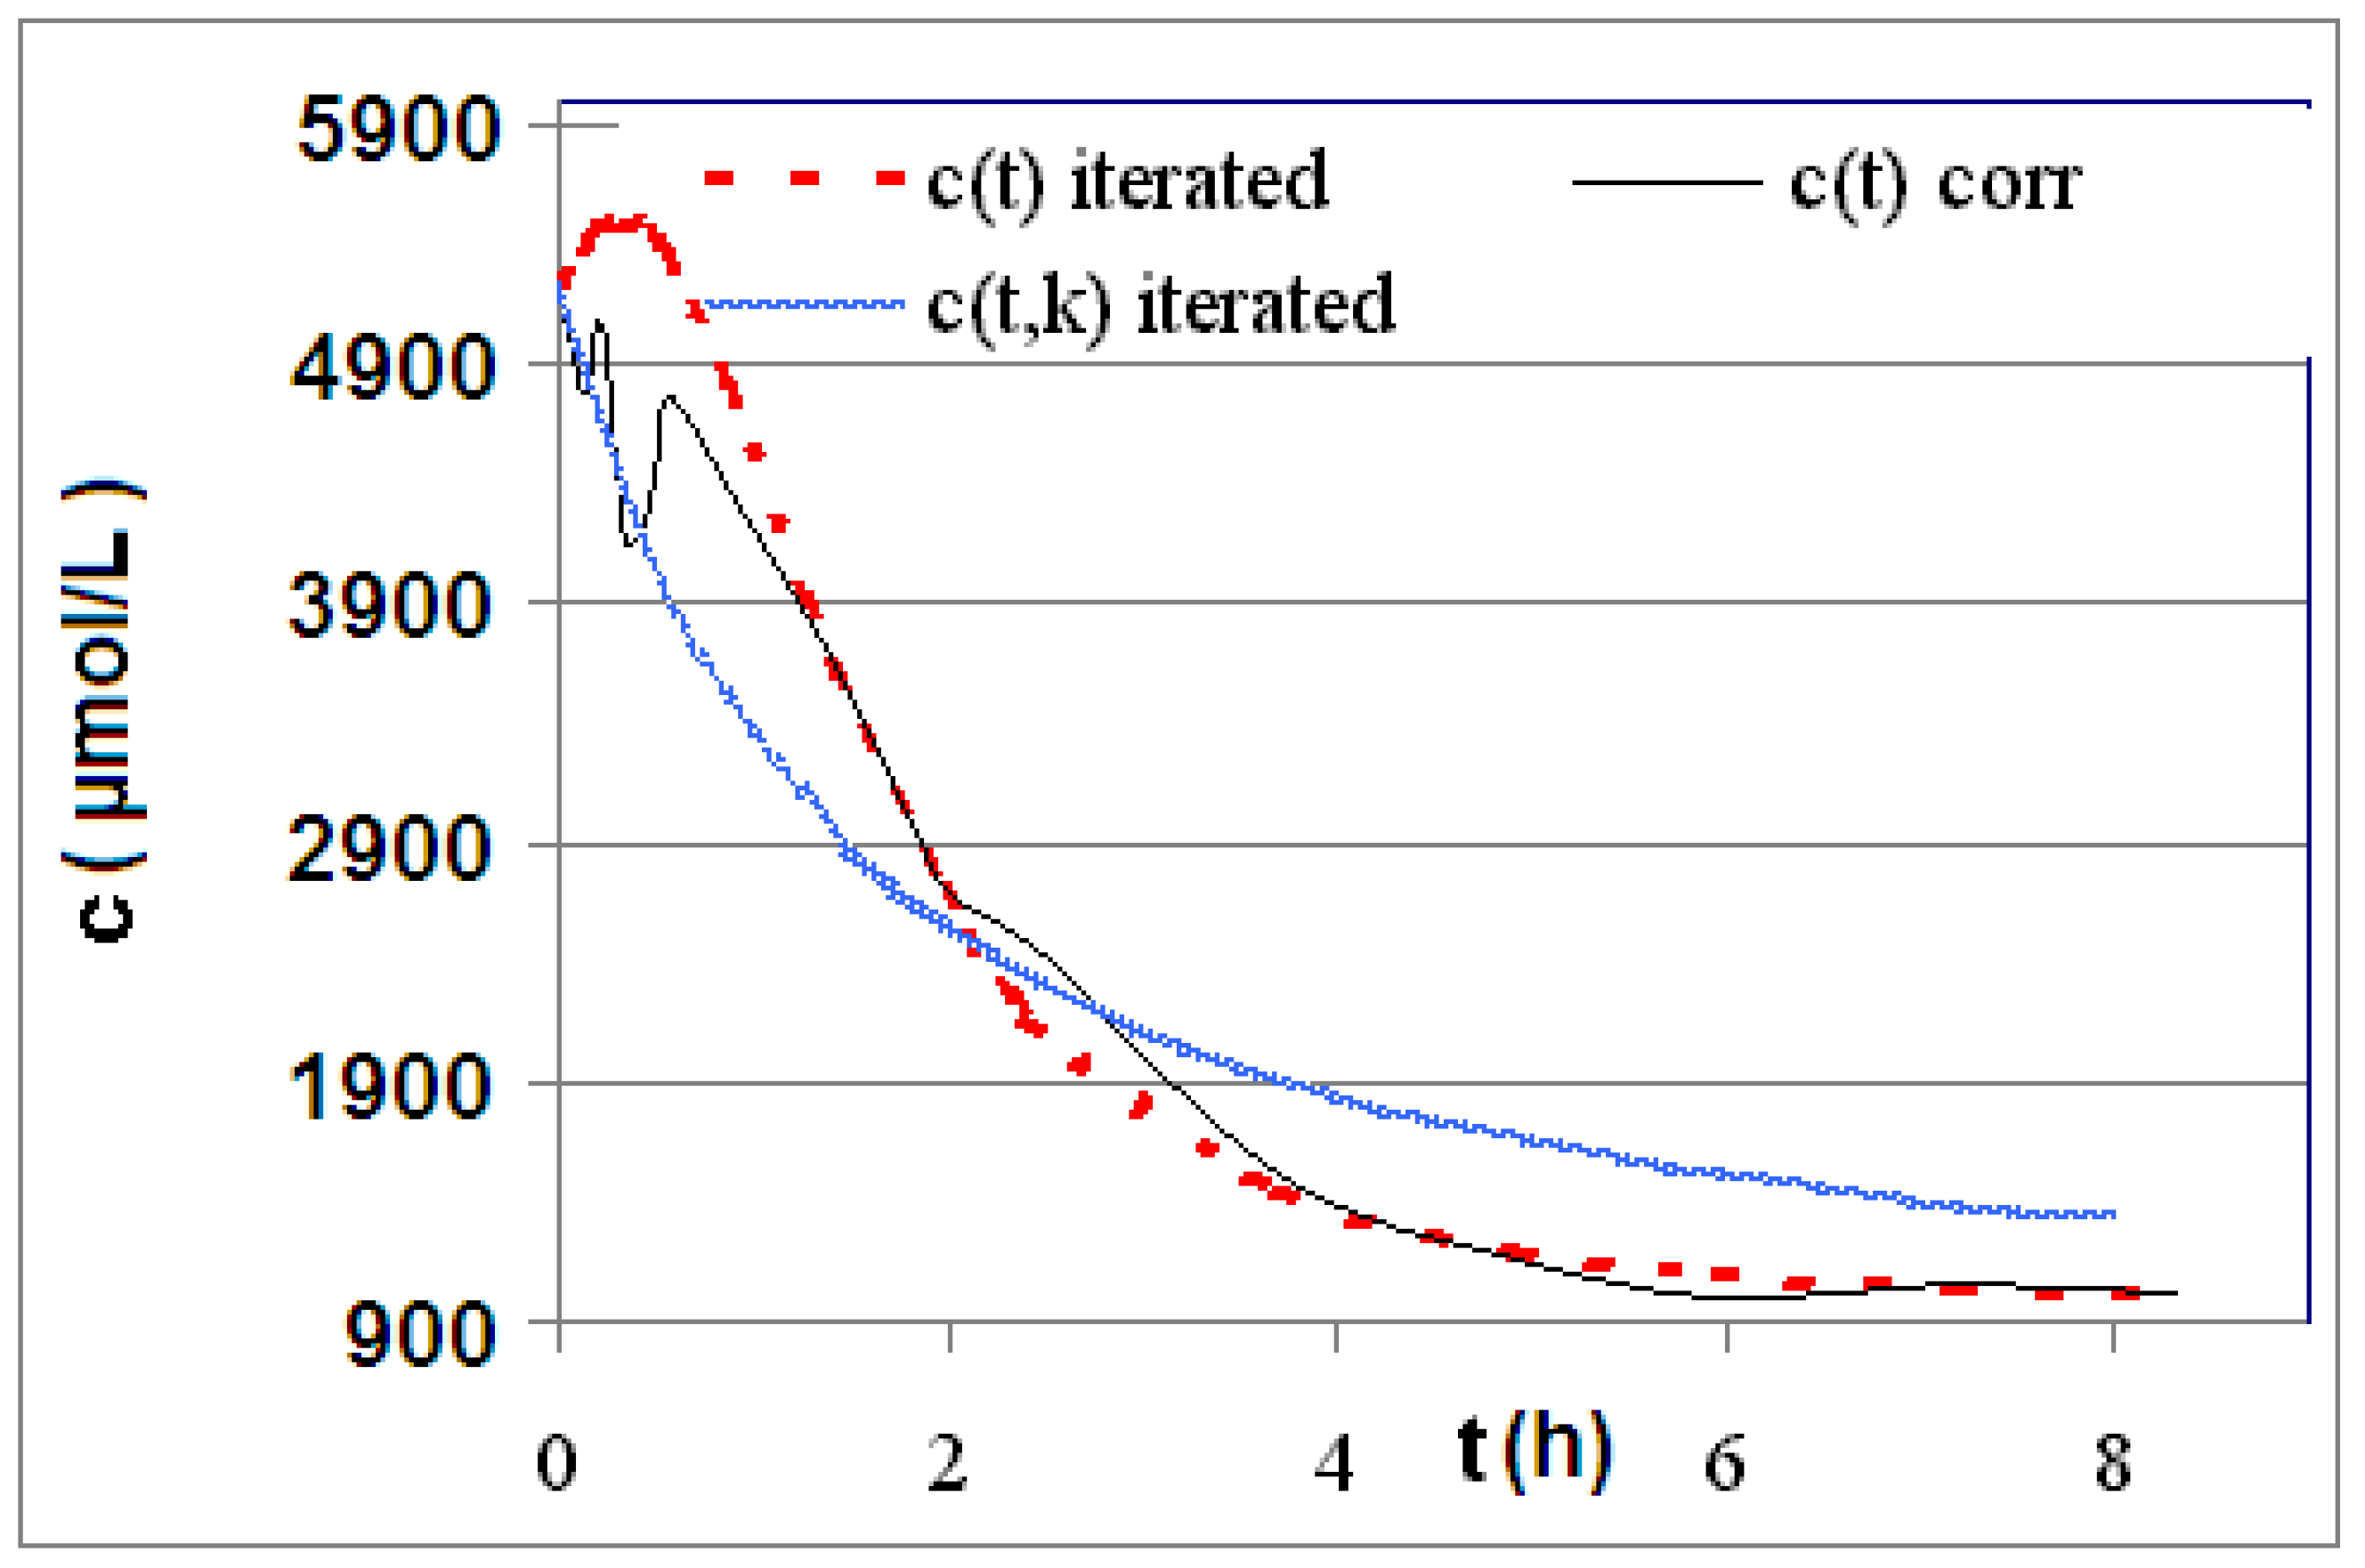
| R4 | Figure 2 | Figure 3 |
| R5 | Figure 4 | Figure 5 |
| R6 | Figure 6 | Figure 7 |


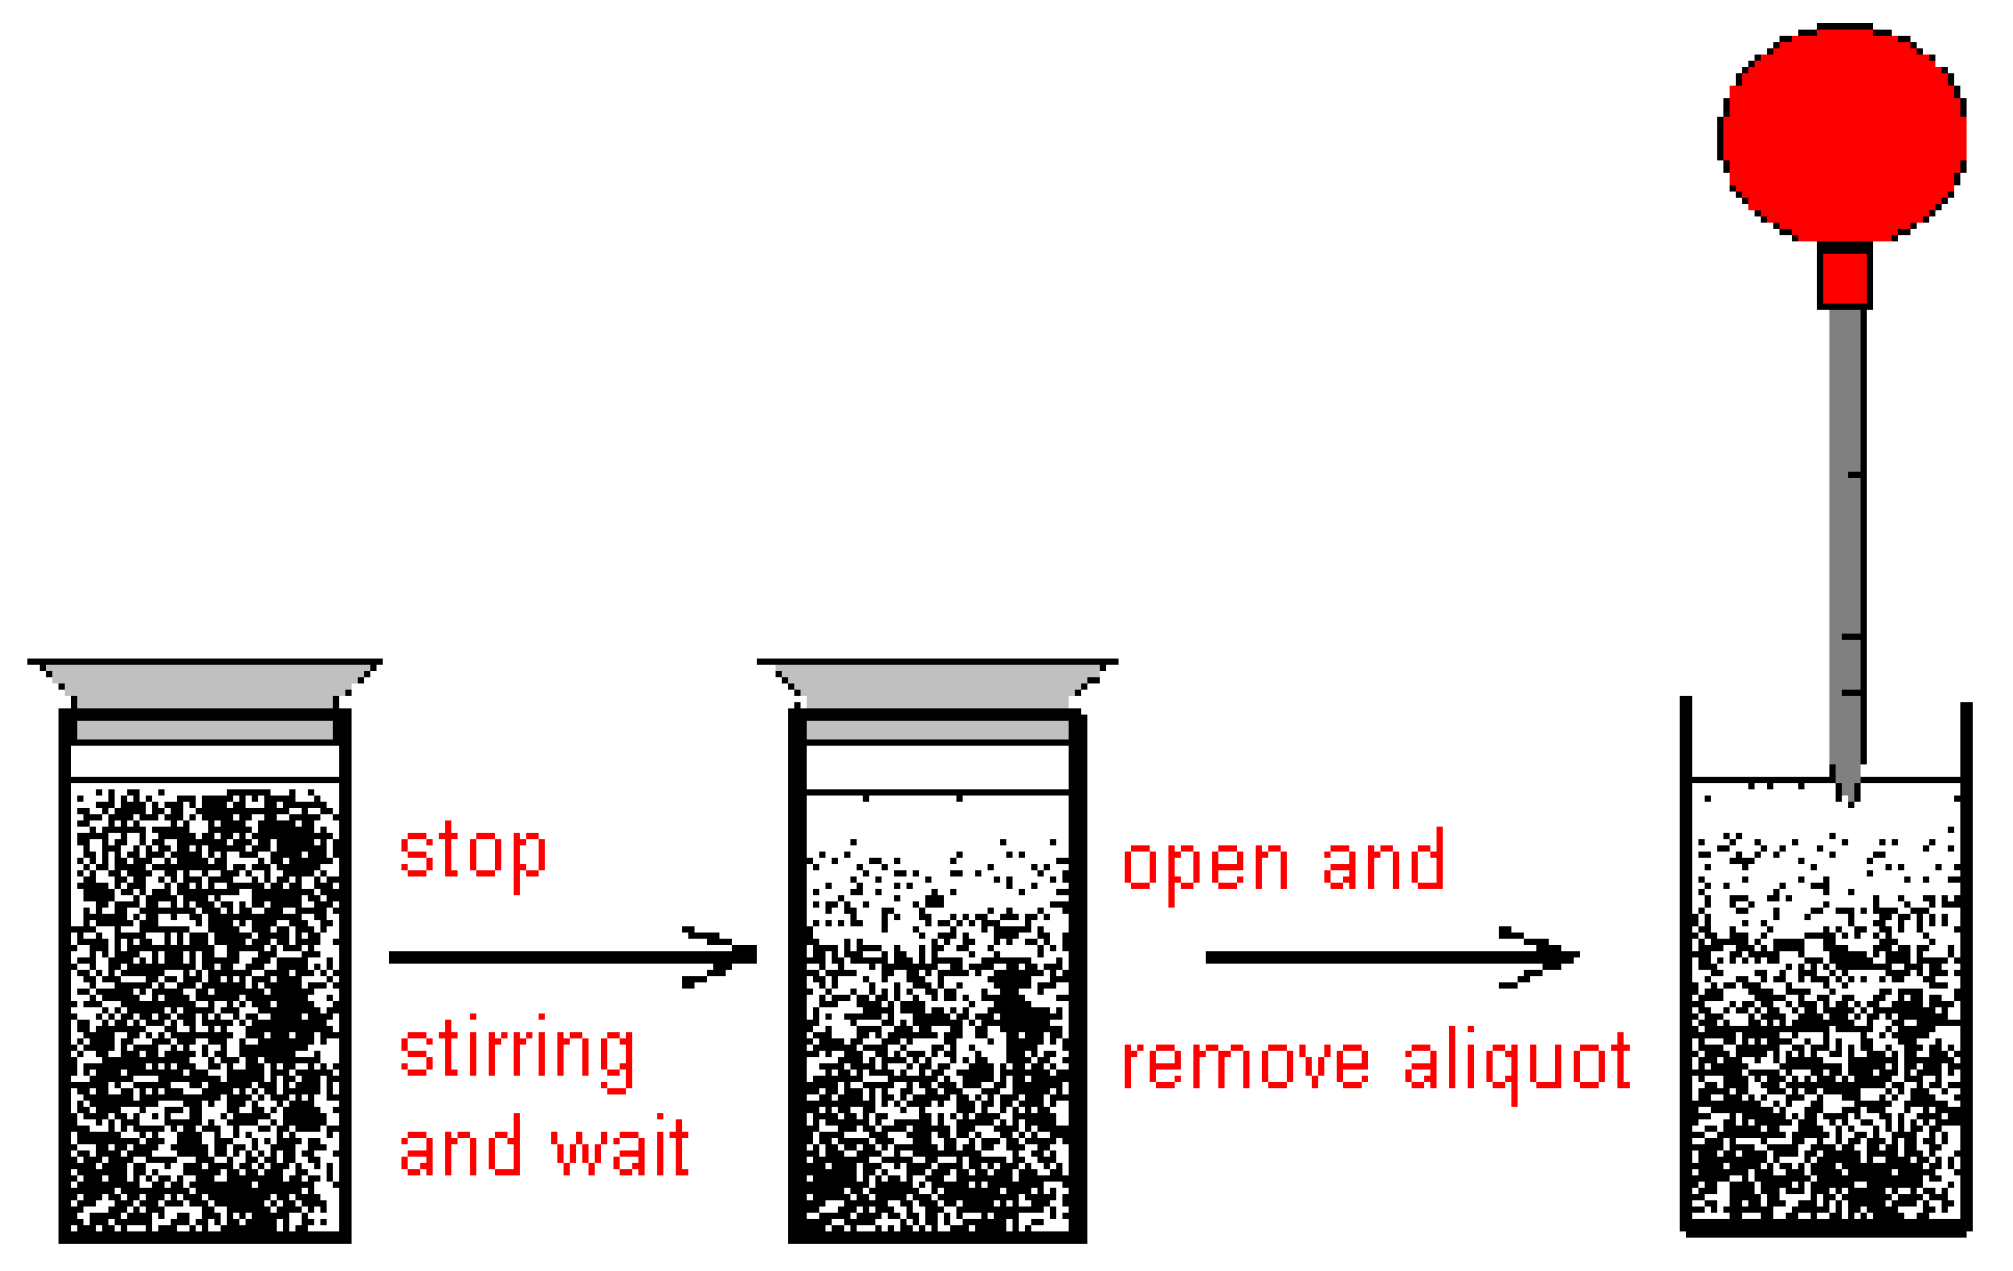
2.2. Discussion of the Chosen Discontinuous Off-Line Sampling Procedure
3. Experimental
3.1. Materials
| Material | at % C | at % O | at % Br |
|---|---|---|---|
| CNT0 | 99.4 | 0.6 | – |
| CNT1 | 75.6 | 6.5 | 17.9 |
| CNT2 | 74.1 | 4.3 | 21.7 |
| CNT3 | 97.4 | 1.0 | 1.6 |
3.2. Instruments
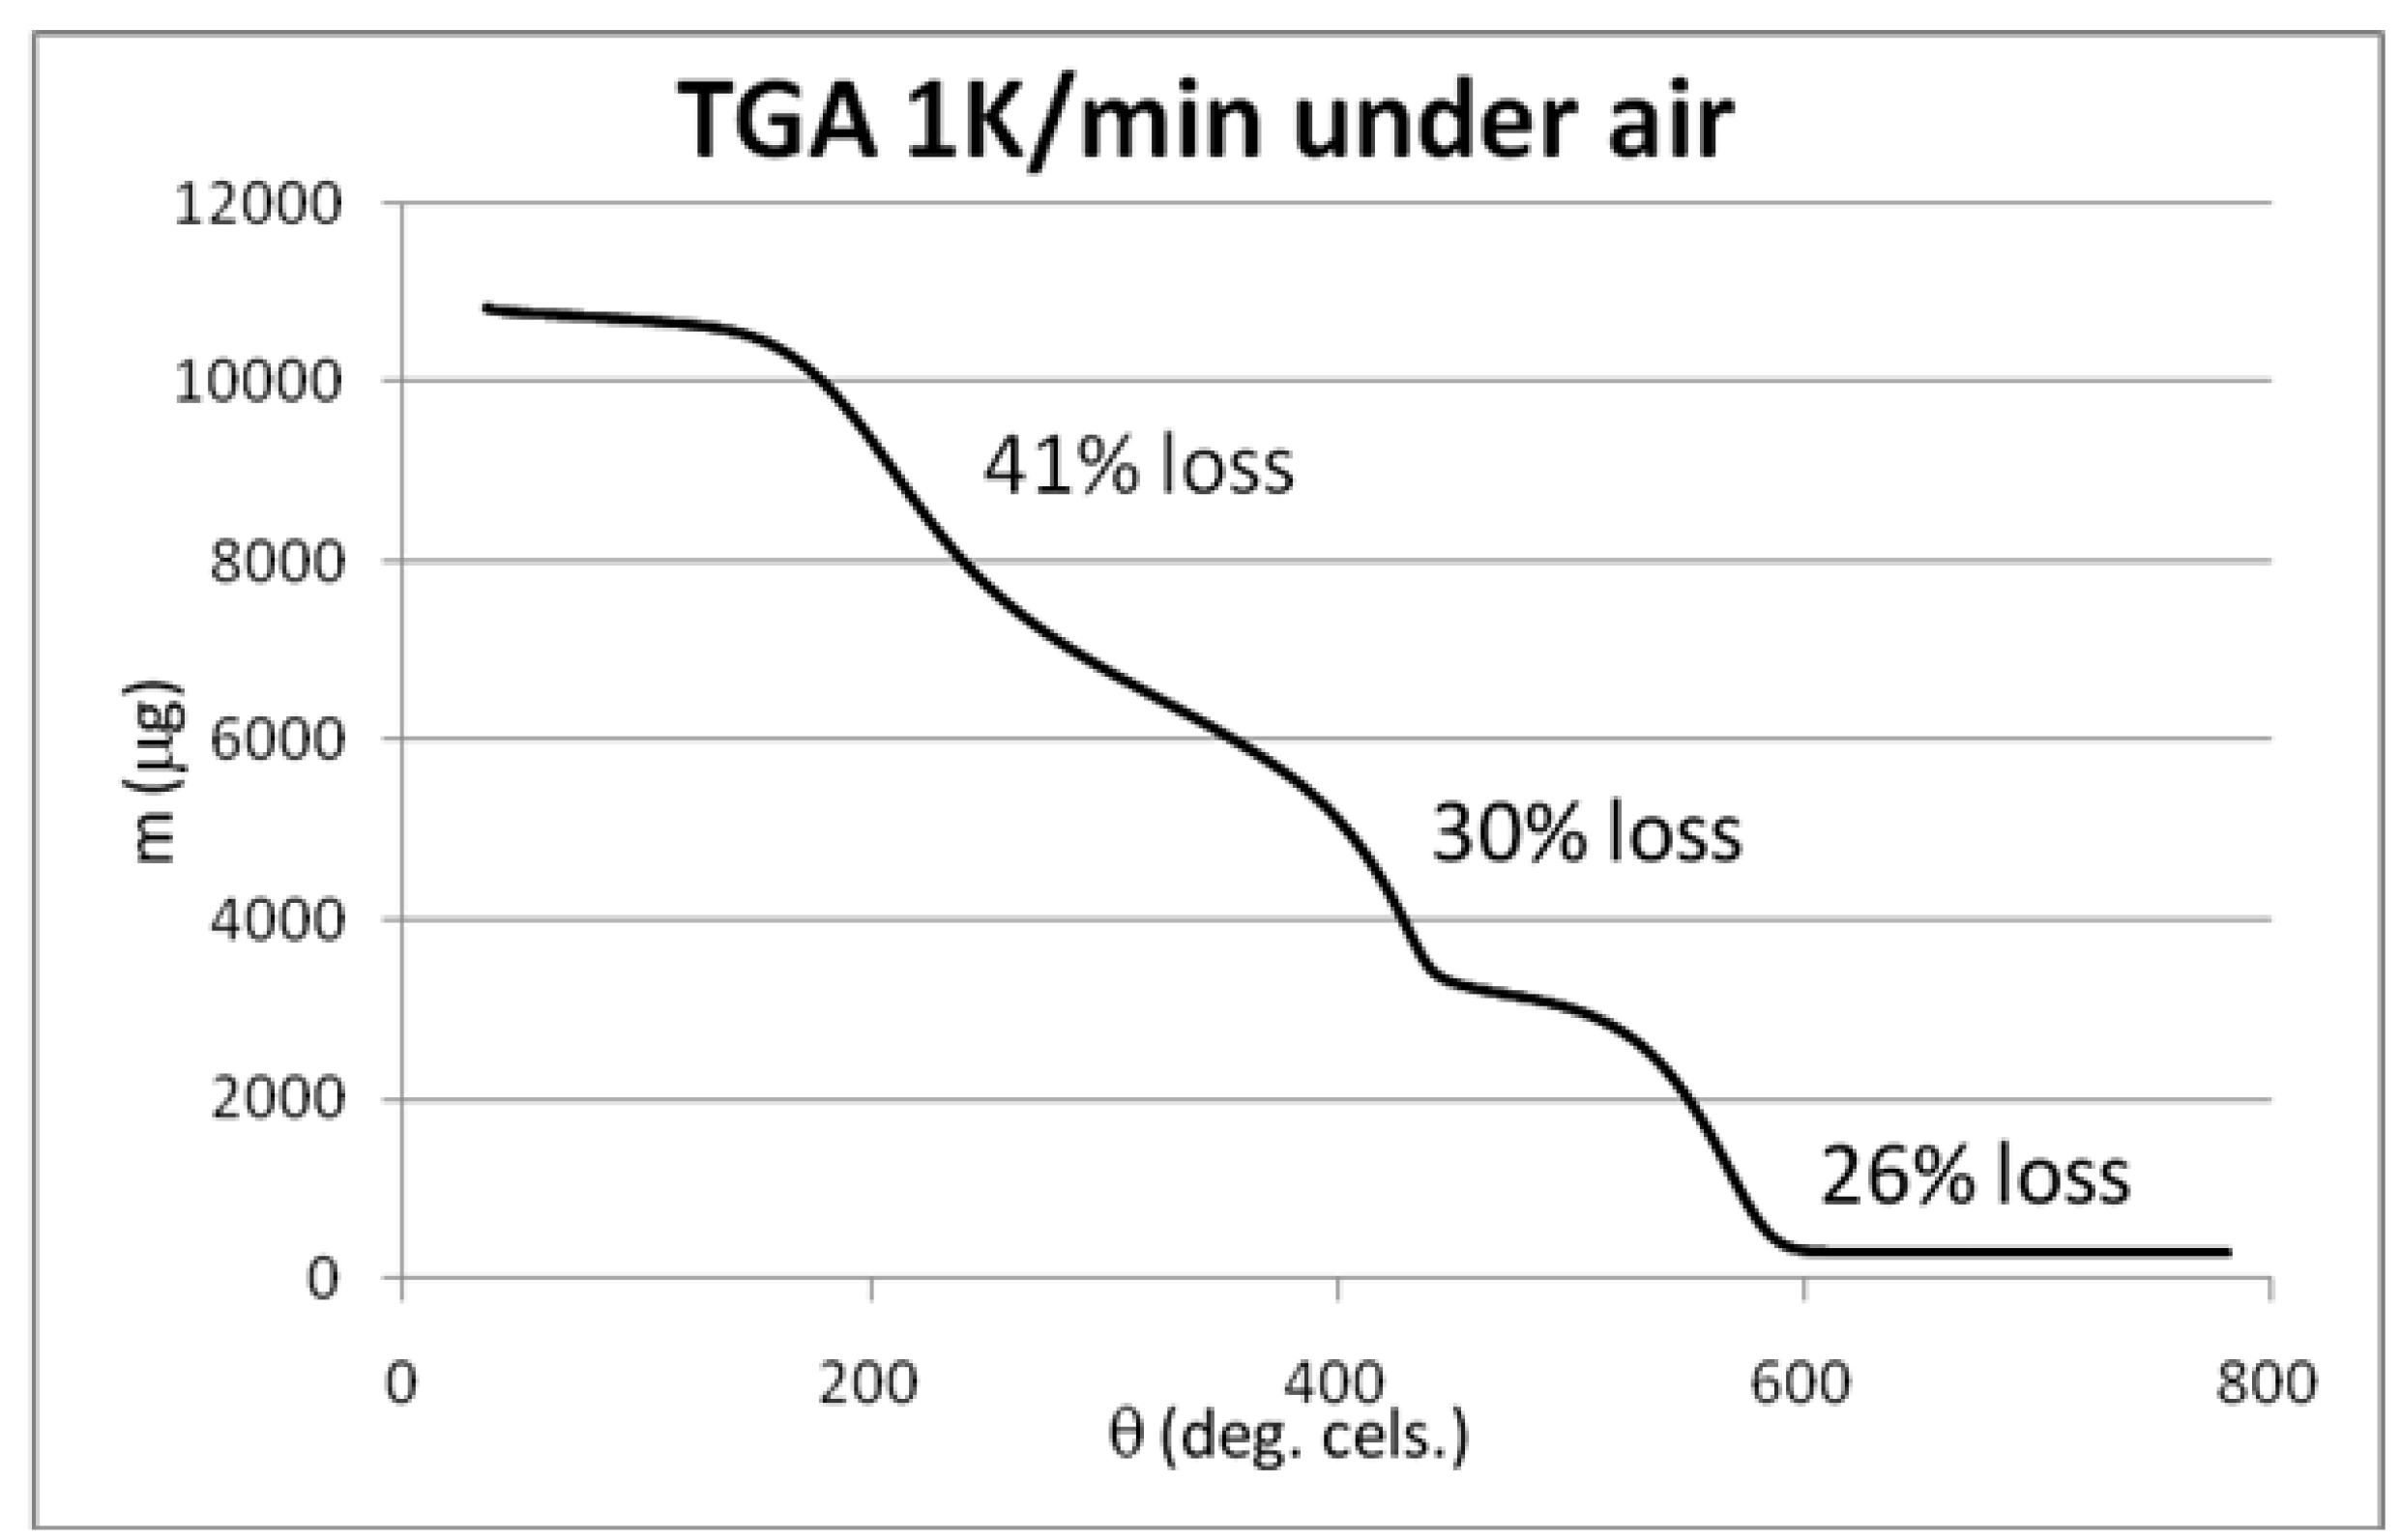
3.3. Initial Material Analyses of the CNT Samples

3.4. Syntheses of Reagents and Measurement of UV-Extinction Coefficients


| Reagent | Solvent | λ (nm) | ελ (L∙mol−1∙cm−1) | Concentration detection limit (98% confidence) (μmol/L) |
|---|---|---|---|---|
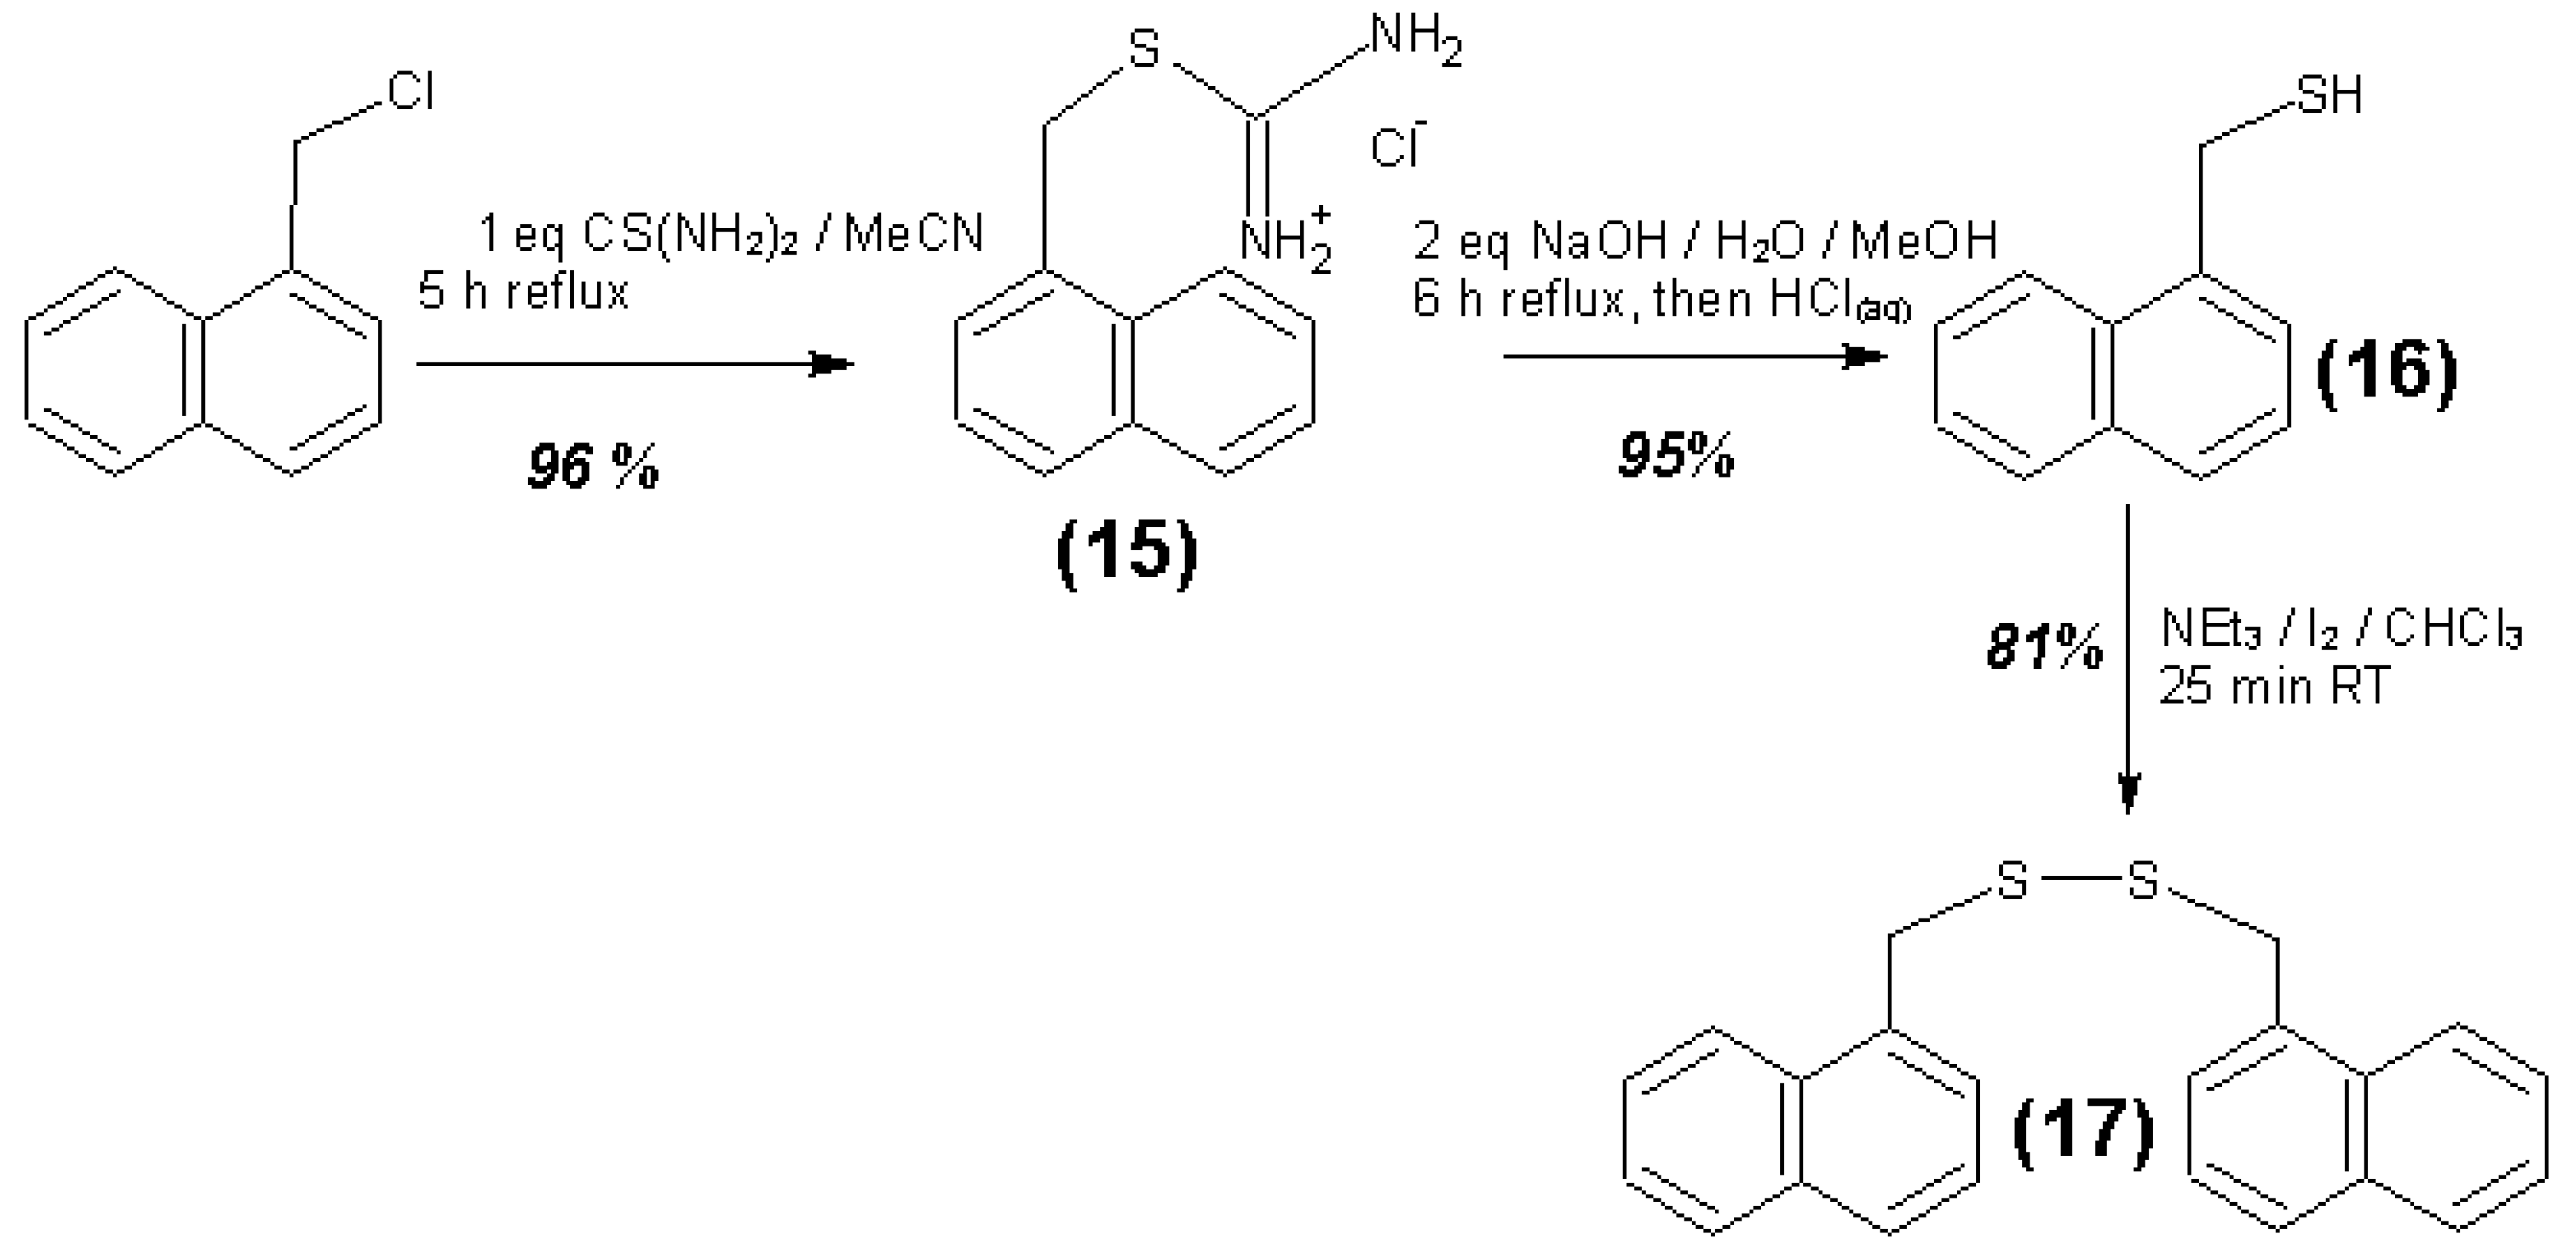
| 1-Naphthalenemethan-thiol (16) + triethylamine | CH3CN | 284.5 | 7672 ± 36 | 2.13 |
| 1-Naphthalenemethan-thiol (16) + triethylamine | CH3CN | 287.5 | 6822 ± 11 | 0.83 |
| Bis-(1-Naphthylmethyl)-disulfide (17) + triethylamine | CH3CN | 284.5 | 15740 ± 157 | 1.79 |
| Bis-(1-Naphthylmethyl)-disulfide (17) + triethylamine | CH3CN | 287.5 | 16868 ± 161 | 1.84 |
| 4-(2,2,2-Trifluoroethoxymethyl)-1-naphthalenemethan-thiol (11) + triethylamine | CH3CN | 289.7 | 8876 ± 65 | 2.54 |
| 4-(2,2,2-Trifluoroethoxymethyl)-1-naphthalenemethan-thiol (11) + triethylamine | CH3CN | 292.7 | 8196 ± 58 | 2.41 |
| Bis-[4-(2,2,2-Trifluoroethoxymethyl)-1-Naphthylmethyl]-disulfide (12) + triethylamine | CH3CN | 289.7 | 18974 ± 58 | 0.45 |
| Bis-(4-(2,2,2-Trifluoroethoxymethyl)-1-Naphthylmethyl)-disulfide (12) + triethylamine | CH3CN | 292.7 | 19826 ± 55 | 0.43 |
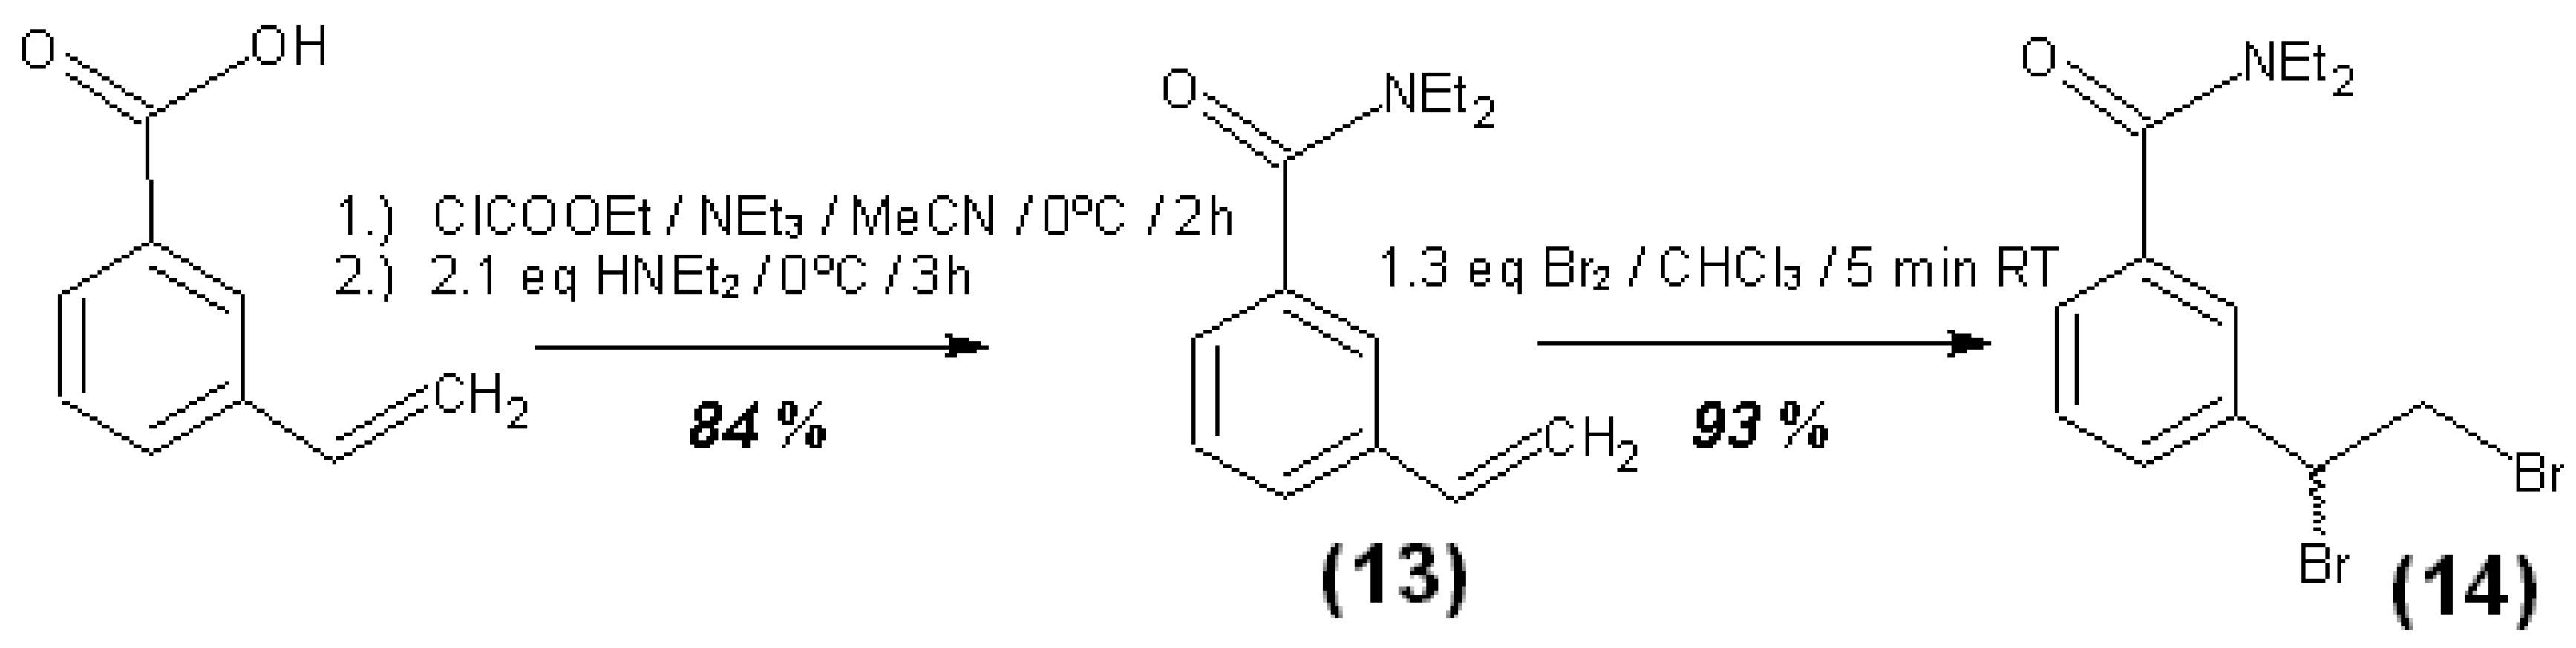
| N,N-Diethyl-3-vinylbenzamide (13) | CHCl3 | 241.5 | 13011 ± 188 | 2.97 |
| N,N-Diethyl-3-vinylbenzamide (13) | CHCl3 | 243.5 | 13681 ± 164 | 2.46 |
| (±)-N,N-Diethyl-3-(1,2-Dibromoethyl)-benzamide (14) | CHCl3 | 241.5 | 6862 ± 61 | 3.54 |
| (±)-N,N-Diethyl-3-(1,2-Dibromoethyl)-benzamide (14) | CHCl3 | 243.5 | 6586 ± 50 | 3.00 |
3.5. General Procedure
| Reaction | Reagent | CNT sample | mas (g) | Vrs (L) | Vprs (L) | Vs (L) | Vt (L) | mar (g) |
|---|---|---|---|---|---|---|---|---|
| R1 | 3-Vinyl-N,N-diethyl-benzamide (13) | CNT1 | 0.6845 | 0.1000 | 0.02500 | 0.05000 | 0.07500 | 0.1711 |
| R2 | 3-Vinyl-N,N-diethyl-benzamide (13) | CNT2 | 0.6845 | 0.1000 | 0.02500 | 0.05000 | 0.07500 | 0.1711 |
| R3 | 3-Vinyl-N,N-diethyl-benzamide (13) | CNT3 | 0.1836 | 0.1000 | 0.00050 | 0.06500 | 0.07000 | 0.0092 |
| R4 | 4-(2,2,2-Trifluoro-ethoxy-methyl)-1-naphthalene-methanthiol (11) | CNT1 | 0.0572 | 0.0200 | 0.01500 | 0.01500 | 0.03000 | 0.0429 |
| R5 | 1-Naphthalene-methan-thiol (16) + 1.0 mL tri-ethylamine | CNT3 | 0.2583 | 0.0500 | 0.01500 | 0.07500 | 0.09000 | 0.0775 |
| R6 | 1-Naphthalene-methan-thiol (16) + 1.0 mL tri-ethyl-amine | CNT0 | 0.1951 | 0.1000 | 0.00500 | 0.07000 | 0.07500 | 0.0098 |
| Reaction | λ1 (nm) | λ2 (nm) |
|---|---|---|
| R1 | 241.5 | 243.5 |
| R2 | 241.5 | 243.5 |
| R3 | 241.5 | 243.5 |
| R4 | 289.7 | 292.7 |
| R5 | 284.5 | 287.5 |
| R6 | 284.5 | 287.5 |
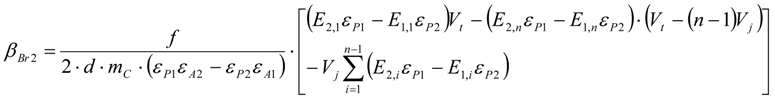
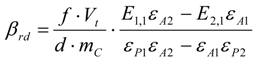
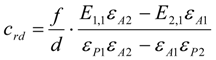
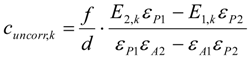
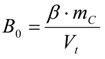
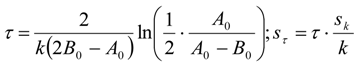
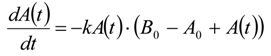
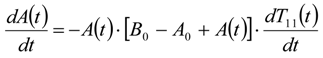
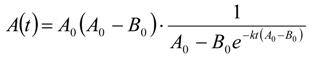
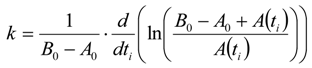
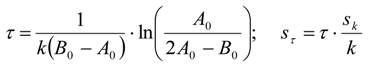
3.6. Theory and Calculation
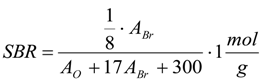
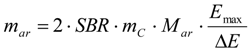
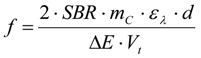
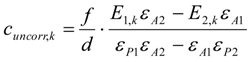
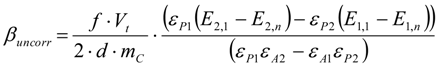
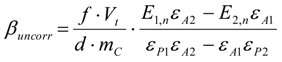
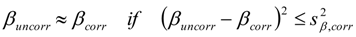
3.6.1. Quantification


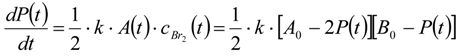
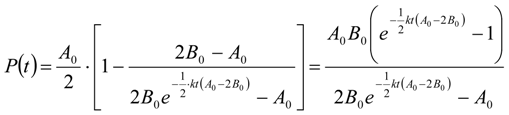
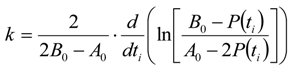
3.6.2. Reaction Kinetics and Modeled Mechanism
4. Conclusions
Acknowledgements
Conflict of Interest
References
- Hanelt, S.; Orts-Gil, G.; Friedrich, J.F.; Meyer-Plath, A. Differentiation and quantification of surface acidities on MWCNTs by indirect potentiometric titration. Carbon 2011, 49, 2978–2988. [Google Scholar]
- Xing, Y.; Dementev, N.; Borguet, E. Chemical labeling for quantitative characterization of surface chemistry. Curr. Opin. Solid State Mater. Sci. 2007, 11, 86–91. [Google Scholar]
- Dementev, N.; Feng, X.; Borguet, E. Fluorescence labeling and quantification of oxygen-containing functionalities on the surface of single-walled carbon nanotubes. Langmuir 2009, 25, 7573–7577. [Google Scholar] [CrossRef] [PubMed]
- Pellenbarg, T.; Dementev, N.; Jean-Gilles, R.; Bessel, C.; Borguet, E.; Dollahon, N.; Giuliano, R. Detecting and quantifying oxygen functional groups on graphite nanofibers by fluorescence labeling of surface species. Carbon 2010, 48, 4256–4267. [Google Scholar] [CrossRef]
- Ryabenko, A.G.; Dorofeeva, T.V.; Zvereva, G.I. UV–VIS–NIR spectroscopy study of sensitivity of single-wall carbon nanotubes to chemical processing and Van-der-Waals SWNT/SWNT interaction. Verification of the SWNT content measurements by absorption spectroscopy. Carbon 2004, 42, 1523–1535. [Google Scholar] [CrossRef]
- Jeong, S.H.; Kim, K.K.; Jeong, S.J.; An, K.H.; Lee, S.H.; Lee, Y.H. Optical absorption spectroscopy for determining carbon nanotube concentration in solution. Synth. Met. 2007, 157, 570–574. [Google Scholar] [CrossRef]
- Rance, G.A.; Marsh, D.H.; Nicholas, R.J.; Khlobystov, A.N. UV–vis absorption spectroscopy of carbon nanotubes: Relationship between the π-electron plasmon and nanotube diameter. Chem. Phys. Lett. 2010, 493, 19–23. [Google Scholar] [CrossRef]
- Goyanes, S.; Rubiolo, G.R.; Salazar, A.; Jimeno, A.; Corcuera, M.A.; Mondragon, I. Carboxylation treatment of multiwalled carbon nanotubes monitored by infrared and ultraviolet spectroscopies and scanning probe microscopy. Diam. Relat. Mater. 2007, 16, 412–417. [Google Scholar] [CrossRef]
- Karachevtsev, V.A.; Plokhotnichenko, A.M.; Karachevtsev, M.V.; Leontiev, V.S. Decrease of carbon nanotube UV light absorption induced by π–π-stacking interaction with nucleotide bases. Carbon 2010, 48, 3682–3691. [Google Scholar] [CrossRef]
- Salavati-Niasari, M.; Mirsattari, S.N.; Bazarganipour, M. Synthesis, characterization and catalytic oxyfunctionalization of cyclohexene with tert-butylhydroperoxide over a manganese(II) complex covalently anchored to multi-wall carbon nanotubes (MWNTs). Polyhedron 2008, 27, 3653–3661. [Google Scholar] [CrossRef]
- Geng, H.Z.; Lee, D.S.; Kim, K.K.; Han, G.H.; Park, H.K.; Lee, Y.H. Absorption spectroscopy of surfactant-dispersed carbon nanotube film: Modulation of electronic structures. Chem. Phys. Lett. 2008, 455, 275–278. [Google Scholar] [CrossRef]
- Hanelt, S.; Friedrich, J.F.; Orts-Gil, G.; Meyer-Plath, A. Study of Lewis acid catalyzed chemical bromination and bromoalkylation of multi-walled carbon nanotubes. Carbon 2012, 50, 1373–1385. [Google Scholar]
- Khorrampour, R.; Esrafili, M.D.; Hadipour, N.L. Density functional theory study of atomic oxygen, O2 and O3 adsorptions on the H-capped (5,0) single-walled carbon nanotube. Physica E Low Dimens. Syst. Nanostruct. 2009, 41, 1373–1378. [Google Scholar] [CrossRef]
- Shima, H.; Yoshioka, H. Electronic spectral shift of oxygen-filled (6,6) carbon nanotubes. Chem. Phys. Lett. 2011, 513, 224–228. [Google Scholar] [CrossRef]
- Larciprete, R.; Gardonio, S.; Petaccia, L.; Lizzit, S. Atomic oxygen functionalization of double walled C nanotubes. Carbon 2009, 47, 2579–2589. [Google Scholar] [CrossRef]
- Kawai, T.; Miyamoto, Y. Chirality-dependent C–C bond breaking of carbon nanotubes by cyclo-addition of oxygen molecule. Chem. Phys. Lett. 2008, 453, 256–261. [Google Scholar] [CrossRef]
- Rafati, A.A.; Hashemianzadeh, S.M.; Nojini, Z.B. Effect of the adsorption of oxygen on electronic structures and geometrical parameters of armchair single-wall carbon nanotubes: A density functional study. J. Colloid. Interface Sci. 2009, 336, 1–12. [Google Scholar] [CrossRef] [PubMed]
- Grujicic, M.; Cao, G.; Singh, R. The effect of topological defects and oxygen adsorption on the electronic transport properties of single-walled carbon-nanotubes. Appl. Surf. Sci. 2003, 211, 166–183. [Google Scholar] [CrossRef]
- Ulbricht, H.; Moos, G.; Hertel, T. Interaction of molecular oxygen with single-wall carbon nanotube bundles and graphite. Surf. Sci. 2003, 532–535, 852–856. [Google Scholar] [CrossRef]
- Barberio, M.; Barone, P.; Bonanno, A.; Xu, F. Oxygen interaction with single-walled carbon nanotubes. Superlatt. Microstruct. 2009, 46, 365–368. [Google Scholar] [CrossRef]
- Fenoglio, I.; Tomatis, M.; Lison, D.; Muller, J.; Fonseca, A.; Nagy, J.B.; Fubini, B. Reactivity of carbon nanotubes: Free radical generation or scavenging activity? Free Radic. Biol. Med. 2006, 40, 1227–1233. [Google Scholar] [CrossRef] [PubMed]
- Grujicic, M.; Cao, G.; Rao, A.M.; Tritt, T.M.; Nayak, S. UV-light enhanced oxidation of carbon nanotubes. Appl. Surf. Sci. 2003, 214, 289–303. [Google Scholar] [CrossRef]
- Krüger, A. Neue Kohlenstoffmaterialien: Eine Einführung; B.G. Teubner Verlag: Wiesbaden, Germany, 2007; p. 261. [Google Scholar]
- Barpanda, P.; Fanchini, G.; Amatucci, G.G. Structure, surface morphology and electrochemical properties of brominated activated carbons. Carbon 2011, 49, 2538–2548. [Google Scholar] [CrossRef]
- Jhi, S.H.; Louie, S.G.; Cohen, M.L. Electronic properties of bromine-doped carbon nanotubes. Solid State Commun. 2002, 123, 495–499. [Google Scholar] [CrossRef]
- Park, N.; Miyamoto, Y.; Lee, K.; Choi, W.I.; Ihm, J.; Yu, J.; Han, S. Band gap sensitivity of bromine adsorption at carbon nanotubes. Chem. Phys. Lett. 2005, 403, 135–139. [Google Scholar] [CrossRef]
- Shen, J.; Duvnjak, Z. Adsorption kinetics of cupric and cadmium ions on corncob particles. Process Biochem. 2005, 40, 3446–3454. [Google Scholar] [CrossRef]
- Kuo, C.Y.; Wu, C.H.; Wu, J.Y. Adsorption of direct dyes from aqueous solutions by carbon nanotubes: Determination of equilibrium, kinetics and thermodynamics parameters. J. Colloid Interface Sci. 2008, 327, 308–315. [Google Scholar] [CrossRef] [PubMed]
- Wu, C.H. Adsorption of reactive dye onto carbon nanotubes: Equilibrium, kinetics and thermodynamics. J. Hazard. Mater. 2007, 144, 93–100. [Google Scholar] [CrossRef] [PubMed]
- Mysels, K.J. Diffusion-Controlled Adsorption Kinetics. General Solution and Some Applications. J. Phys. Chem. 1982, 86, 4648–4651. [Google Scholar]
- Kabbashi, N.A.; Atieh, M.A.; Al-Mamun, A.; Mirghami, M.E.S.; Alam, M.D.Z.; Yahya, N. Kinetic adsorption of application of carbon nanotubes for Pb(II) removal from aqueous solution. J. Environ. Sci. 2009, 21, 539–544. [Google Scholar] [CrossRef]
- Kalavathy, M.H.; Karthikeyan, T.; Rajgopla, S.; Miranda, L.R. Kinetic and isotherm studies of Cu(II) adsorption onto H3PO4-activated rubber wood sawdust. J. Colloid Interface Sci. 2005, 292, 354–362. [Google Scholar] [CrossRef] [PubMed]
© 2013 by the authors; licensee MDPI, Basel, Switzerland. This article is an open access article distributed under the terms and conditions of the Creative Commons Attribution license (http://creativecommons.org/licenses/by/3.0/).
Share and Cite
Hanelt, S.; Friedrich, J.F.; Meyer-Plath, A. UV Spectrometric Indirect Analysis of Brominated MWCNTs with UV Active Thiols and an Alkene—Reaction Kinetics, Quantification and Differentiation of Adsorbed Bromine and Oxygen. Materials 2013, 6, 3035-3063. https://doi.org/10.3390/ma6083035
Hanelt S, Friedrich JF, Meyer-Plath A. UV Spectrometric Indirect Analysis of Brominated MWCNTs with UV Active Thiols and an Alkene—Reaction Kinetics, Quantification and Differentiation of Adsorbed Bromine and Oxygen. Materials. 2013; 6(8):3035-3063. https://doi.org/10.3390/ma6083035
Chicago/Turabian StyleHanelt, Sven, Jörg F. Friedrich, and Asmus Meyer-Plath. 2013. "UV Spectrometric Indirect Analysis of Brominated MWCNTs with UV Active Thiols and an Alkene—Reaction Kinetics, Quantification and Differentiation of Adsorbed Bromine and Oxygen" Materials 6, no. 8: 3035-3063. https://doi.org/10.3390/ma6083035