Early Combination of Material Characteristics and Toxicology Is Useful in the Design of Low Toxicity Carbon Nanofiber

Abstract
:1. Introduction
2. Results and Discussion
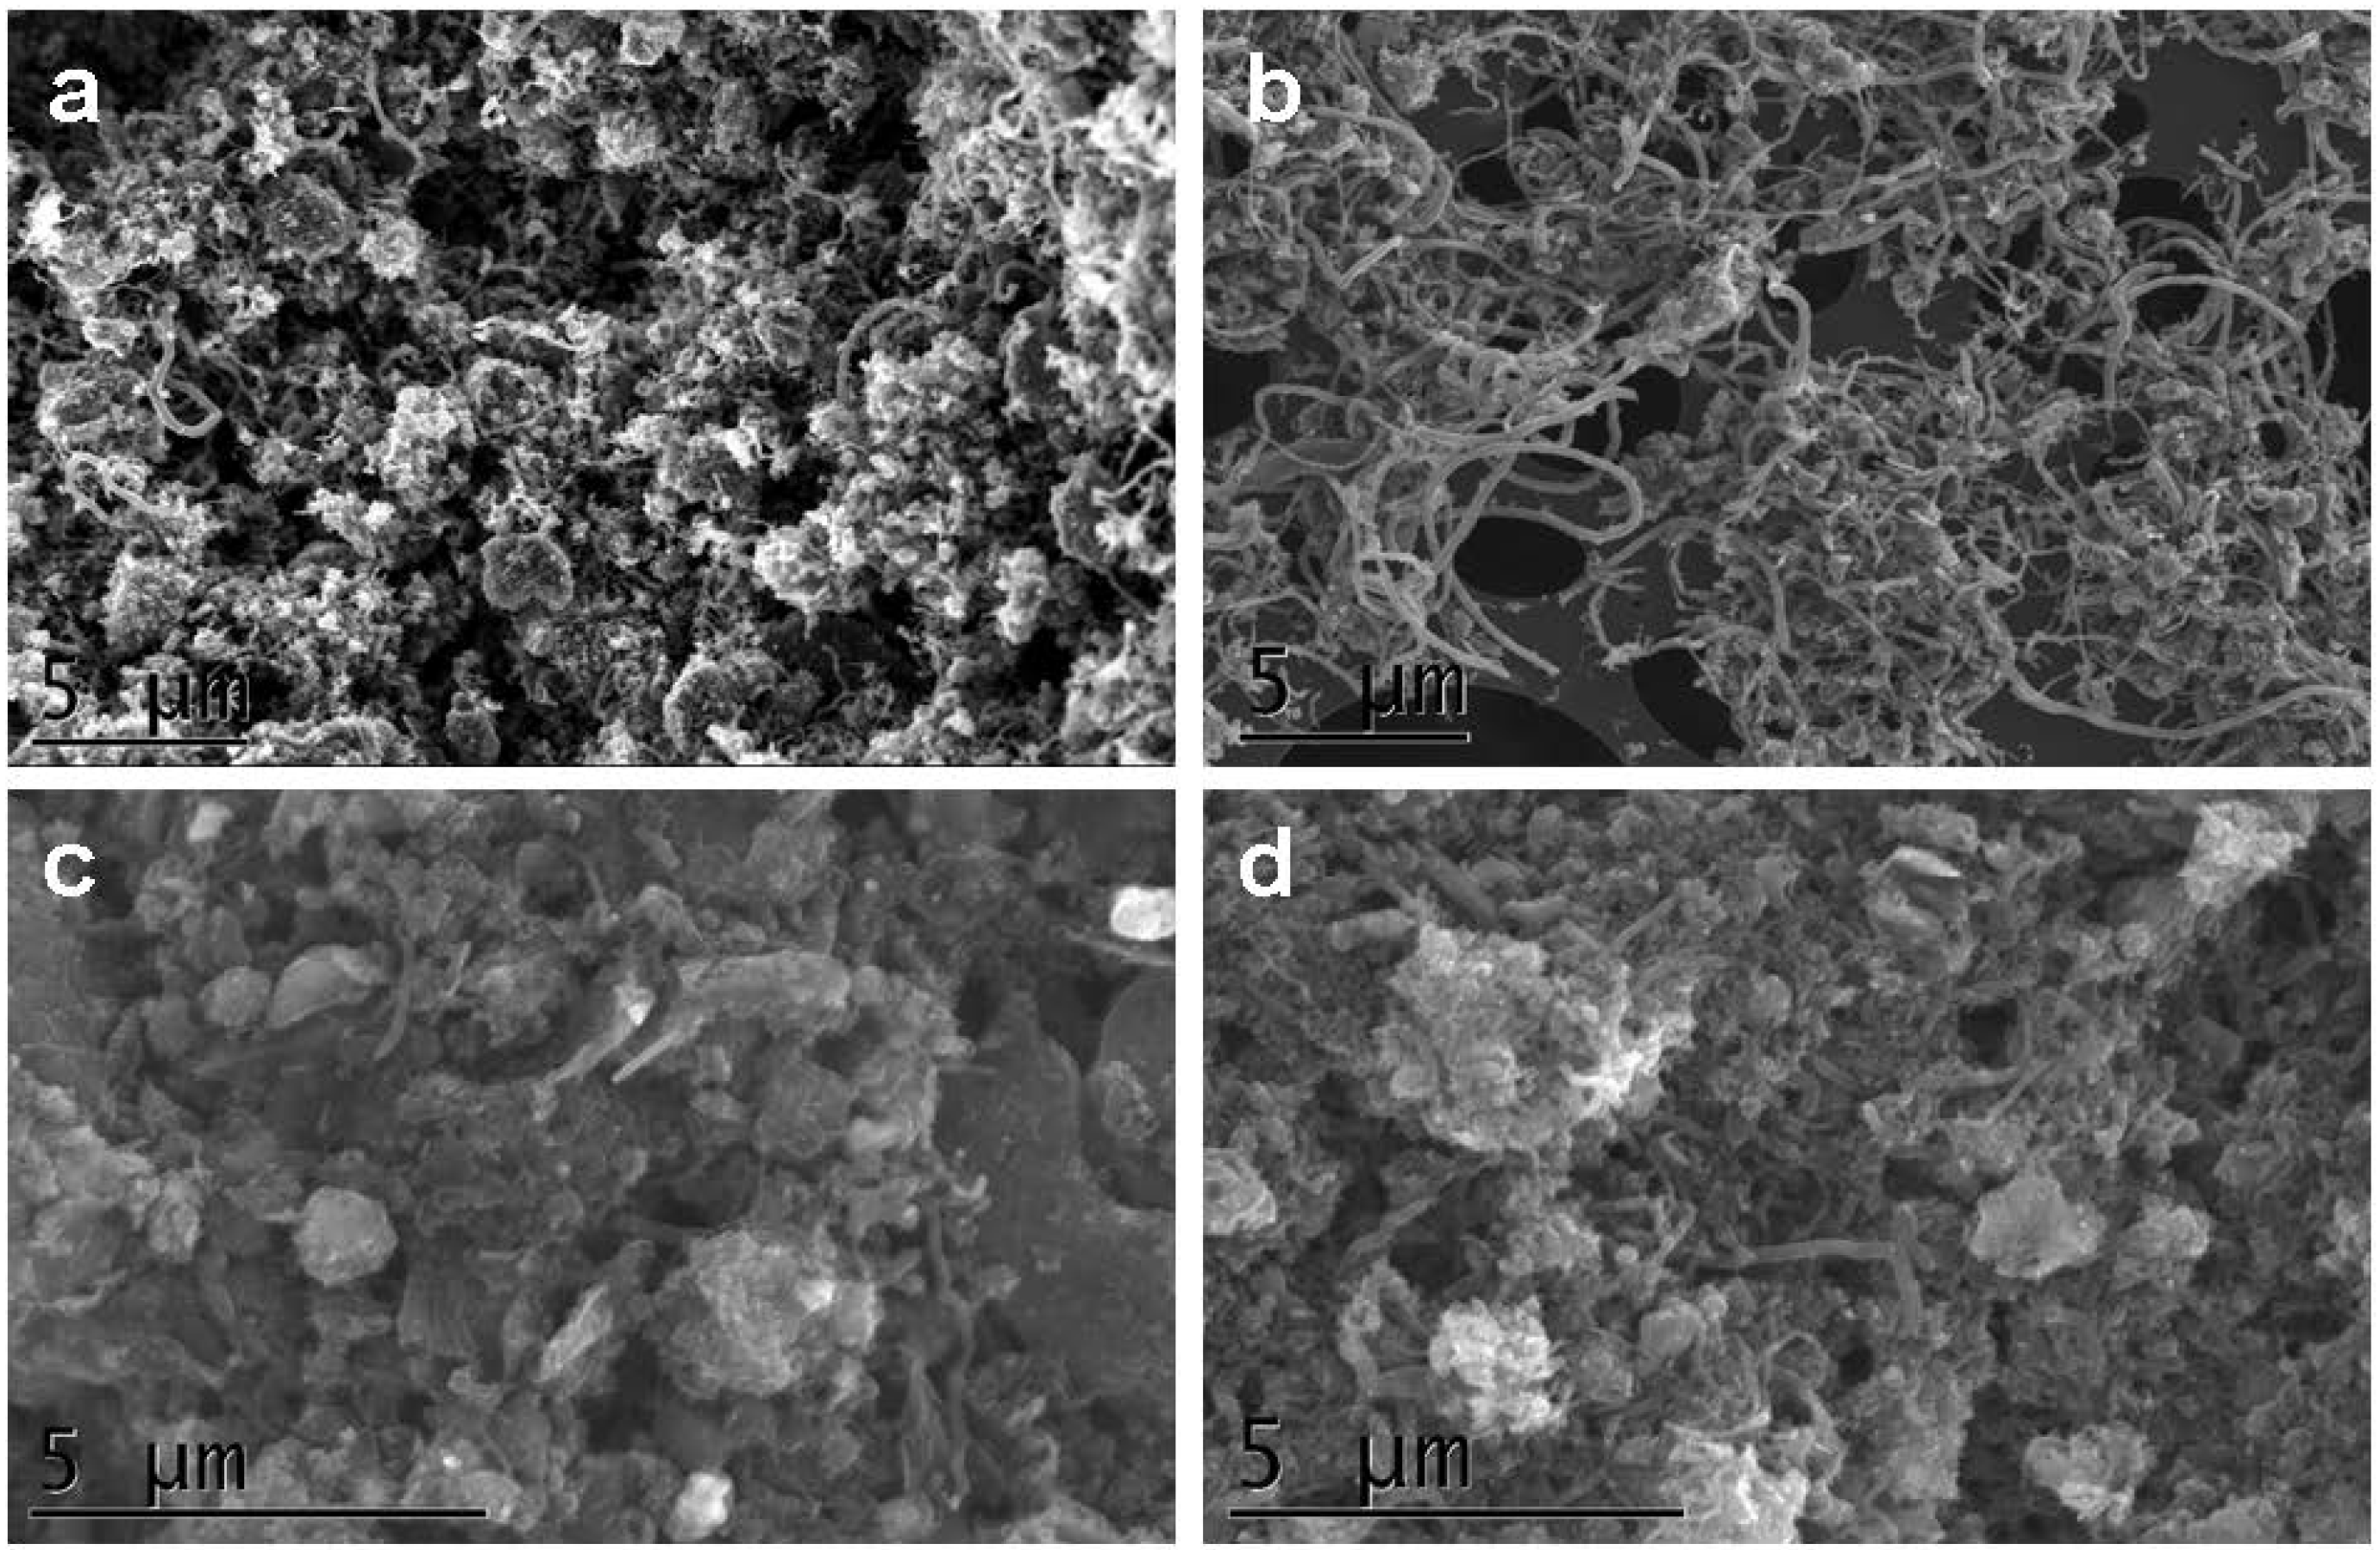
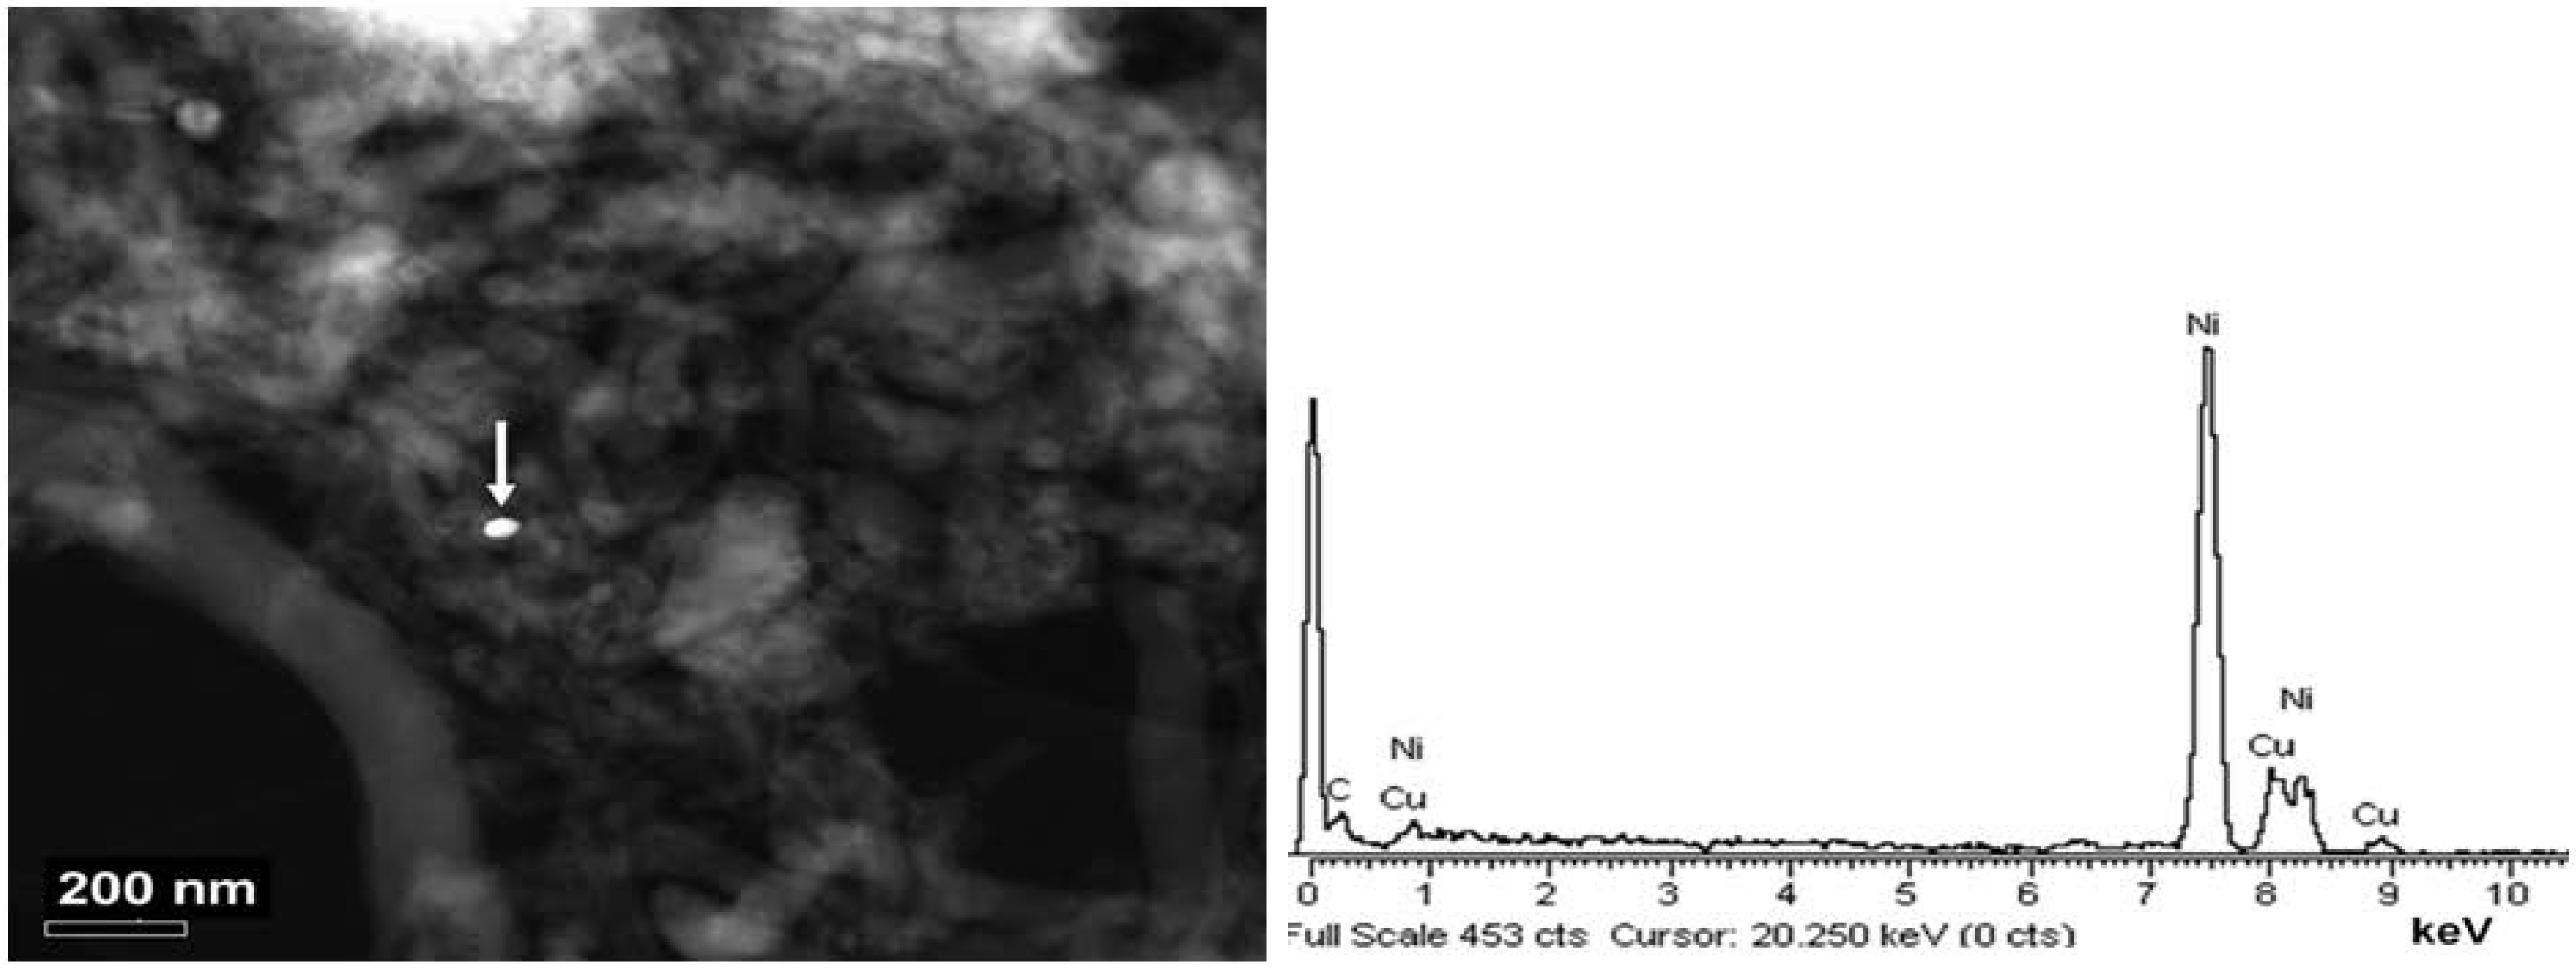
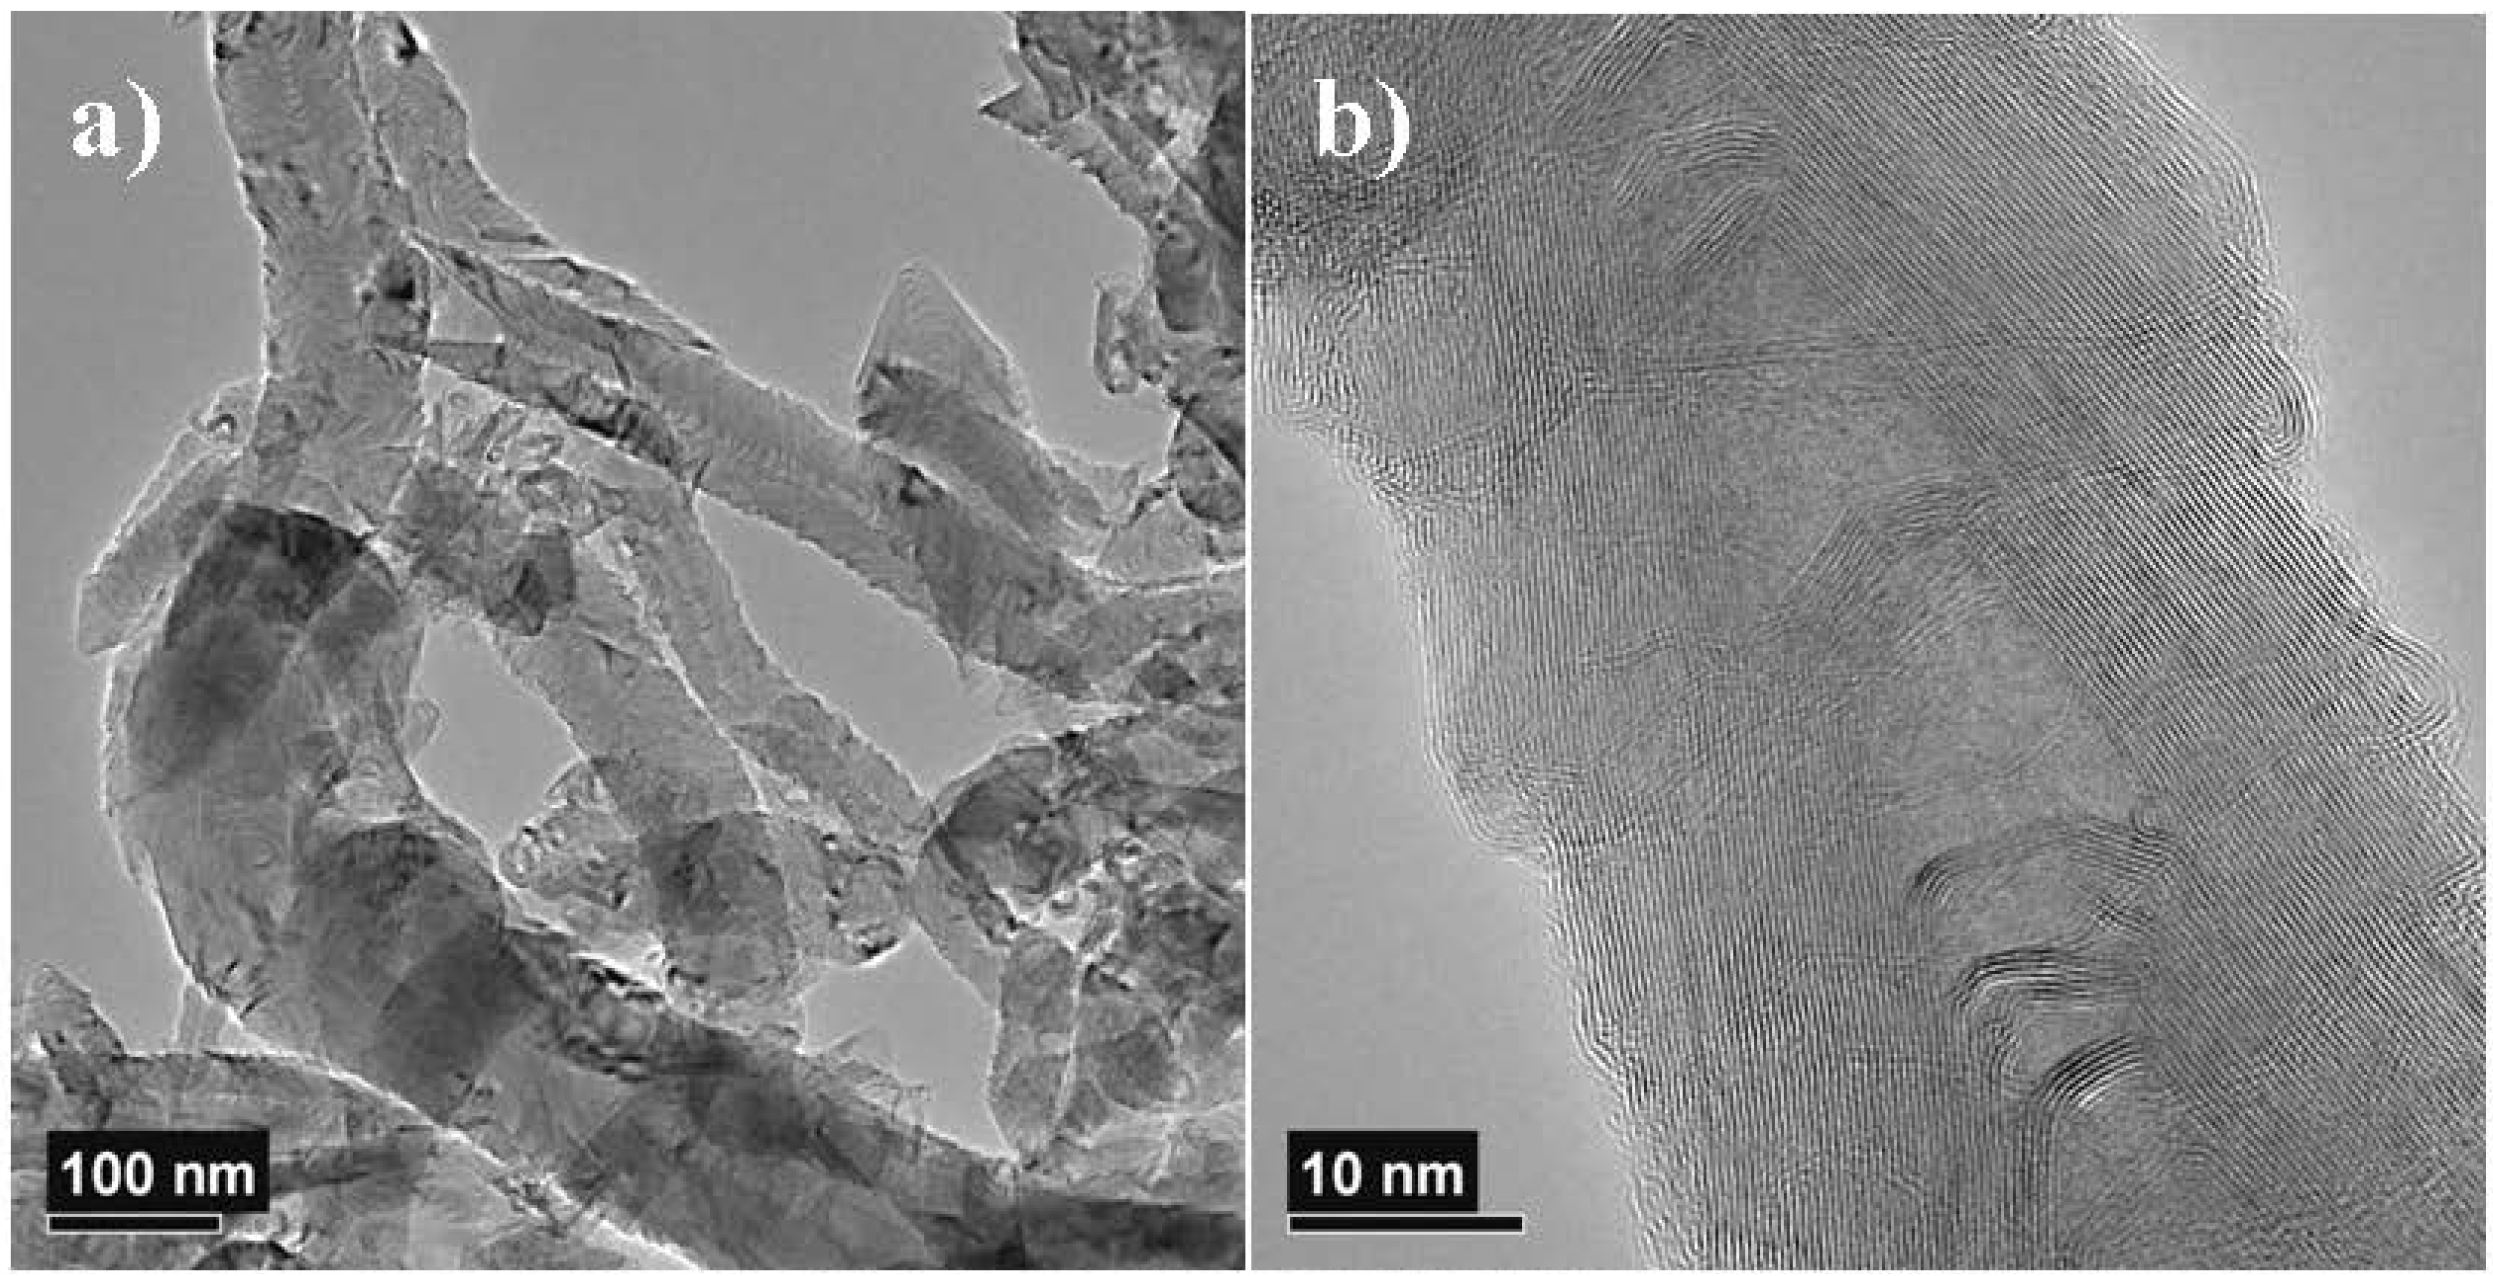
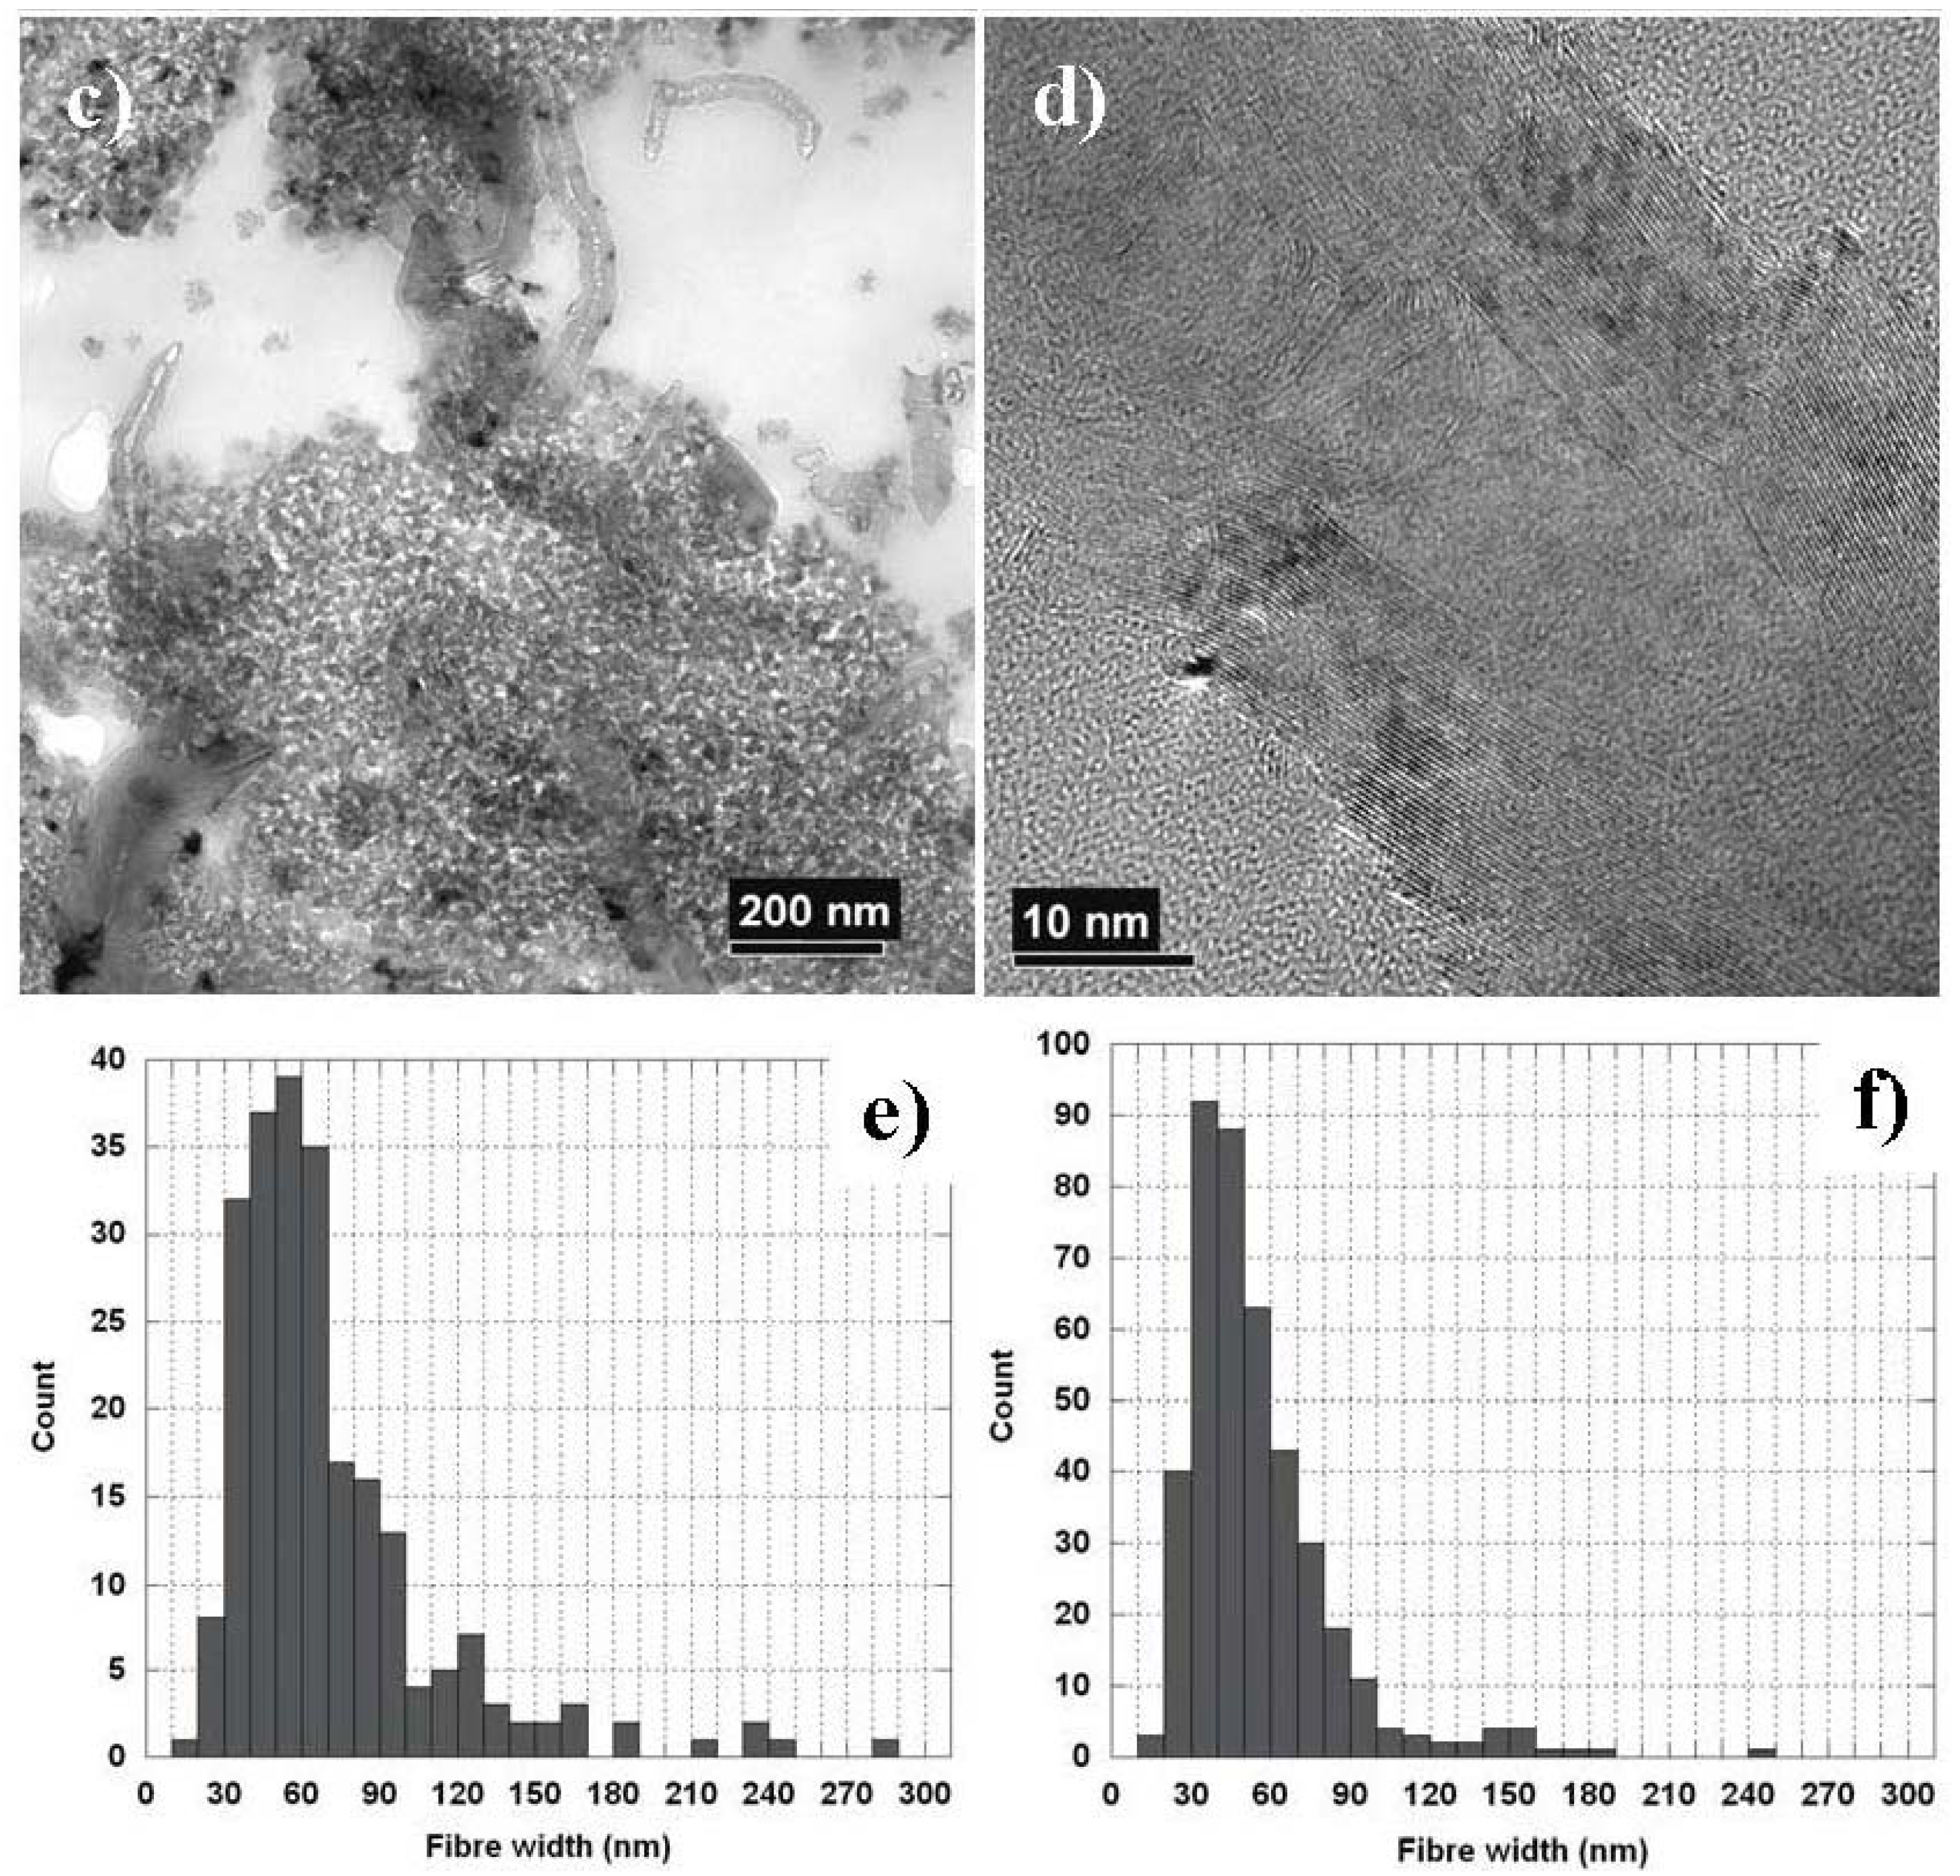
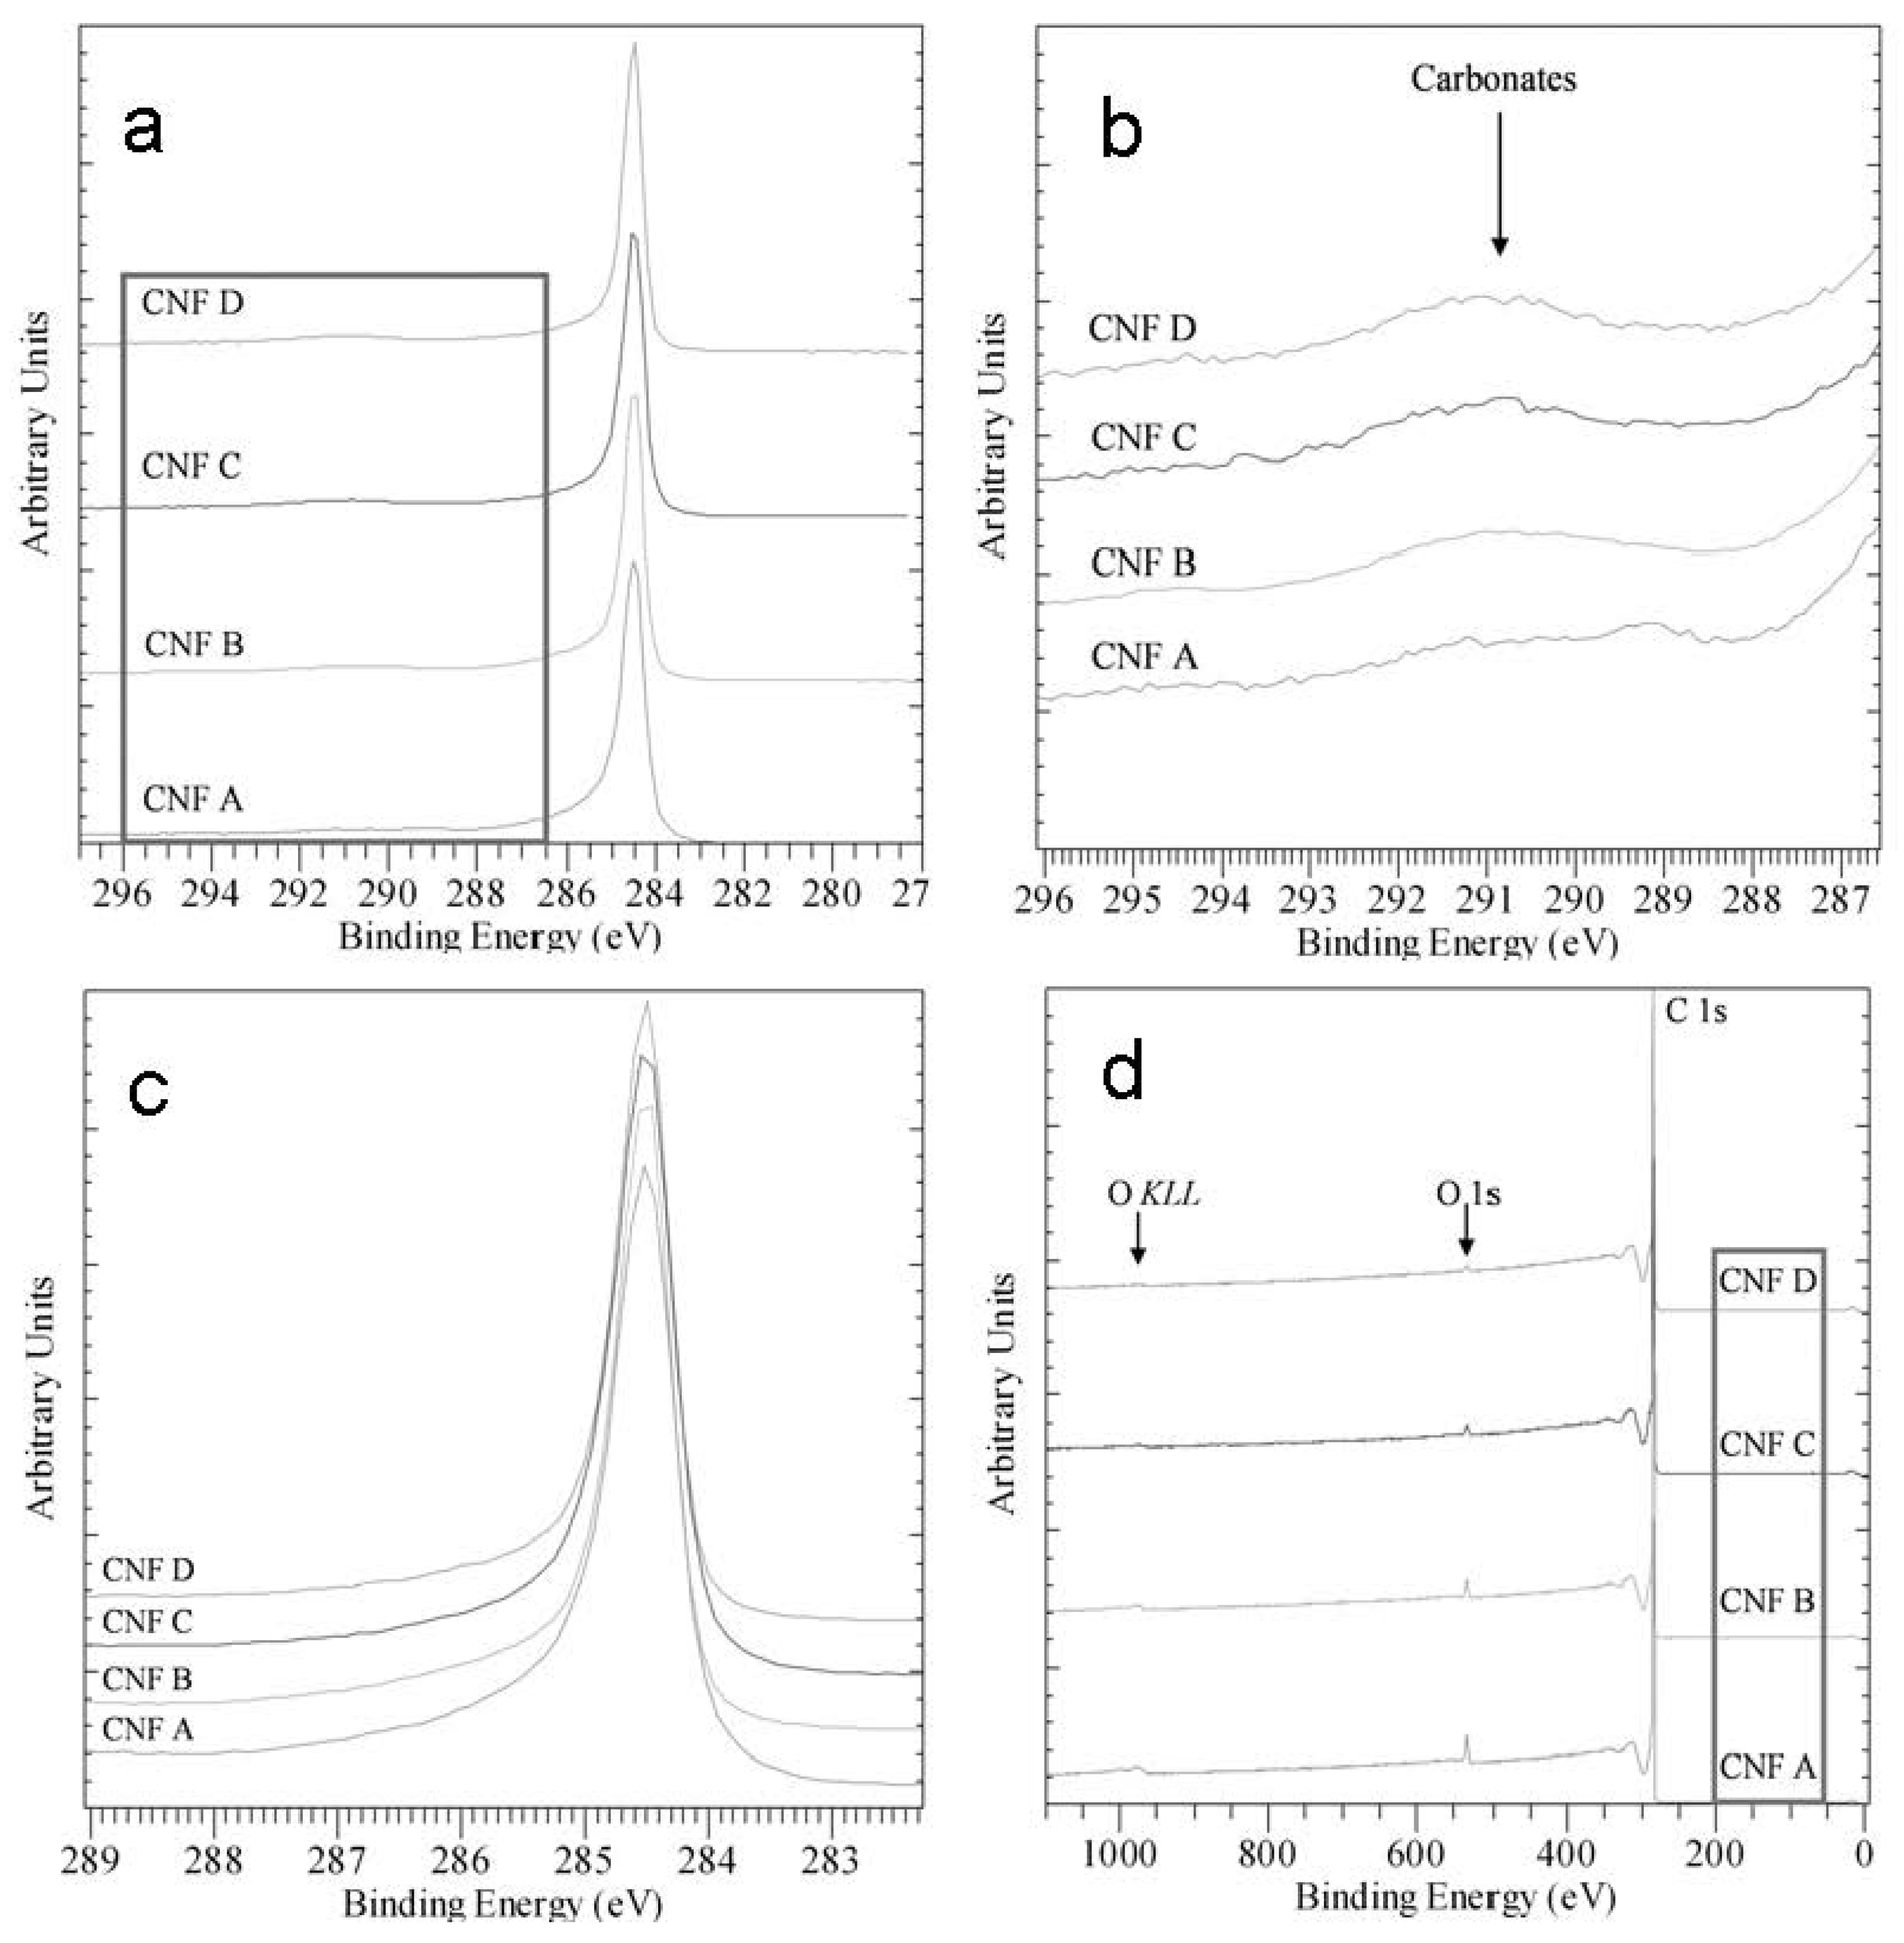
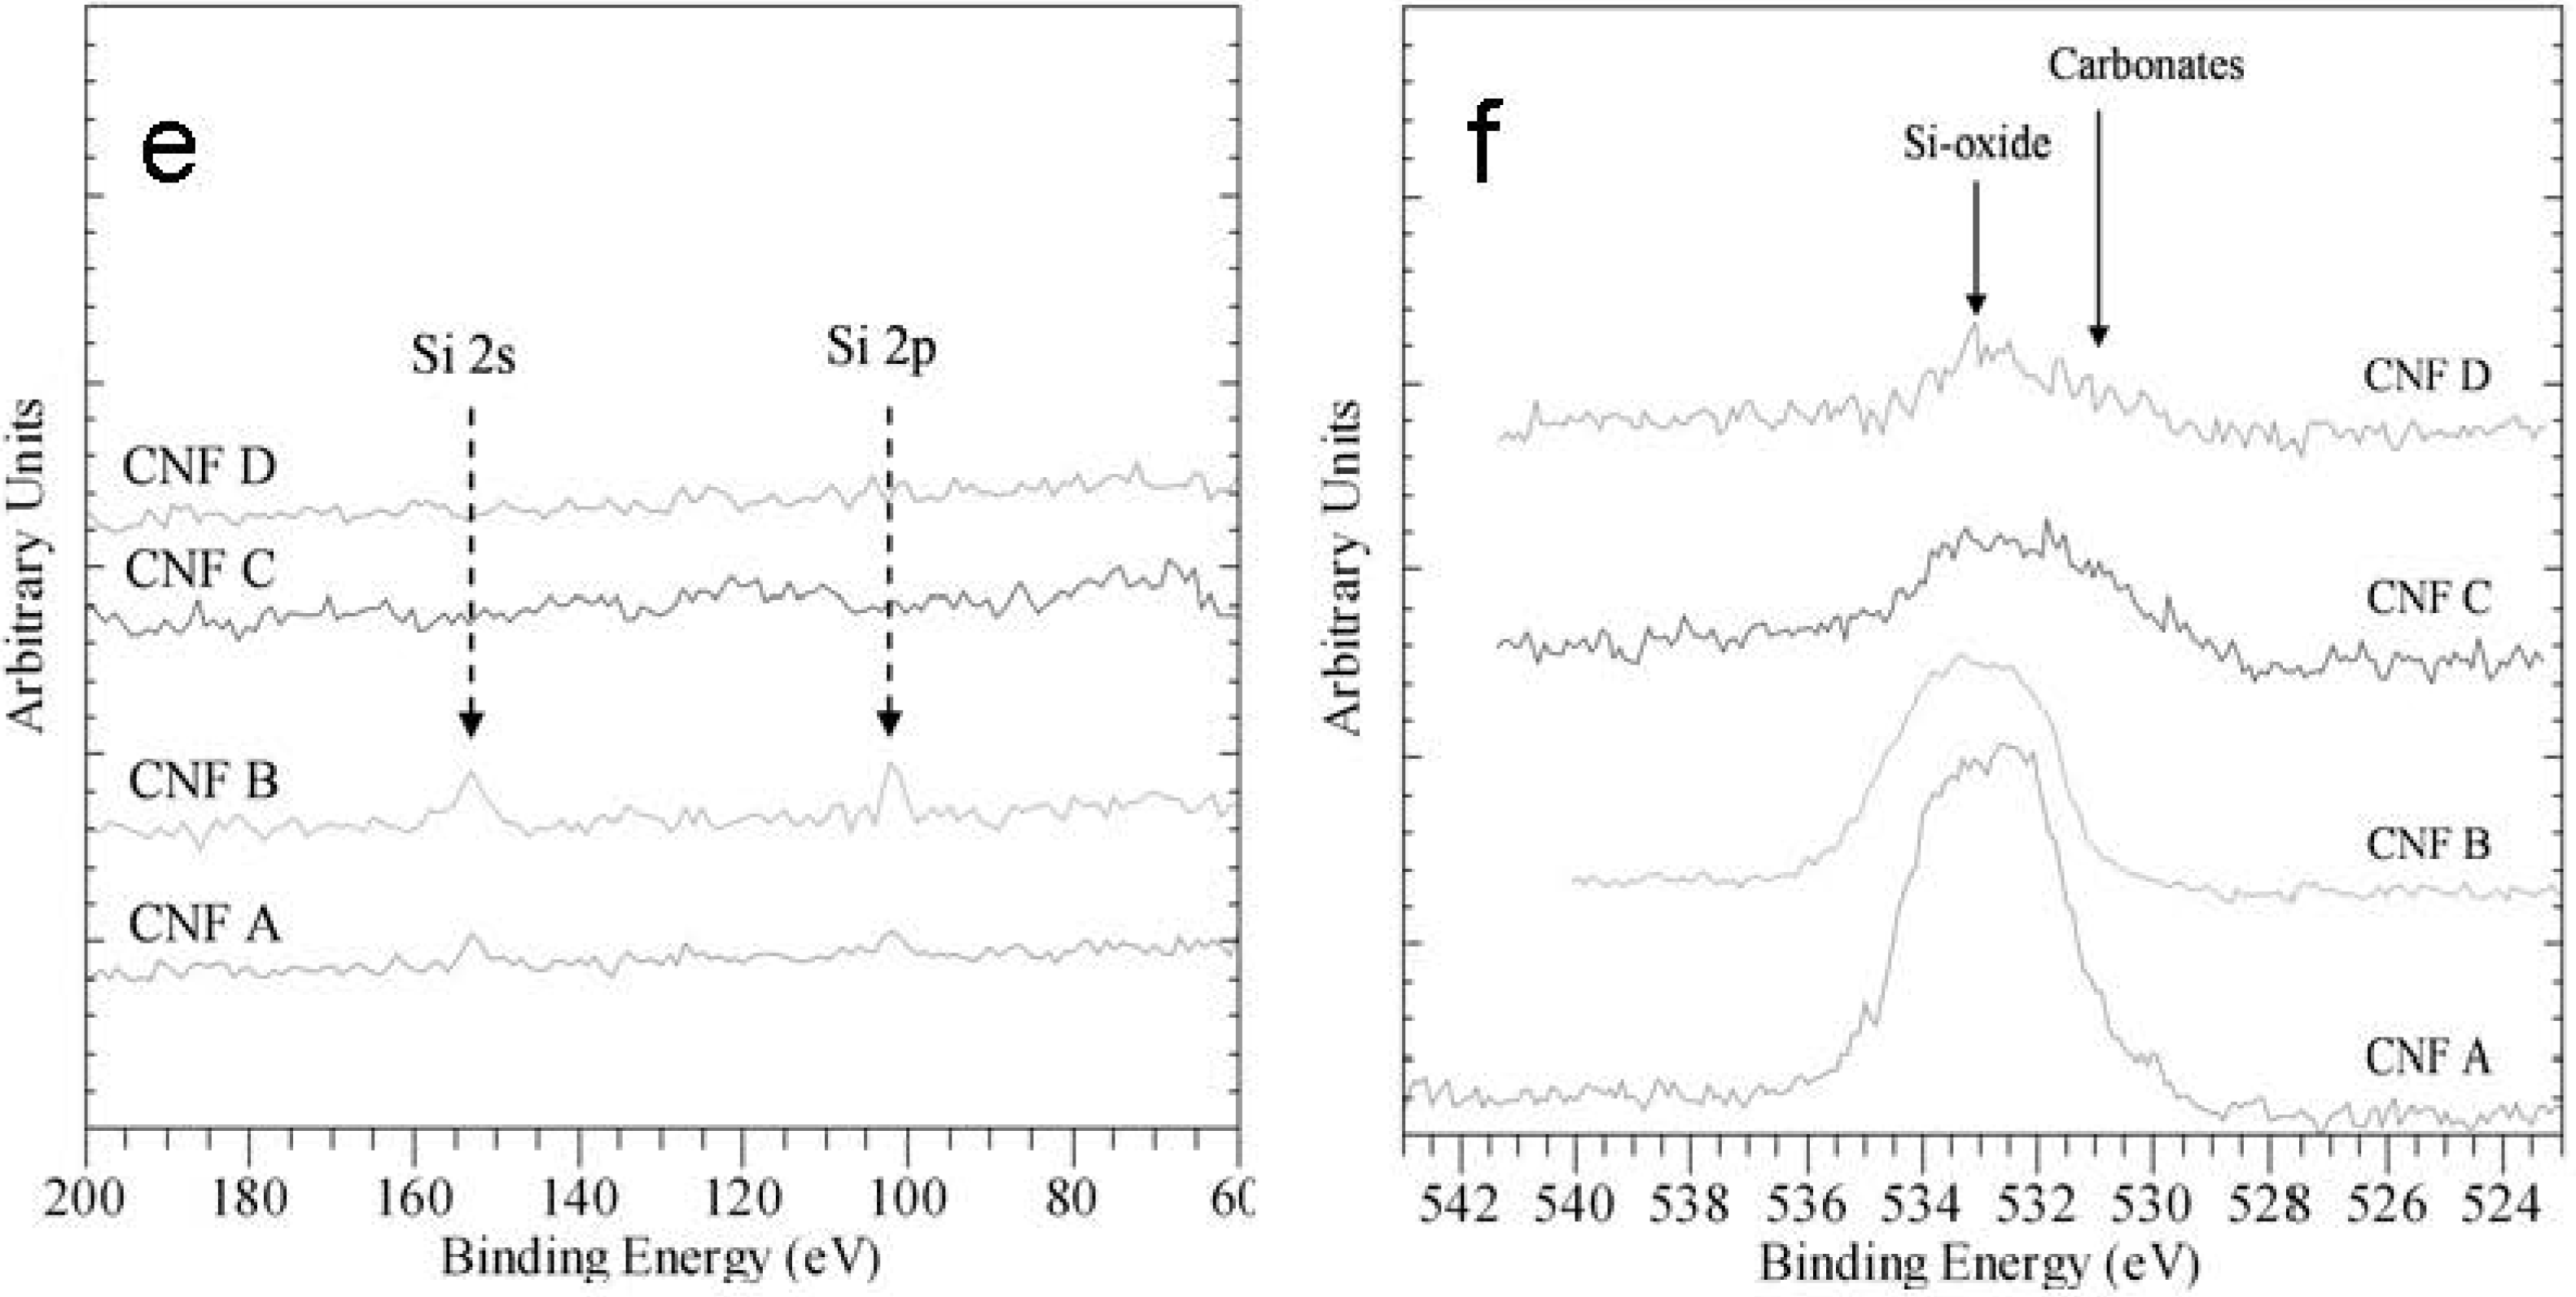
2.1. Material Characterization

| Name | Thermal Treatment | Surface * (m2/g) | D90 ** (µm) | D50 ** (µm) | D10 ** (µm) | S (%) | N (%) | Fe (%) | Si (%) | Ni (%) | P (ppm) | B (ppm) |
|---|---|---|---|---|---|---|---|---|---|---|---|---|
| CNF A | no | 103 | 2.2 | 1.6 | 0.7 | <0.010 | 0.017 | 0.008 | 0.020 | 1.29 | 5.0 | 0.7 |
| CNF B | yes | 61 | 2.2 | 1.9 | 1.6 | <0.010 | 0.016 | 0.023 | 0.012 | 0.070 | 3.8 | 2.0 |
| CNF C | no | 124 | 2.6 | 1.7 | 0.8 | 0.095 | 0.037 | 0.148 | 0.056 | 4.97 | 8.1 | 7.6 |
| CNF D | yes | 56 | 2.5 | 1.5 | 0.6 | <0.010 | 0.012 | 0.002 | 0.004 | 0.036 | 0.3 | 0.3 |
| CB | no | 321 | 6.9 | 3.2 | 1.3 | 0.45 | 0.121 | 0.003 | <0.03 | <0.0003 | 1.1 | <1.0 |


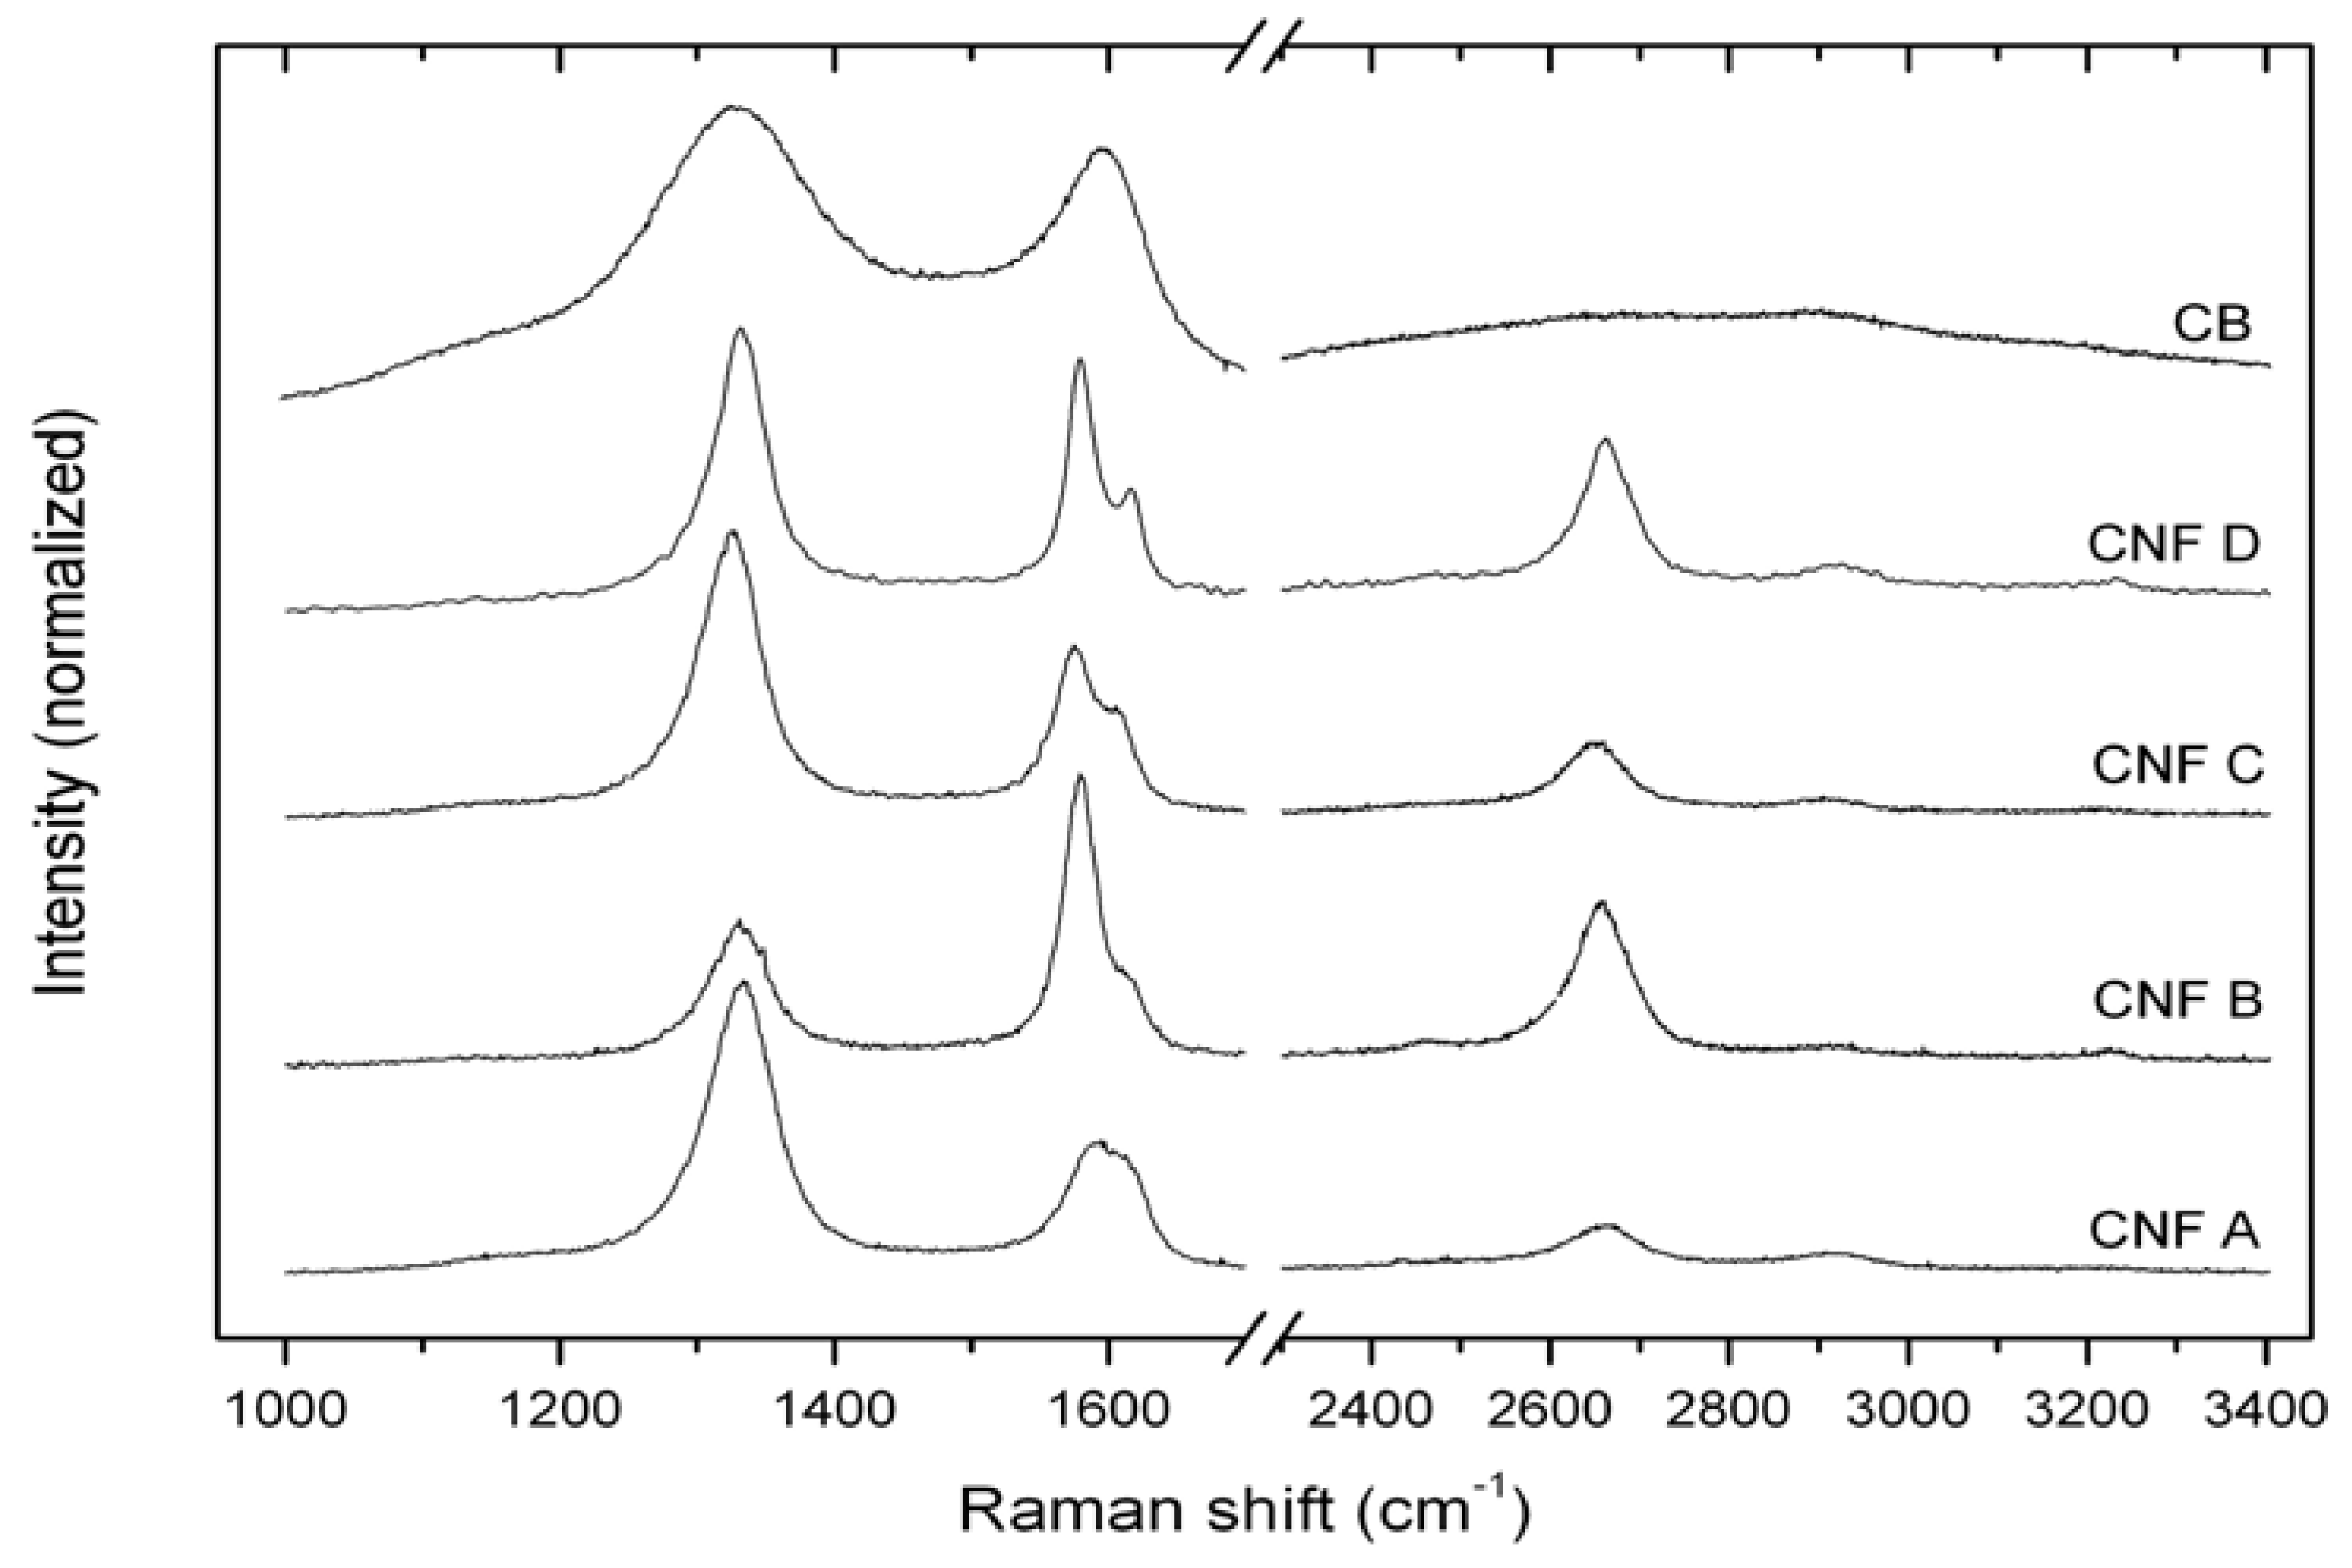
| Name | First order lines | Second order lines | |||||
|---|---|---|---|---|---|---|---|
| ΔνD (cm−1) | ΔνG (cm−1) | R = ID/IG | L1 (nm) | ASA (m2/g) | ΔνD (cm−1) | R’ = I2D/IG | |
| CNF A | 58 | 42 | 2.6 | 3.2 | 27.1 | 103 | 0.4 |
| CNF B | 53 | 29 | 0.5 | 17.2 | 1.6 | 74 | 0.5 |
| CNF C | 53 | 34 | 1.8 | 4.5 | 15.2 | 85 | 0.4 |
| CNF D | 47 | 24 | 1.2 | 7.0 | 7.4 | 69 | 0.6 |
| CB | 147 | 80 | 1.5 | 5.4 | 11.4 | 314 | 0.2 |


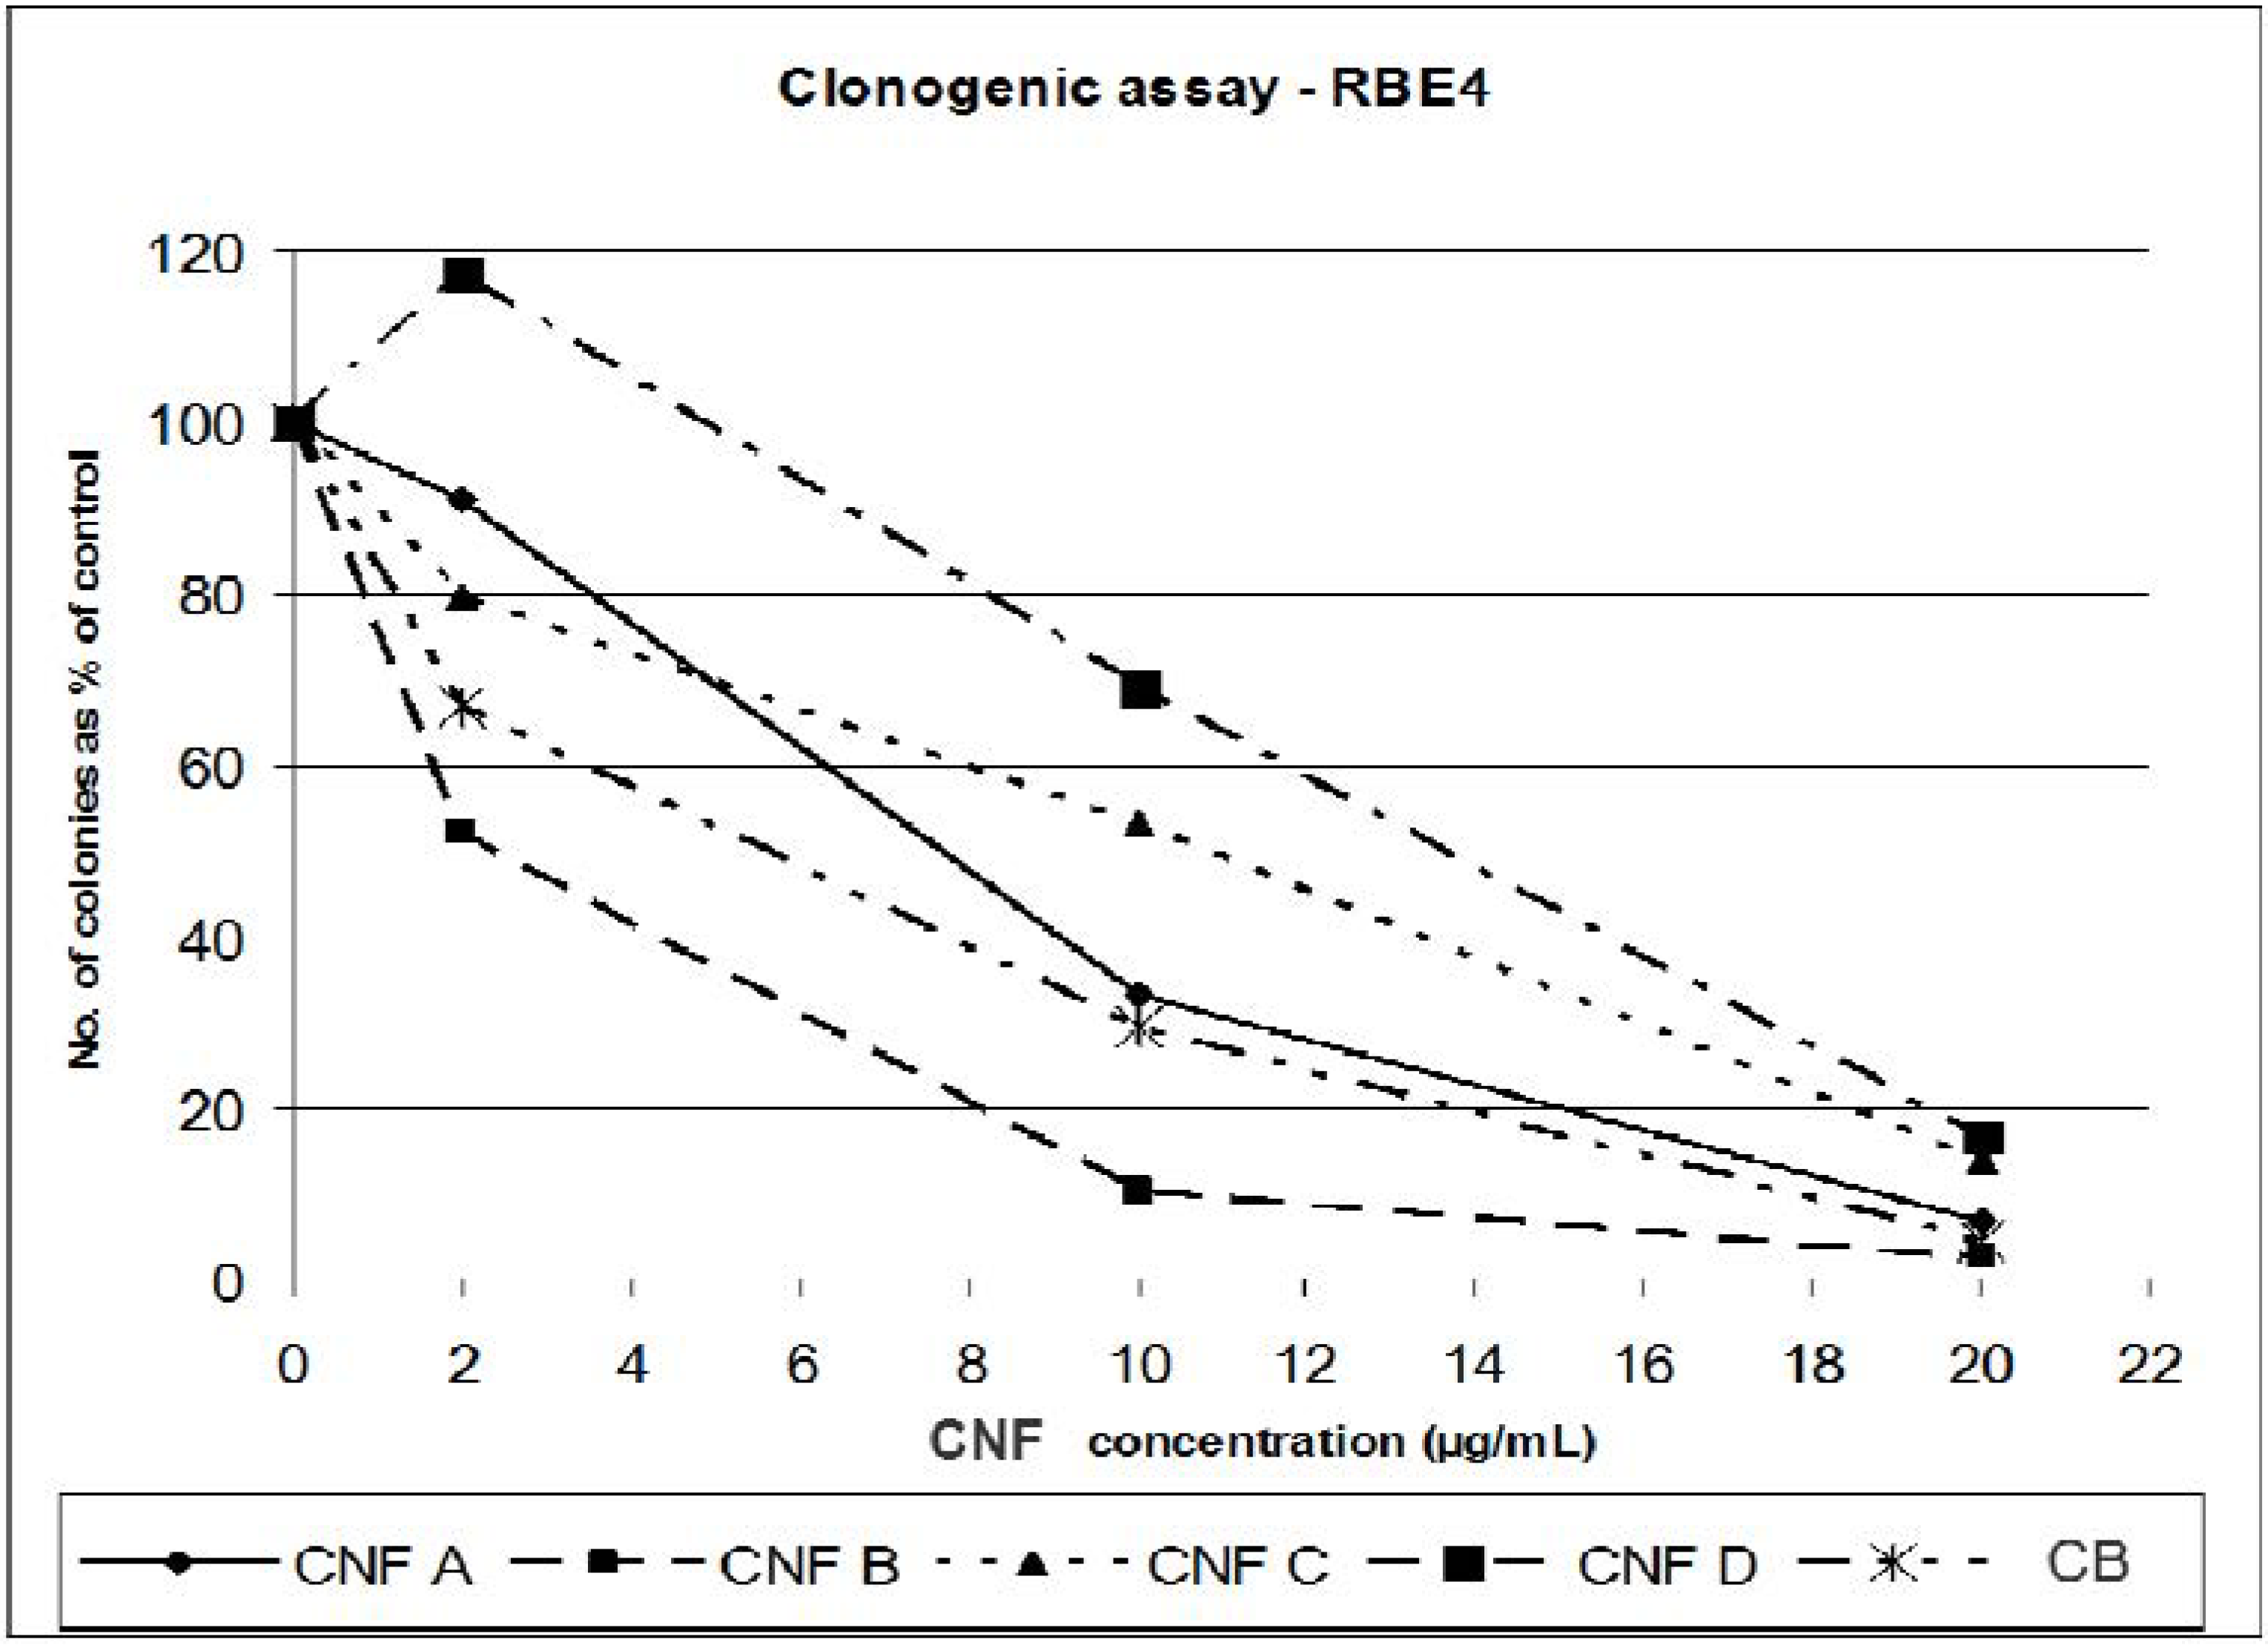
2.2. In Vitro Toxicity Tests

| Sample | Control | 1 (µg/mL) | 10 (µg/mL) | 20 (µg/mL) | ||||
|---|---|---|---|---|---|---|---|---|
| Mean | SD | Mean | SD | Mean | SD | Mean | SD | |
| CNF A | 64 | 11.3 | 59 | 4.9 | 21 | 5.0 | 4 | 1.5 |
| CNF B | 59 | 10.6 | 31 | 14.0 | 6 | 1.7 | 1 | 1.0 |
| CNF C | 59 | 10.6 | 47 | 10.5 | 31 | 3.8 | 8 | 2.5 |
| CNF D | 62 | 11.4 | 73 | 12.7 | 43 | 10.8 | 10 | 2.3 |
| CB | 59 | 10.6 | 39 | 7.8 | 17 | 4.5 | 3 | 2.3 |
| Name | EC50 (µg/mL) |
|---|---|
| CNF A | 7.6 |
| CNF B | 2.5 |
| CNF C | 10.9 |
| CNF D | 13.8 |
| CB | 6.6 |
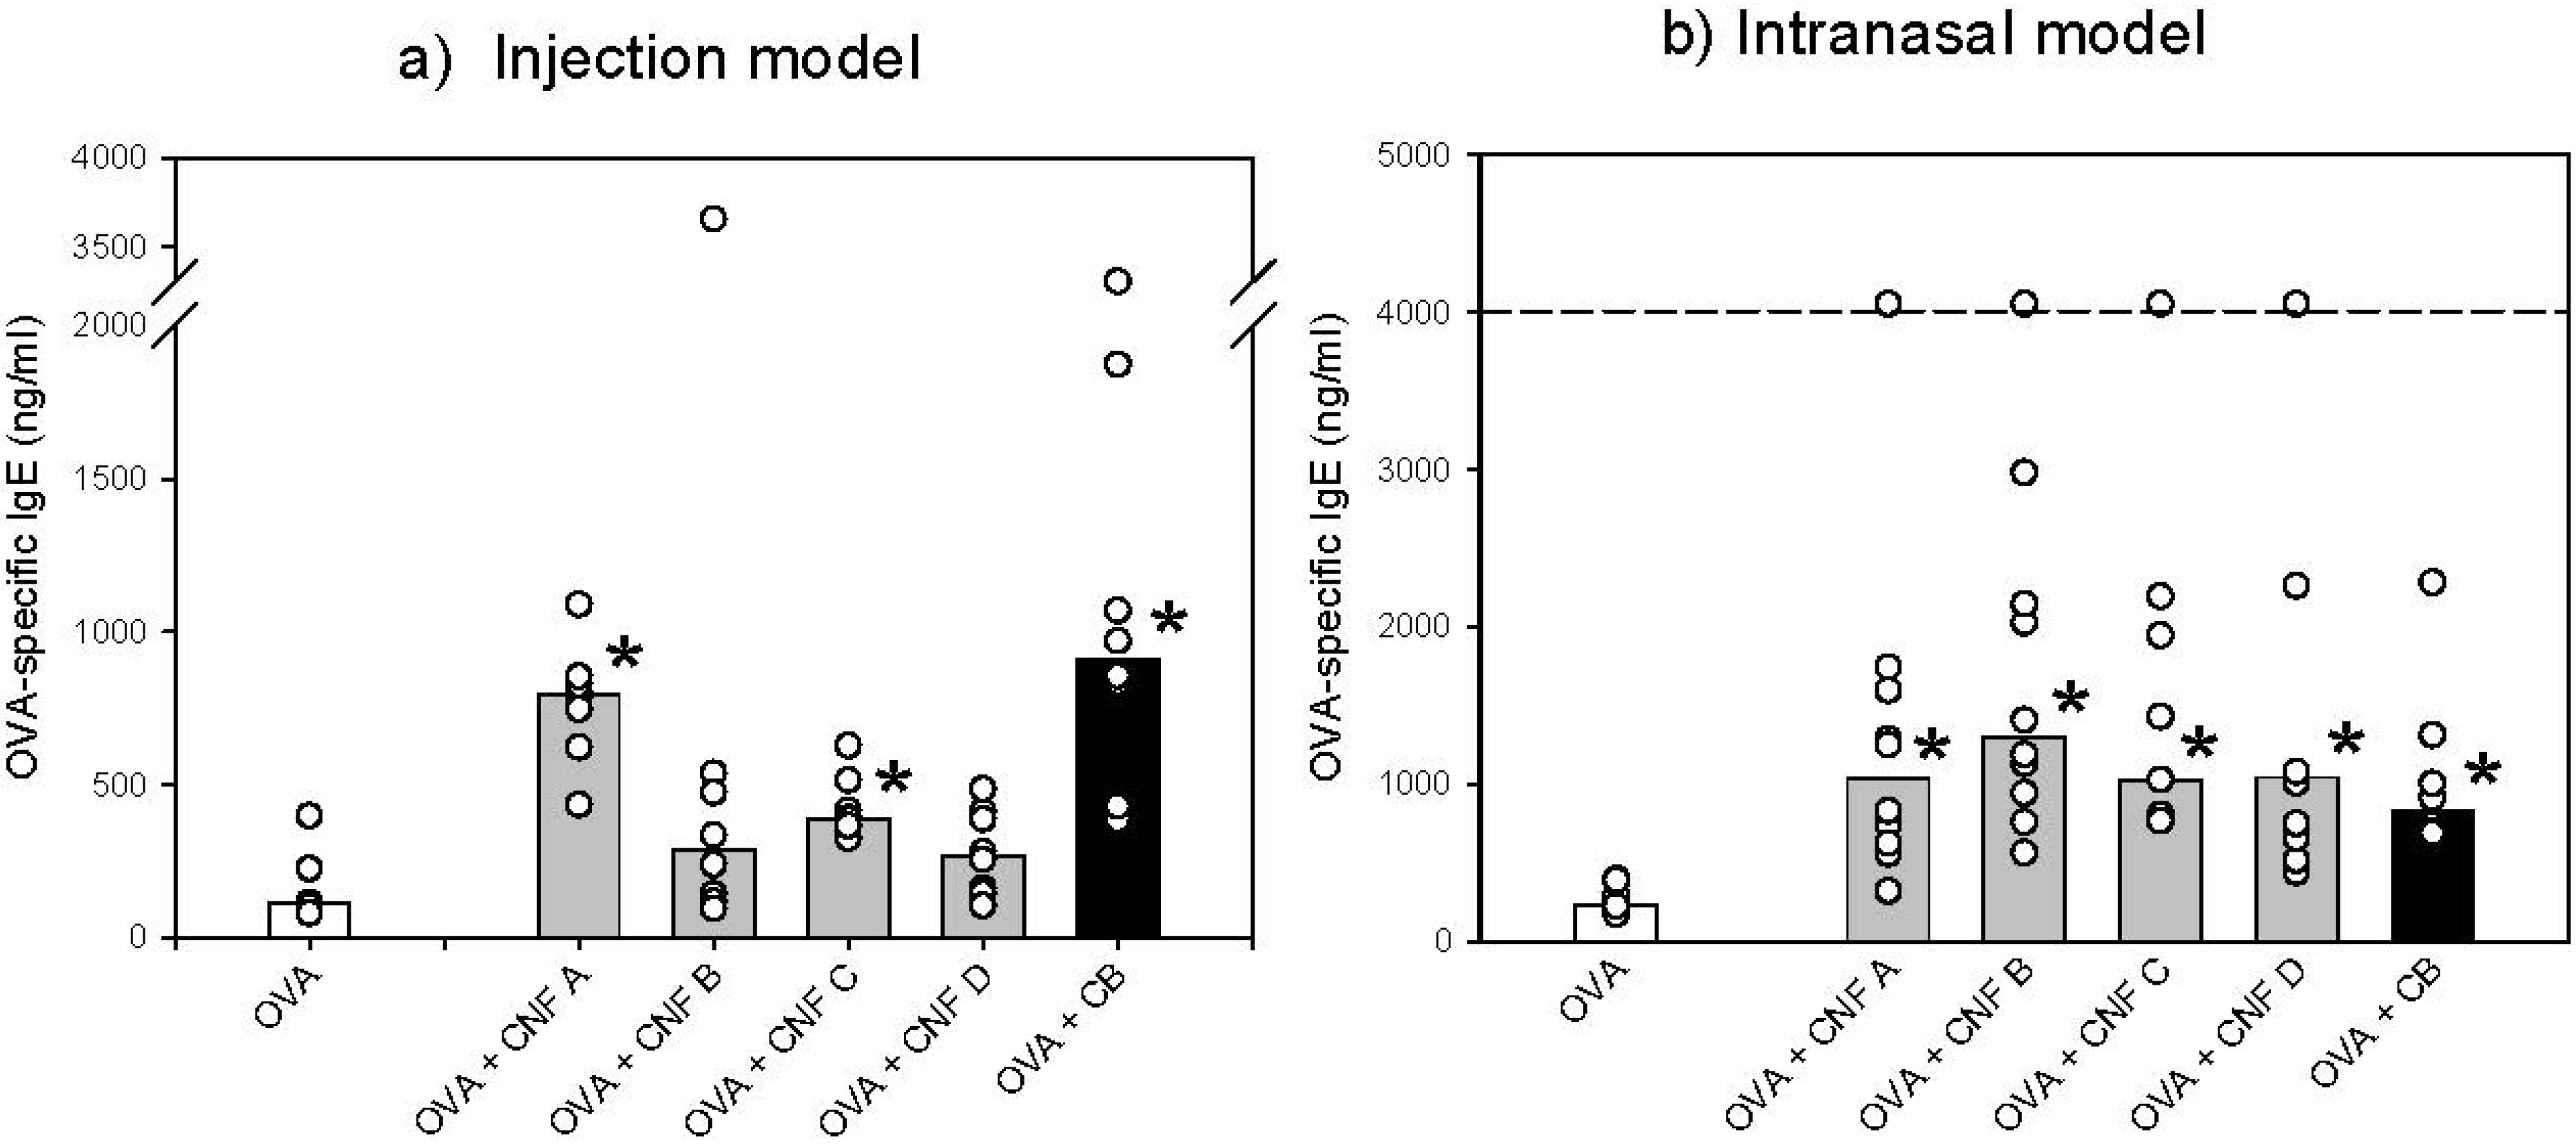
2.3. In Vivo Toxicity Test

2.4. Suitability of the Methods
3. Experimental Section
3.1. Materials
3.2. Preparation of Powdered CNF Sample
3.3. Material Characterization
3.3.1. Chemical Composition
3.3.2. Size Distribution
3.3.3. Surface Area
3.3.4. Scanning and Transmission Electron Microscopy
3.3.5. Raman Spectroscopy
3.3.6. Surface Chemistry
3.4. In Vitro Toxicity Tests
3.4.1. Sample Suspension
3.4.2. Cell Cultures
3.4.3. Cytotoxity Evaluation
3.5. In Vivo Toxicity Tests
3.5.1. Sample Suspension
3.5.2. Animals
3.5.3. The Footpad Injection Model
3.5.4. The Intranasal Model
4. Conclusions
Acknowledgments
References
- Oberdörster, G.; Oberdörster, E.; Oberdörster, J. Nanotoxicology and emerging discipline evolving from studies of ultrafine particles. Environ. Health Perspect. 2005, 113, 823–839. [Google Scholar] [CrossRef] [PubMed]
- Aitken, R.J.; Creely, K.S.; Tran, C.L. Nanoparticles: An Occupational Hygiene Review; Health and Safety Executive Research report 274, ISBN 0 7176 2908 2; Health and Safety Executive: Liverpool, UK, 2004. [Google Scholar]
- Oberdörster, G.; Maynard, A.; Donaldson, K.; Castranova, V.; Fitzpatrick, J.; Ausman, K.; Carter, J.; Karn, B.; Kreyling, W.; Lai, D.; Olin, S.; Monteiro-Riviere, N.; Warheit, D.; Yang, H. Principles for characterizing the potential human health effects from exposure to nanomaterials: Elements of a screening strategy. Part. Fibre Toxicol. 2005, 2. [Google Scholar] [CrossRef]
- Maynard, A.D.; Baron, P.A.; Foley, M.; Shvedova, A.A.; Kisin, E.R.; Castranova, V. Exposure to carbon nanotube material: Aerosol release during the handling of unrefined single-walled carbon nanotube material. J. Toxicol. Environ. Health A 2004, 67, 87–107. [Google Scholar] [CrossRef]
- Brown, D.M.; Kinloch, I.A.; Bangert, U.; Windle, A.H.; Walter, D.M.; Walker, G.S.; Scotchford, C.A.; Donaldson, K.; Stone, V. An in vitro study of the potential of carbon nanotubes and nanofibers to induce inflammatory mediators and frustrated phagocytosis. Carbon 2007, 45, 1743–1756. [Google Scholar] [CrossRef]
- Han, J.H.; Lee, E.J.; Lee, J.H.; So, K.P.; Lee, Y.H.; Bae, G.N.; Lee, S.B.; Ji, J.H.; Cho, M.H.; Yu, I.J. Monitoring multiwalled carbon nanotube exposure in carbon nanotube research facility. Inhal. Toxicol. 2008, 20, 741–749. [Google Scholar] [CrossRef] [PubMed]
- Fujitani, Y.; Kobayashi, T.; Arashidani, K.; Kunugita, N.; Suemura, K. Measurement of the physical properties of aerosols in a fullerene factory for inhalation exposure assessment. J. Occup. Environ. Hyg. 2008, 5, 380–389. [Google Scholar] [CrossRef] [PubMed]
- Genaidy, A.; Tolaymat, T.; Sequeira, R.; Rinder, M.; Dionysiou, D. Health effects of exposure to carbon nanofibers: Systematic review, critical appraisal, meta analysis and research to practice perspectives. Sci. Total Environ. 2009, 407, 3686–3701. [Google Scholar] [CrossRef] [PubMed]
- Aschberger, K.; Johnston, H.J.; Stone, V.; Aitken, R.J.; Hankin, S.M.; Peters, S.A.K.; Tran, C.I.; Christensen, F.M. Review of carbon nanotubes toxicity and exposure—Appraisal of human health risk assessment based on open literature. Crit. Rev. Toxicol. 2010, 40, 759–790. [Google Scholar] [CrossRef] [PubMed]
- Hurt, R.H.; Monthioux, M.; Kane, A. Toxicology of carbon nanomaterials: Status, trends and perspectives on the special issue. Carbon 2006, 44, 1028–1033. [Google Scholar] [CrossRef]
- Endo, M.; Kim, Y.A.; Hayashi, T.; Yanagisawa, T.; Muramatsu, H.; Ezaka, M.; Terrones, H.; Terrones, M.; Dresselhaus, M.S. Microstructural changes induced in “stacked cup” carbon nanofibers by heat treatment. Carbon 2003, 41, 1941–1947. [Google Scholar] [CrossRef]
- Al-Saleh, M.H.; Sundararaj, U. A review of vapor grown carbon nanofiber/polymer conductive composites. Carbon 2009, 47, 2–22. [Google Scholar] [CrossRef]
- Gellein, K.; Hoel, S.; Evje, L.; Syversen, T. The colony formation assay as an indicator of carbon nanotube toxicity examined in three cell lines. Nanotoxicology 2009, 1, 1–7. [Google Scholar]
- Lovik, M.; Hogseth, A.K.; Gaarder, P.I.; Hagemann, R.; Eide, I. Diesel exhaust particles and carbon black have adjuvant activity on the local lymph node response and systemic IgE production to ovalbumin. Toxicology 1997, 121, 165–178. [Google Scholar] [CrossRef] [PubMed]
- Van Zijverden, M.; de Haar, C.; van Beelen, A.; van Loveren, H.; Penninks, A.; Pieters, R. Coadministration of antigen and particles optimally stimulates the immune response in an intranasal administration model in mice. Toxicol. Appl. Pharmacol. 2001, 177, 174–178. [Google Scholar] [CrossRef] [PubMed]
- Lovik, M.; Alberg, T.; Nygaard, U.C.; Samuelsen, M.; Groeng, E.C.; Gaarder, P.I. Popliteal lymph node (PLN) assay to study adjuvant effects on respiratory allergy. Methods 2007, 41, 72–79. [Google Scholar] [CrossRef] [PubMed]
- Andrews, R.; Jacques, D.; Qian, D.; Dickey, E.C. Purification and structural annealing of multiwalled carbon nanotubes at graphitization temperatures. Carbon 2001, 39, 1681–1687. [Google Scholar] [CrossRef]
- World Health Organization (WHO). Determination of Airborne Fiber Number Concentrations. A Recommended Method, by Phase-Contrast Optical Microscopy (Membrane Filter Method); WHO: Geneva, Switzerland, 1997. [Google Scholar]
- Sadezky, A.; Muckenhuber, H. Raman microspectroscopy of soot and related carbonaceous materials: Spectral analysis and structural information. Carbon 2005, 43, 1731–1742. [Google Scholar] [CrossRef]
- Tuinstra, F.; Koenig, J.L. Raman spectrum of graphite. J. Chem. Phys. 1970, 53, 1126–1130. [Google Scholar] [CrossRef]
- Delhaes, P.; Couzi, M.; Trinquecoste, T.; Dentzer, J.; Hamidou, H.; Vix-Guterl, C. A comparison between Raman microscopy and surface characterizations of multiwall carbon nanotubes. Carbon 2006, 44, 3005–3013. [Google Scholar] [CrossRef]
- Matsubara, K.; Waki, K. Oxygen reduction characteristics of bamboo-shaped, multi-walled carbon nanotubes without nitrogen in acid media. Electrochim. Acta 2010, 55, 9166–9173. [Google Scholar] [CrossRef]
- Zielke, U.; Hüttinger, K.J.; Hoffman, W.P. Surface-Oxidized carbon fibers: I. Surface structure and chemistry. Carbon 1996, 34, 983–998. [Google Scholar] [CrossRef]
- Nygaard, U.C.; Hansen, J.S.; Samuelsen, M.; Alberg, T.; Marioara, C.D.; Lovik, M. Singel-Walled and multi-walled carbon nanotubes promote allergic immune responses in mice. Toxicol. Sci. 2009, 109, 113–123. [Google Scholar] [CrossRef] [PubMed]
- Shvedova, A.A.; Kisin, E.R.; Murray, A.R.; Johnson, V.J.; Gorelik, O.; Arepalli, S.; Hubbs, A.F.; Mercer, R.R.; Keohavong, P.; Sussman, N.; Jin, J.; Yin, J.; Stone, S.; Chen, B.T.; Deye, G.; Maynard, A.; Castranova, V.; Baron, P.A.; Kagan, V.E. Inhalation vs. aspiration of single-walled carbon nanotubes in C57BL/6 mice: Inflammation, fibrosis, oxidative stress, and mutagenesis. Am. J. Physiol. Lung Cell. Mol. Physiol. 2008, 295, 552–565. [Google Scholar] [CrossRef]
- Ryman-Rasmussen, J.P.; Tewksbury, E.W.; Moss, O.R.; Cesta, M.F.; Wong, B.A.; Bonner, J.C. Inhaled multi-walled carbon nanotubes potentiate airway fibrosis in murine allergic asthma. Am. J. Respir. Cell Mol. Biol. 2009, 40, 349–358. [Google Scholar] [CrossRef] [PubMed]
- De Haar, C.; Hassing, I.; Bol, M.; Belumink, R.; Pieters, R. Ultrafine carbon black particles cause early airway inflammation and have adjuvant activity effect in mouse allergic airway disease model. Toxicol. Sci. 2005, 87, 409–418. [Google Scholar] [CrossRef] [PubMed]
- Brunauer, S.; Emmet, P.; Teller, E. Adsorption of gases in multimolecular layers. J. Am. Chem. Soc. 1938, 60, 309–319. [Google Scholar] [CrossRef]
- ISO. Determination of the Specific Surface Area of Solids by Gas Adsorption Using the BET Method; ISO: Geneva, Switzerland, 1995. [Google Scholar]
- Puck, T.T.; Marcus, P.I. Action of X-rays on mammalian cells. J. Exp. Med. 1956, 103, 653–666. [Google Scholar] [CrossRef]
- Herzog, E.; Casey, A.; Lyng, F.M.; Chambers, G.; Byrne, H.J.; Davoren, M. A new approach to the toxicity testing of carbon-based nanomaterials—The clonogenic assay. Toxicol. Lett. 2007, 174, 49–60. [Google Scholar] [CrossRef] [PubMed]
- Lam, C.W.; James, J.T.; McCluskey, R.; Hunter, R.L. Pulmonary toxicity of single-wall carbon nanotubes in mice 7 and 90 days after intratracheal instillation. Toxicol. Sci. 2004, 77, 126–134. [Google Scholar] [CrossRef] [PubMed]
- Salvador-Morales, C.; Flahaut, E.; Sim, E.; Sloan, J.; Green, M.L.; Sim, R.B. Complement activation and protein adsorption by carbon nanotubes. Mol. Immunol. 2006, 43, 193–201. [Google Scholar] [CrossRef] [PubMed]
© 2012 by the authors; licensee MDPI, Basel, Switzerland. This article is an open access article distributed under the terms and conditions of the Creative Commons Attribution license ( http://creativecommons.org/licenses/by/3.0/).
Share and Cite
Jensen, E.K.; Larsen, S.Y.; Nygaard, U.C.; Marioara, C.D.; Syversen, T. Early Combination of Material Characteristics and Toxicology Is Useful in the Design of Low Toxicity Carbon Nanofiber. Materials 2012, 5, 1560-1580. https://doi.org/10.3390/ma5091560
Jensen EK, Larsen SY, Nygaard UC, Marioara CD, Syversen T. Early Combination of Material Characteristics and Toxicology Is Useful in the Design of Low Toxicity Carbon Nanofiber. Materials. 2012; 5(9):1560-1580. https://doi.org/10.3390/ma5091560
Chicago/Turabian StyleJensen, Ellen K., Sten Y. Larsen, Unni C. Nygaard, Calin D. Marioara, and Tore Syversen. 2012. "Early Combination of Material Characteristics and Toxicology Is Useful in the Design of Low Toxicity Carbon Nanofiber" Materials 5, no. 9: 1560-1580. https://doi.org/10.3390/ma5091560
APA StyleJensen, E. K., Larsen, S. Y., Nygaard, U. C., Marioara, C. D., & Syversen, T. (2012). Early Combination of Material Characteristics and Toxicology Is Useful in the Design of Low Toxicity Carbon Nanofiber. Materials, 5(9), 1560-1580. https://doi.org/10.3390/ma5091560