3.1. BaTiO: Role of Ti 3s and 3p states for ferroelectricity
In this subsection, we discuss the role of Ti 3s and 3p states for ferroelectricity for ferroelectricity in tetragonal BaTiO.
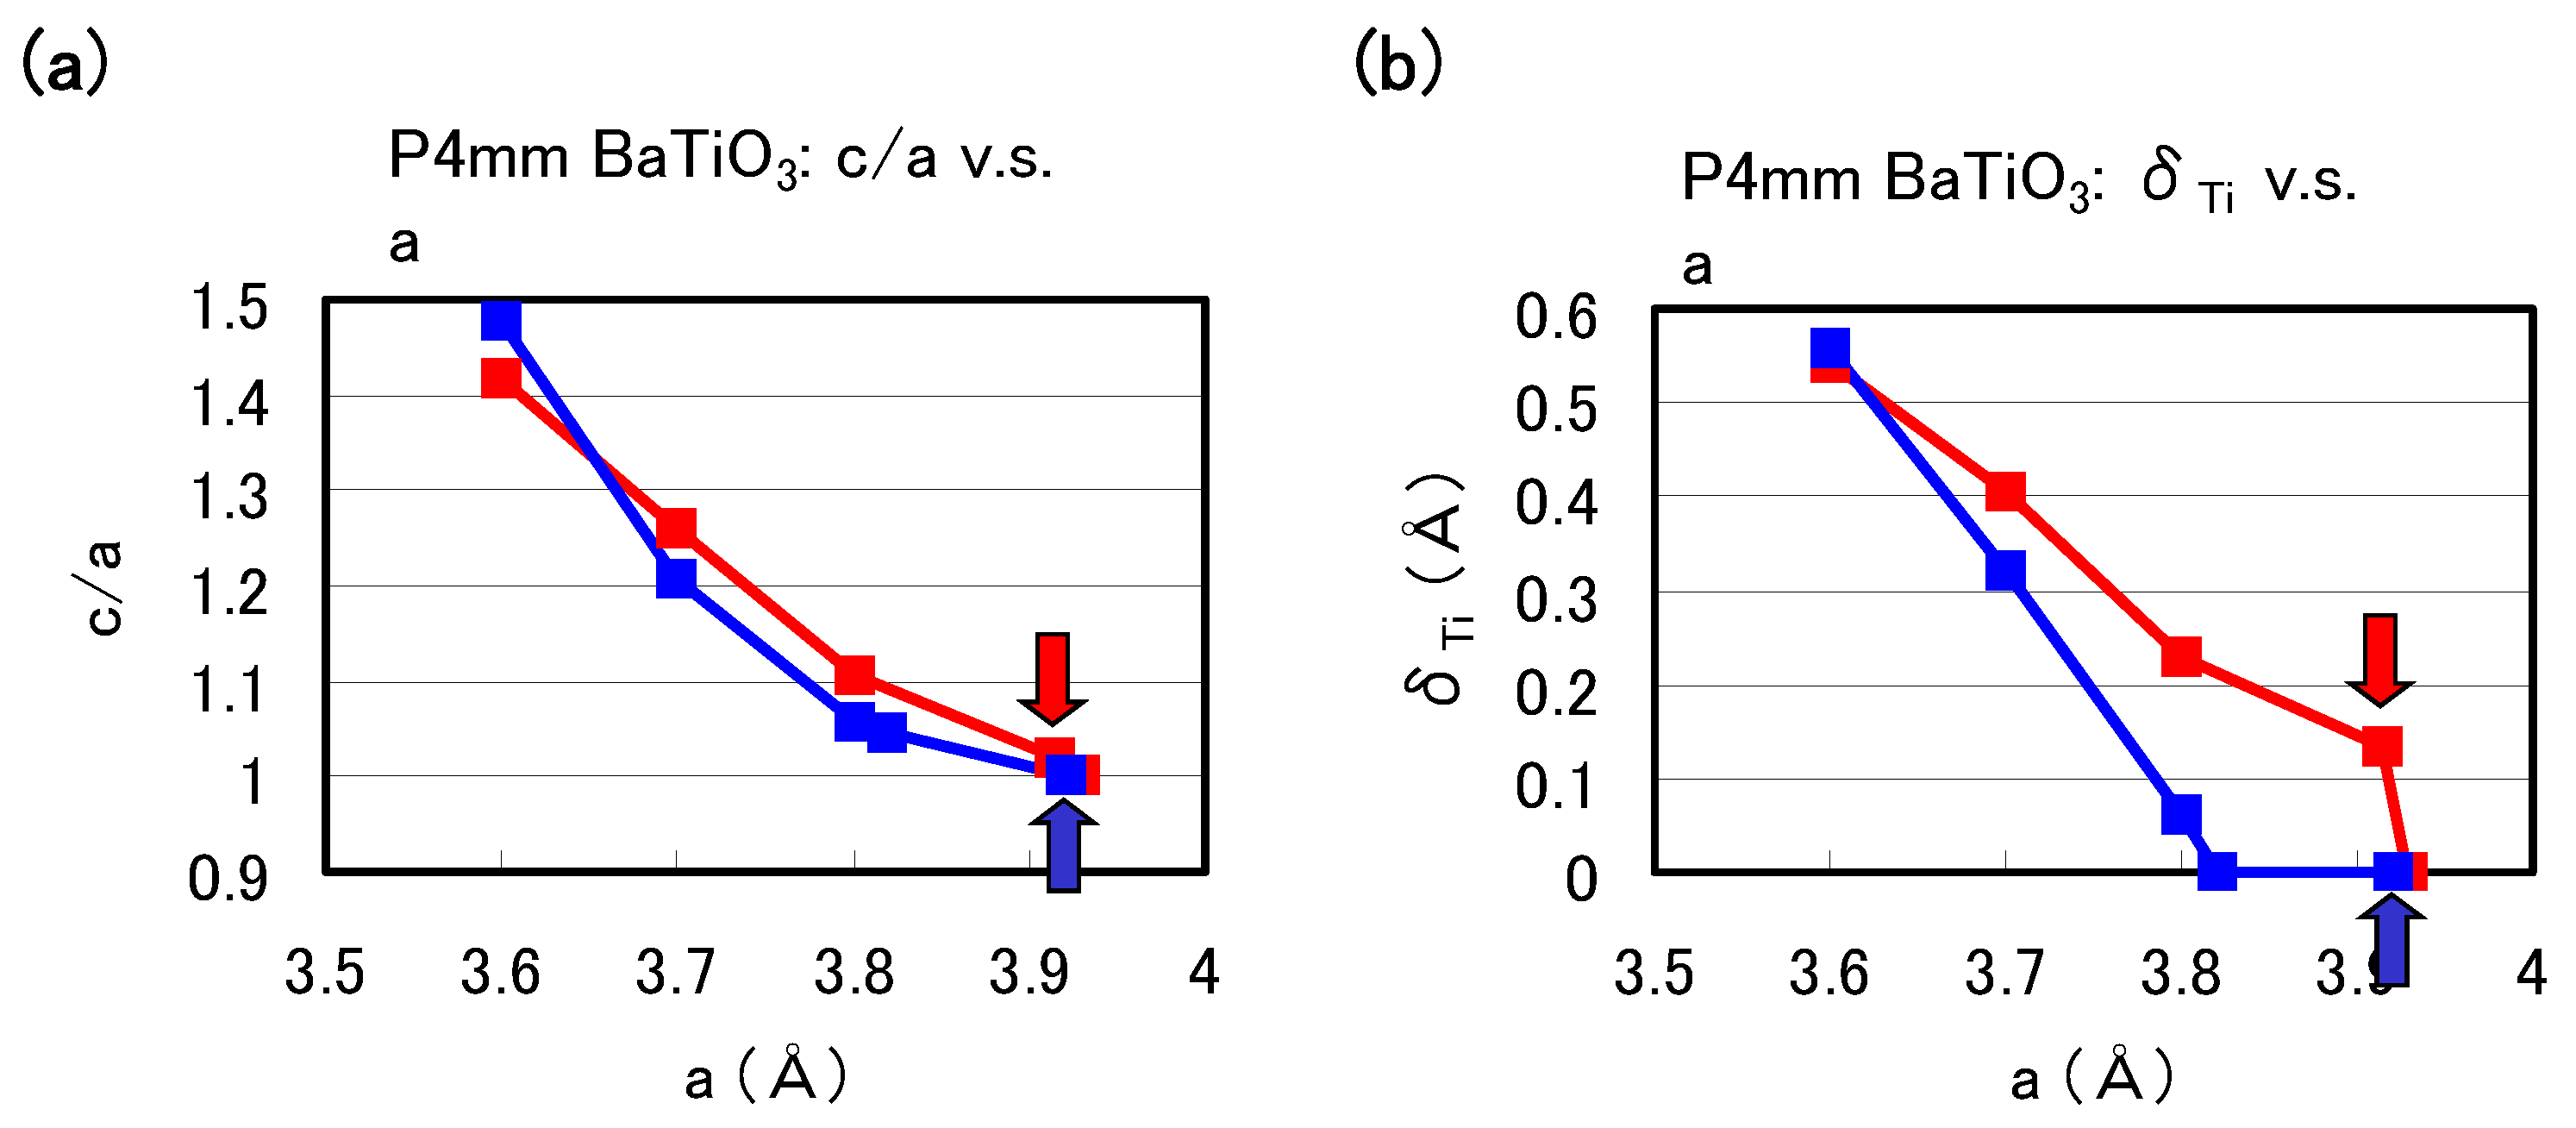
Figure 2(a) and
Figure 2(b) show the optimized results for the ratio
c/
a of the lattice parameters and the value of the Ti ion displacement (
) as a function of the
a lattice constants in tetragonal BaTiO
, respectively. Results with arrows are the fully optimized results, and the others results are those with the
c lattice constants and all the inner coordinations optimized for fixed
a. Note that the fully optimized structure of BaTiO
is tetragonal with the Ti3spd4s PP, whereas it is cubic (
) with the Ti3d4s PP. As shown in
Figure 2(a) and
Figure 2(b),
c/
a and
show significantly different results for
3.7 Å whereas they show almost the same results for
3.7 Å, for both Ti PPs. This result suggests that the optimized results of
O
with smaller lattice constants, e.g., under high pressure [
8], are almost independent of the choice of PP.
Figure 2.
Optimized calculated results as a function of
a lattice constants in tetragonal BaTiO
: (
a)
ratio and (
b)
to the [001] axis. Red lines correspond to the results with the Ti3spd4s PP, and blue lines correspond to those with the Ti3d4s PP. Results with arrows are the fully optimized results, and the other results are those with
c and all the inner coordinations optimized for fixed
a [
17].
The calculated results shown in
Figure 2 suggest that the explicit treatment of Ti 3s and 3p semicore states is essential to the appearance of ferroelectric states in BaTiO
. In the following, we investigate the role of Ti 3s and 3p states for ferroelectricity from two viewpoints. One viewpoint concerns hybridizations between Ti 3s and 3p states and other states.
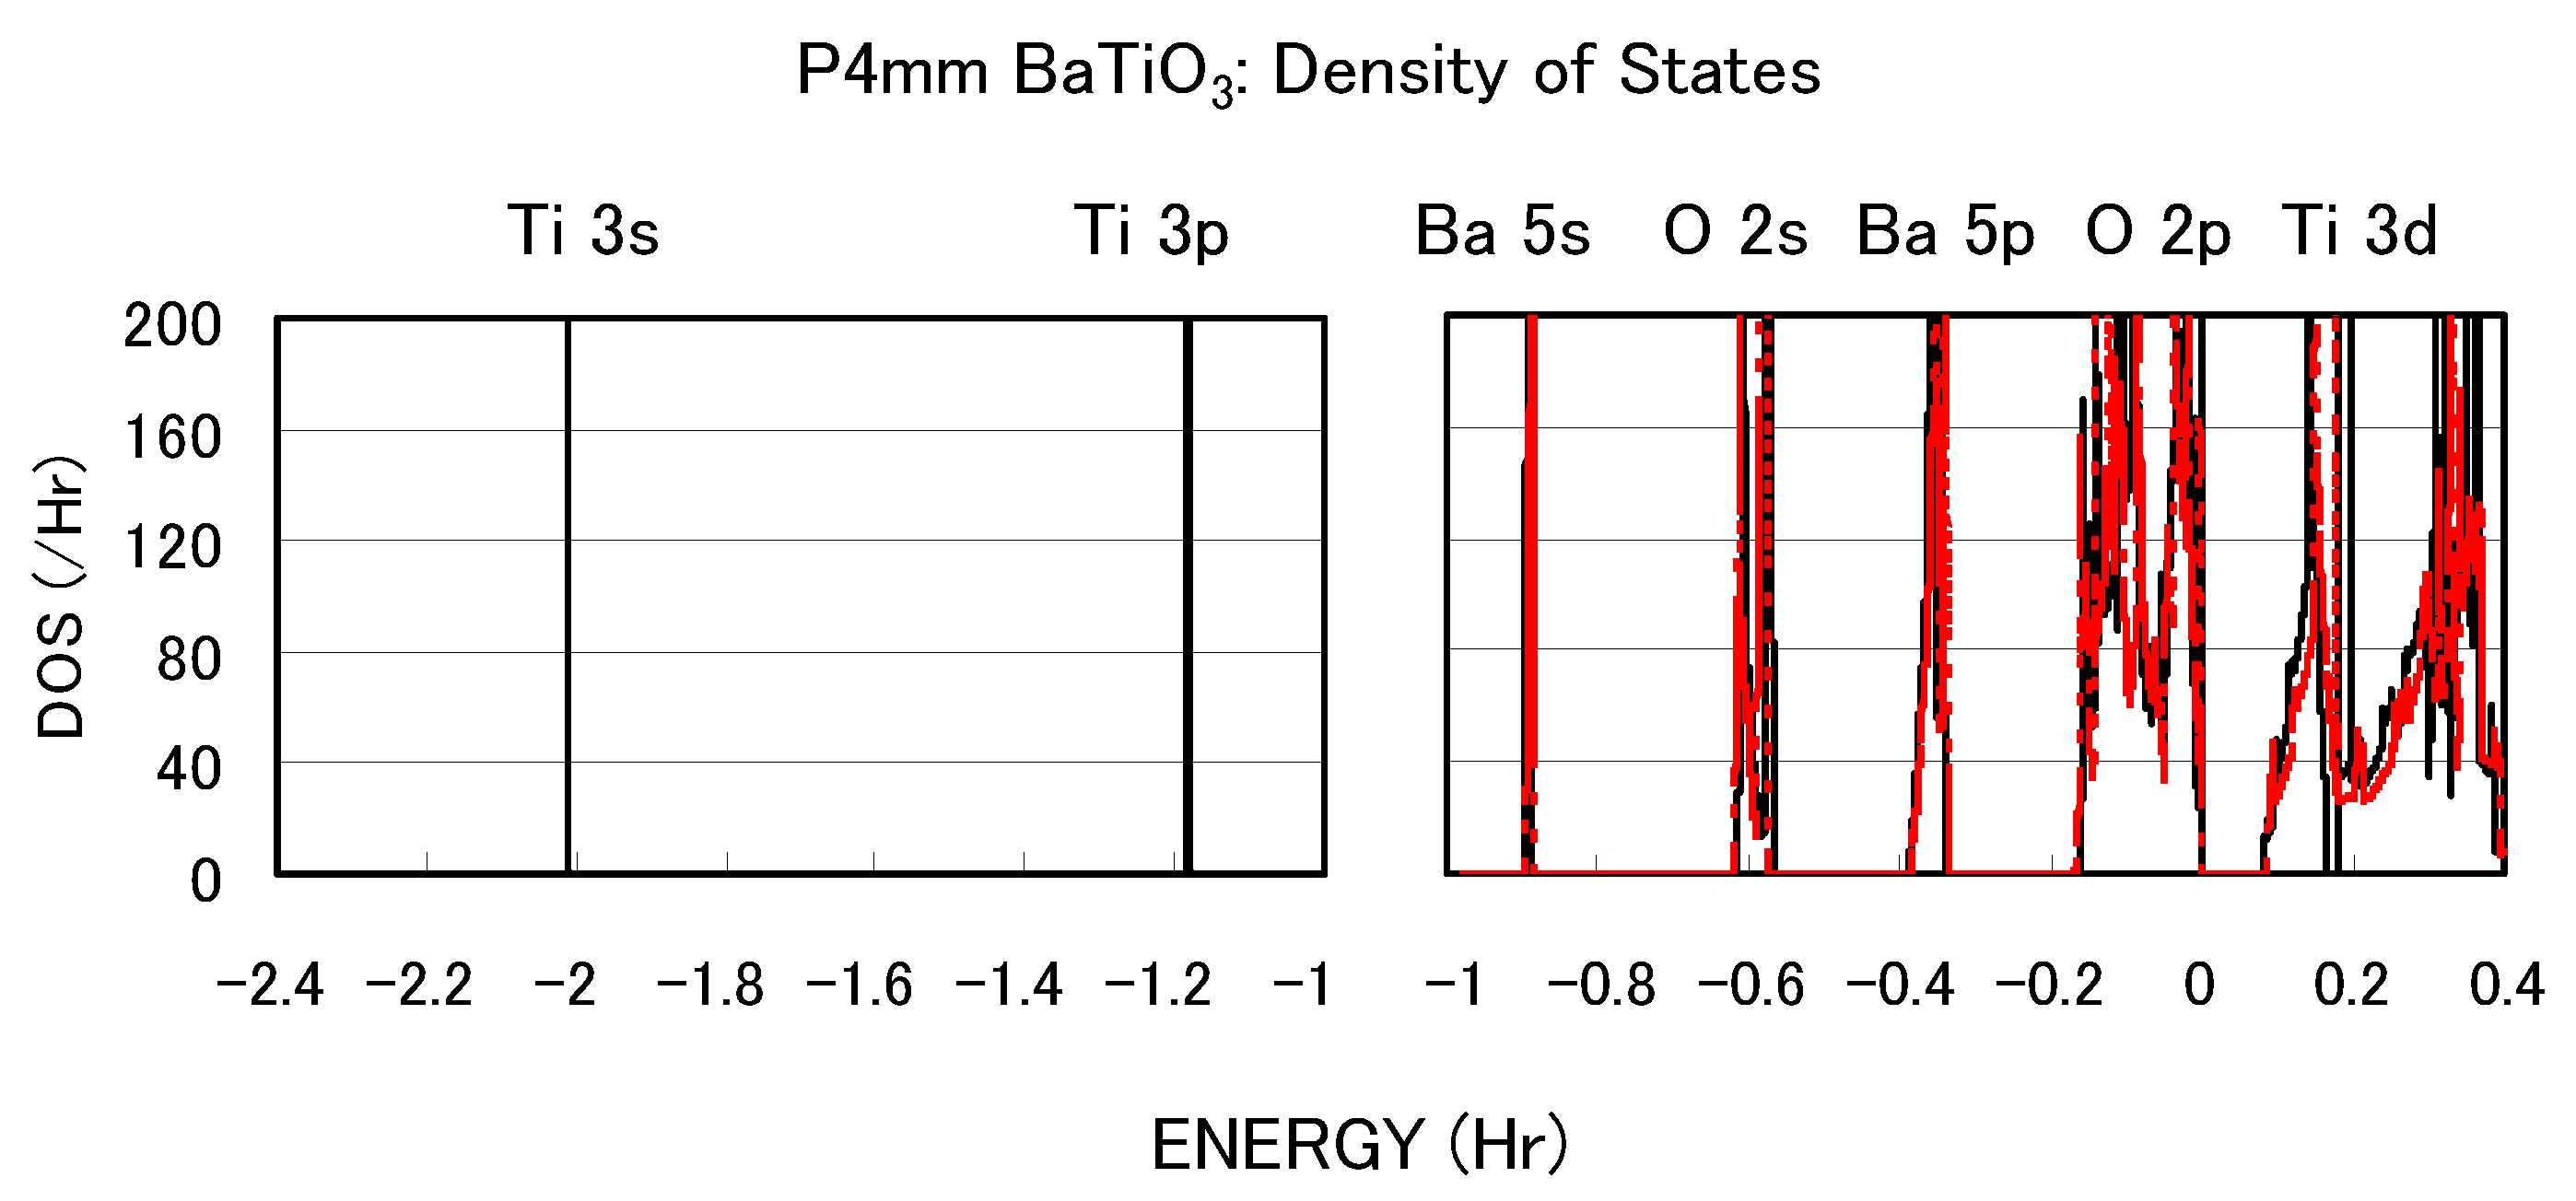
Figure 3 shows the total density of states (DOS) of tetragonal BaTiO
with two Ti PPs. Both results are in good agreement with previous calculated results [
11,
12] by the full-potential linear augmented plane wave (FLAPW) method. In the DOS with the Ti3spd4s PP, the energy “levels", not bands, of Ti 3s and 3p states, are located at −2.0 Hr and −1.2 Hr, respectively. This result suggests that the Ti 3s and 3p orbitals do not make any hybridizations but only give Coulomb repulsions with the O orbitals as well as the Ba orbitals. In the DOS with the Ti3d4s PP, on the other hand, the energy levels of Ti 3s and 3p states are not shown because Ti 3s and 3p states were treated as the core charges. This result means that the Ti 3s and 3p orbitals cannot even give Coulomb repulsions with the O orbitals as well as the Ba orbitals.
Another viewpoint is about the Coulomb repulsions between Ti 3s and 3p
states and O
2s and 2p
states in tetragonal BaTiO
.
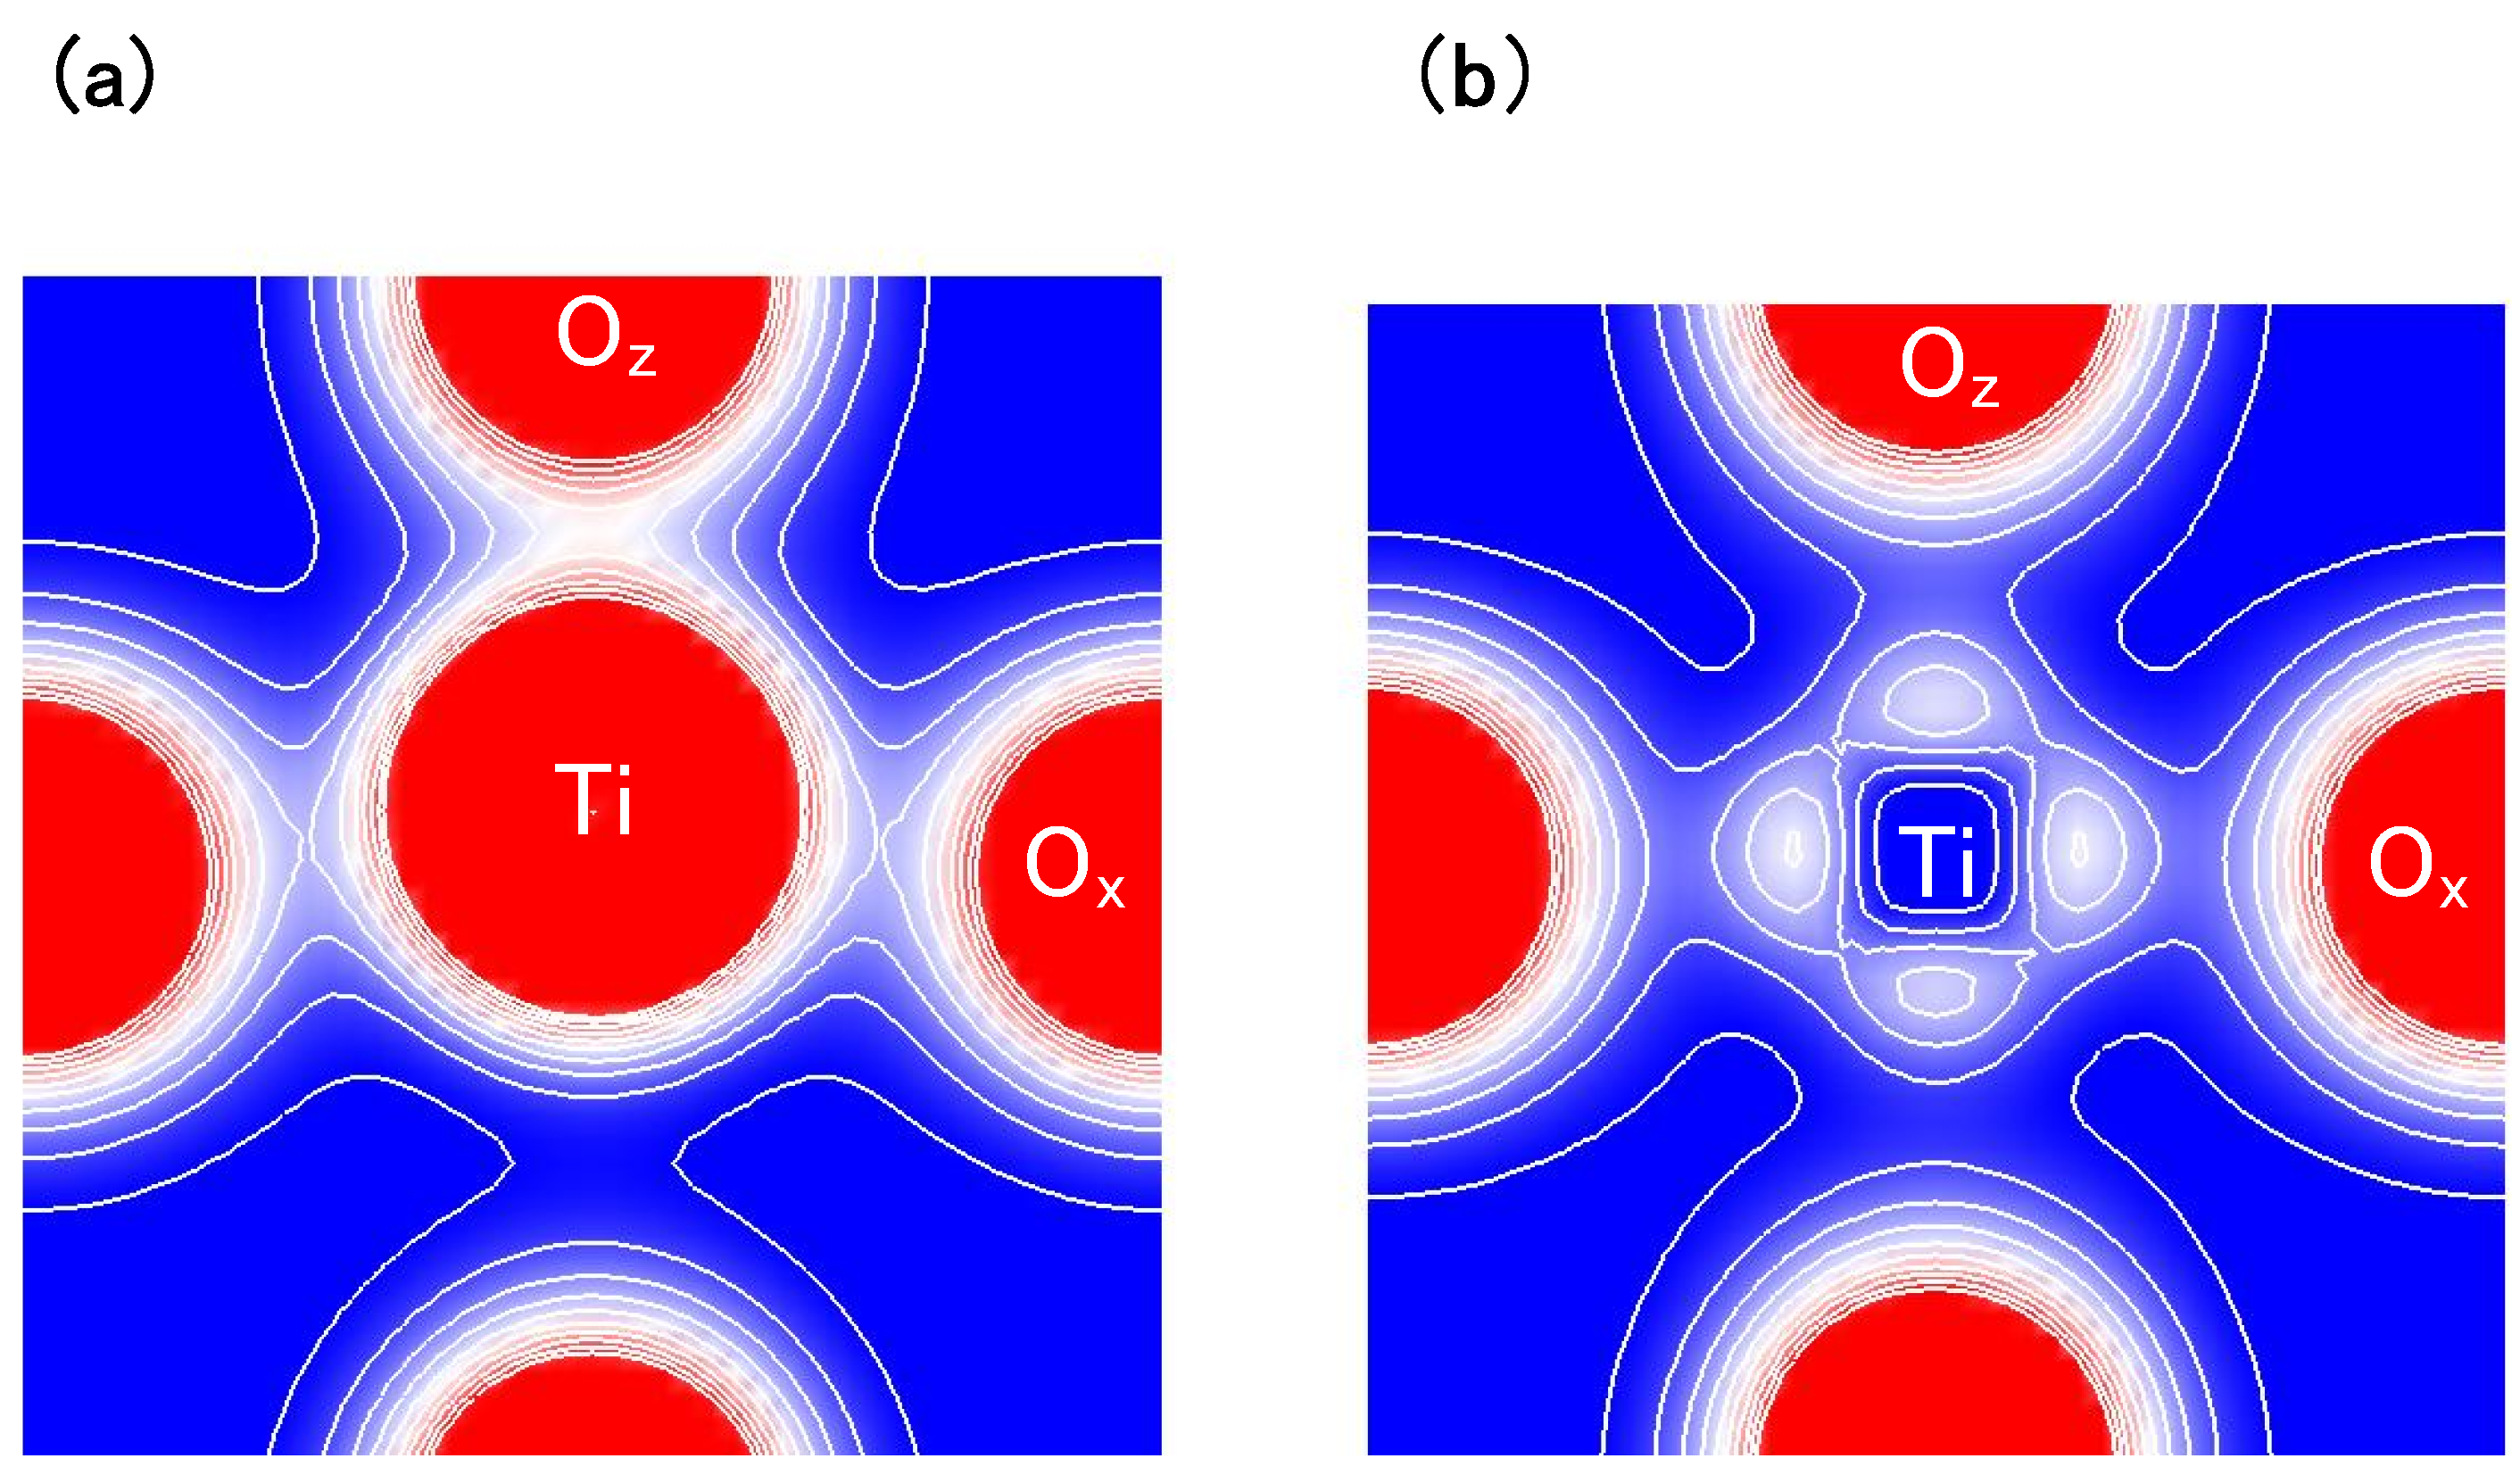
Figure 4(a) and
Figure 4(b) show two-dimensional electron-density contour map on the
-plane for tetragonal BaTiO
with the Ti3spd4s PP, and that with the Ti3d4s PP, respectively. These are the optimized calculated results with
a fixed to be 3.8 Å, and the electron density in
Figure 4(a) is quantitatively in good agreement with the experimental result [
23]. The electron density between Ti and O
ions in
Figure 4(a) is larger than that in
Figure 4(b), which suggests that Ti ion displacement is closely related to the Coulomb repulsions between Ti 3s and 3p states and O 2s and 2p states along the [001] axis (the
z-axis in this case).
Figure 3.
Total density of states (DOS) of fully optimized tetragonal BaTiO
with the Ti3spd4s PP (solid line) and cubic BaTiO
with the Ti3d4s PP (red dashed line) [
17].
Figure 3.
Total density of states (DOS) of fully optimized tetragonal BaTiO
with the Ti3spd4s PP (solid line) and cubic BaTiO
with the Ti3d4s PP (red dashed line) [
17].
Figure 4.
Two-dimensional electron-density contour map on the
-plane for tetragonal BaTiO
: (
a) with the Ti3spd4s PP; and (
b) with the Ti3d4s PP. The optimized calculated results with
a fixed to be 3.8Å are shown in both figures. The electron density increases as color changes from blue to red via white. Contour curves are drawn from 0.4 to 2.0
e/
with increments of 0.2
e/
[
17].
The present discussion of the Coulomb repulsions is consistent with the previous reports. A recent soft mode investigation [
13] of BaTiO
shows that Ba ions contribute little to the appearance of Ti ion displacement along the [001] axis. This result suggests that Ti ion displacement is closely related to the structural distortion of TiO
octahedra. In the present calculations, on the other hand, the only difference between BaTiO
with the Ti3spd4s PP and with the Ti3d4s PP is the difference in the expression for the Ti 3s and 3p states,
i.e., the explicit treatment and including core charges. However, our previous calculation [
15] shows that the strong Coulomb repulsions between Ti 3s and 3p
states and O
2s and 2p
states do not favor Ti ion displacement along the [001] axis. This result suggests that the Coulomb repulsions between Ti 3s and 3p
states and O
2s and 2p
states would contribute to Ti ion displacement along the [001] axis, and the suggestion is consistent with a recent calculation [
14] for PbTiO
indicating that the tetragonal and ferroelectric structure appears more favorable as the
a lattice constant decreases.
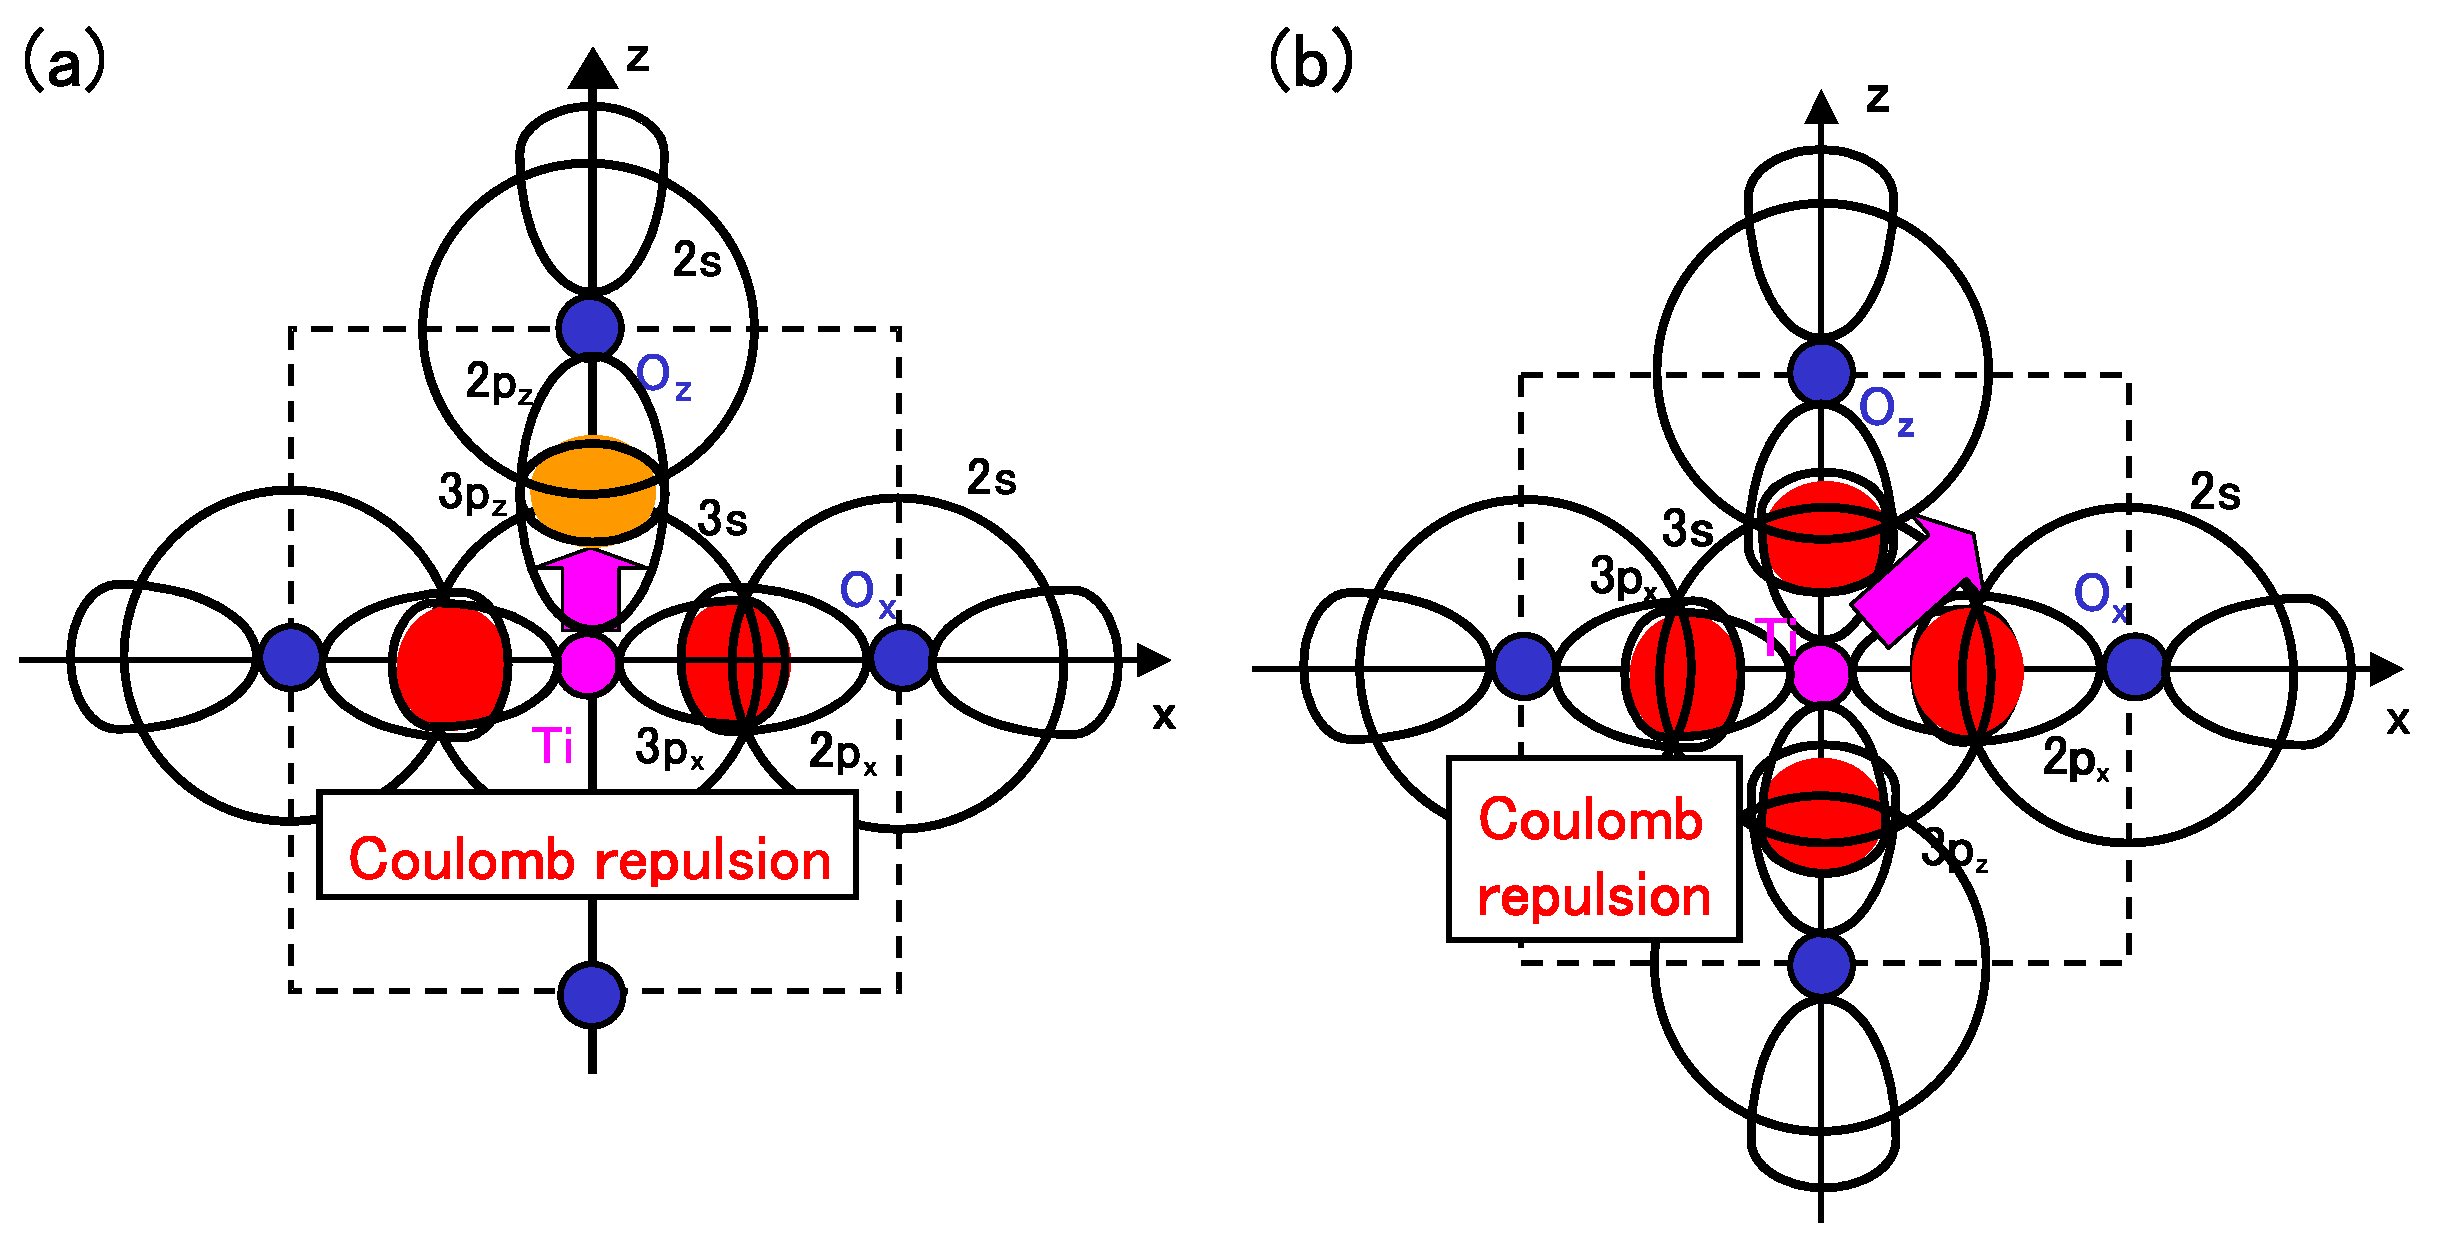
Considering the above investigations, we propose the mechanism of Ti ion displacement as follows: Ti ion displacement along the
z-axis appears when the Coulomb repulsions between Ti 3s and 3p
states and O
2s and 2p
states, in addition to the dipole-dipole interaction, overcome the Coulomb repulsions between Ti 3s and 3p
states and O
2s and 2p
states [
15]. An illustration of the Coulomb repulsions is shown in
Figure 5(a). In fully optimized BaTiO
with the Ti3spd4s PP, the Ti ion can be displaced due to the above mechanism. In fully optimized BaTiO
with the Ti3d4s PP, on the other hand, the Ti ion cannot be displaced due to the weaker Coulomb repulsions between Ti and O
ions. However, since the Coulomb repulsion between Ti and O
ions in BaTiO
with the Ti3d4s PP is also weaker than that in BaTiO
with the Ti3spd4s PP, the Coulomb repulsions between between Ti and O
ions in addition to the log-range force become comparable to the Coulomb repulsions between Ti and O
ions both in Ti PPs, as the lattice parameter
a becomes smaller. The above discussion suggests that the hybridization between Ti 3d and O
2s and 2p
stabilizes Ti ion displacement, but contribute little to a driving force for the appearance of Ti ion displacement.
It seems that the above proposed mechanism for tetragonal BaTiO
can be applied to the mechanism of Ti ion displacement in rhombohedral BaTiO
, as illustrated in
Figure 5(b). The strong isotropic Coulomb repulsions between Ti 3s and 3p
states and O
2s and 2p
states yield Ti ion displacement along the [111] axis. On the other hand, when the isotropic Coulomb repulsions are weaker or stronger, the Ti ion cannot be displaced and therefore it is favored for the crystal structure to be cubic.
Figure 5.
Illustrations of the proposed mechanisms for the Coulomb repulsions between Ti 3s and 3p states and O 2s and 2p states in BaTiO
: (
a) anisotropic Coulomb repulsions between Ti 3s and 3p
states and O
2s and 2p
states, and between Ti 3s and 3p
states and O
2s and 2p
states, in the tetragonal structure; (
b) isotropic Coulomb repulsions between Ti 3s and 3p
states and O
2s and 2p
states, in the rhombohedral structure [
17].
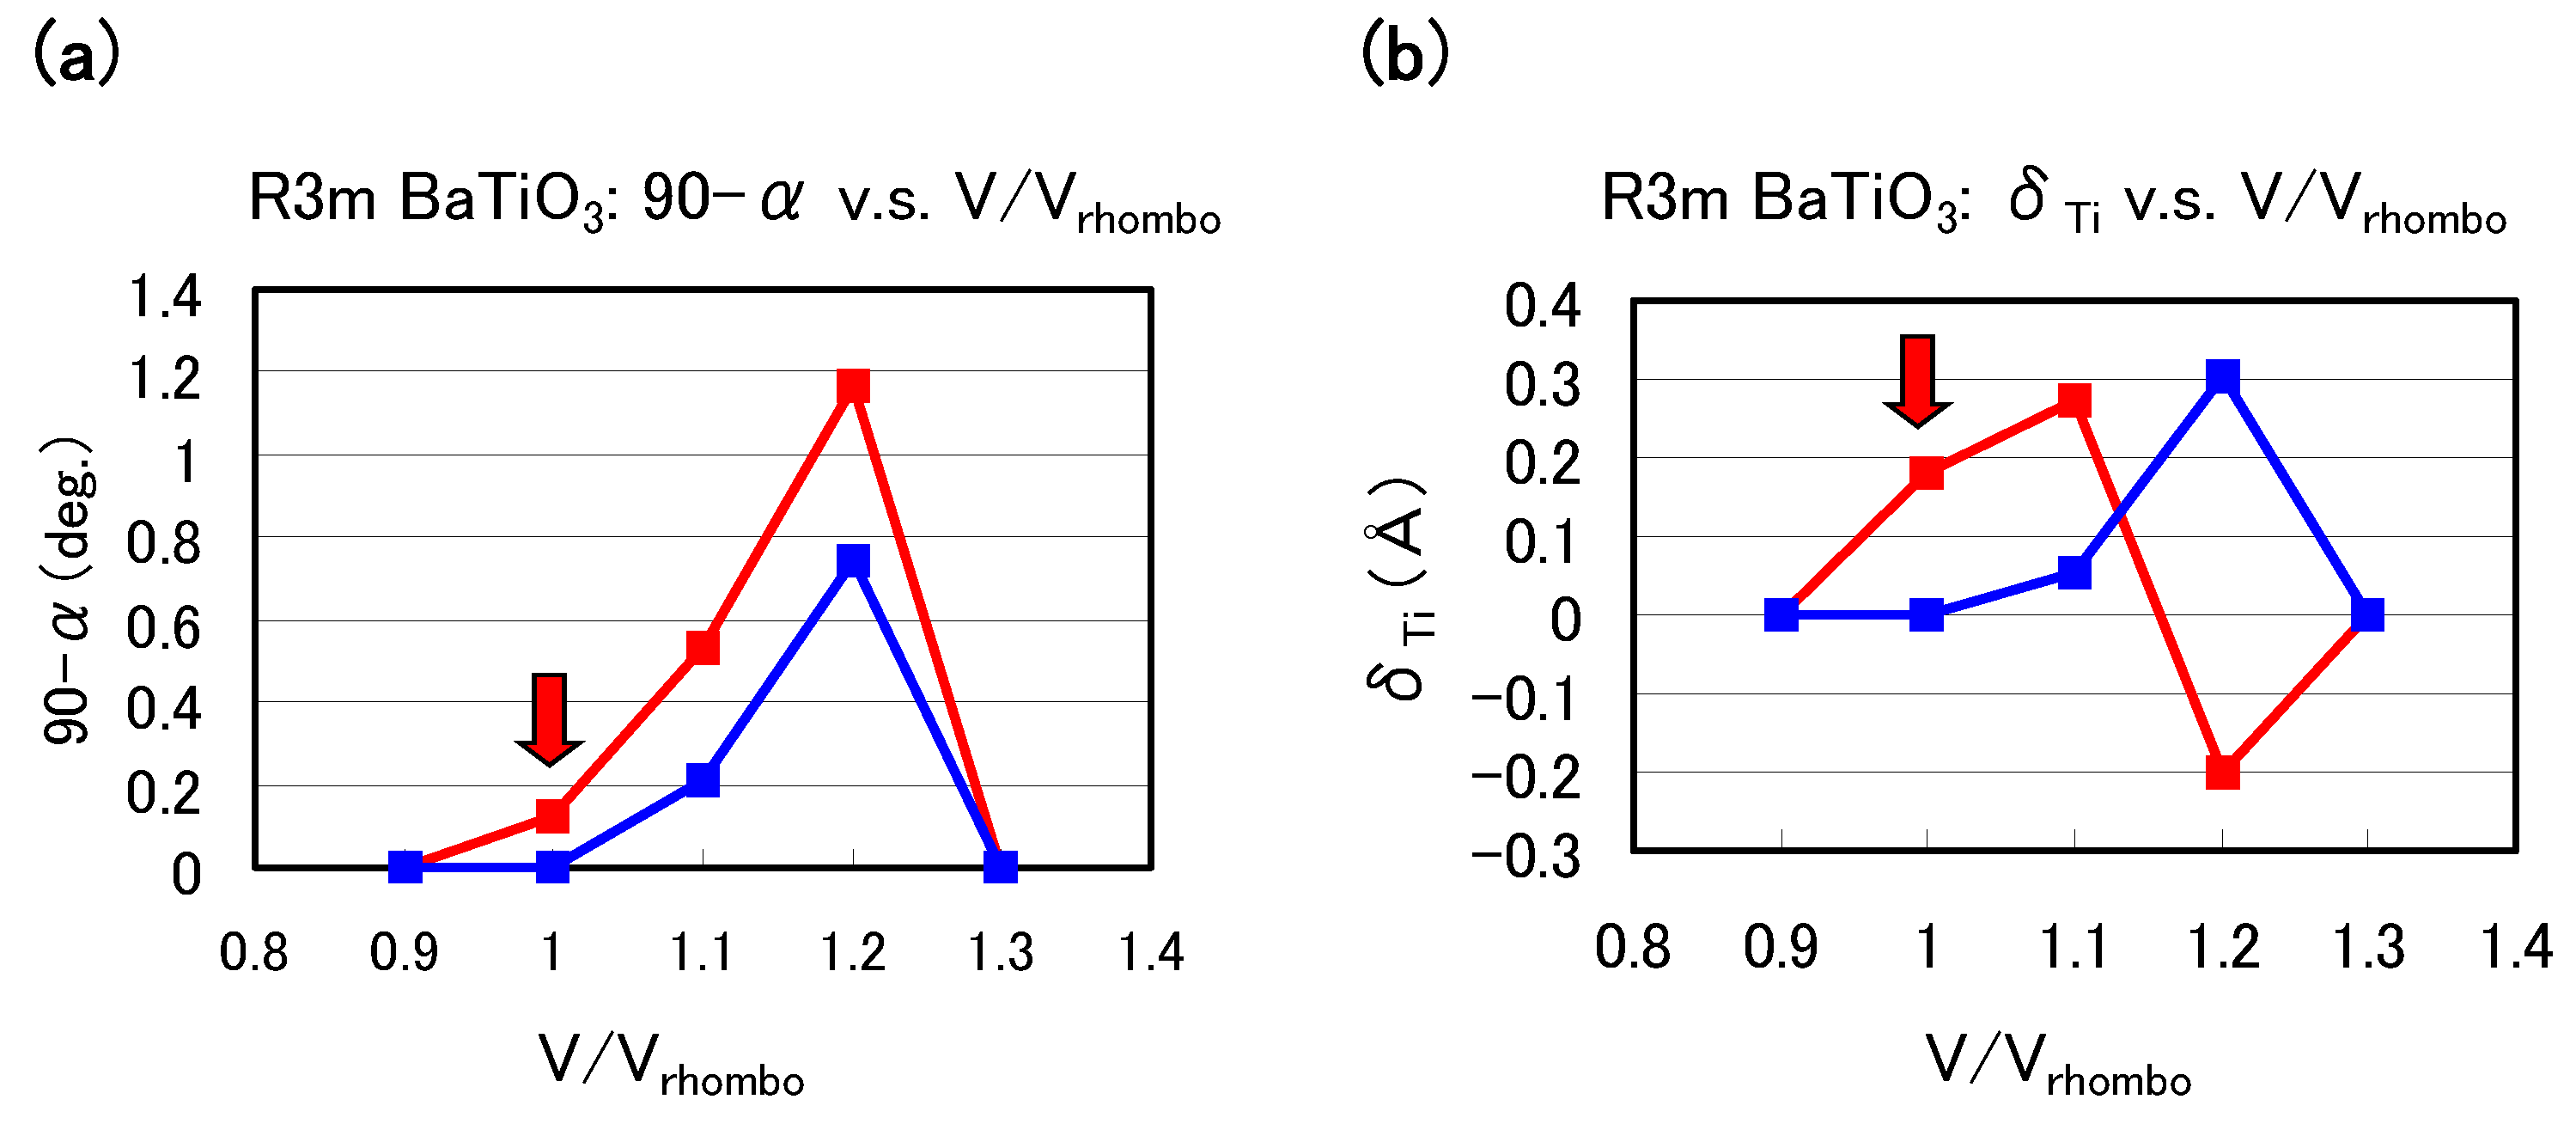
Let us investigate the structural properties of rhombohedral BaTiO
.
Figure 6(a) and
Figure 6(b) show the optimized results of the 90
degree and
as a function of fixed volumes of the unit cells in rhombohedral BaTiO
, respectively, where
denotes the angle between two lattice vectors. In these figures,
denotes the angle between two crystal axes of rhombohedral BaTiO
, and
denotes the value of the Ti ion displacement along the [111] axis. Results with arrows are the fully optimized results;
denote the volume of the fully optimized unit cell with the Ti 3spd4s PP. The other results are those with all the inner coordinations optimized with fixed volumes of the unit cells. Our proposal mechanisms about the Coulomb repulsions seem to be consistent with the calculated results shown in
Figure 6: For
0.9 or ≳ 1.3, the isotropic Coulomb repulsions are weaker or stronger, and the Ti ion cannot be displaced along the [111] axis and therefore the crystal structure is cubic for both Ti PPs. For 0.9
1.3, on the other hand, the isotropic Coulomb repulsions are strong enough to yield Ti ion displacement for both Ti PPs. However, since the magnitude of the isotropic Coulomb repulsion is different in the two Ti PPs, the properties of the 90
degree and
are different quantitatively.
Figure 6.
Optimized calculated results as a function of the fixed volumes of the unit cells in rhombohedral BaTiO
: (
a) 90
degree and (
b)
to the [111] axis. Red lines correspond to the results with the Ti3spd4s PP, and blue lines correspond to those with the Ti3d4s PP.
denote the volume of the fully optimized unit cell with the Ti 3spd4s PP. Results with arrows are the fully optimized results, and the other results are those with all the inner coordinations optimized for fixed volumes of the unit cells. Note that the Ti ion with the Ti3spd4s PP is oppositely displaced at
= 1.2 [
17].
3.2. BiZnTiO: Role of Zn 3s, 3p, and 3d states for ferroelectricity
As discussed in the previous subsection, the Coulomb repulsions between Ti 3s and 3p states and O 2s and 2p states have an important role in the appearance of the ferroelectric state in tetragonal BaTiO. In this subsection, we discuss the role of Zn 3d (d) states in addition to 3s and 3p states for ferroelectricity in tetragonal BZT.
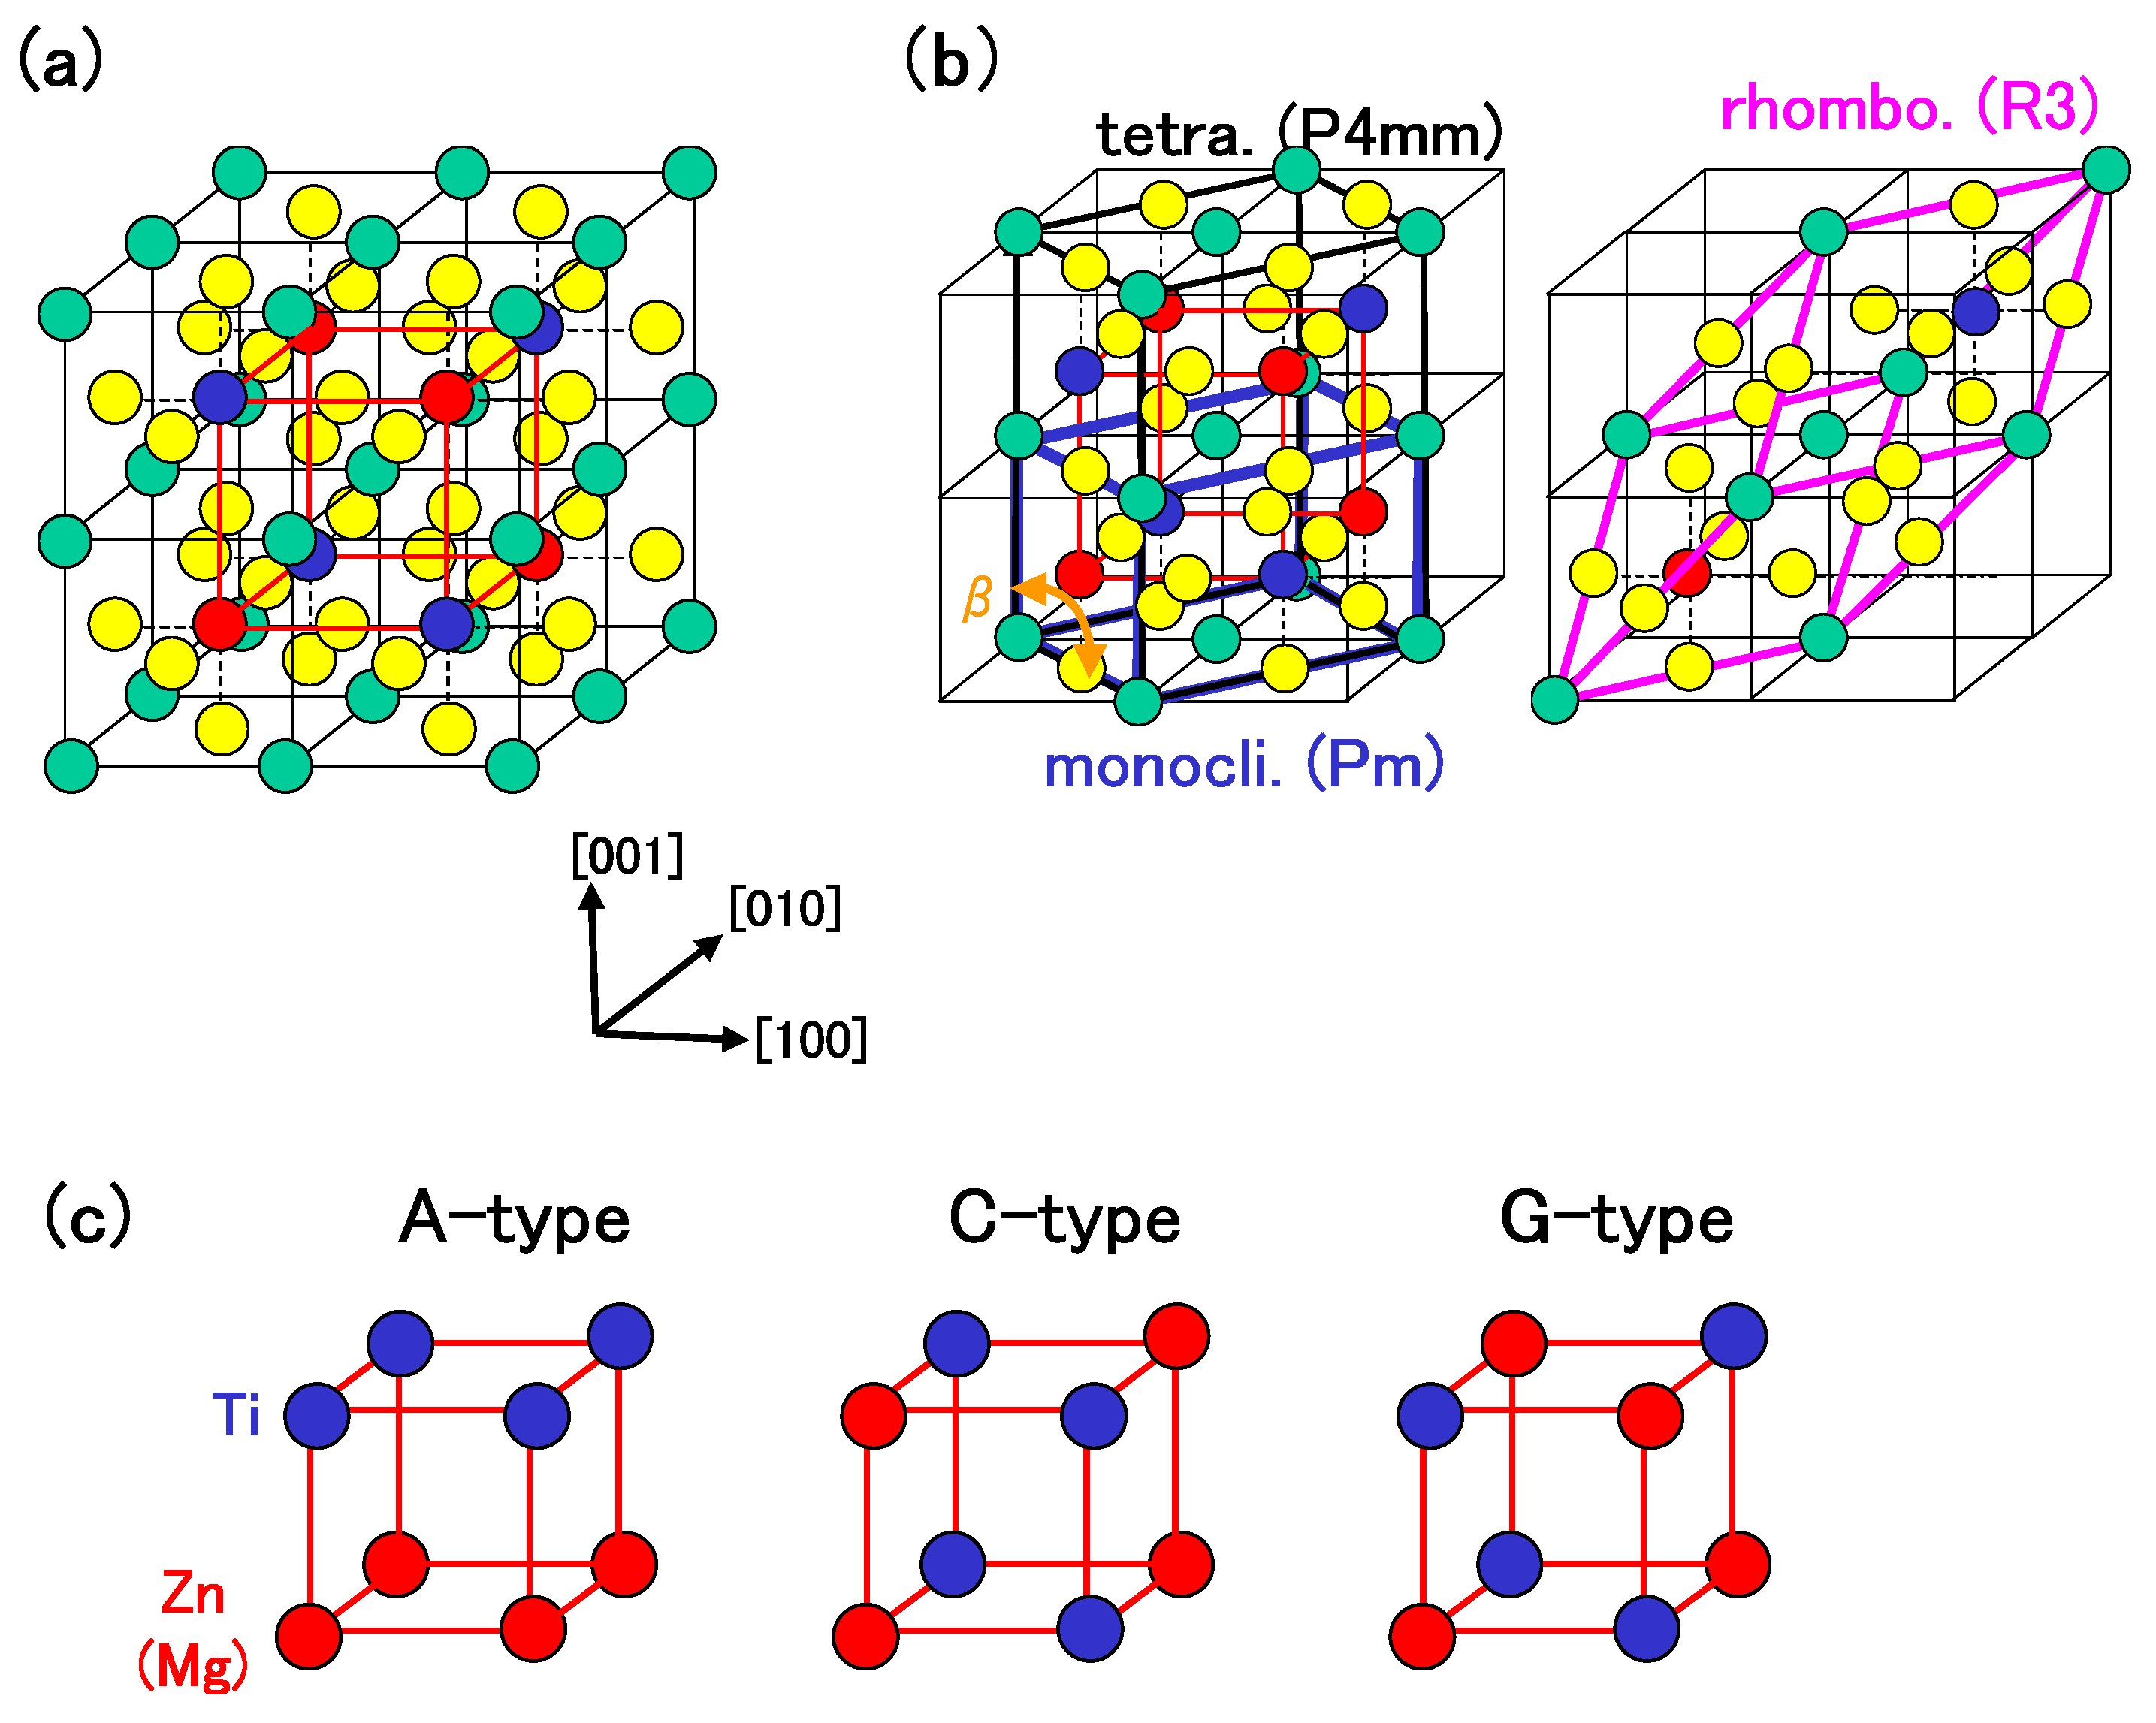
Table 1 shows a summary of the optimized results of BZT in Cases I and II.
denotes the difference in total energy per f.u. between the rhombohedral and other structures. Although the lattice constant in each structure except the rhombohedral one seems to be quantitatively similar in both cases, properties of
are different. In Case I, the rhombohedral structure is the most stable, which is in disagreement with the experimental result [
25]. In Case II, on the other hand, the monoclinic structure, which is the “pseudo-C-type-tetragonal” structure, is the most stable. This result seems to be in disagreement with the experimental result, [
25] but the calculated lattice constants are in good agreement with the experimental ones. Note that the magnitude of
in Case II is markedly smaller than that in Case I.
Table 2 shows a summary of the optimized results of BMT in Cases I and II. In contrast to BZT, the rhombohedral structure is the most stable structure in both cases, which is consistent with the experimental result [
27]. Note that the magnitude of
in Case II is comparable to that in Case I.
Table 1.
Summary of the optimized results of BZT in (a) Case I and (b) Case II.
denotes the difference in total energy per f.u. between the rhombohedral and other structures [
18].
(a)
| Structure | a (Å) | c (Å) | | (degree) | (eV/f.u.) |
| Tetragonal | | | | | |
| zwA-type | 3.748 | 4.579 | 1.222 | 90 | 0.316 |
| zwC-type | 3.681 | 4.784 | 1.299 | 90 | 0.240 |
| zwG-type | 3.725 | 4.574 | 1.228 | 90 | 0.158 |
| Monoclinic | 3.735 | 4.741 | 1.269 | = 91.5 | 0.193 |
| Rhombohedral | 5.560 | | 1 | 59.93 | 0 |
| Experiment (ref. [25]) | 3.822 | 4.628 | 1.211 | 90 | |
(b)
| Structure | a (Å) | c (Å) | | (degree) | (eV/f.u.) |
| Tetragonal | | | | | |
| zwA-type | 3.711 | 4.662 | 1.256 | 90 | 0.135 |
| zwC-type | 3.670 | 4.789 | 1.305 | 90 | 0.091 |
| zwG-type | 3.684 | 4.698 | 1.275 | 90 | 0.047 |
| Monoclinic | 3.726 | 4.740 | 1.272 | = 91.1 | −0.021 |
| Rhombohedral | 5.590 | | 1 | 59.90 | 0 |
| Experiment (ref. [25]) | 3.822 | 4.628 | 1.211 | 90 | |
Table 2.
Summary of the optimized results of BMT in (a) Case I and (b) Case II.
denotes the difference in total energy per f.u. between the rhombohedral and other structures [
18].
(a)
| Structure | a (Å) | c (Å) | | (degree) | (eV/f.u.) |
| Tetragonal | | | | | |
| zwA-type | 3.788 | 4.260 | 1.125 | 90 | 0.397 |
| zwC-type | 3.707 | 4.586 | 1.237 | 90 | 0.357 |
| zwG-type | 3.758 | 4.348 | 1.157 | 90 | 0.245 |
| Monoclinic | 3.930 | 4.001 | 1.018 | = 91.8 | 0.252 |
| Rhombohedral | 5.522 | | 1 | 59.80 | 0 |
(b)
| Structure | a (Å) | c (Å) | | (degree) | (eV/f.u.) |
| Tetragonal | | | | | |
| zwA-type | 3.753 | 4.533 | 1.208 | 90 | 0.369 |
| zwC-type | 3.716 | 4.596 | 1.237 | 90 | 0.298 |
| zwG-type | 3.729 | 4.546 | 1.219 | 90 | 0.226 |
| Monoclinic | 3.777 | 4.557 | 1.207 | = 91.4 | 0.223 |
| Rhombohedral | 5.563 | | 1 | 59.58 | 0 |
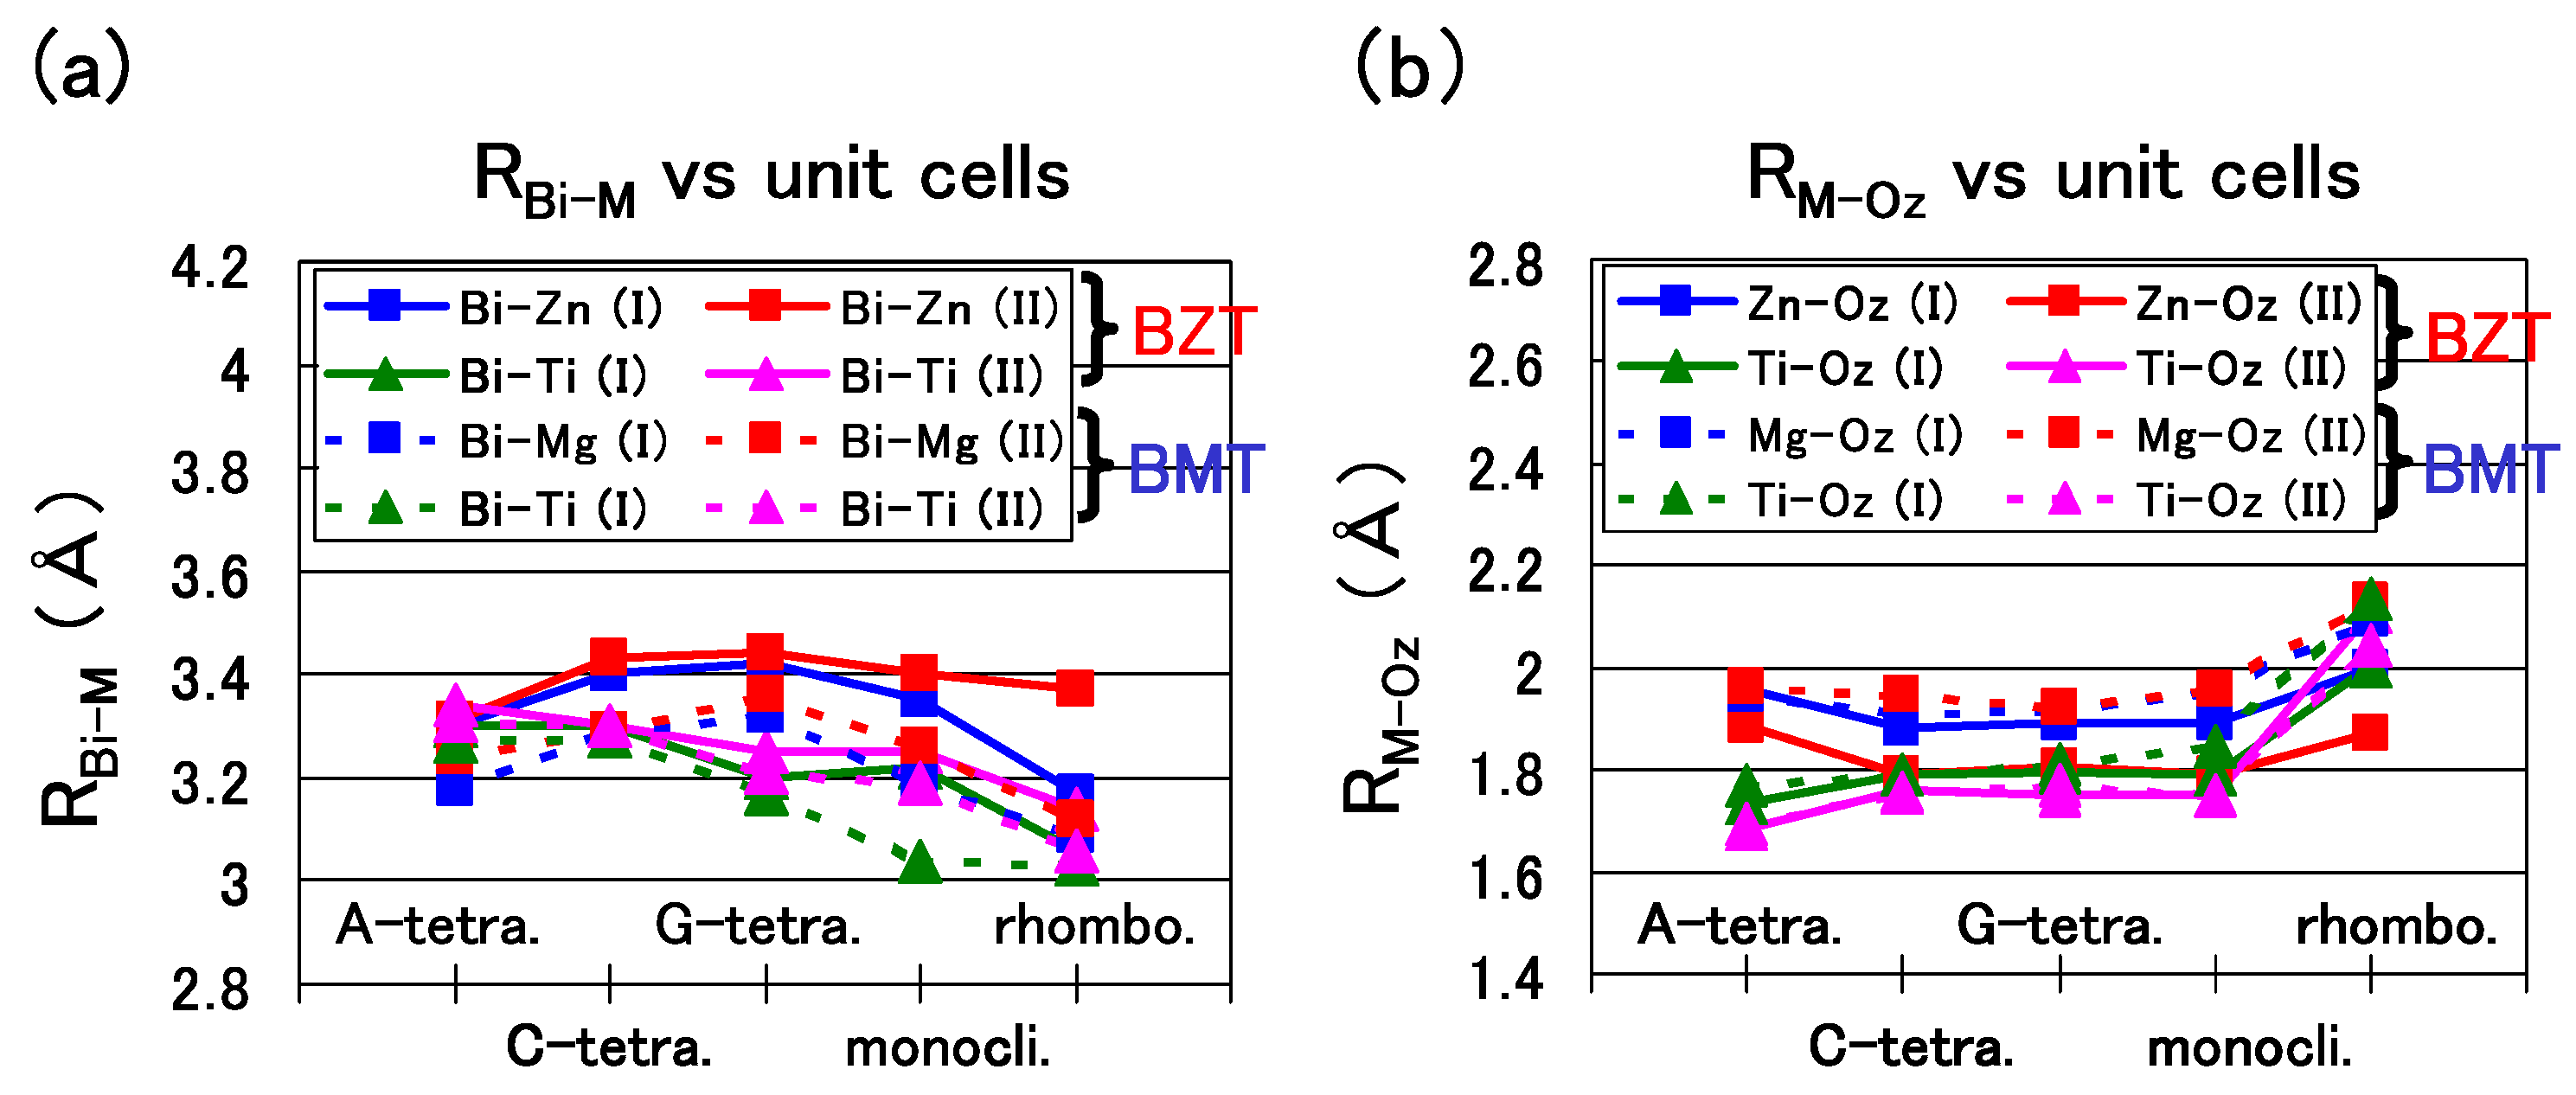
Let us discuss in detail the optimized results of BZT and BMT in the following.
Figure 7(a) shows the nearest distance of Bi-Zn (
), Bi–Ti (
), and Bi–Mg (
). A similar trend is shown in
Figure 7(a) except for the
of the rhombohedral BZT in Case II, which is larger than that in Case I. This result must be due to the stronger Coulomb repulsion between Bi and Zn in Case II, and the larger
would make the rhombohedral BZT less stable in Case II.
Figure 7(b) shows the nearest distance of Zn–O
(
), Ti–O
(
), and Mg–O
(
). In the C-type, G-type tetragonal, and monoclinic structures of BZT in Case II, whose
is small, within 0.1 eV/f.u., the
in Case II is smaller than that in Case I,
i.e., the Zn ion displacement to O
in Case II is larger than that in Case I. This result must be due to the stronger Zn–O
Coulomb repulsion in Case II than that in Case I, as discussed in the case of tetragonal BaTiO
in the previous subsection. Note that
and
of BZT in Case II show similar values. This result seems to be consistent with the experimental result [
25] of the random Zn/Ti ordering. The above strong Coulomb repulsion of Bi-Zn and Zn–O of BZT in Case II is due to the 3s
, 3p
, and 3d
electrons of the Zn ion. Note that the existence of the semicore 3s
and 3p
electrons in addition to the 3d
ones is essential for the strong Coulomb repulsion of the Zn ion.
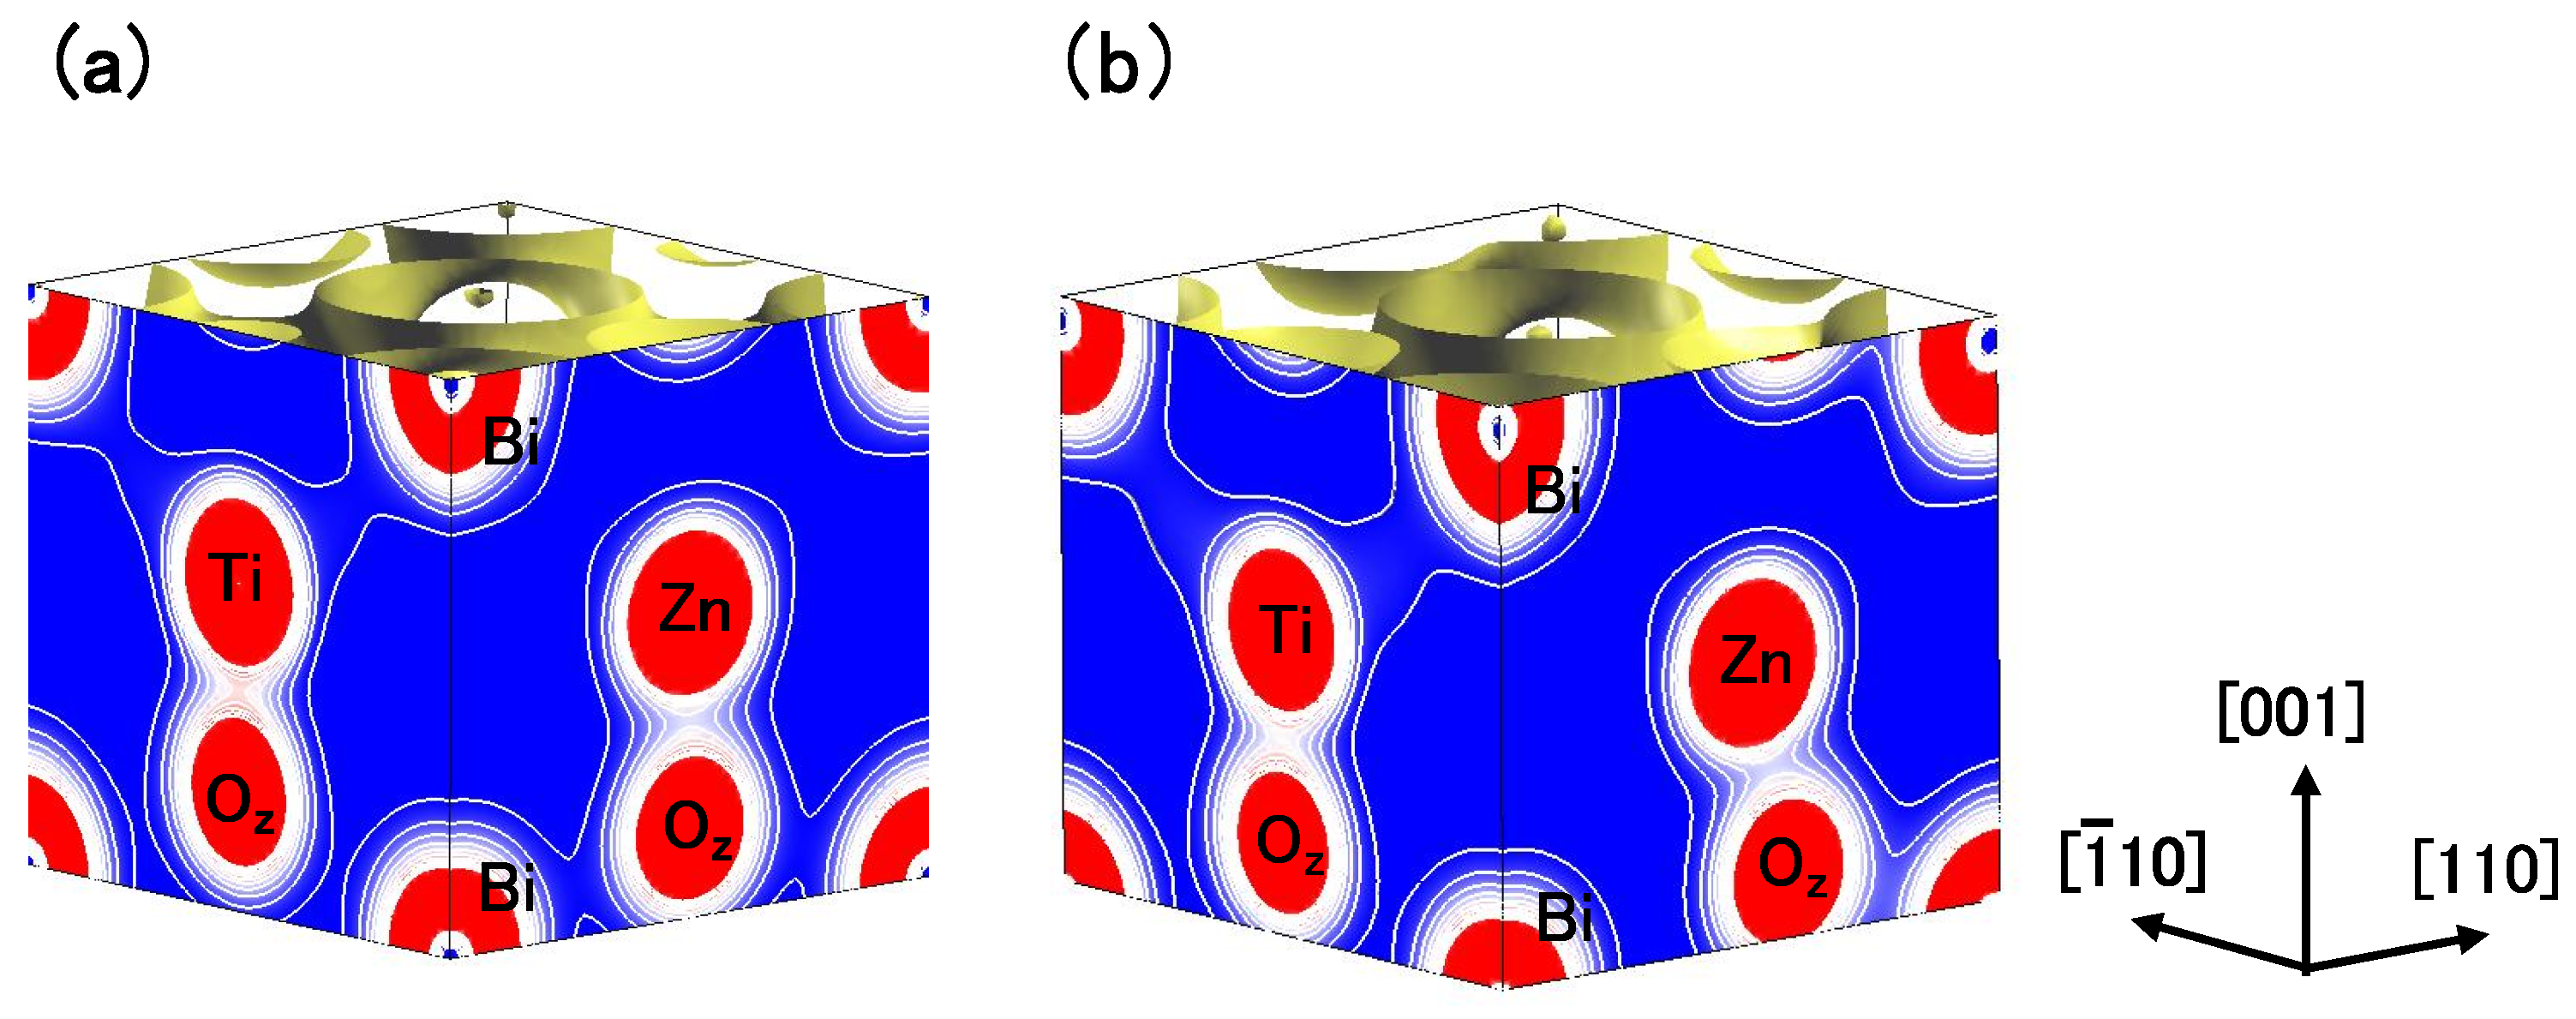
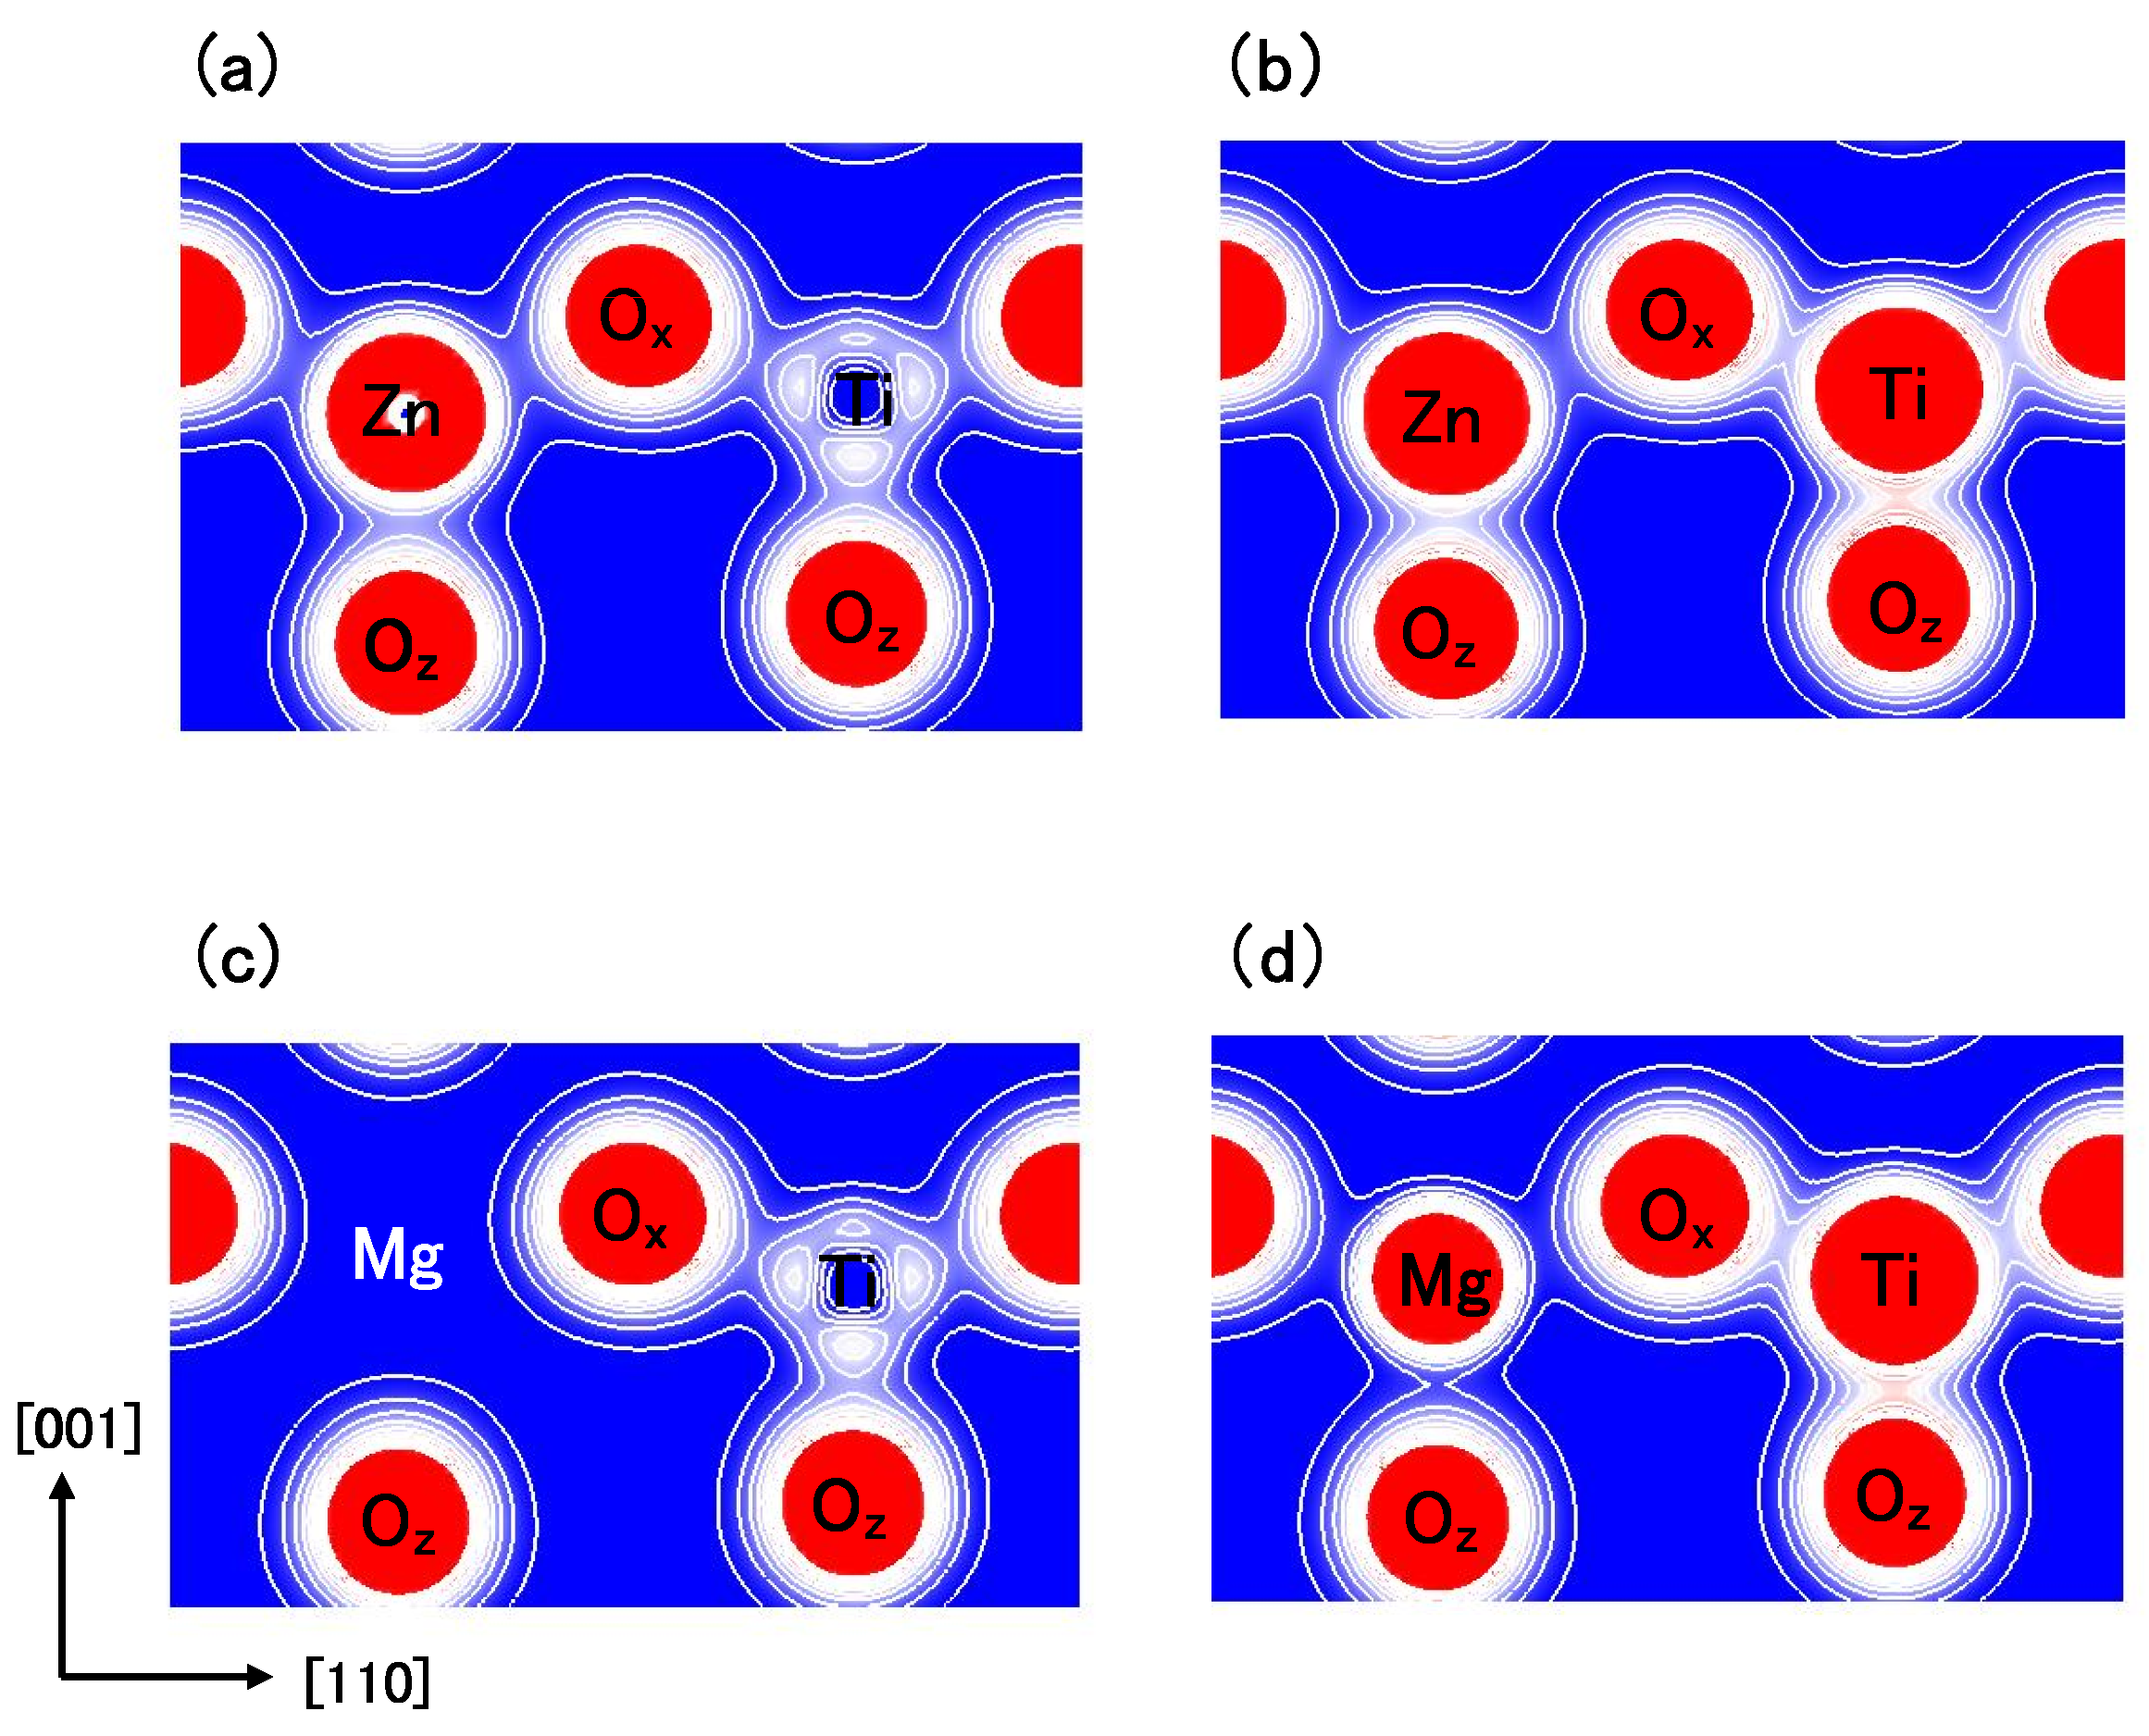
Figure 8(a) and
Figure 8(b) show two-dimensional electron density contour maps of the C-type tetragonal BZT in Cases I and II, respectively. The Coulomb repulsion of Zn–O
in Case II is larger than that in Case I, and the Coulomb repulsion favorably causes Zn ion displacement to O
in Case II. This result is consistent with our previous subsection. In contrast to the properties of Zn–O bondings, the inner coordinations of the Ti ion are similar in both cases, although the electron densities are markedly different. This result suggests that the Coulomb repulsion magnitude of Ti–O
is the same as that of Ti–O
in small Ti–O bonding (≈ 1.8 Å), in both Cases I and II.
Figure 8(c) and
Figure 8(d) show two-dimensional electron density contour maps of the C-type tetragonal BMT in Cases I and II, respectively. Although the electron densities in both cases are markedly different, the inner coordinations of the Mg ion are similar. This result suggests that the Coulomb repulsion between Mg and O is not strong sufficiently for inducing Mg ion displacement even in Case II.
Figure 7.
(
a)
,
, and
of the A-, C-, and G-type tetragonal, monoclinic, and rhombohedral structures; (
b)
,
, and
of the same structures [
18].
Figure 7.
(
a)
,
, and
of the A-, C-, and G-type tetragonal, monoclinic, and rhombohedral structures; (
b)
,
, and
of the same structures [
18].
Figure 8.
Two-dimensional electron density contour maps of monoclinic (
a) BZT in Case I; (
b) BZT in Case II; (
c) BMT in Case I, and (d) BMT in Case II. The electron density increases as color changes from blue to red via white. Contour curves are drawn from 0.2 to 2.0
e/
with increments of 0.2
e/
[
18].
Finally in this subsection, we discuss the difference in the electronic structures between the C-type tetragonal and the monoclinic BZT.
Figure 9(a) and
Figure 9(b) show the electron density contour maps of the C-type tetragonal BZT and that of the monoclinic BZT in Case II, respectively. This result suggests that the strong Coulomb repulsion between Zn and O
causes the small Zn ion displacement in the [
0] direction in the monoclinic BZT, which makes the Coulomb repulsion of Zn–O
weaker than that in the C-type tetragonal BZT. As a result, this small Zn ion displacement makes the monoclinic BZT more stable than the C-type tetragonal structure.
Figure 9.
Two-dimensional electron density contour maps of BZT in Case II (
a) C-type tetragonal and (
b) monoclinic. The electron density increases as color changes from blue to red via white. Contour curves are drawn from 0.2 to 2.0
e/
with increments of 0.2
e/
[
18].
Figure 9.
Two-dimensional electron density contour maps of BZT in Case II (
a) C-type tetragonal and (
b) monoclinic. The electron density increases as color changes from blue to red via white. Contour curves are drawn from 0.2 to 2.0
e/
with increments of 0.2
e/
[
18].


