Effects of Portland Cement and Polymer Powder on the Properties of Cement-Bound Road Base Mixtures


Abstract
1. Introduction
2. Materials
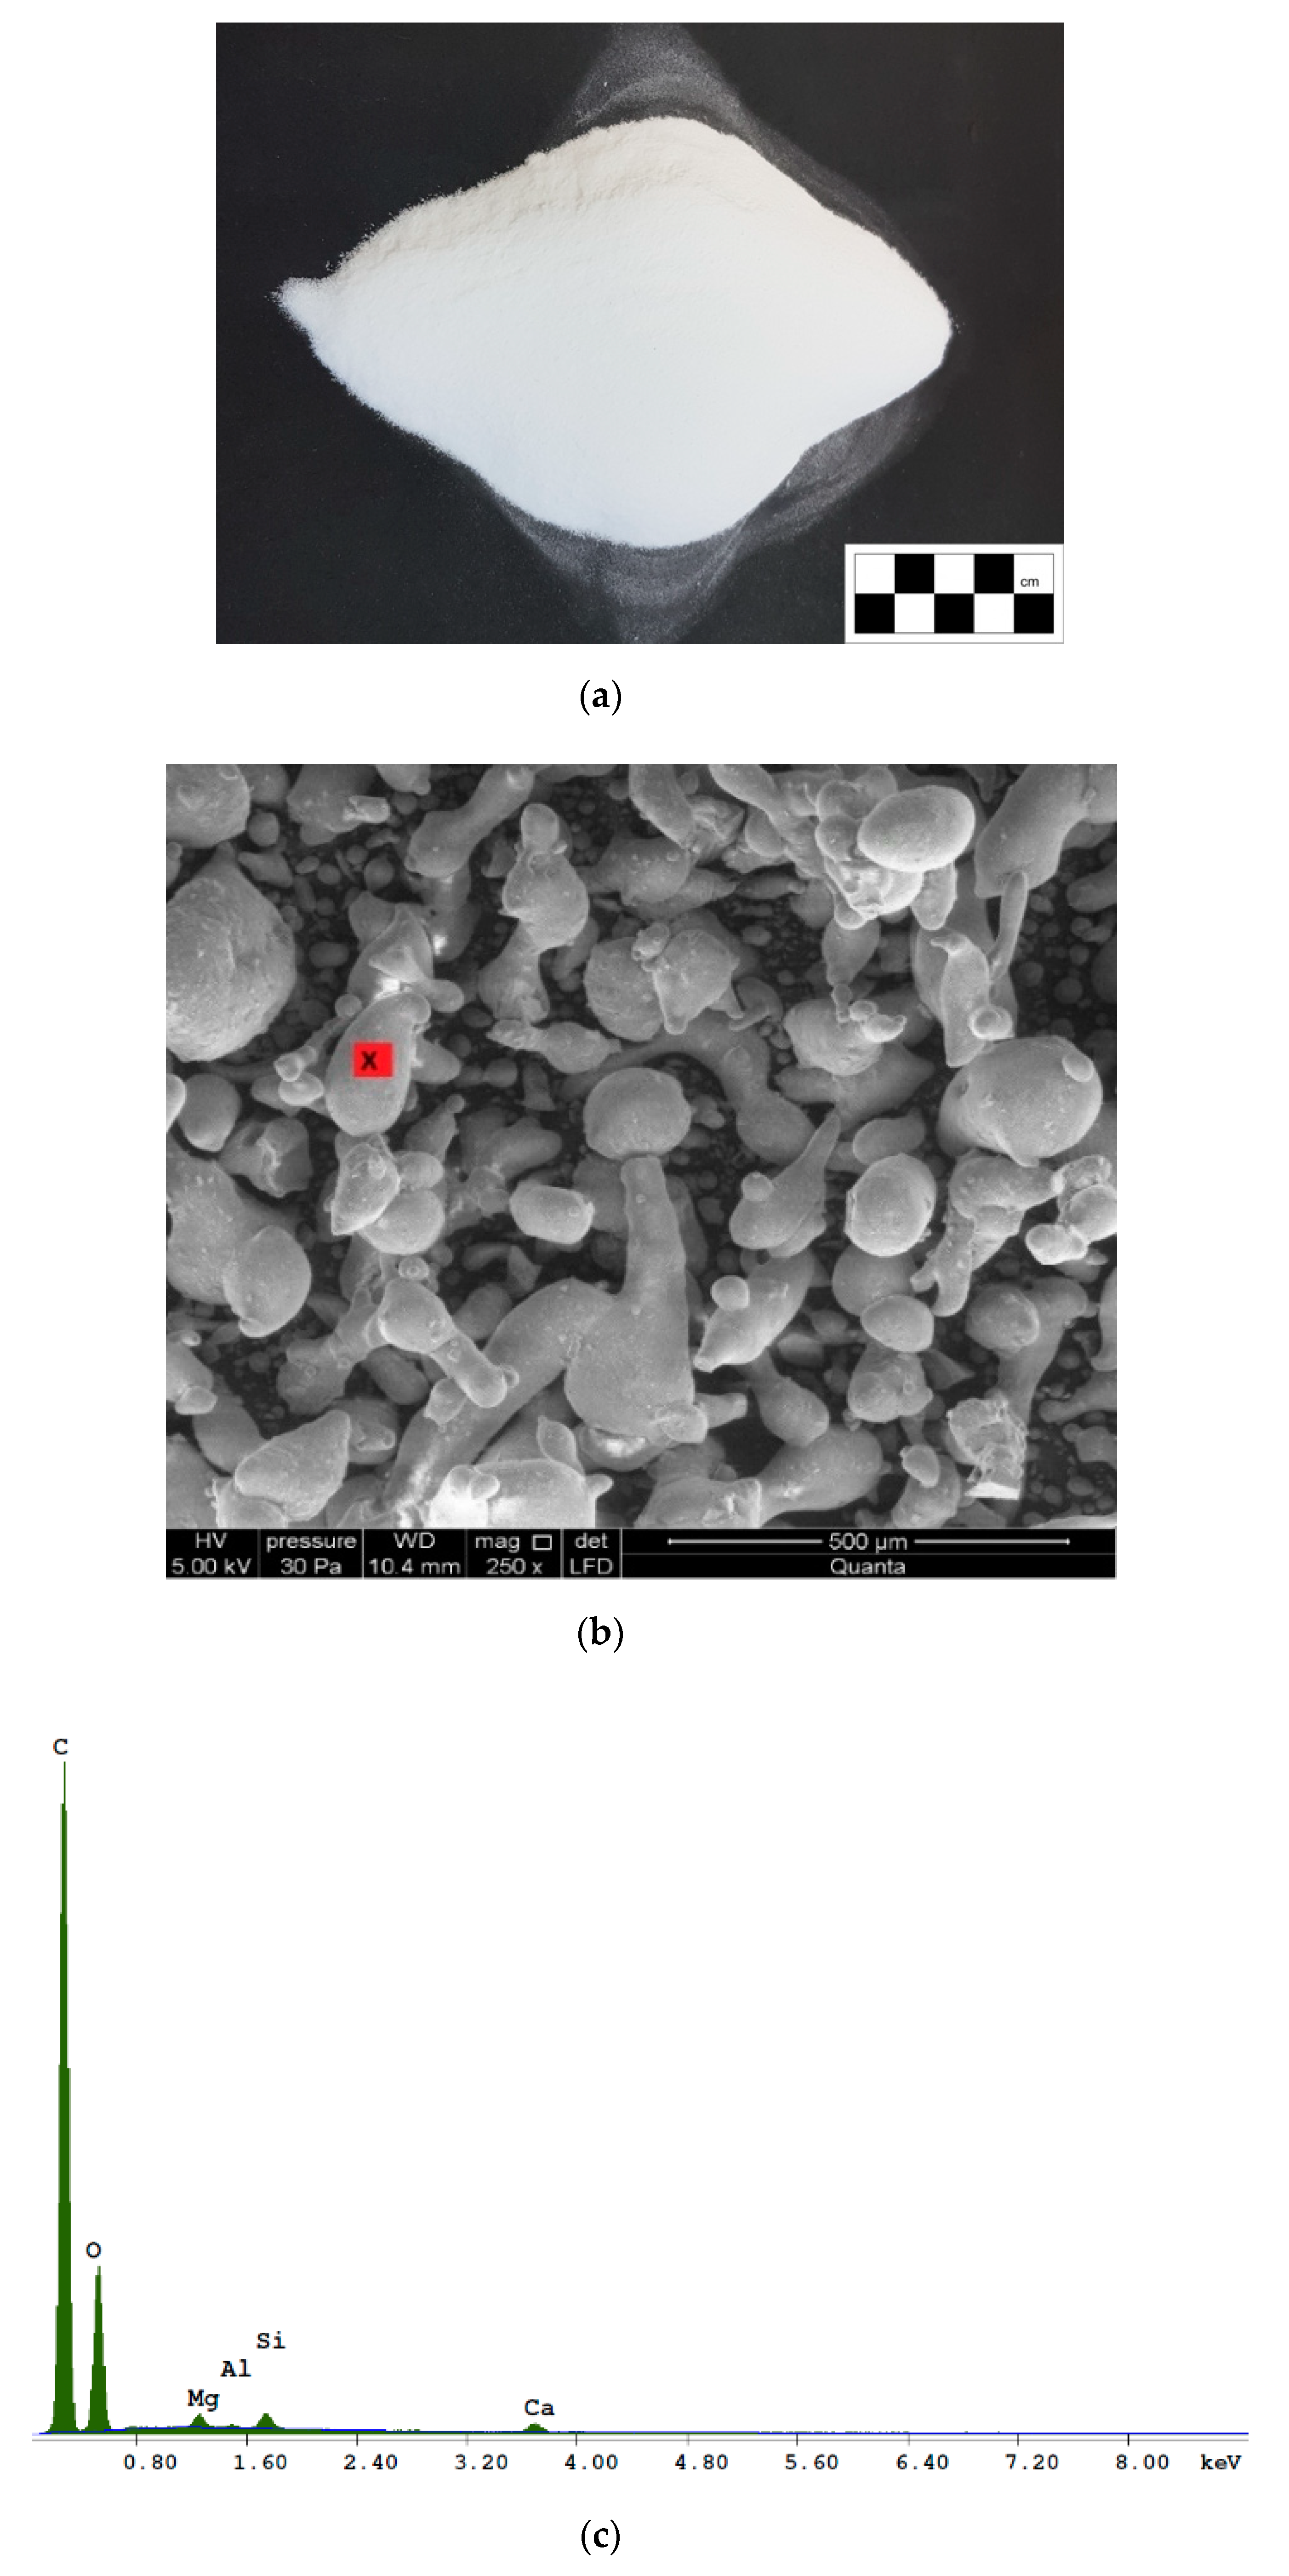
2.1. Polymer Powder
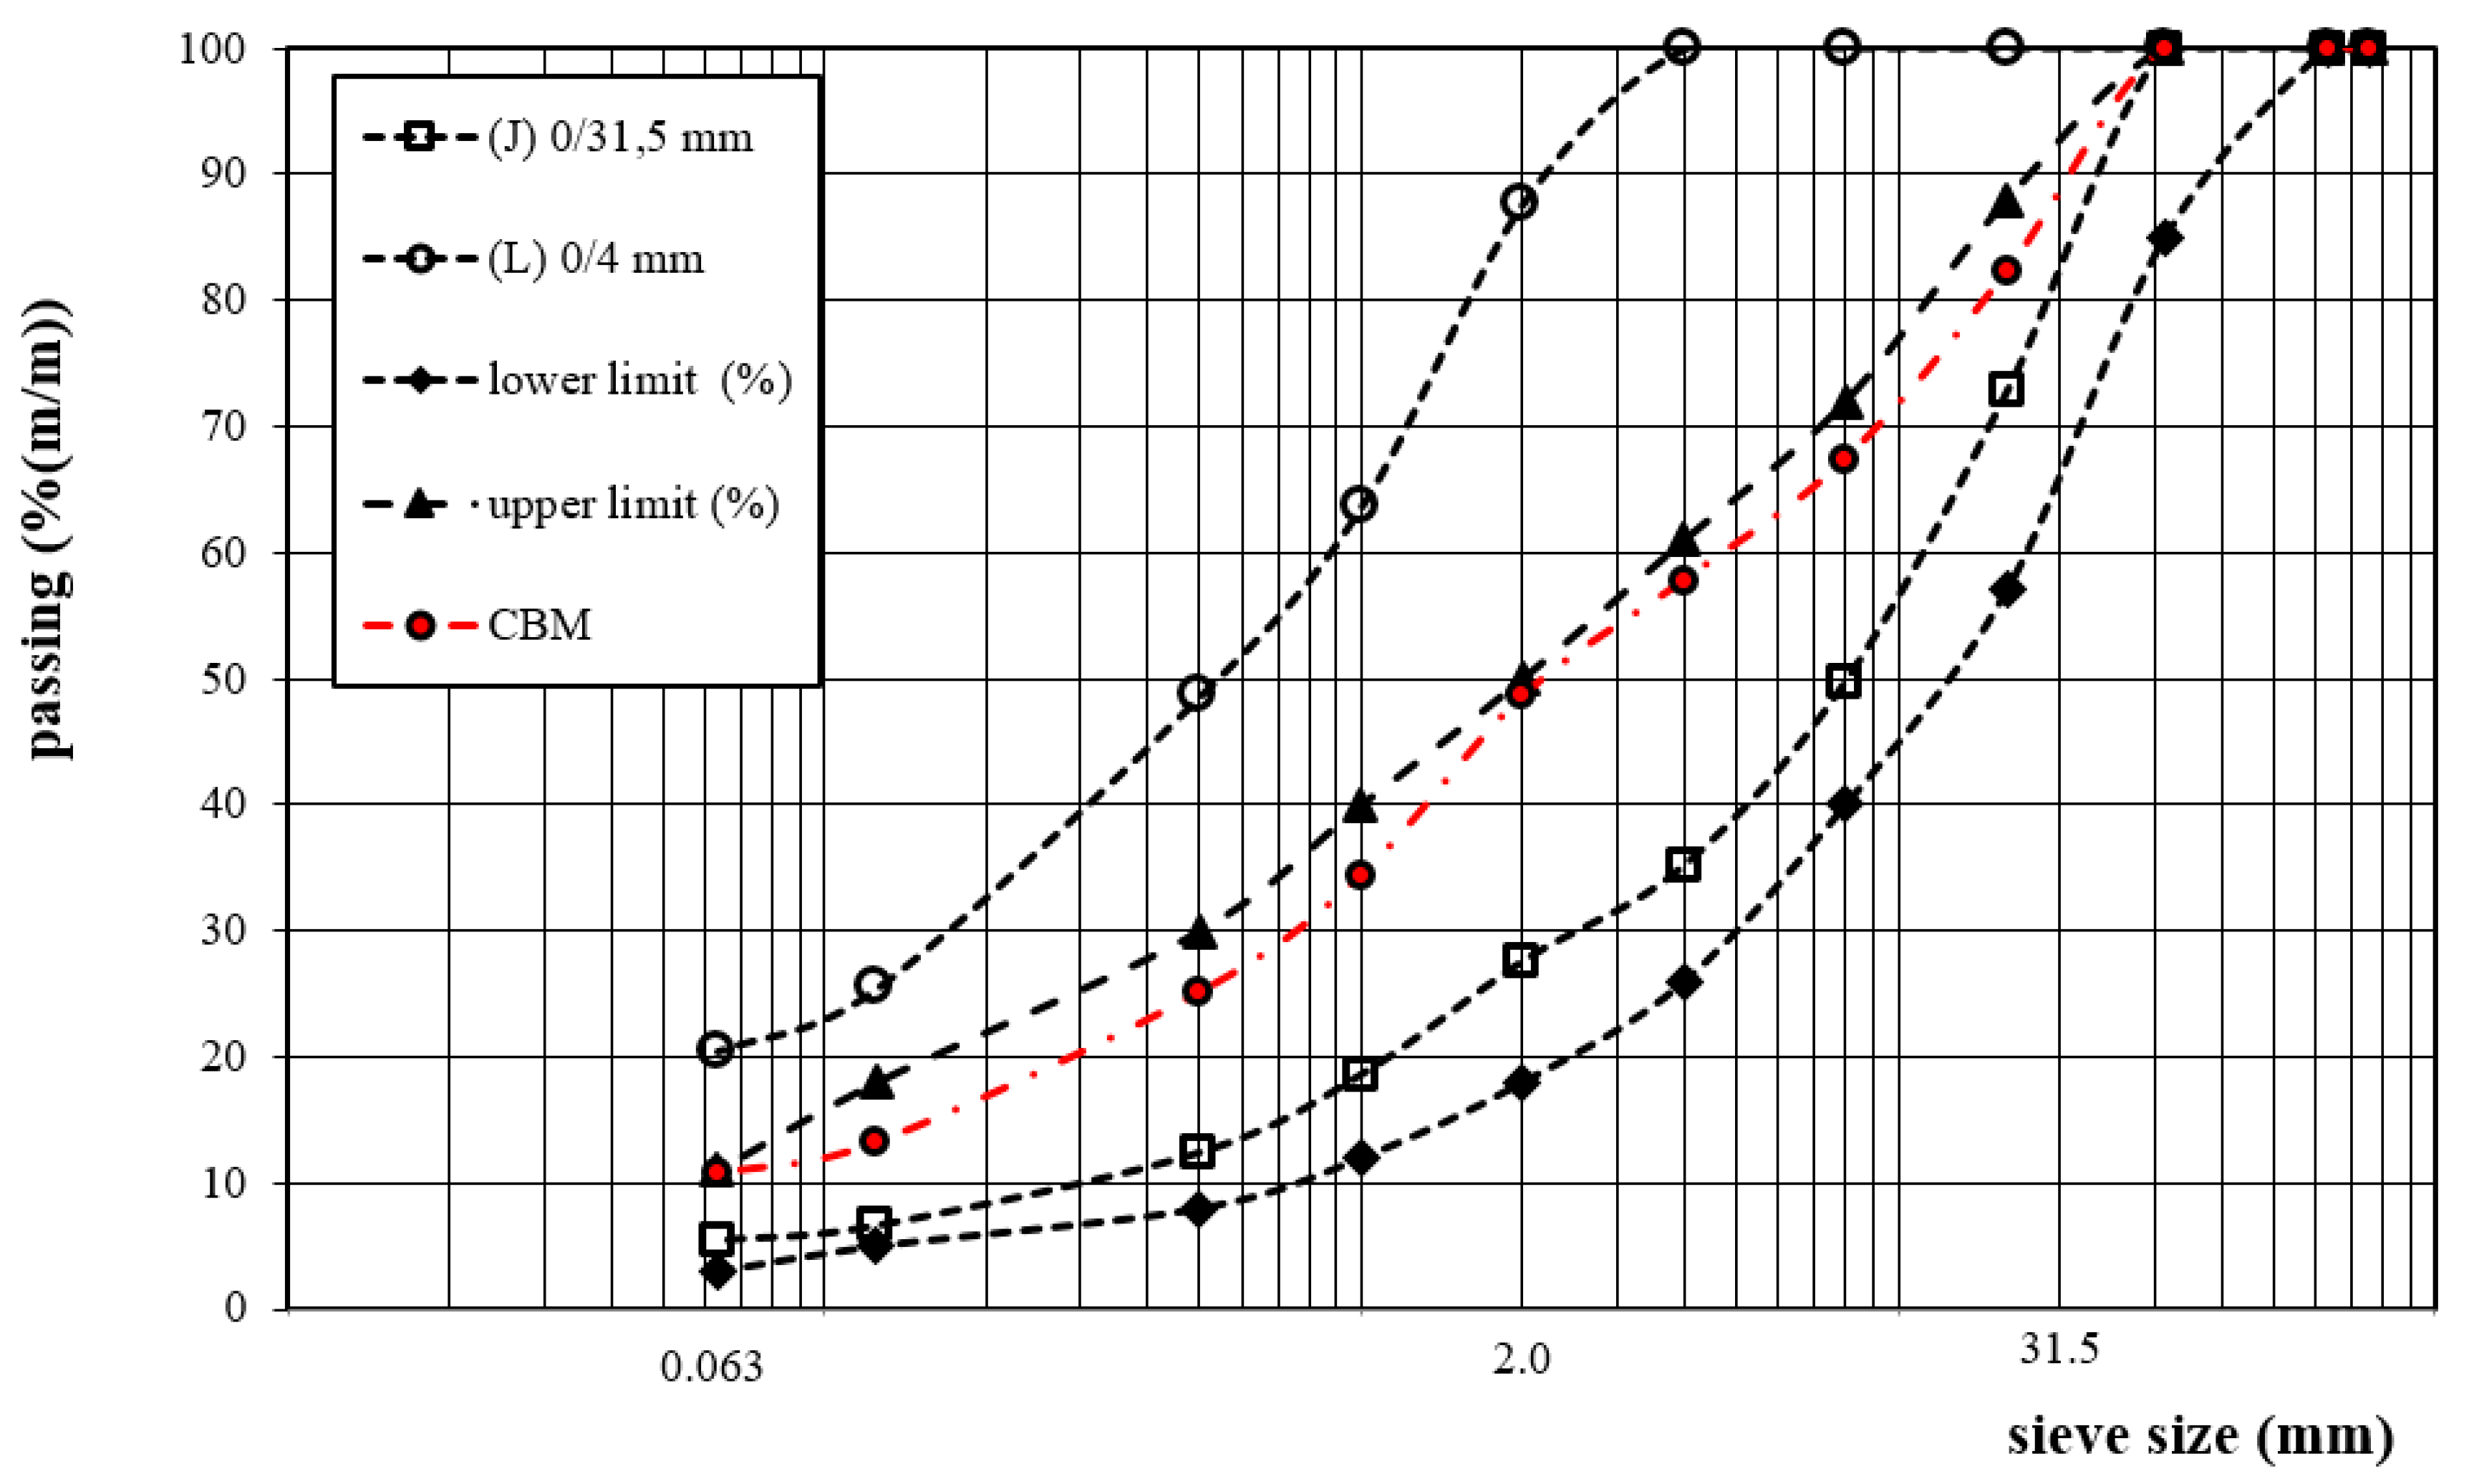
2.2. Aggregate
2.3. Hydraulic Binder
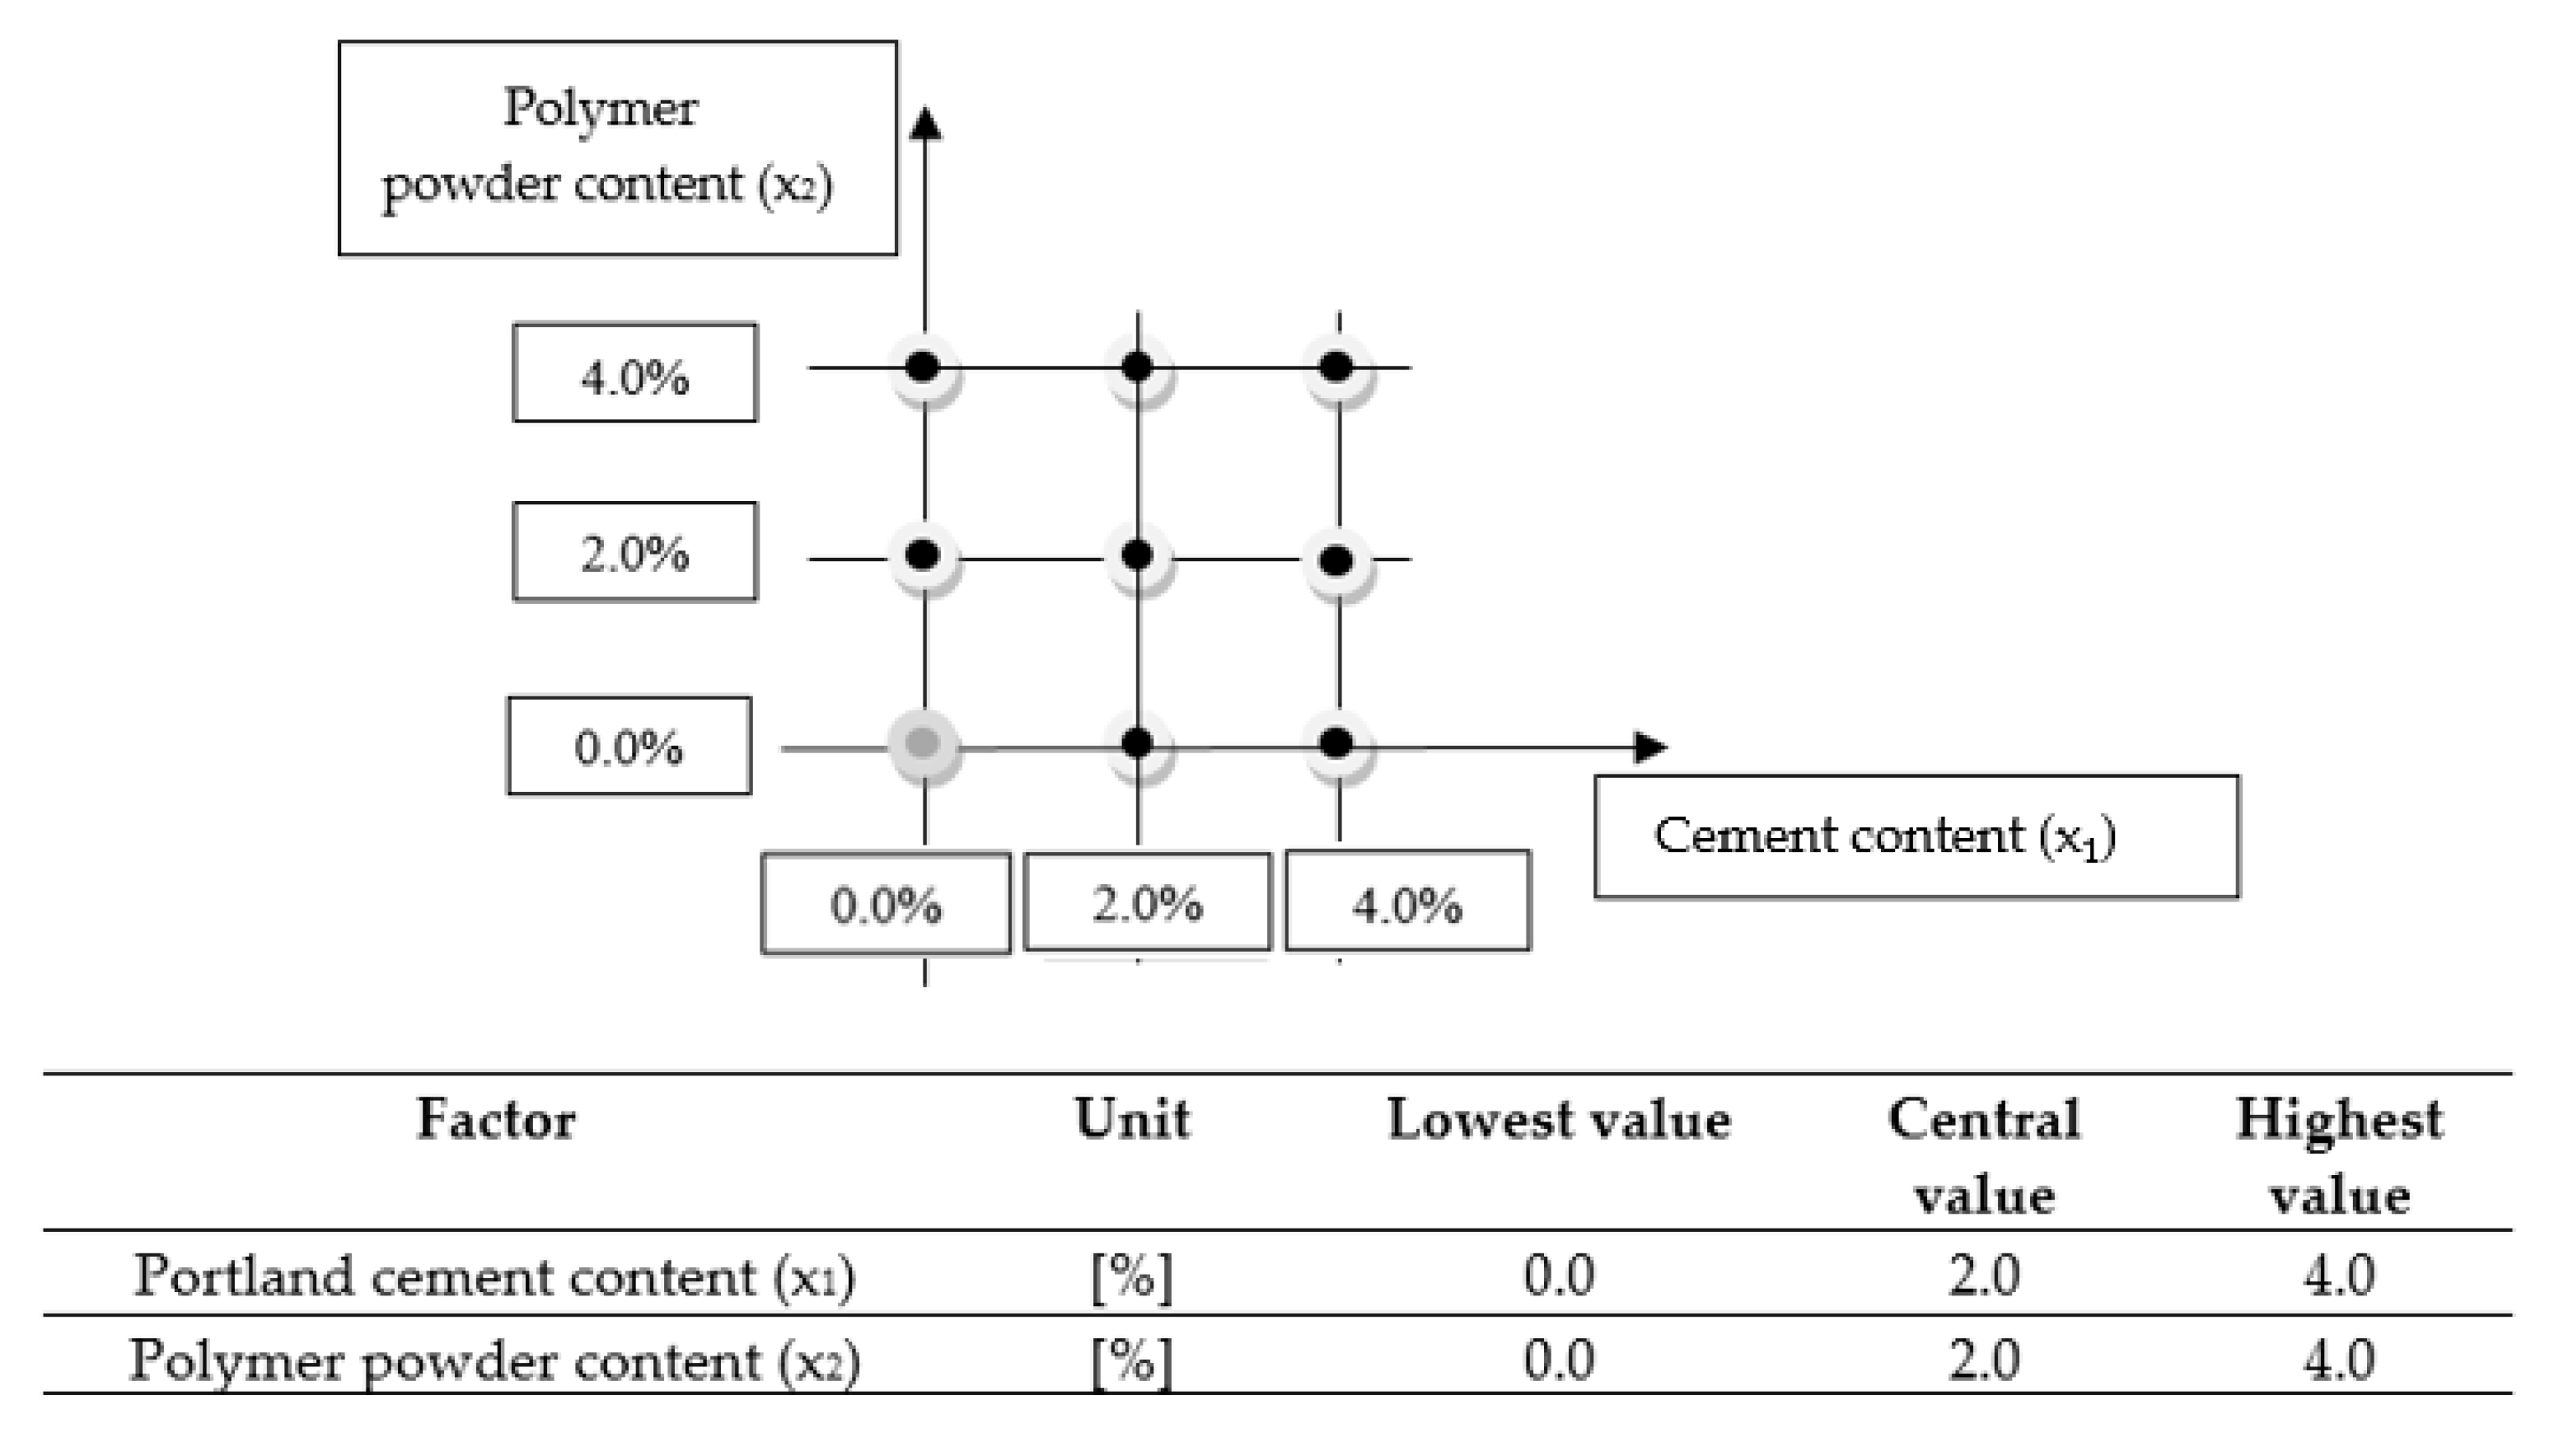
3. Experimental Design
4. Testing Plan
4.1. Physical and Mechanical Properties
4.1.1. Bulk Density—SSD
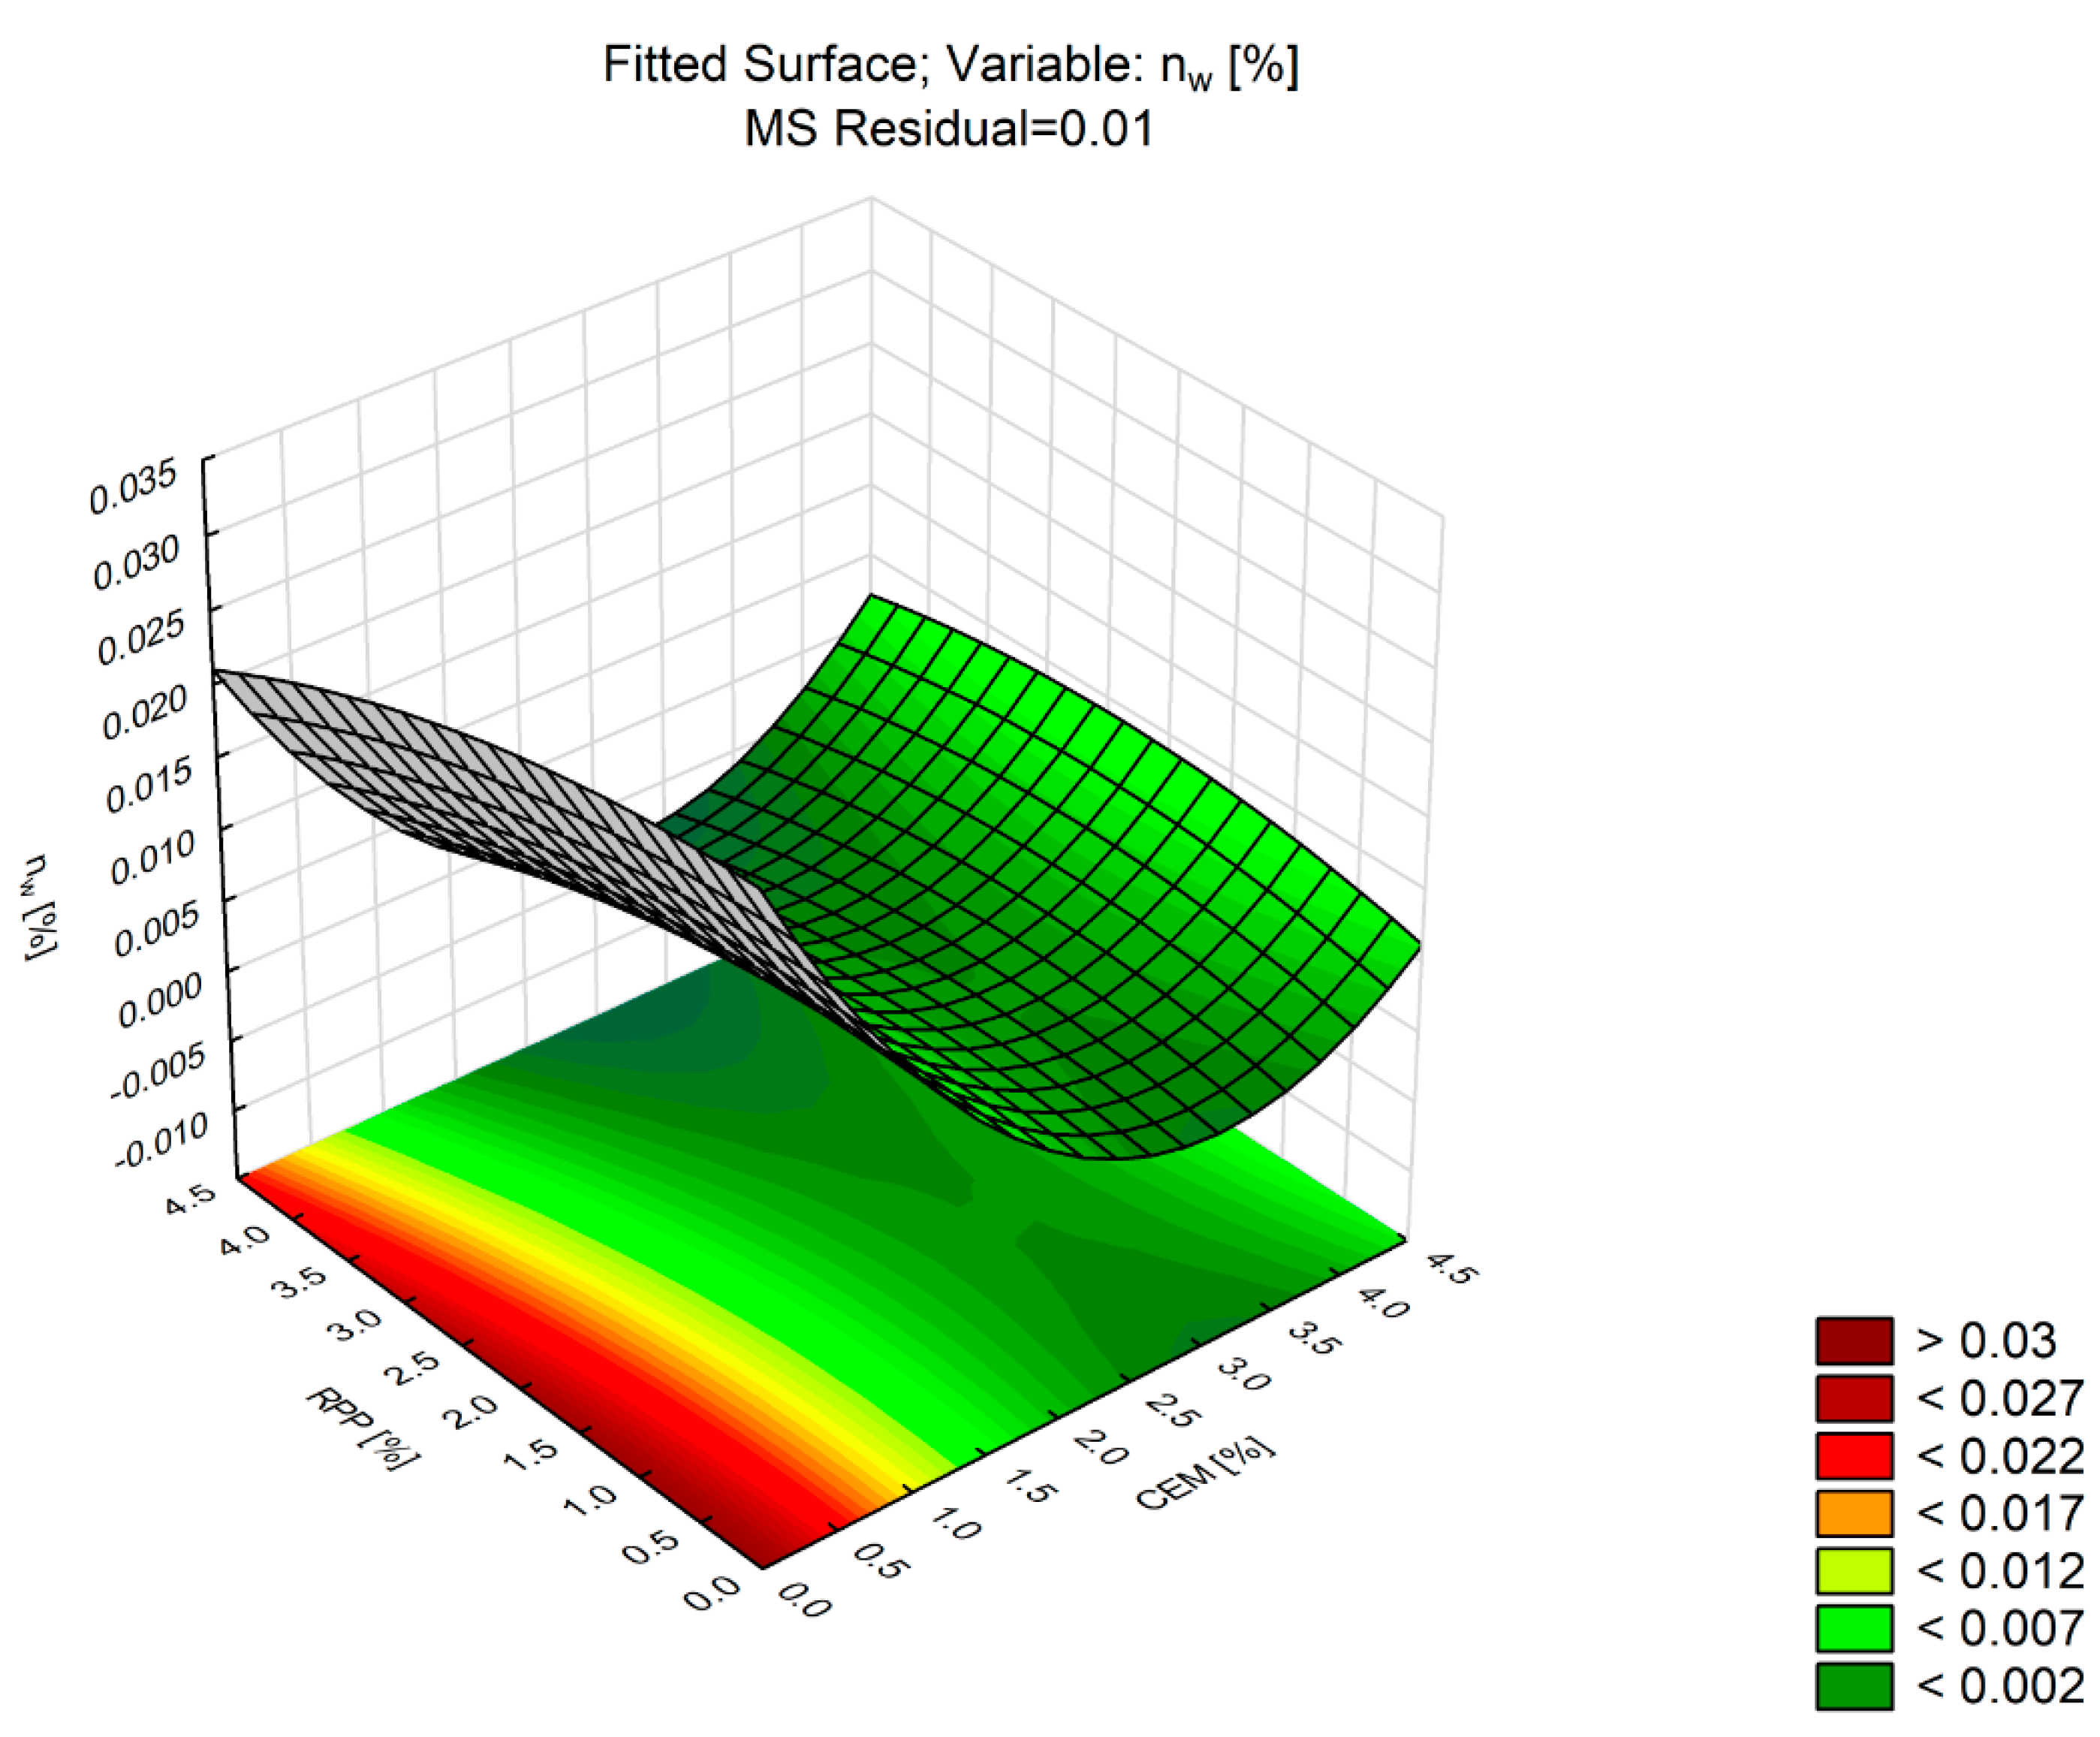
4.1.2. Water Absorption by Weight (nw)
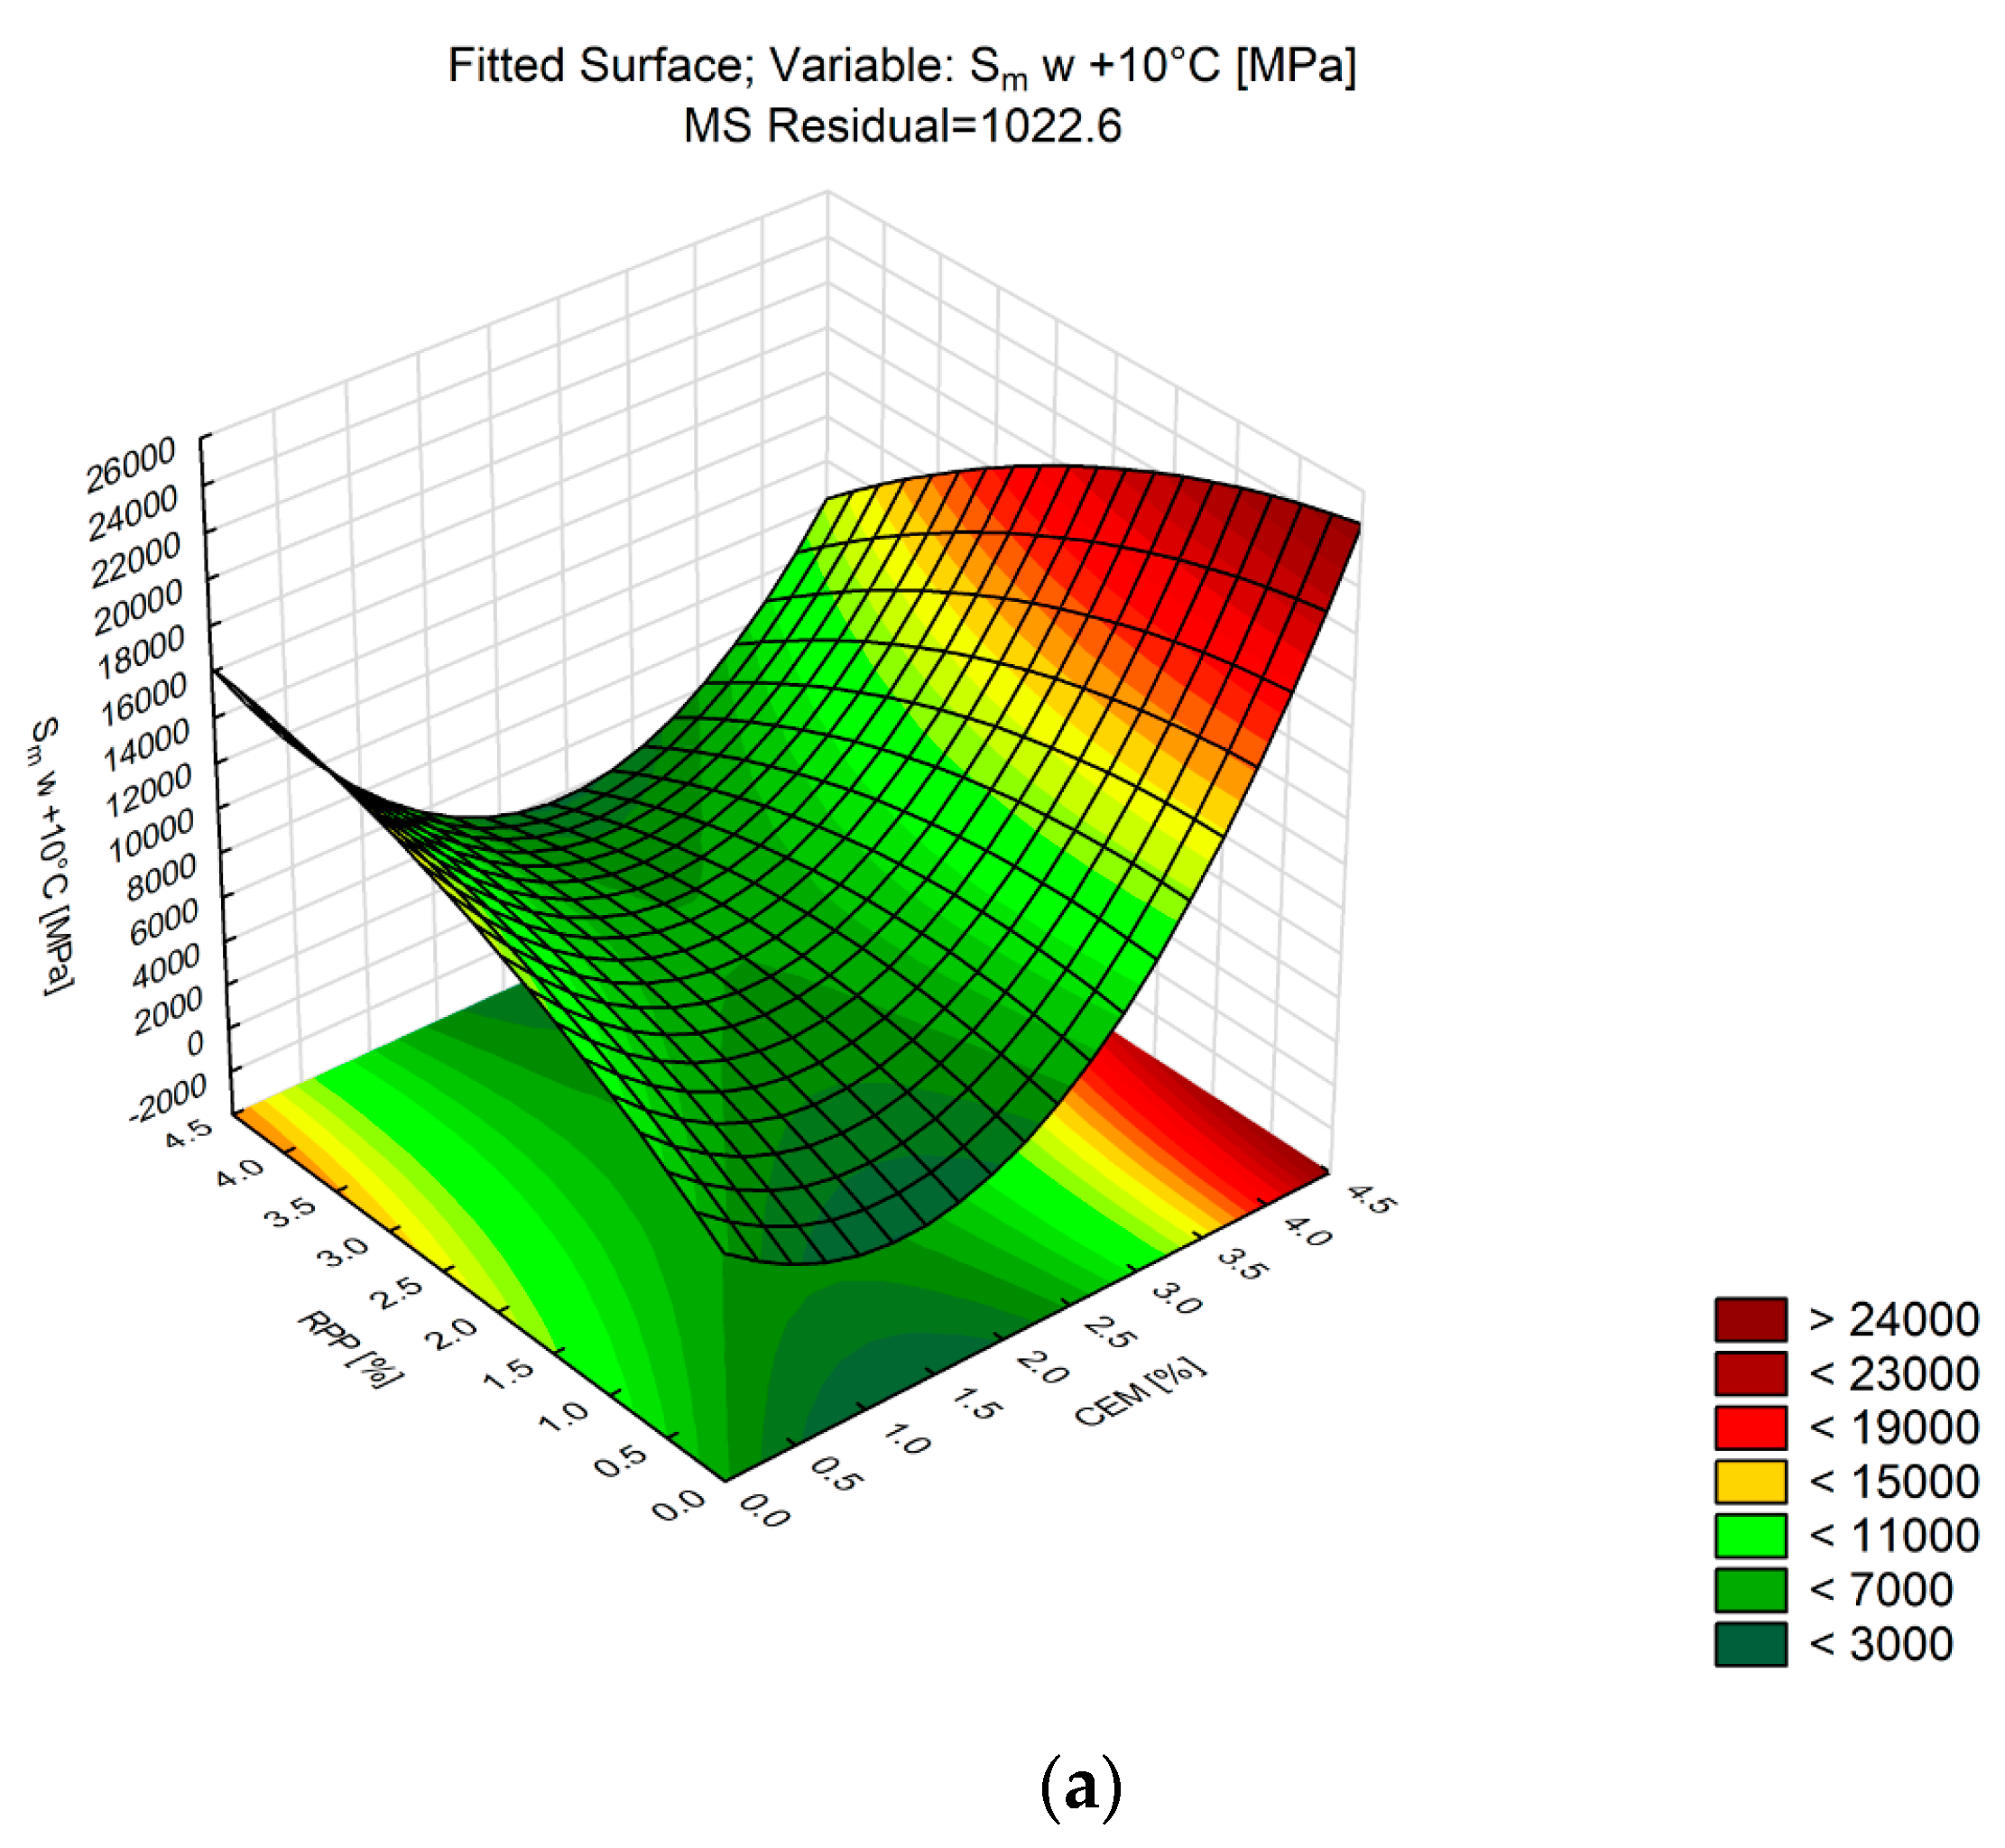
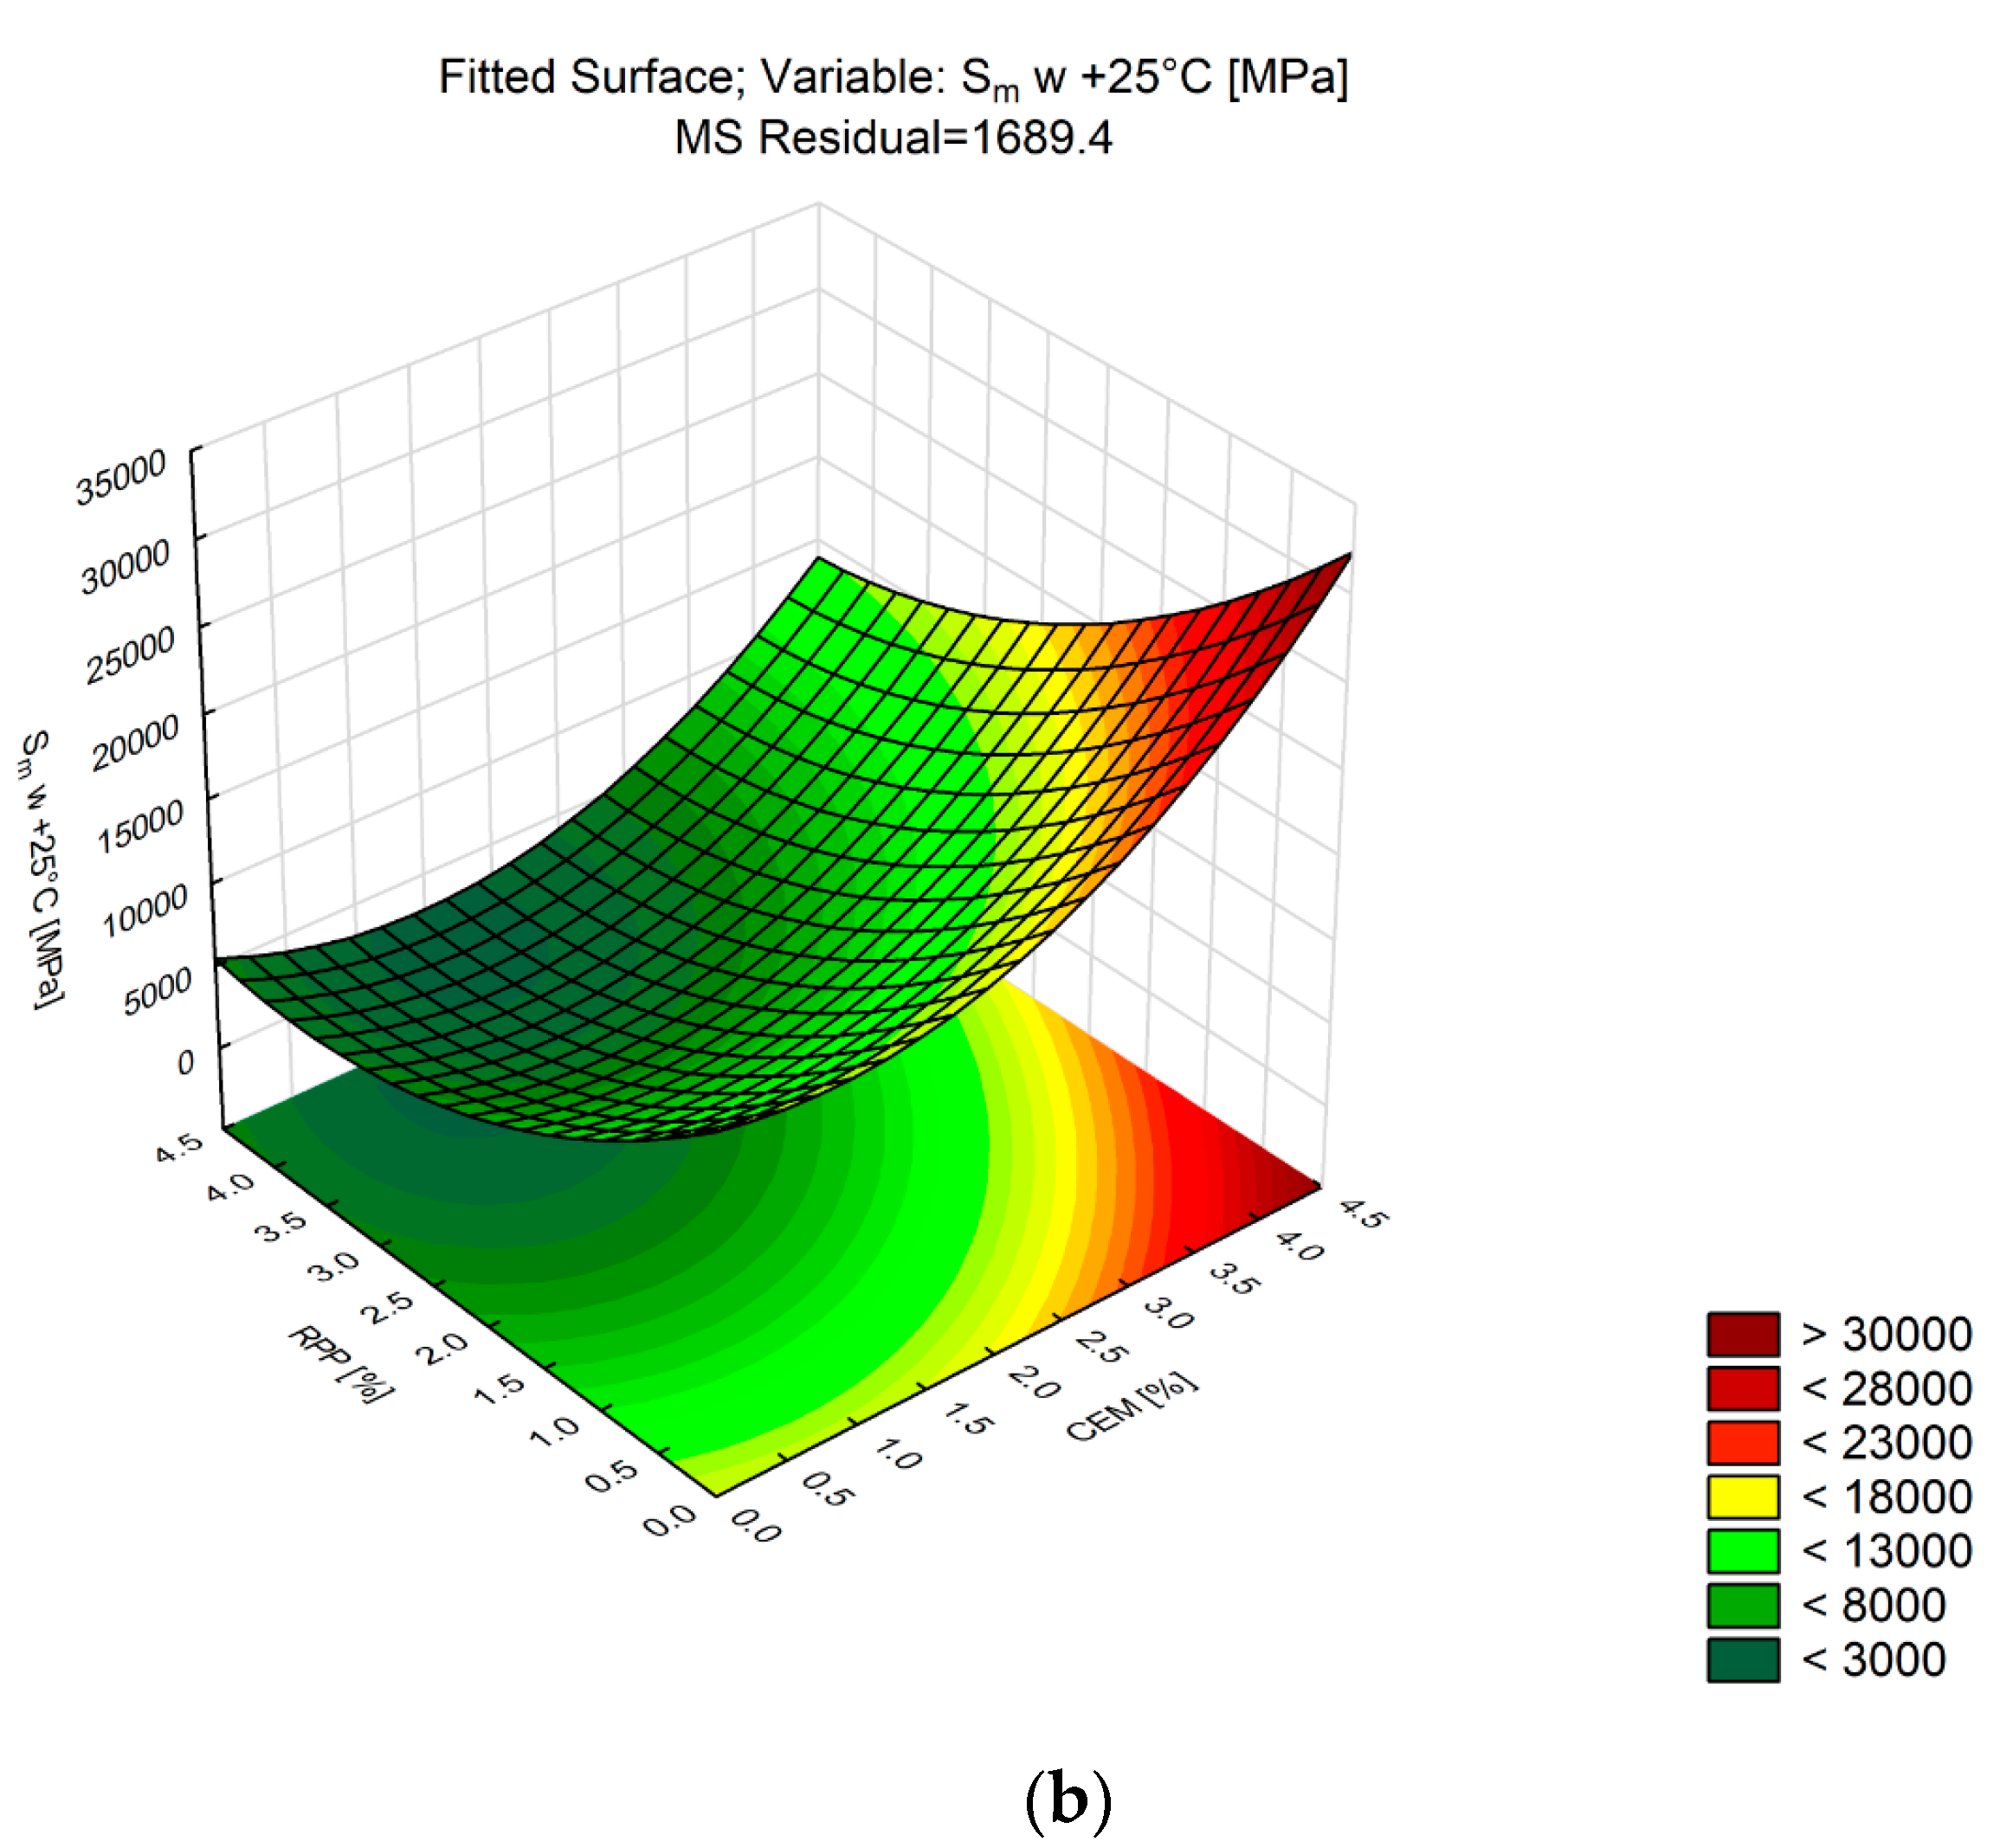
4.1.3. Stiffness Modulus (Sm)
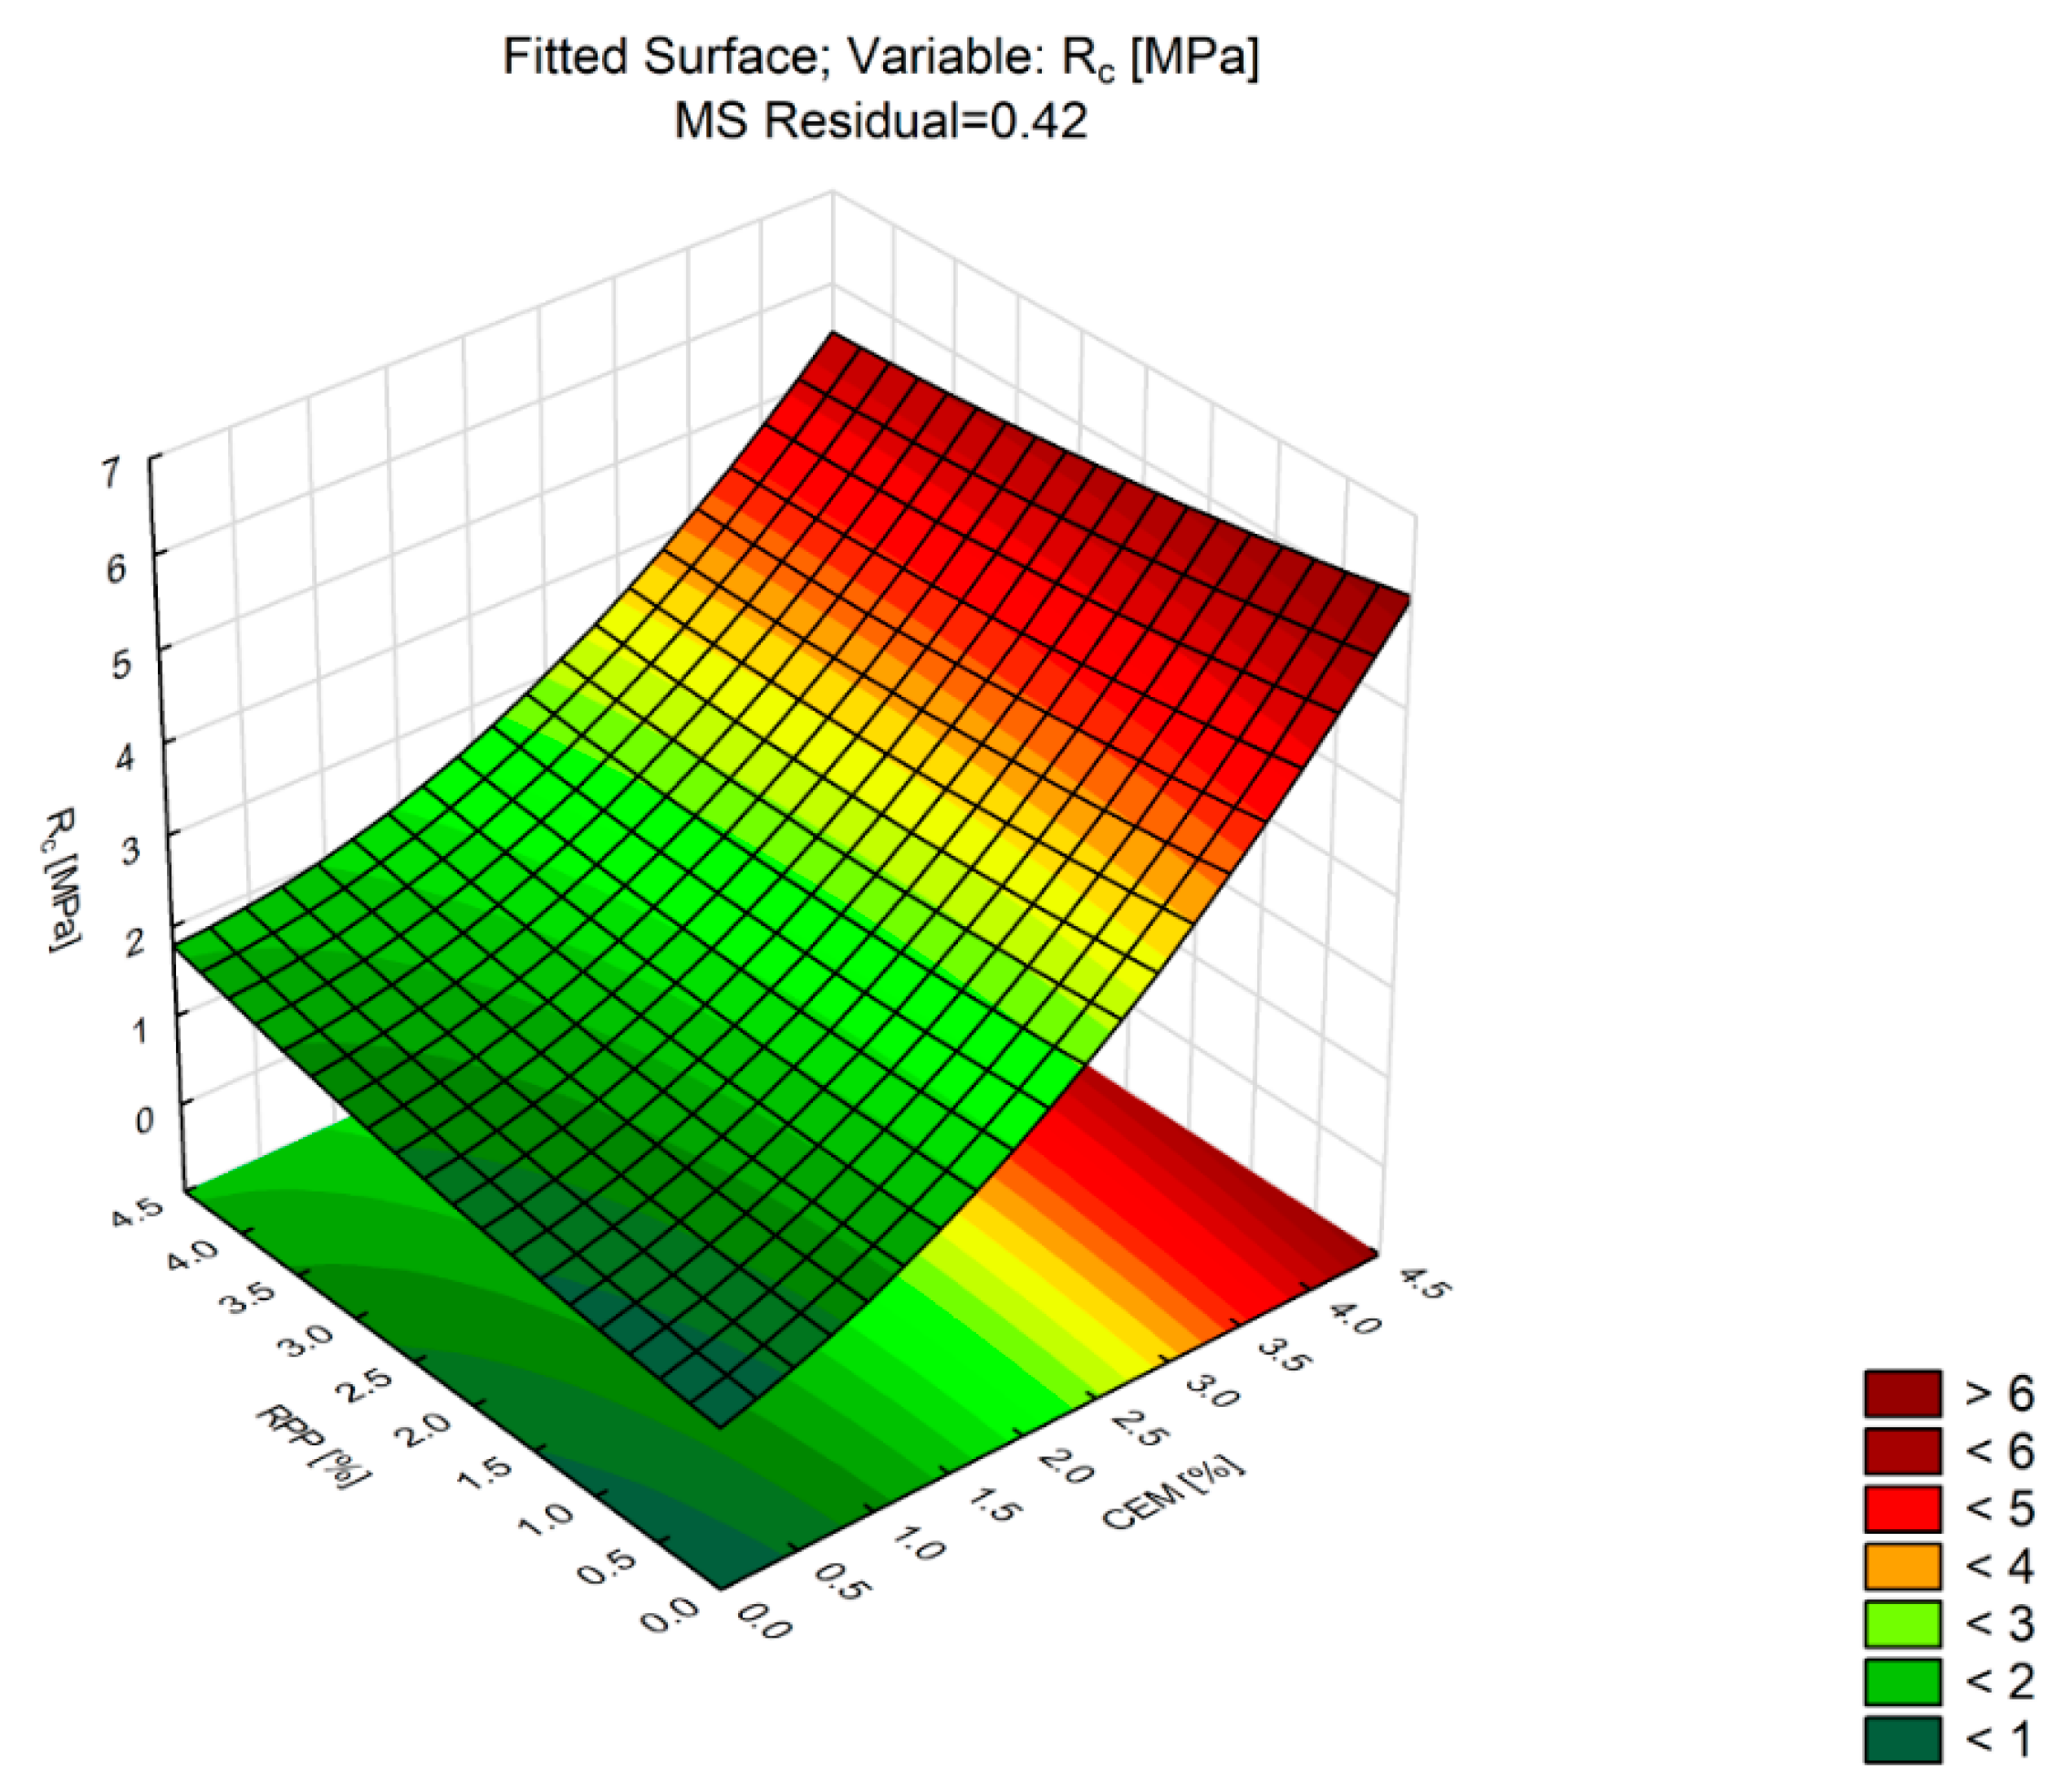
4.1.4. Compressive Strength (RC)
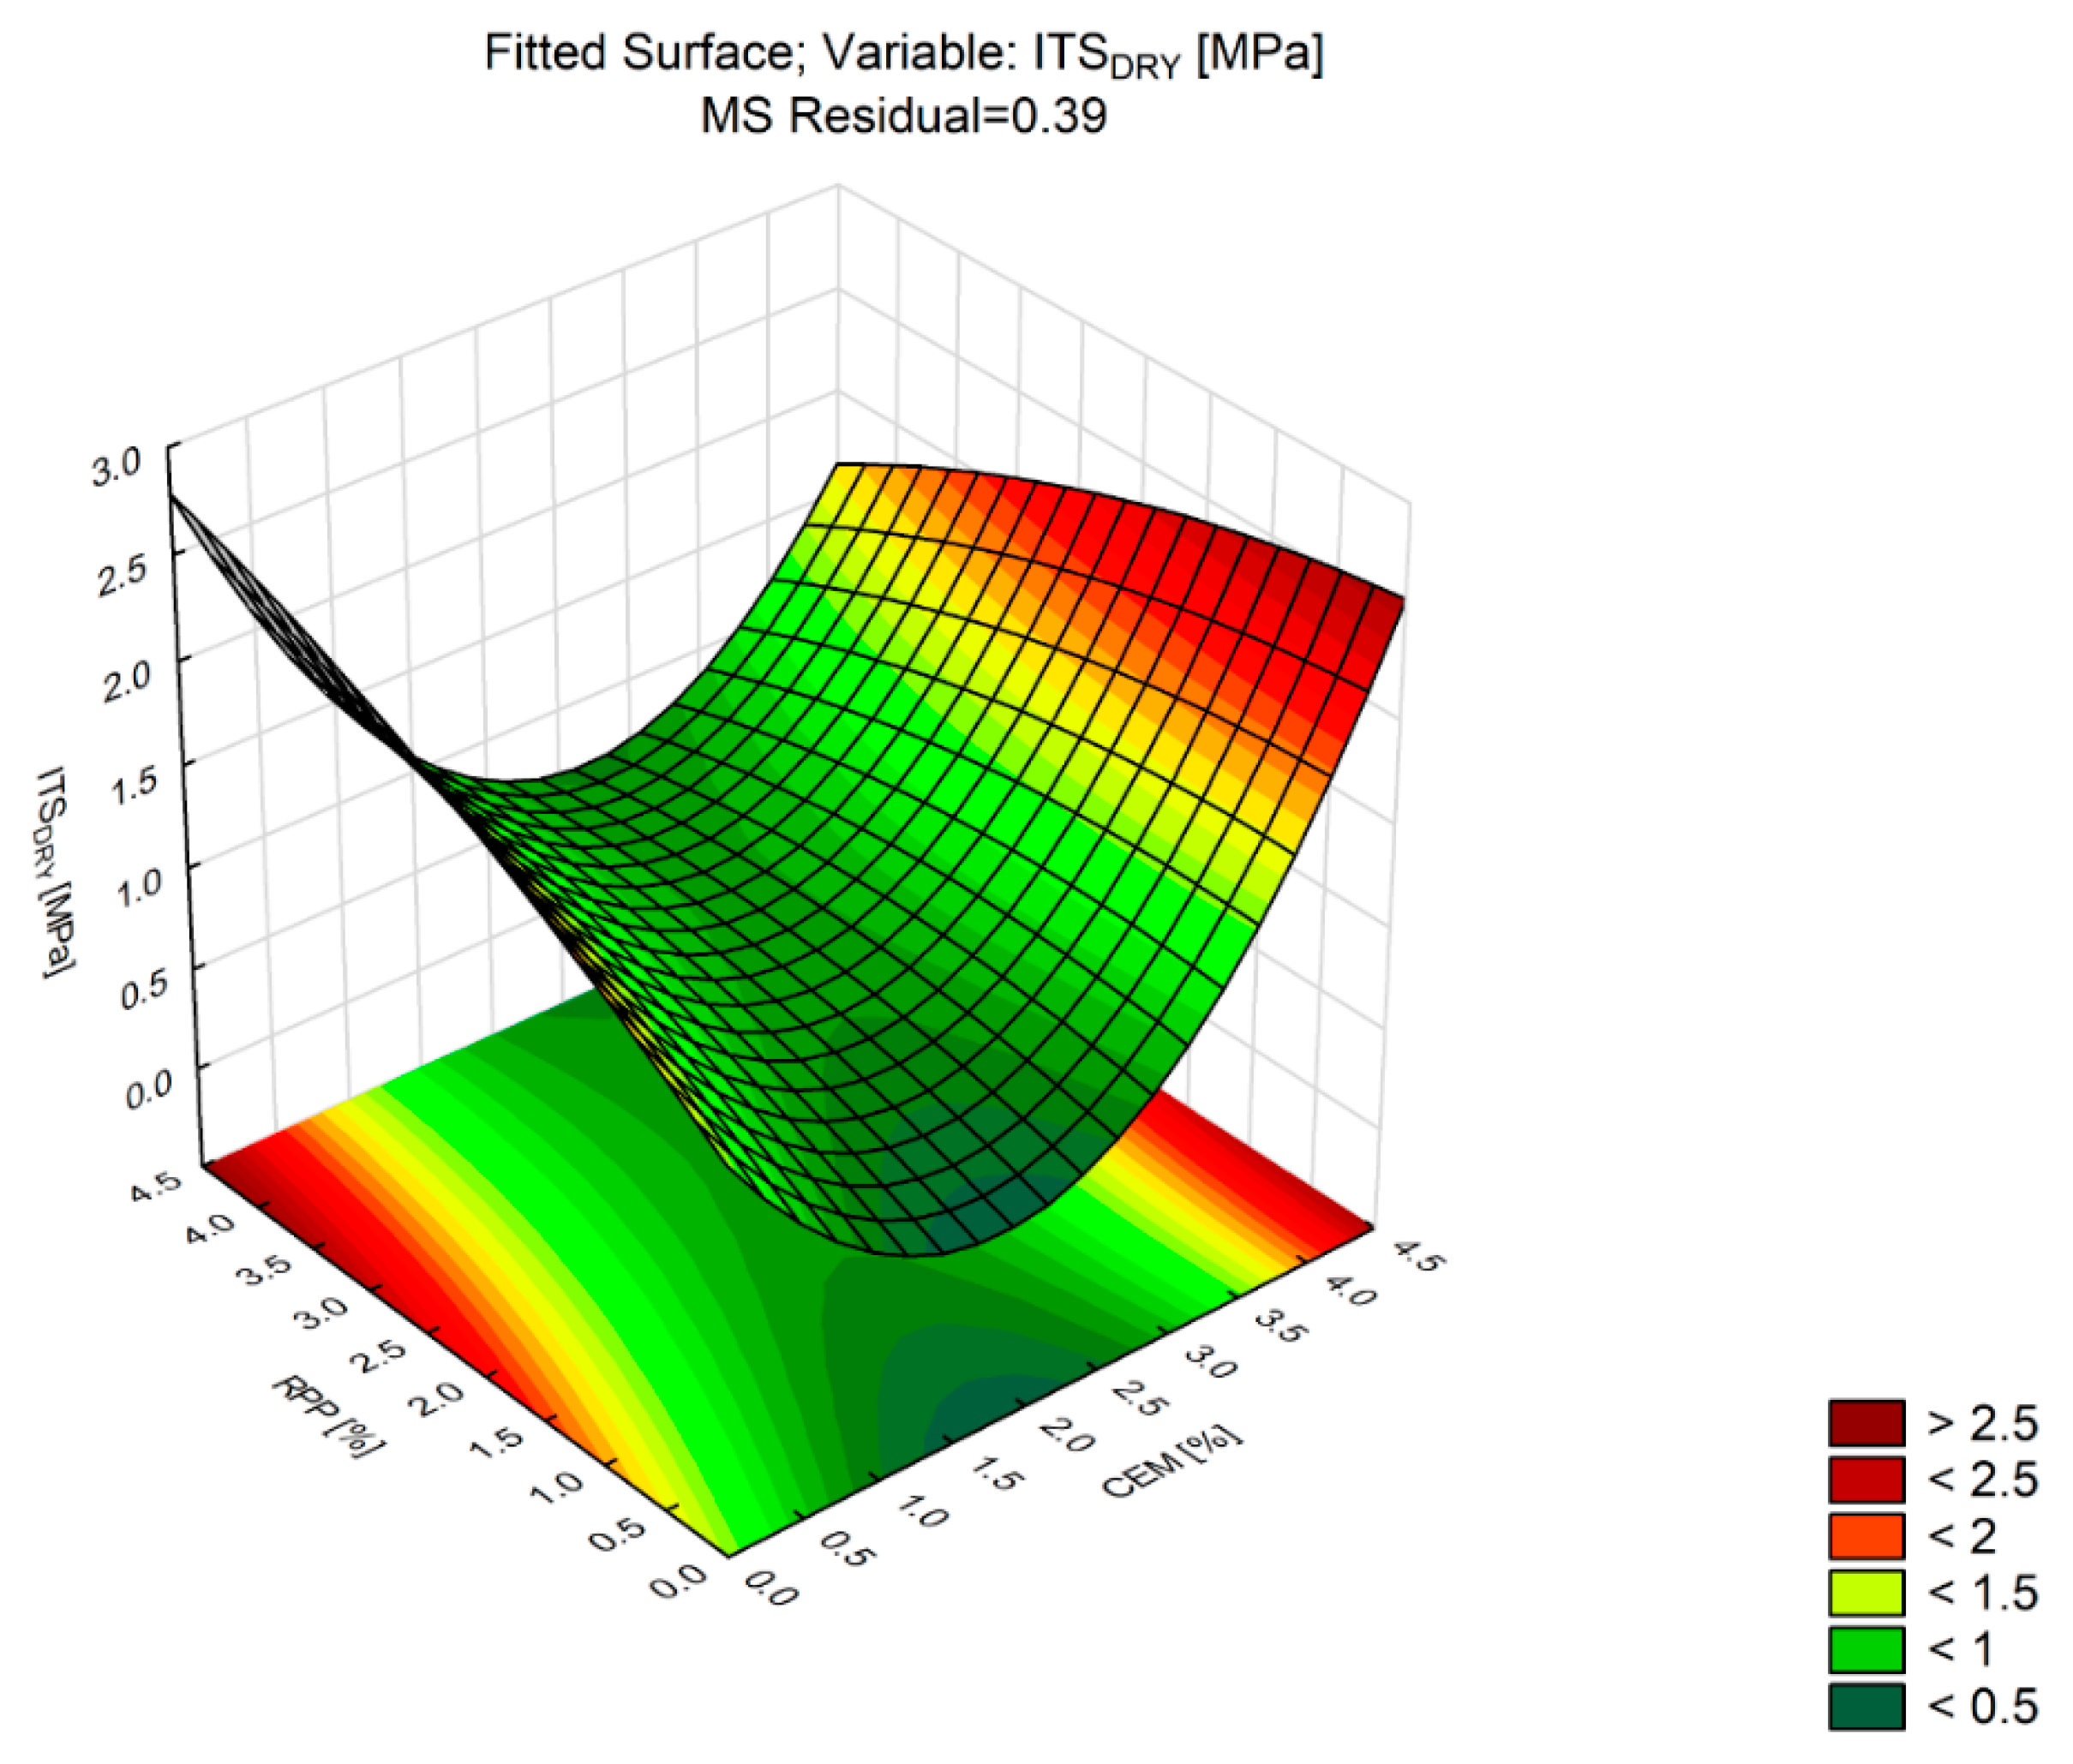
4.1.5. Indirect Tensile Strength (ITSDRY)
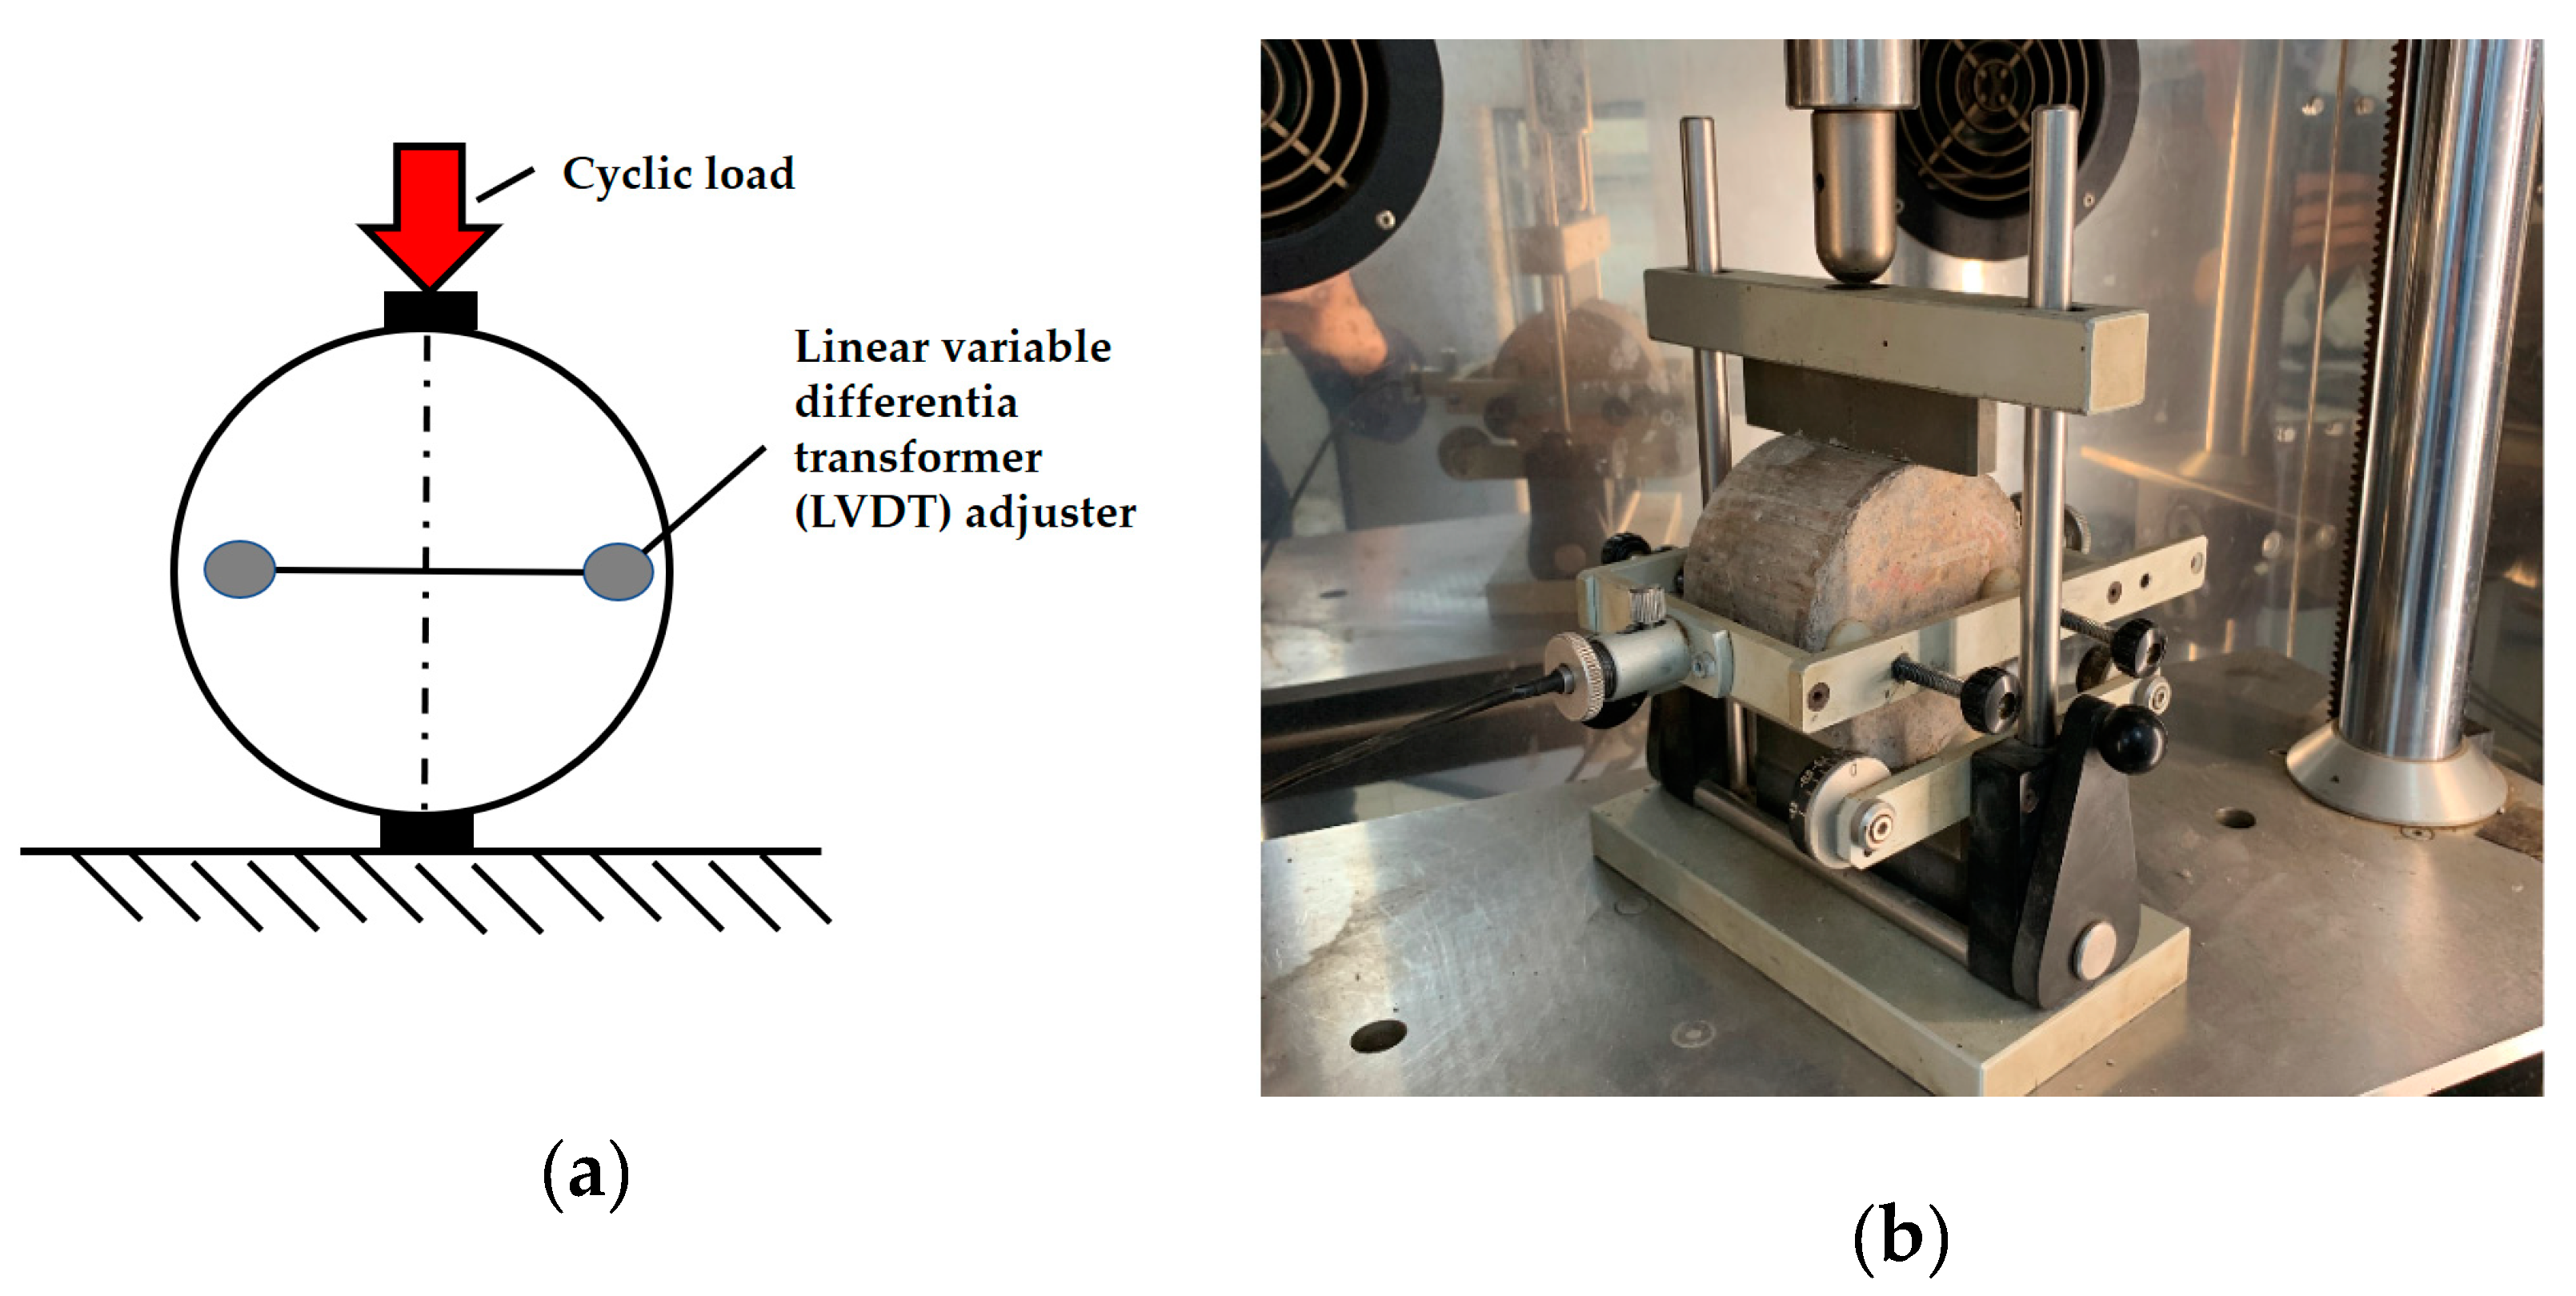
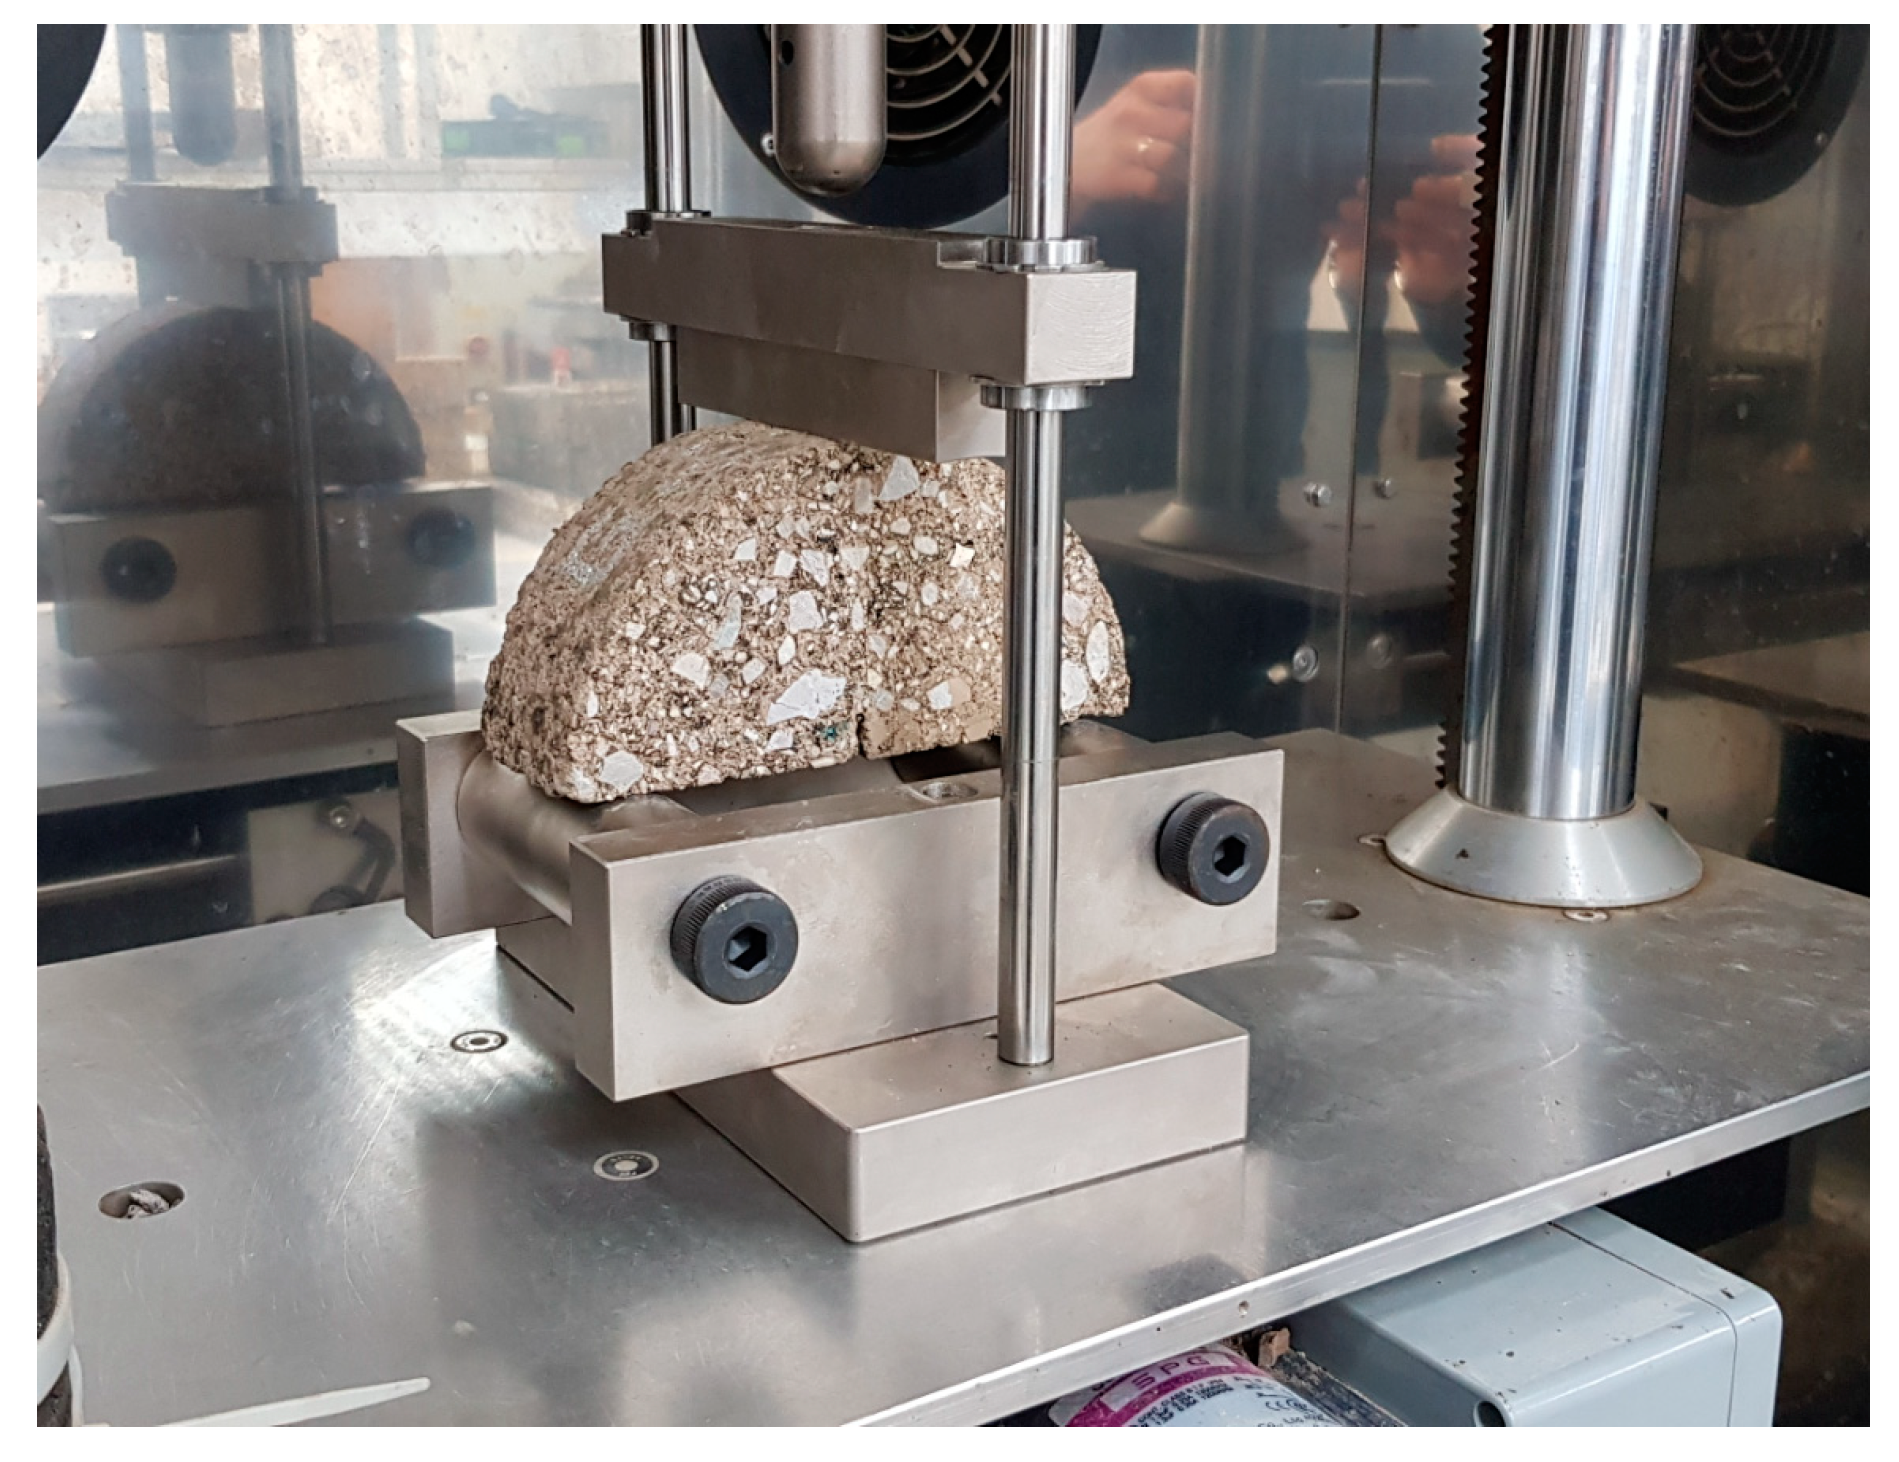
4.2. Crack Propagation in the SCB Test
5. Mixture Design and Test Specimen Preparation
5.1. Mixture Design
5.2. CBGM Preparation and Curing
6. The Microstructure of Cement–Polymer Composite
7. Results and Analysis
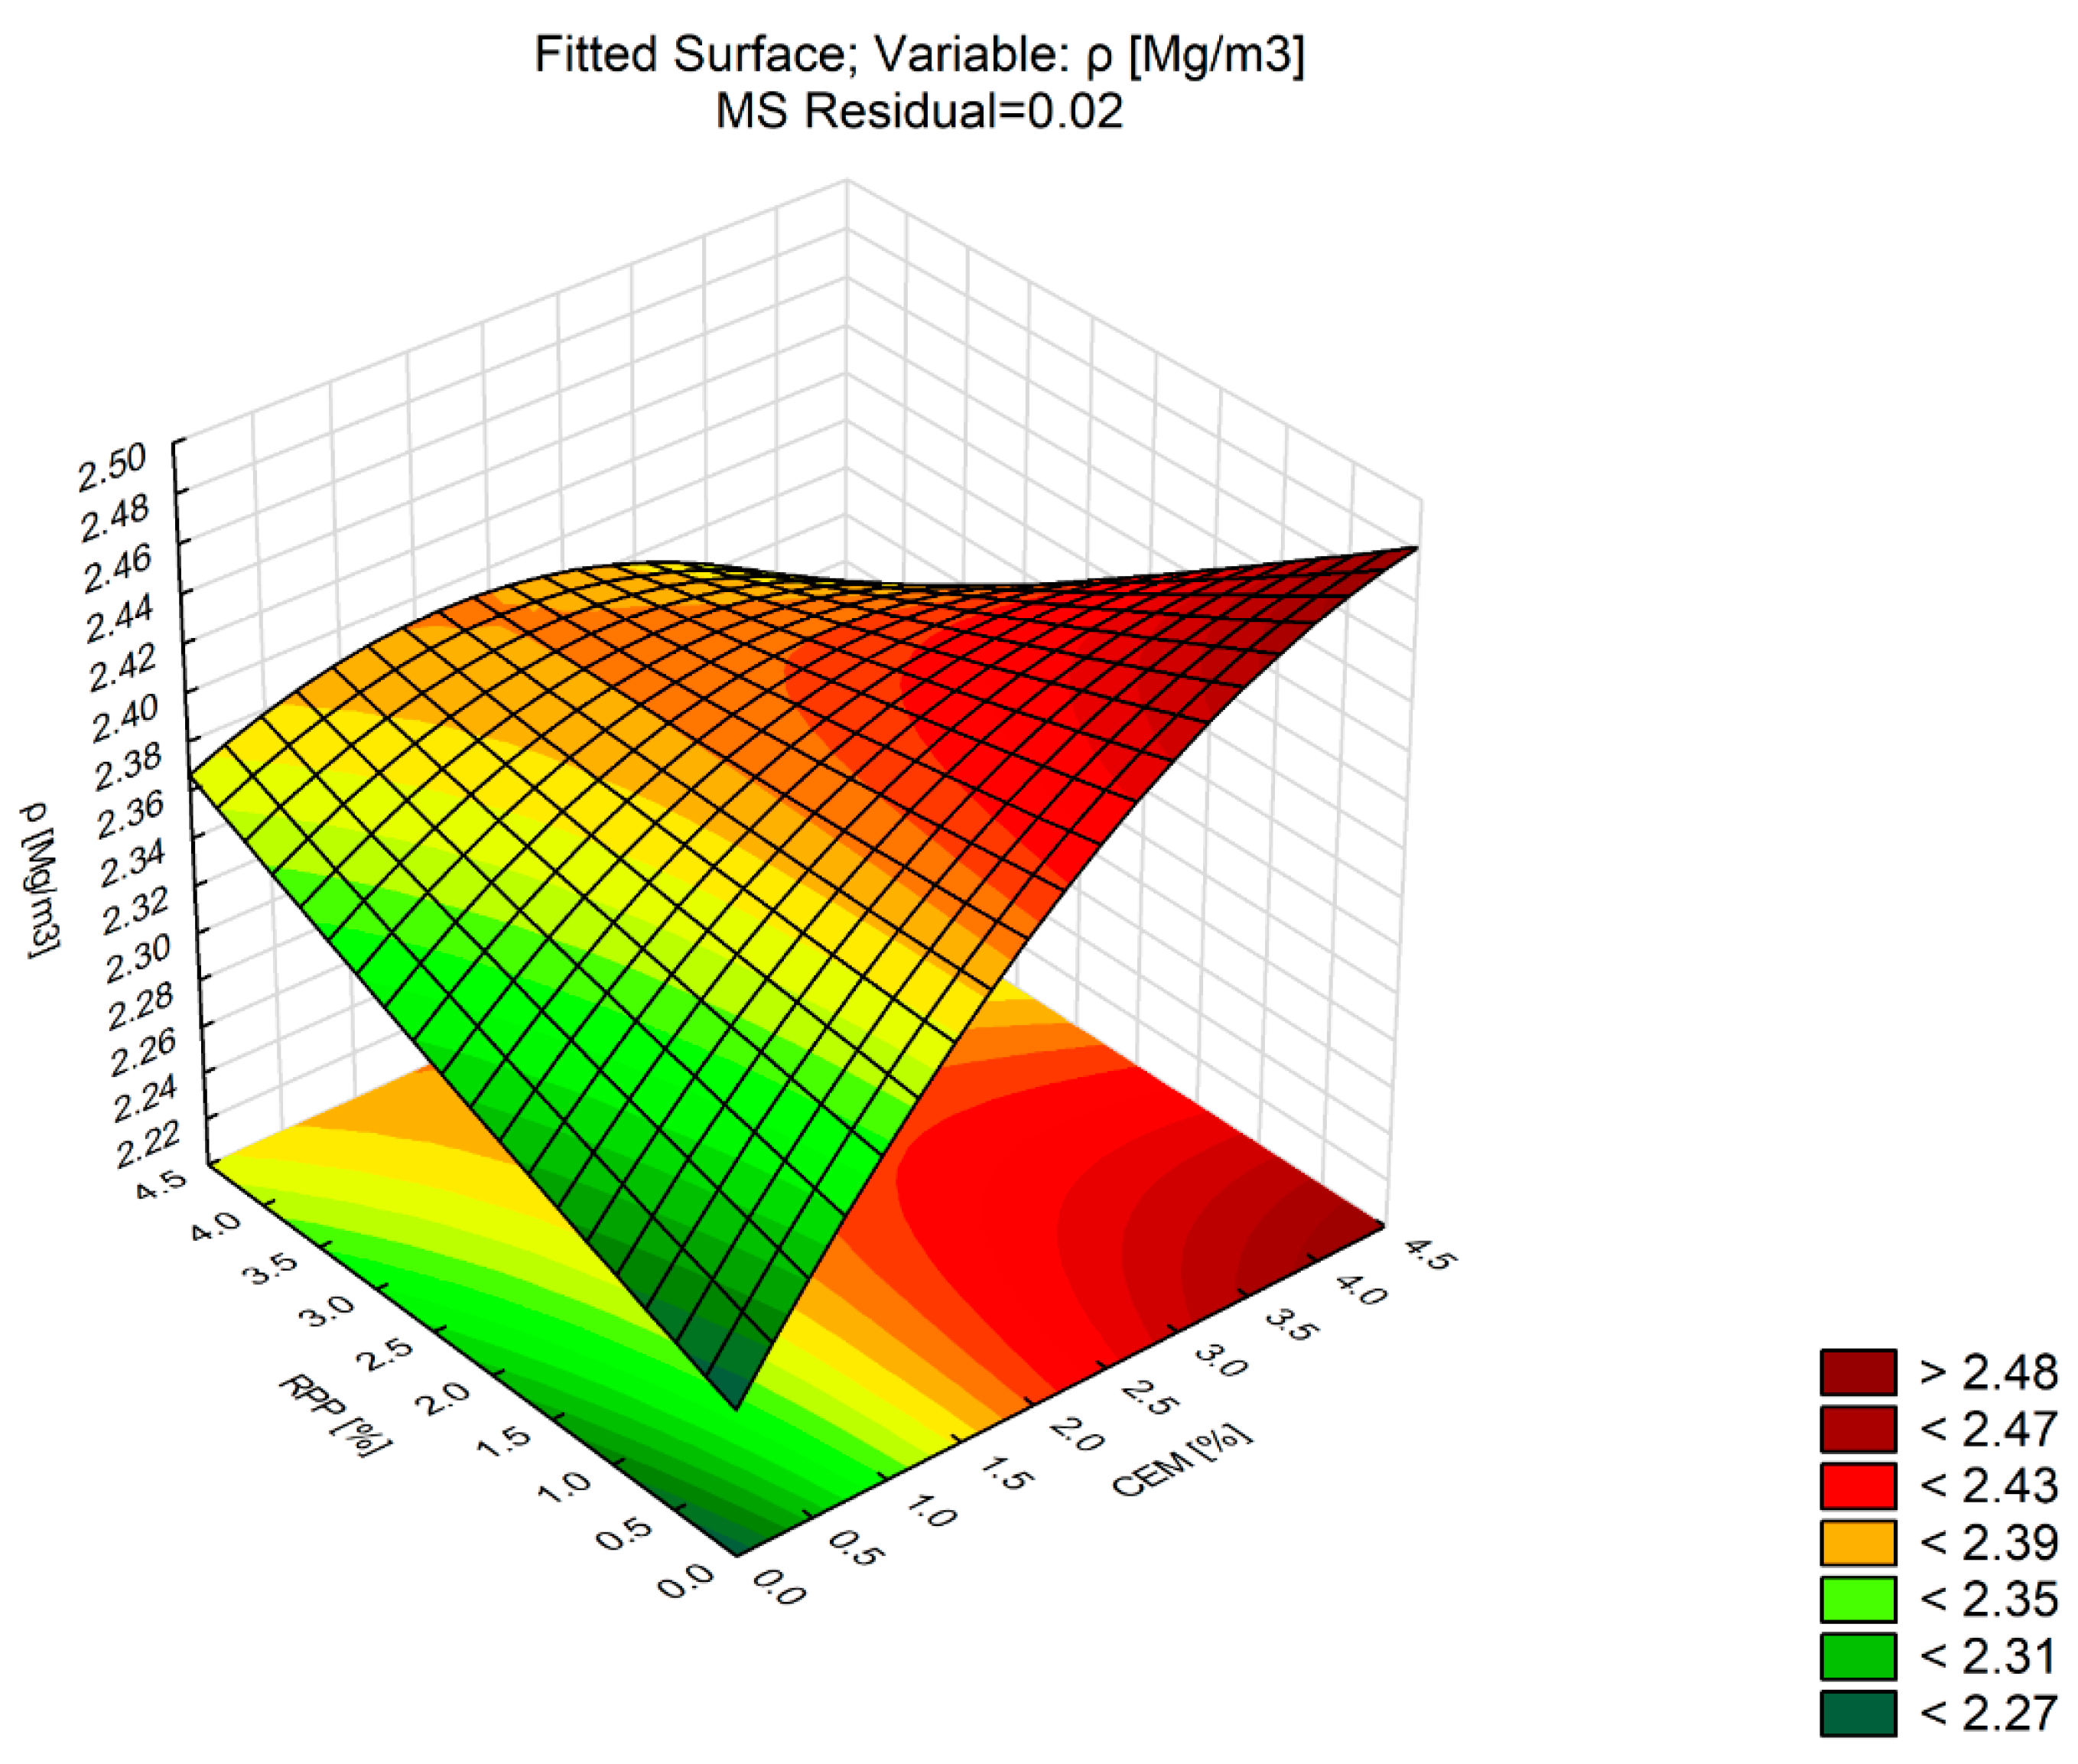
7.1. Regression Models in the Response Surface Methodology for Changes in Physical and Mechanical Properties of CBM in Terms of the CEM Content and the RPP Content
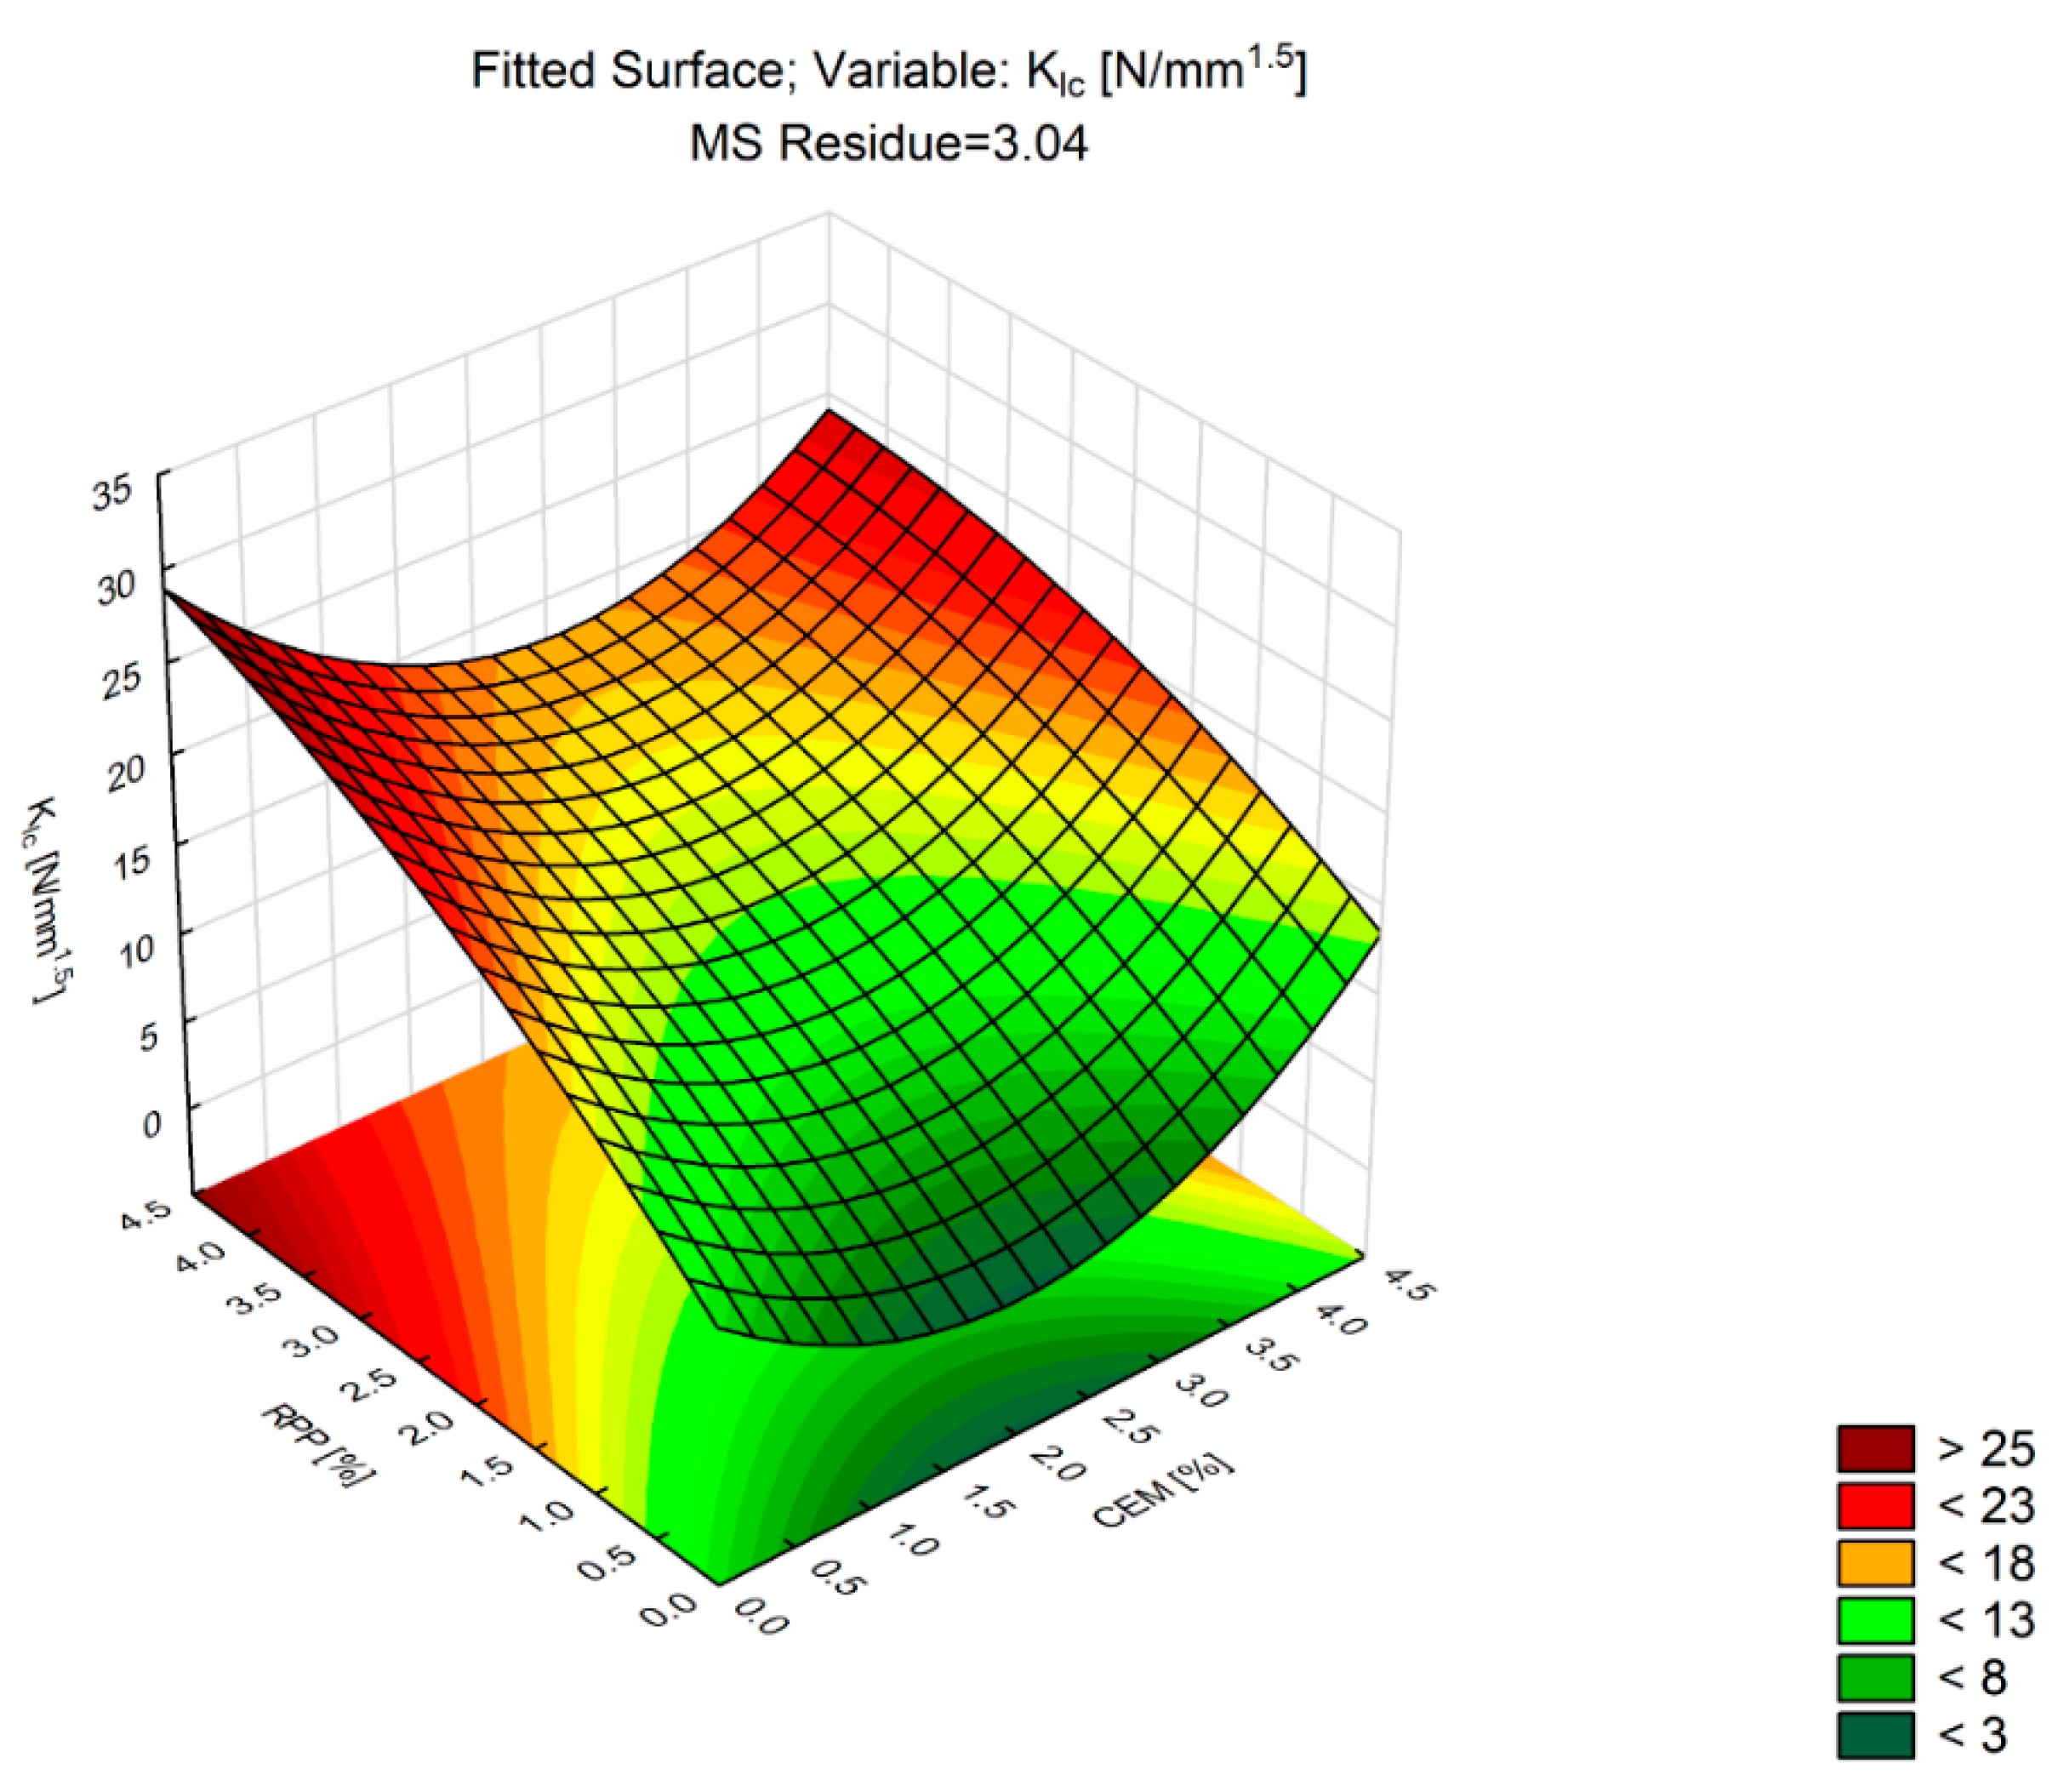
7.2. Regression Models in Response Surface Methodology for Changes in Fracture Toughness (KIC) in Terms of the Amount of Portland Cement and the Amount of Polymer Powder
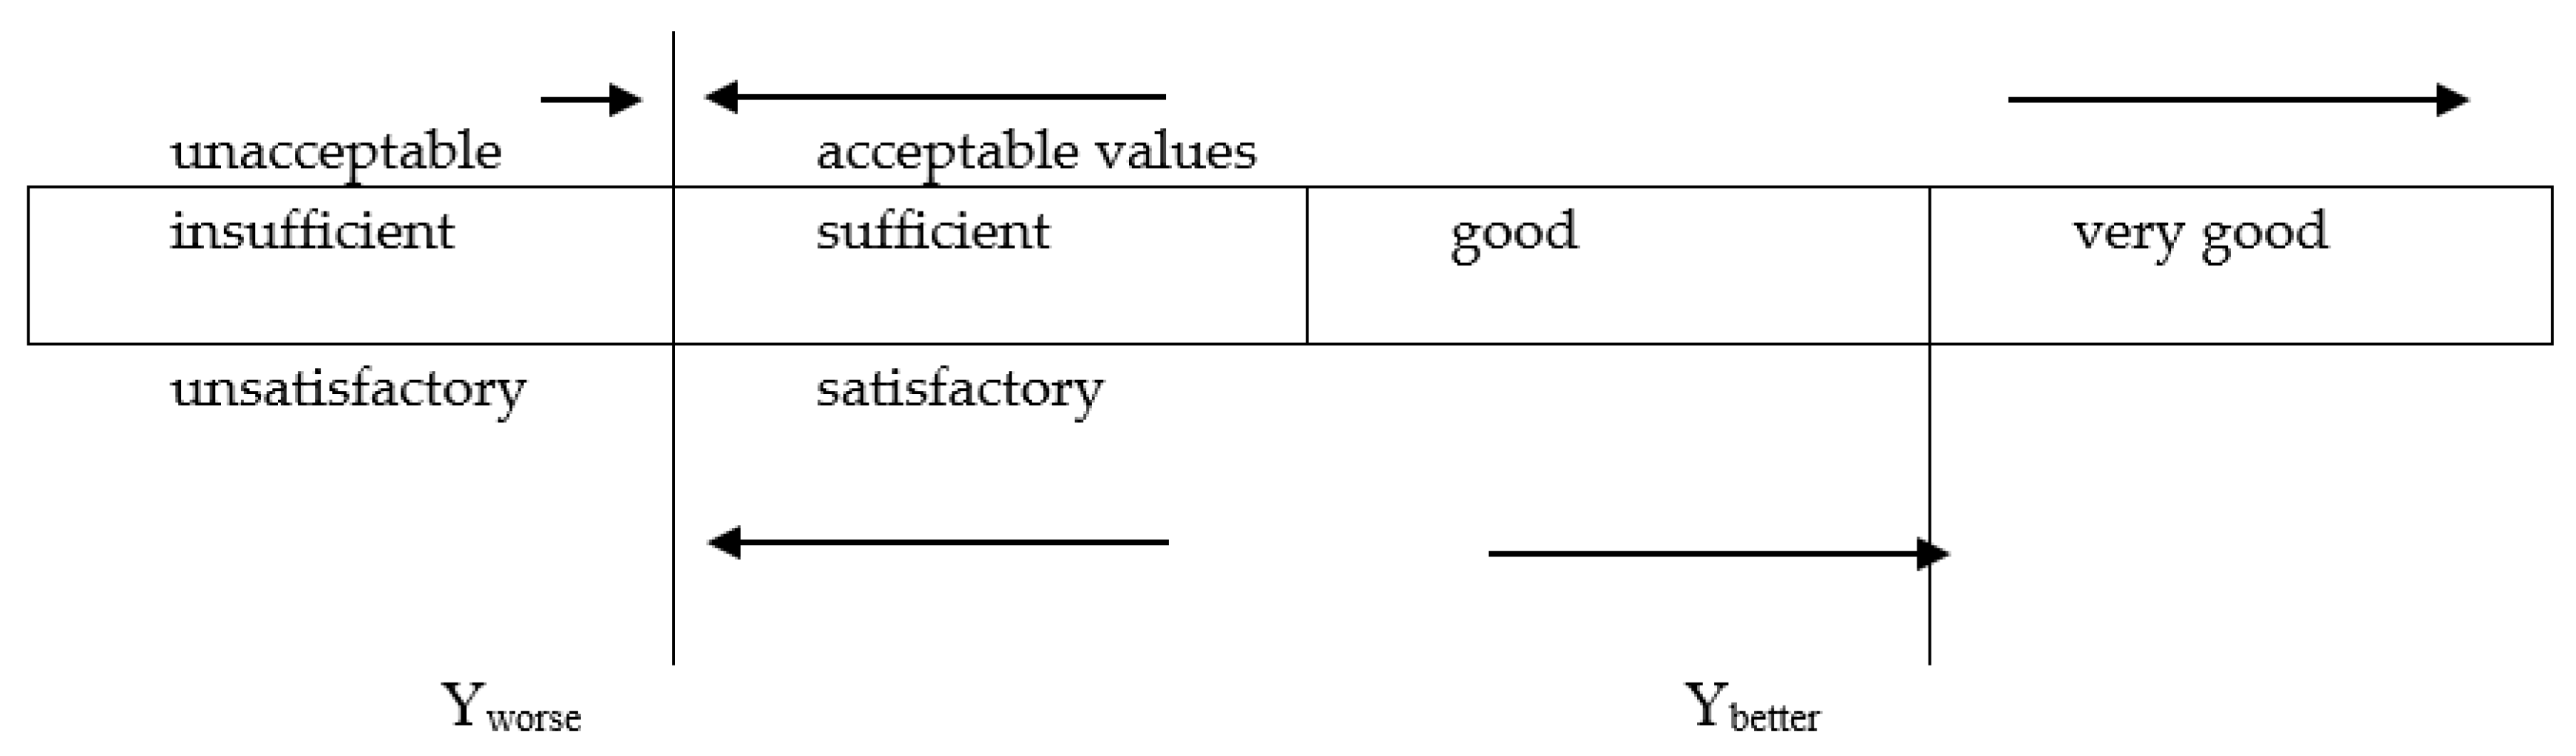
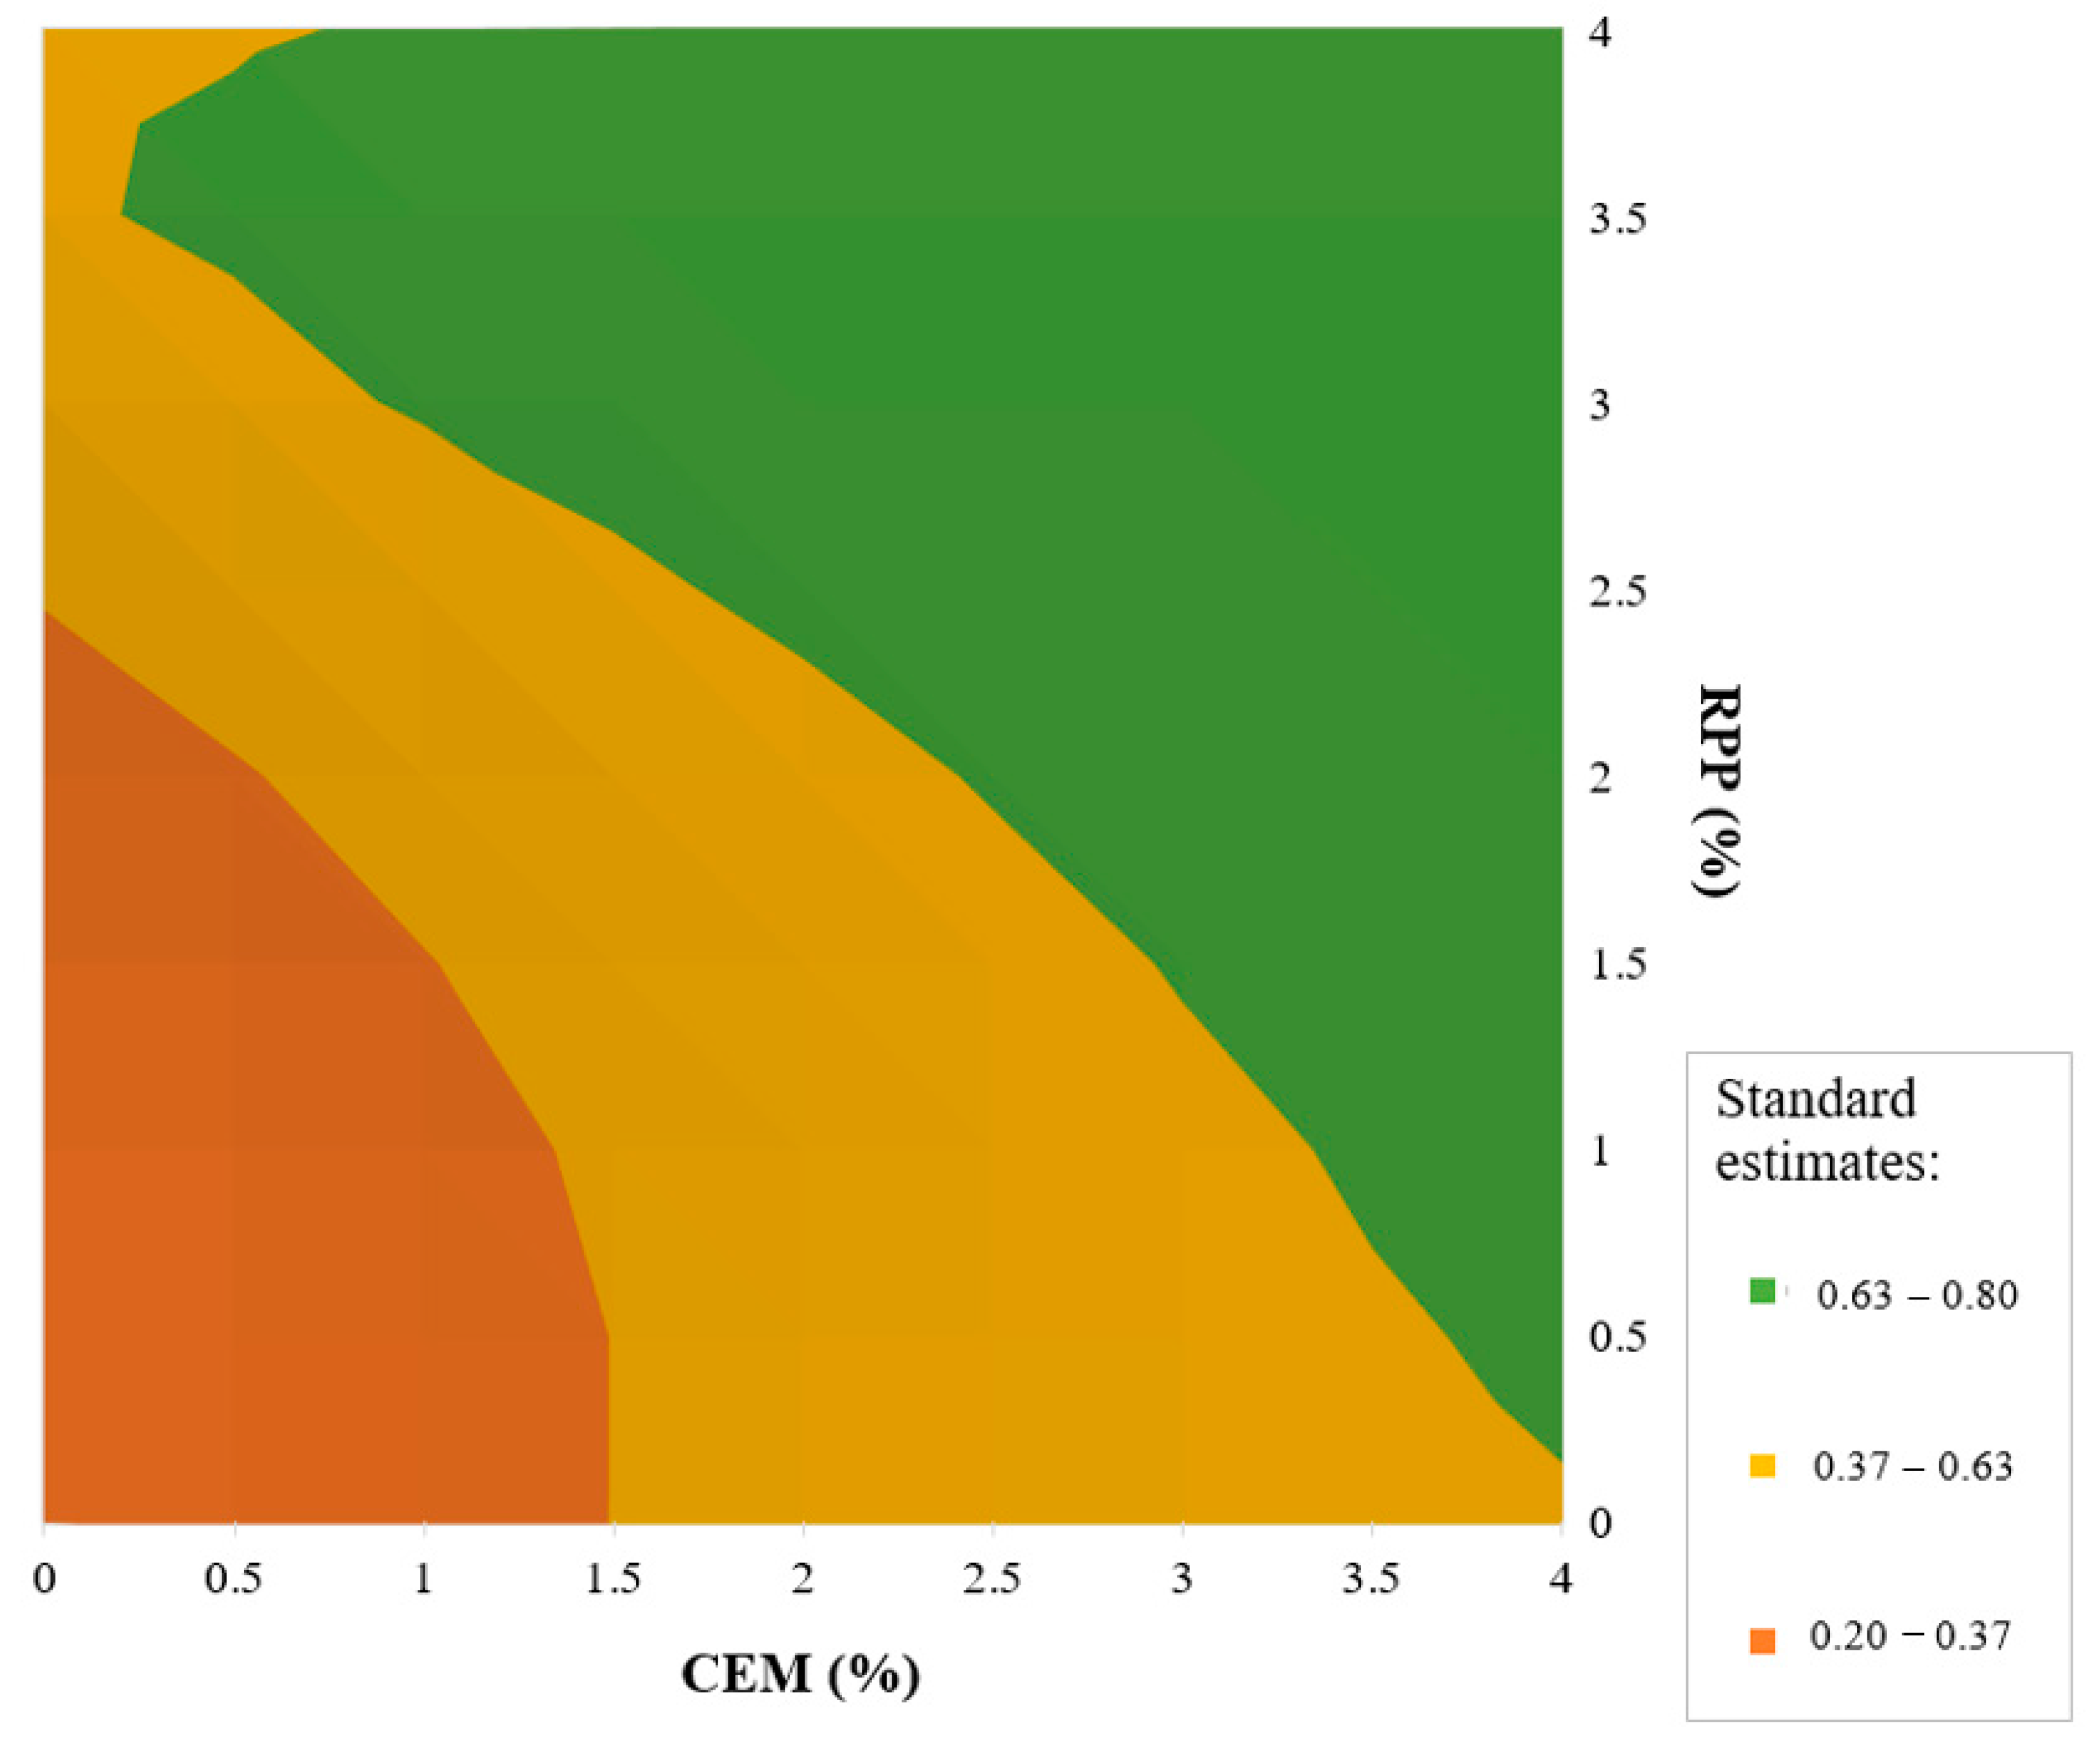
8. Determination of the Recommended Percentage Amounts of Portland Cement and Polymer Powder to Increase the Fracture Toughness of the Bound Mixture. Optimization by the Desirability Function Method
9. Conclusions
- The beneficial effect of the polymer powder on the crack resistance of cement-bound mixtures (CBMs) was confirmed.
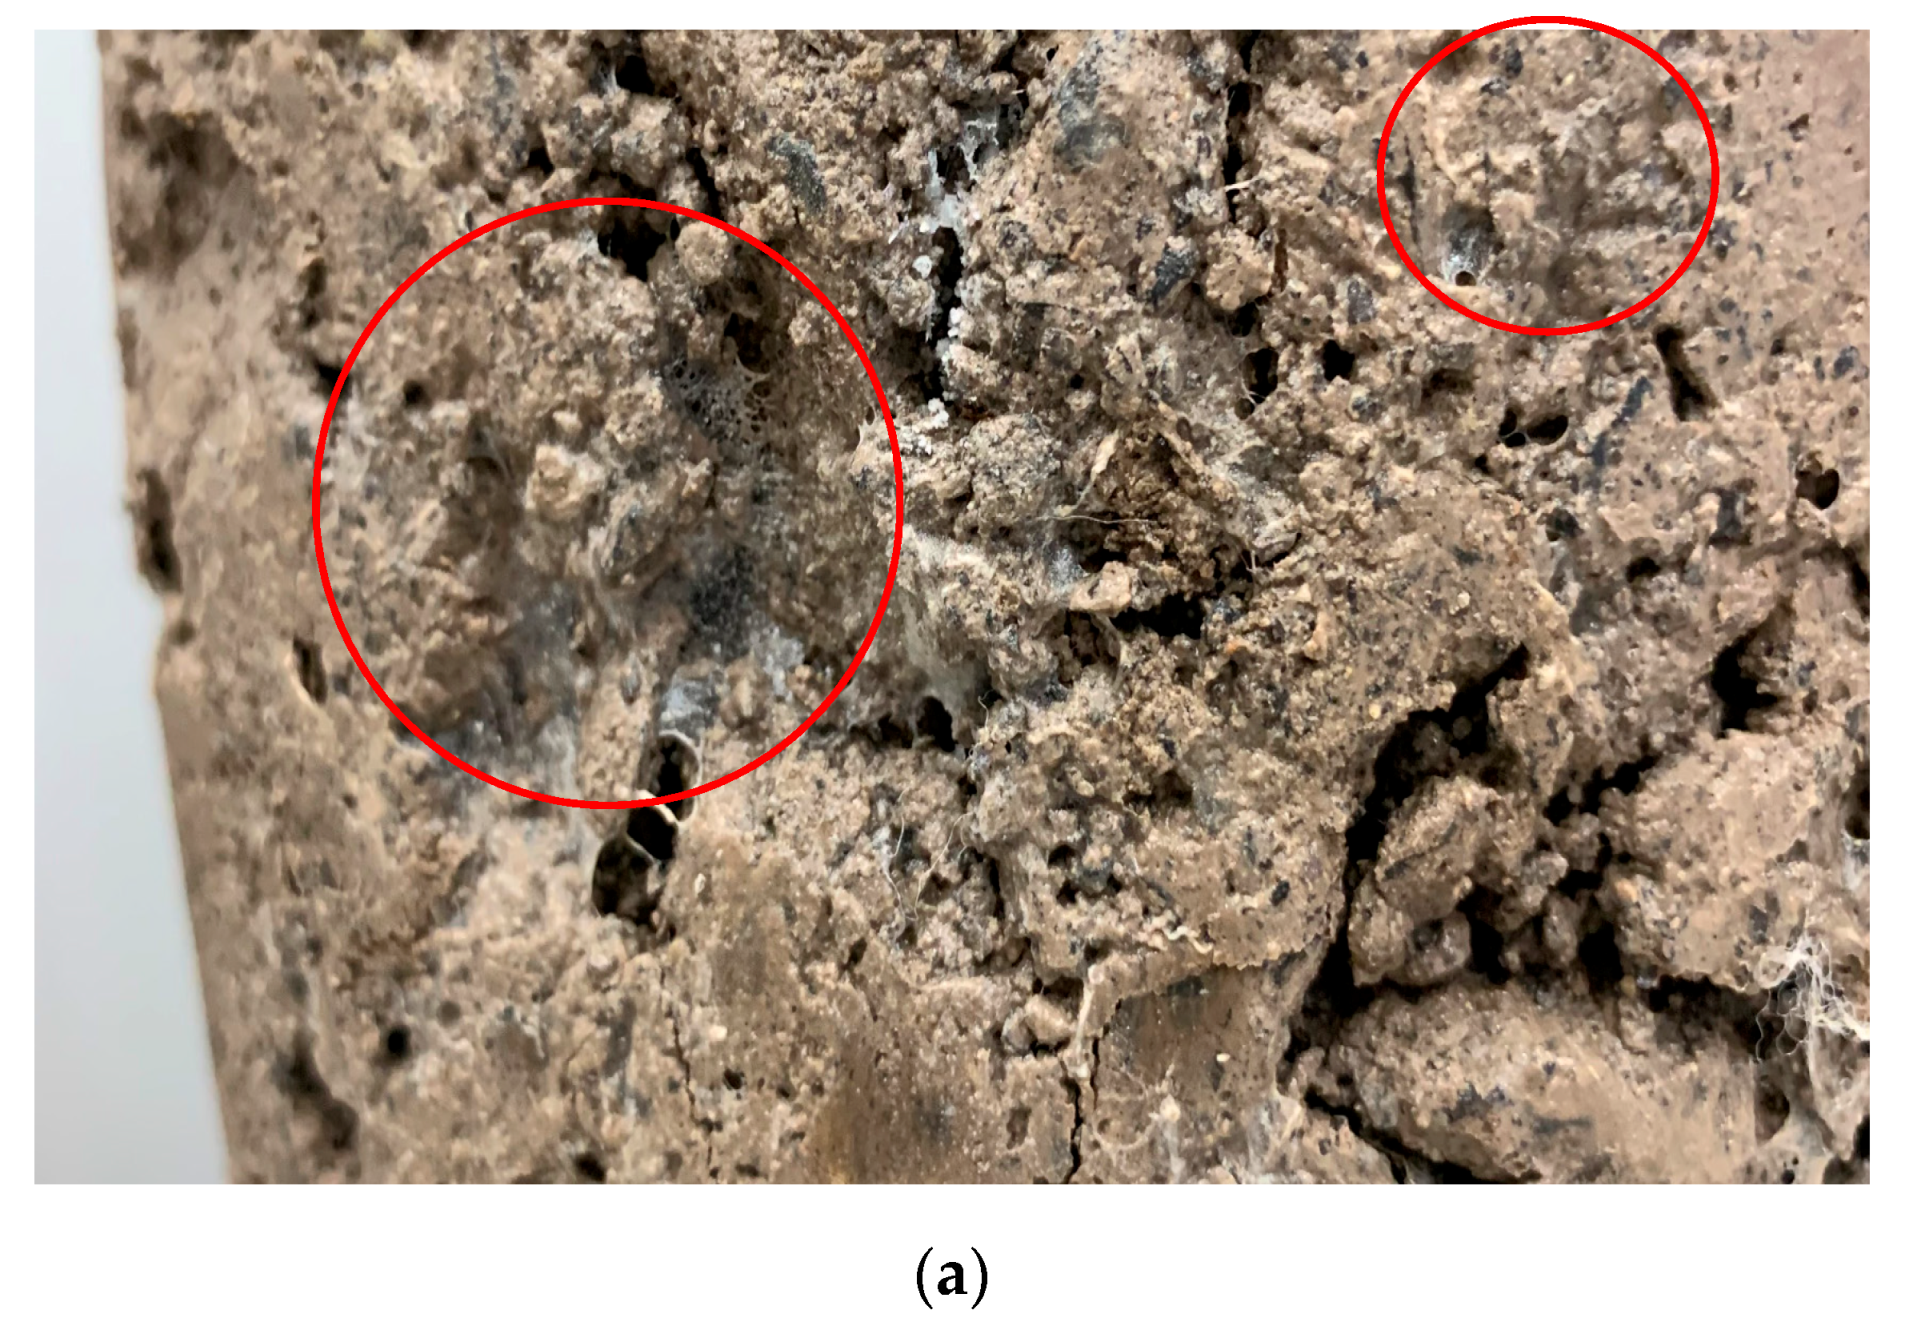
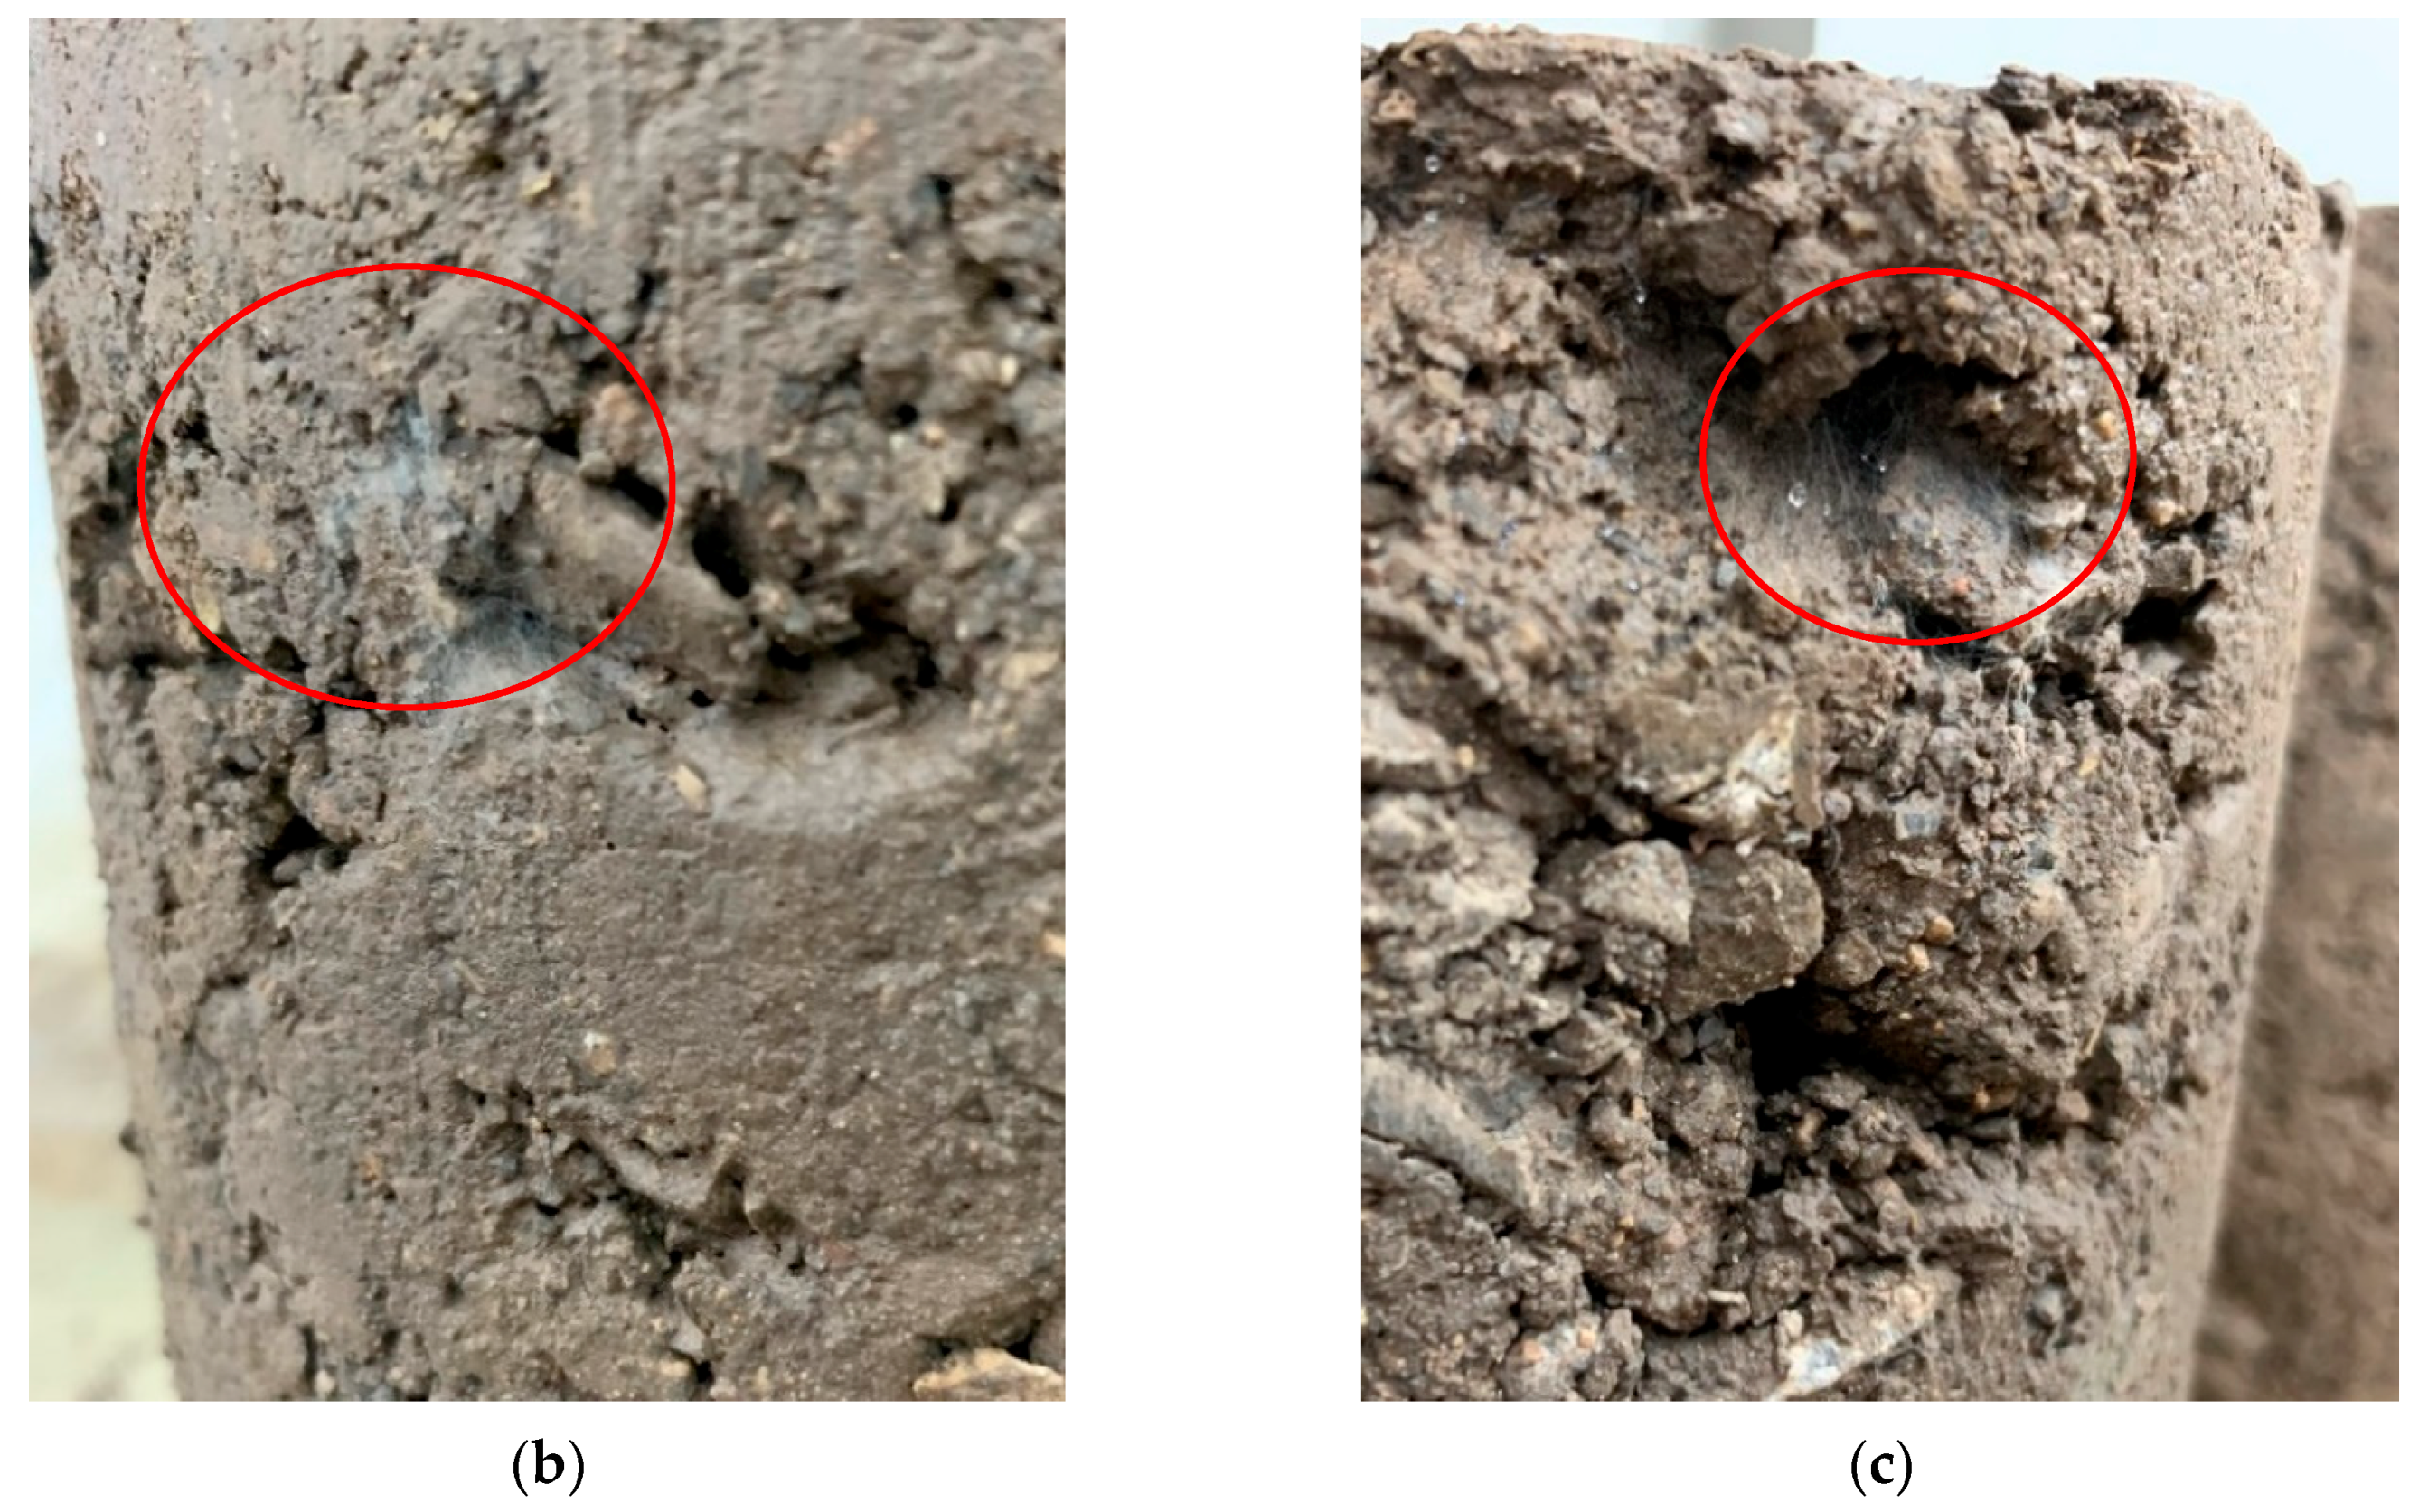
- Macroscopic analysis of the samples of mixtures bound with cement and polymer powder revealed bridging between aggregate grains after the conditioning period; this confirms the formation of a continuous polymer phase and modification of the structure of the cement-bound mixture.
- No effect of the polymer powder (RPP) on the change in the CBM absorption parameter was found. However, it was found that an increase in the amount of cement within the range 2–4% reduced this parameter.
- No change in compressive strength of the cement-bound mixture was observed when the amount of polymer powder was changed. The increase in strength was related to the change of the CEM amount. Increasing the content of polymer powder within the range 2–4% increased the strength from 0.7 to 2.0 MPa. On the other hand, increasing the CEM amount within the range 2–4% increased the strength from about 2.50 to 5.10 MPa. The strength increments for both binders are similar, while the order of magnitude more than doubles when using cement.
- Polymer powder in the bound mixture reduces axial compressive strength while maintaining high resistance to indirect tensile strength.
- The use of polymer powder at more than 0.5% with a maximum concentration of Portland cement (4.0%) has a positive effect on the fracture toughness of CBM.
- The mixtures containing polymer powder are characterized by much higher fracture toughness than the twin combinations with Portland cement.
Author Contributions
Funding

Conflicts of Interest
References
- Catalogue of Typical Flexible and Semi-Rigid Pavements. 2014. Available online: https://www.gddkia.gov.pl/userfiles/articles/z/zarzadzenia-generalnego-dyrektor_13901/zarzadzenie%2031%20zalacznik.pdf (accessed on 21 September 2020). (In Polish)
- York, D. Cement-bound materials (CBM). In Advanced Concrete Technology; Elsevier: Amsterdam, The Netherlands, 2003; pp. 1–12. ISBN 978-0-7506-5686-3. [Google Scholar]
- Bańkowski, W. Evaluation of Fatigue Life of Asphalt Concrete Mixtures with Reclaimed Asphalt Pavement. Appl. Sci. 2018, 8, 469. [Google Scholar] [CrossRef]
- Szydłowski, C. Ocena odporności na pękanie podbudów drogowych z mieszanek mineralno-cementowo-emulsyjnych (MCE). Mater. Bud. 2017, 1, 83–87. [Google Scholar] [CrossRef]
- Bocci, E.; Graziani, A.; Bocci, M. Cold In-place Recycling for a Base Layer of an Italian High-Traffic Highway. In Proceedings of the 5th International Symposium on Asphalt Pavements & Environment (APE); Pasetto, M., Partl, M.N., Tebaldi, G., Eds.; Lecture Notes in Civil Engineering; Springer International Publishing: Cham, Switzerland, 2020; Volume 48, pp. 313–322. ISBN 978-3-030-29778-7. [Google Scholar]
- Łukowski, P.; Adamczewski, G. Self-repairing of polymer-cement concrete. Bull. Pol. Acad. Sci. Tech. Sci. 2013, 61, 195–200. [Google Scholar] [CrossRef]
- Dołżycki, B.; Jaskuła, P. Review and evaluation of cold recycling with bitumen emulsion and cement for rehabilitation of old pavements. J. Traffic Transp. Eng. Engl. Ed. 2019, 6, 311–323. [Google Scholar] [CrossRef]
- Iwański, M.; Mazurek, G.; Buczyński, P. Bitumen Foaming Optimisation Process on the Basis of Rheological Properties. Materials 2018, 11, 1854. [Google Scholar] [CrossRef]
- Radziszewski, P.; Sarnowski, M.; Pokorski, P.; Kowalski, K.J.; Król, J. High temperature properties of modified bituminous binders produced in Poland. MATEC Web Conf. 2019, 262, 05011. [Google Scholar] [CrossRef]
- Costa, L.; Fernandes, S.; Silva, H.; Oliveira, J. Study of the interaction between asphalt and recycled plastics in new polymer modified binders (PMB). Ciênc. Tecnol. Mater. 2017, 29, e192–e197. [Google Scholar] [CrossRef]
- Iwański, M.; Mazurek, G. Optimization of the Synthetic Wax Content on Example of Bitumen 35/50. Procedia Eng. 2013, 57, 414–423. [Google Scholar] [CrossRef]
- Iwański, M.M.; Chomicz-Kowalska, A.; Maciejewski, K. Effect of Surface Active Agent (SAA) on 50/70 Bitumen Foaming Characteristics. Materials 2019, 12, 3514. [Google Scholar] [CrossRef]
- Iwański, M.; Buczyński, P.; Mazurek, G. Optimization of the road binder used in the base layer in the road construction. Constr. Build. Mater. 2016, 125, 1044–1054. [Google Scholar] [CrossRef]
- Iwański, M.; Buczyński, P.; Mazurek, G. The use of gabbro dust in the cold recycling of asphalt paving mixes with foamed bitumen. Bull. Pol. Acad. Sci. Tech. Sci. 2016, 64, 763–773. [Google Scholar] [CrossRef]
- Chomicz-Kowalska, A.; Iwański, M.M.; Mrugała, J. Basic Performance of Fibre Reinforced Asphalt Concrete with Reclaimed Asphalt Pavement Produced In Low Temperatures with Foamed Bitumen. IOP Conf. Ser. Mater. Sci. Eng. 2017, 245, 032092. [Google Scholar] [CrossRef]
- Kulesza, M.; Dębski, D.; Fangrat, J. Effect of redispersible polymer powder on setting time of thin-bed mortars. MATEC Web Conf. 2018, 163, 04005. [Google Scholar] [CrossRef]
- Jaworska, B.; Łukowski, P.; Jaworski, J. Influence of cement substitution by calcareous fly ash on the mechanical properties of polymer-cement composites. MATEC Web Conf. 2018, 163, 03005. [Google Scholar] [CrossRef]
- Bańkowski, W. Charakteristics of Properties and Application of High Modulus Asphalt Concret in Road Pavement Structures; Instytut Badawczy Dróg i Mostów. Dział Wydawnictw i Informacji: Warszawa, Poland, 2019; ISBN 978-83-89252-27-2. [Google Scholar]
- Dolzycki, B.; Jaczewski, M.; Szydlowski, C. The long-term properties of mineral-cement-emulsion mixtures. Constr. Build. Mater. 2017, 156, 799–808. [Google Scholar] [CrossRef]
- Valentin, J.; Čížková, Z.; Suda, J.; Batista, F.; Mollenhauer, K.; Simnofske, D. Stiffness Characterization of Cold Recycled Mixtures. Transp. Res. Procedia 2016, 14, 758–767. [Google Scholar] [CrossRef]
- Buczyński, P.; Iwański, M. Inactive Mineral Filler as a Stiffness Modulus Regulator in Foamed Bitumen-Modified Recycled Base Layers. IOP Conf. Ser. Mater. Sci. Eng. 2017, 245, 032042. [Google Scholar] [CrossRef]
- Graziani, A.; Mignini, C.; Bocci, E.; Bocci, M. Complex Modulus Testing and Rheological Modeling of Cold-Recycled Mixtures. J. Test. Eval. 2020, 48, 20180905. [Google Scholar] [CrossRef]
- Lin, J.; Hong, J.; Xiao, Y. Dynamic characteristics of 100% cold recycled asphalt mixture using asphalt emulsion and cement. J. Clean. Prod. 2017, 156, 337–344. [Google Scholar] [CrossRef]
- Skotnicki, L.; Kuźniewski, J.; Szydlo, A. Stiffness Identification of Foamed Asphalt Mixtures with Cement, Evaluated in Laboratory and In Situ in Road Pavements. Materials 2020, 13, 1128. [Google Scholar] [CrossRef] [PubMed]
- Niazi, Y.; Jalili, M. Effect of Portland cement and lime additives on properties of cold in-place recycled mixtures with asphalt emulsion. Constr. Build. Mater. 2009, 23, 1338–1343. [Google Scholar] [CrossRef]
- Buczyński, P.; Iwański, M. The Influence of a Polymer Powder on the Properties of a Cold-Recycled Mixture with Foamed Bitumen. Materials 2019, 12, 4244. [Google Scholar] [CrossRef] [PubMed]
- Łukowski, P. Material Modification in Concrete; Ass. of Concrete Producers: Cracow, Poland, 2016; ISBN 978-83-61331-22-3. (In Polish) [Google Scholar]
- DePuy, G.W. A Guide to the Use of Polymer Modified Concrete; Reported by ACI Committee 548 24 September 1997; American Concrete Institute: Farmington Hills, MI, USA, 1997. [Google Scholar]
- Silva, D.A.; Monteiro, P.J.M. ESEM analysis of polymeric film in EVA-modified cement paste. Cem. Concr. Res. 2005, 35, 2047–2050. [Google Scholar] [CrossRef]
- AkzoNobel E ELOTEX Global Product Selection Guide. 2014. Available online: http://www.elotex.com/pdf_docs/ELOTEX%20Product%20Selection%20Guide%20RPP%202014_en.pdf (accessed on 21 September 2020).
- Arpagaus, C.; Schafroth, N.; Meuri, M. Laboratory scale spray-drying of lactose: A review. Tuberculosis 2010, 3, 4. [Google Scholar]
- Ohama, Y. Handbook of Polymer-Modified Concrete and Mortars: Properties and Process Technology; Noyes Publications: Park Ridge, NJ, USA, 1995; ISBN 978-0-8155-1358-2. [Google Scholar]
- WT-5 Mieszanki Związane Spoiwem Hydraulicznym do Dróg Krajowych. 2010. Available online: https://www.gddkia.gov.pl/frontend/web/userfiles/articles/d/dokumenty-techniczne_8162/Dokumenty%20techniczne/WT5.pdf (accessed on 21 September 2020). (In Polish)
- PN-EN 933-1 Tests for Geometrical Properties of Aggregates. Determination of Particle Size Distribution. Sieving Method; Polish Standards Institution: Warszawa, Poland, 2012.
- PN-EN 1097-6 Tests for Mechanical and Physical Properties of Aggregates. Determination of Particle Density and Water Absorption; Polish Standards Institution: Warszawa, Poland, 2013.
- PN-EN 933-4 Tests for Geometrical Properties of Aggregates. Determination of Particle shape. Shape Index; Polish Standards Institution: Warszawa, Poland, 2008.
- PN-EN 933-3 Tests for Geometrical Properties of Aggregates. Determination of Particle Shape. Flakiness Index; Polish Standards Institution: Warszawa, Poland, 2012.
- PN-EN 933-5 Tests for Geometrical Properties of Aggregates. Determination of Percentage of Crushed and Broken Surfaces in Coarse Aggregate Particles; Polish Standards Institution: Warszawa, Poland, 2000.
- PN-EN 1367-1 Tests for Thermal and Weathering Properties of Aggregates. Determination of Resistance to Freezing and Thawing; Polish Standards Institution: Warszawa, Poland, 2007.
- PN-EN 1097-2 Tests for Mechanical and Physical Properties of Aggregates. Methods for the Determination of Resistance to Fragmentation; Polish Standards Institution: Warszawa, Poland, 2010.
- PN-EN 1097-1 Tests for Mechanical and Physical Properties of aggregAtes. Determination of the Resistance to Wear (Micro-Deval); Polish Standards Institution: Warszawa, Poland, 2011.
- PN-EN 197-1 Cement. Composition, Specifications and Conformity Criteria for Common Cements; Polish Standards Institution: Warszawa, Poland, 2012.
- PN-EN 196-3 Methods of Testing Cement. Determination of Setting Times and Soundness; Polish Standards Institution: Warszawa, Poland, 2016.
- PN-EN 196-1 Methods of Testing Cement. Determination of Strength; Polish Standards Institution: Warszawa, Poland, 2016.
- PN-EN 196-6 Methods of Testing Cement. Determination of Fineness; Polish Standards Institution: Warszawa, Poland, 2019.
- Montgomery, D.C. Design and Analysis of Experiments; Eighth edition; John Wiley & Sons, Inc: Hoboken, NJ, USA, 2013; ISBN 978-1-118-14692-7. [Google Scholar]
- Piasta, Z.; Lenarcik, A. Applications of Statistical Multi-Criteria Optimisation in Design of Concretes; Optimization Methods for Material Design of Cement-Based Composites; E & FN Spon: London, UK, 1998. [Google Scholar]
- PN-EN 12697-6 Bituminous Mixtures. Test Methods. Determination of Bulk Density of Bituminous Specimens; Polish Standards Institution: Warszawa, Poland, 2020.
- Wirtgen. Cold Recycling Technology, 1st ed.; Wirtgen GmbH: Windhagen, Germany, 2012. [Google Scholar]
- PN-EN 12697-26 Bituminous Mixtures. Test Methods. Stiffness; Polish Standards Institution: Warszawa, Poland, 2018.
- PN-EN 12390-3 Testing Hardened Concrete—Part 3: Compressive Strength of Test Specimens; Polish Standards Institution: Warszawa, Poland, 2019.
- PN-EN 12697-23 Bituminous Mixtures. Test methods. Determination of the Indirect Tensile Strength of Bituminous Specimens; Polish Standards Institution: Warszawa, Poland, 2017.
- PN-EN 12697-44 Bituminous Mixtures—Test Methods—Part 44: Crack Propagation by Semi-Circular Bending Test; Polish Standards Institution: Warszawa, Poland, 2019.
- PN-EN 13286-50 Unbound and Hydraulically Bound Mixtures. Method for the Manufacture of Test Specimens of Hydraulically Bound Mixtures Using Proctor Equipment or Vibrating Table Compaction; Polish Standards Institution: Warszawa, Poland, 2007.
- PN-EN 13286-41 Unbound and Hydraulically Bound Mixtures. Test Method for Determination of the Compressive Strength of Hydraulically Bound Mixtures; Polish Standards Institution: Warszawa, Poland, 2005.
- PN-EN 13286-2 Unbound and Hydraulically Bound Mixtures. Test Methods for Laboratory Reference Density and Water Content. Proctor Compaction; Polish Standards Institution: Warszawa, Poland, 2010.
- Iwański, M.; Chomicz-Kowalska, A.; Buczyński, P.; Mazurek, G.; Cholewińska, M.; Iwański, M.M.; Ramiączek, P.; Maciejewski, K. Procedury projektowania oraz wytyczne stosowania materiałów odpadowych i z recyklingu do technologii wytwarzania mieszanek metodą na zimno z asfaltem spienionym (MCAS). In Procedures for Design and Recommendations for Utilizing Waste and Material to Cold Recycling Technology Witch Foamed Bitumen. Recommendations to Research Report RID-I/6; Kielce University of Technology: Kielce, Poland, 2018. (In Polish) [Google Scholar]
- PN-EN 12697-30 Bituminous Mixtures. Test Methods. Specimen Preparation by Impact Compactor; Polish Standards Institution: Warszawa, Poland, 2019.
- Beeldens, A. From microstructure to macrostructure: An integrated model of structure formation in polymer-modified concrete. Mater. Struct. 2005, 38, 601–607. [Google Scholar] [CrossRef]
- Ohama, Y. Principle of Latex Modification and Some Typical Properties of Latex-Modified Mortars and Concretes Adhesion; Binders (materials); Bond (paste to aggregate); Carbonation; Chlorides; curing; diffusion. ACI Mater. J. 1987, 84. [Google Scholar] [CrossRef]
- Szydłowski, C.; Górski, J.; Stienss, M.; Smakosz, Ł. A material model of asphalt mixtures based on Monte Carlo simulations; SCIENTIFIC SESSION ON APPLIED MECHANICS X. In Proceedings of the 10th International Conference on Applied Mechanics Bydgoszcz, Bydgoszcz, Poland, 23 November 2018; p. 020057. [Google Scholar]
- Neville, A.M.; Ajdukiewicz, A.; Degler, A.; Kasperkiewicz, J. Właściwości Betonu; Stowarzyszenie Producentów Cementu: Kraków, Poland, 2012; ISBN 978-83-61331-16-2. [Google Scholar]
- PN-EN 206 Concrete. Specification, Performance, Production and Conformity; Polish Standards Institution: Warszawa, Poland, 2016.
- Kim, Y.R. (Ed.) Modeling of Asphalt Concrete; McGraw-Hill Construction: New York, NY, USA, 2009; ISBN 0-07-146462-X. [Google Scholar]
- Pełczyńska, K.; Gajewski, M. Review of selected fatigue criteria for hydraulic bound layers in road pavements. Roads Bridges Drogi Mosty 2018, 227–248. [Google Scholar] [CrossRef]
- Buczyński, P. Rehabilitation reliability of the road pavement structure with recycled base course with foamed bitumen. IOP Conf. Ser. Mater. Sci. Eng. 2018, 356, 012016. [Google Scholar] [CrossRef]
- Leandri, P.; Losa, M.; Di Natale, A. Field validation of recycled cold mixes viscoelastic properties. Constr. Build. Mater. 2015, 75, 275–282. [Google Scholar] [CrossRef]
- Dolzycki, B.; Szydlowski, C.; Jaczewski, M. The influence of combination of binding agents on fatigue properties of deep cold in-place recycled mixtures in Indirect Tensile Fatigue Test (ITFT). Constr. Build. Mater. 2020, 239, 117825. [Google Scholar] [CrossRef]
- Judycki, J.; Jaskuła, P.; Pszczoła, M.; Ryś, D.; Jaczewski, M.; Alenowicz, J.; Dołżycki, B.; Stienss, M. Analizy i Projektowanie Konstrukcji Nawierzchni Podatnych i Półsztywnych; Wydawnictwa Komunikacji i Łączności: Warszawa, Poland, 2014; ISBN 978-83-206-1928-7. [Google Scholar]
- Jaskula, P.; Judycki, J. Durability of Asphalt Concrete Subjected to Deteriorating Effects of Water and Frost. J. Perform. Constr. Facil. 2016, 30. [Google Scholar] [CrossRef]
- Szydłowski, C.; Górski, J.; Stienss, M.; Smakosz, Ł. The statistical impact of experimental result scatter of asphalt mixtures on their numerical modelling. MATEC Web Conf. 2019, 262, 05014. [Google Scholar] [CrossRef][Green Version]
- Stienss, M.; Szydlowski, C. Influence of Selected Warm Mix Asphalt Additives on Cracking Susceptibility of Asphalt Mixtures. Materials 2020, 13, 202. [Google Scholar] [CrossRef] [PubMed]
- Mechanistic-Empirical Pavement Design Guide—A Manual of Practice (Interim Edition); American Association of State Highway and Transportation Officials (AASHTO): Washington, DC, USA, 2008; ISBN 978-1-56051-423-7.
- Lazić, Ž.R. Design of Experiments in Chemical Engineering: A Practical Guide; Wiley-VCH Verlag GmbH & Co. KGaA: Weinheim, Germany, 2004; ISBN 978-3-527-31142-2. [Google Scholar]
- Harrington, E.C. The Desirability Function. Ind. Qual. Control. 1965, 4, 494–498. [Google Scholar]


| Reference | Reclaimed Asphalt Pavement (RAP) Content (%) | Mineral Aggregate Content (%) | Hydraulic Binder Content and Type (%) | Bitumen Binder Content and Type (%) | Others Binder Type (%) |
|---|---|---|---|---|---|
| Dołżycki et al. [19] | 70% | 30% | 2%/4%/6%—cement | 2/4/6%—bitumen emulsion | - |
| Valentin et al. [20] | 60–90% | 10–40% | 1.5–3.0%—cement | 2.5%—bitumen emulsion | Waste filler |
| Buczyński et al. [21] | 50% | 50% | 2%—cement | 2.4%—foamed bitumen (50/70) | 5%/12.5%/20% Dolomite Dust |
| Graziani et al. [22] | 50%/80%/0% | 50%/20%/100% | 2%—cement | 3.0%—bitumen emulsion | - |
| Lin et al. [23] | 100% | 2%—cement | 4.0%—bitumen emulsion | - | |
| Skotnicki et al. [24] | 2.38%, 3.38%, 4.38%—cement | 3.5%, 5.5%—foamed bitumen | - | ||
| Niazi et al. [25] | 20% | 80% | 0%, 0.5%, 1.0%, 2.0%—cement | 3.5% emulsion | 0%, 0.5%, 1.0%, 2.0% lime |
| Component | Percentage (%) (m/m) |
|---|---|
| Vinyl acetate (VAc) | 70.0–100.0 |
| Copolymer (butyl acrylate. ethylene. edetic acid vinyl ester) | 0.0–30.0 |
| partially hydrolyzed poly (vinyl alcohol) | 6.0 |
| sodium bicarbonate | 0.3 |
| hydrogen peroxide (35%) | 0.7 |
| sodium hydroxymethyl sulfonate | 0.5 |
| water | 80.0 |
| Component | Percentage in EVA (%) |
|---|---|
| C | 67.67 |
| O | 29.13 |
| Mg | 0.52 |
| Si | 1.65 |
| Ca | 0.75 |
| Al | 0.29 |
| ∑ | 100.00 |
| Property | Test | u.m. | Result | Symbol |
|---|---|---|---|---|
| Dimension d/D | EN 933-1 [34] | - | - | 0/31 |
| Particle size distribution | EN 933-1 [34] | - | - | GA85 |
| Density | EN 1097-6 [35] | Mg/m3 | 2.71 | 2.71 |
| Shape index | EN 933-4 [36] | % | 16.0 | SI20 |
| Flakiness index | EN 933-3 [37] | % | 14.0 | FI20 |
| Percentage of crushed and broken surfaces | EN 933-5 [38] | % | 98/2 | C90/3 |
| Frost resistance | EN 1367-1 [39] | % | 3.4 | F1 |
| Resistance to fragmentation | EN 1097-2 [40] | % | 23 | LA30 |
| Abrasion resistance | EN 1097-1 [41] | % | 17.5 | MDE25 |
| Property | Test | u.m. | Result | Symbol |
|---|---|---|---|---|
| Dimension d/D | EN 933-1 [34] | - | - | 0/4 |
| Particle size distribution | EN 933-1 [34] | - | - | GF85 |
| Density | EN 1097-6 [35] | Mg/m3 | 2.83 | 2.83 |
| Property | Test Method | Unit of Measure | Result |
|---|---|---|---|
| Initial setting time | EN 196-3 [43] | min | 209 |
| Compressive strength | EN 196-1 [44] | ||
| at 2 days | MPa | 27.2 | |
| at 28 days | MPa | 55.6 | |
| Soundness | EN 196-3 [43] | mm | 0.8 |
| Specific surface area | EN 196-6 [45] | cm2/g | 3360 |
| Property | Portland Cement Content (%) | Polymer Powder Content (%) |
|---|---|---|
| CBM_C2P0 | 2 | 0 |
| CBM_C4P0 | 4 | 0 |
| CBM_C2P2 | 2 | 2 |
| CBM_C2P4 | 2 | 4 |
| CBM_C4P2 | 4 | 2 |
| CBM_C4P4 | 4 | 4 |
| CBM_C0P2 | 0 | 2 |
| CBM_C0P4 | 0 | 4 |
| CBM_C0P0 | 0 | 0 |
| Factor | Regr. Coefficients ρbssd [Mg/m3] R-sqr = 0.95; MS Residual = 0.02 | |
|---|---|---|
| Regression Coefficient | p-Value | |
| Mean/Interc. | 2.26 | 0.001 |
| (1) CEM [%] (L) | 0.087 | 0.001 |
| CEM [%] (Q) | −0.008 | 0.022 |
| (2) RPP [%] (L) | 0.021 | 0.335 |
| RPP [%] (Q) | 0.001 | 0.867 |
| 1L by 2L | −0.013 | 0.005 |
| Factor | Regr. Coefficients nw [%] R-sqr = 0.97; MS Residual = 0.01 | |
|---|---|---|
| Regression Coefficient | p-Value | |
| Mean/Interc. | 0.031 | 0.001 |
| (1) CEM [%] (L) | −0.020 | 0.001 |
| CEM [%] (Q) | 0.003 | 0.001 |
| (2) RPP [%] (L) | −0.001 | 0.950 |
| RPP [%] (Q) | −0.001 | 0.001 |
| 1L by 2L | 0.001 | 0.001 |
| Factor | Regr. Coefficients RC 28d [MPa] R-sqr = 0.94; MS Residual = 0.42; | |
|---|---|---|
| Regression Coefficient | p-Value | |
| Mean/Interc. | 0.780 | 0.254 |
| (1) CEM [%] (L) | 0.453 | 0.240 |
| CEM [%] (Q) | 0.166 | 0.021 |
| (2) RPP [%] (L) | 0.103 | 0.750 |
| RPP [%] (Q) | 0.026 | 0.638 |
| 1L by 2L | −0.084 | 0.158 |
| Factor | Regr. Coefficients ITSDRY [MPa] R-sqr = 0.98; MS Residual = 0.39 | |
|---|---|---|
| Regression Coefficient | p-Value | |
| Mean/Interc. | 1.380 | 0.001 |
| (1) CEM [%] (L) | −1.065 | 0.001 |
| CEM [%] (Q) | 0.295 | 0.001 |
| (2) RPP [%] (L) | 0.448 | 0.004 |
| RPP [%] (Q) | −0.030 | 0.132 |
| 1L by 2L | −0.115 | 0.001 |
| Factor | Regr. Coefficients Sm at +10 °C [MPa] R-sqr = 0.98; MS Residual = 1022.6 | Regr. Coefficients Sm at +25 °C [MPa] R-sqr = 0.96; MS Residual = 1689.4 | ||
|---|---|---|---|---|
| Regression Coefficient | p-Value | Regression Coefficient | p-Value | |
| Mean/Interc. | 6138.05 | 0.007 | 16272.79 | 0.001 |
| (1) CEM [%] (L) | −5140.85 | 0.001 | −1901.95 | 0.154 |
| CEM [%] (Q) | 2054.74 | 0.001 | 1214.75 | 0.001 |
| (2) RPP [%] (L) | 3965.11 | 0.001 | −6058.27 | 0.010 |
| RPP [%] (Q) | −384.44 | 0.023 | 812.55 | 0.014 |
| 1L by 2L | −1106.29 | 0.001 | −375.63 | 0.190 |
| Property | Portland Cement Amount (%) | Polymer Powder Amount (%) | Depth of Cut/Notch (mm) | ∆W (mm) | εmax (%) | σmax (MPa) | KlC (N/mm1,5) |
|---|---|---|---|---|---|---|---|
| CBM_C2P0 | 2 | 0 | 10 | 0.37 | 0.50 | 0.11 | 2.87 |
| CBM_C4P0 | 4 | 0 | 10 | 0.44 | 0.59 | 0.36 | 9.43 |
| CBM_C2P2 | 2 | 2 | 10 | 0.60 | 0.83 | 0.52 | 13.90 |
| CBM_C2P4 | 2 | 4 | 10 | 0.72 | 0.86 | 0.57 | 15.35 |
| CBM_C4P2 | 4 | 2 | 10 | 0.69 | 0.90 | 0.60 | 16.07 |
| CBM_C4P4 | 4 | 4 | 10 | 1.06 | 1.41 | 0.83 | 21.84 |
| CBM_C0P2 | 0 | 2 | 10 | 0.73 | 0.97 | 0.72 | 19.23 |
| CBM_C0P4 | 0 | 4 | 10 | 1.35 | 1.75 | 1.07 | 28.79 |
| Factor | Regr. Coefficients KIC (N/mm1.5) R-sqr = 0.91; MS Residual = 4.48 | |
|---|---|---|
| Regression Coefficient | p-Value | |
| Mean/Interc. | 9.31 | 0.002 |
| (1) CEM [%] (L) | −6.74 | 0.001 |
| CEM [%] (Q) | 1.70 | 0.001 |
| (2) RPP [%] (L) | 6.42 | 0.001 |
| RPP [%] (Q) | −0.45 | 0.073 |
| 1L by 2L | −0.44 | 0.057 |
| Property | Mean/Interc. | (1) CEM [%] (L) | CEM (%) (Q) | (2) RPP (%) (L) | RPP (%) (Q) | 1L by 2L | R2 |
|---|---|---|---|---|---|---|---|
| ρbssd | 2.26 | 0.087 | −0.008 | 0.021 | 0.001 | −0.013 | 0.95 |
| nw | 0.031 | −0.020 | 0.003 | −0.001 | −0.001 | 0.001 | 0.97 |
| RC | 0.078 | 0.453 | 0.166 | 0.103 | 0.026 | −0.084 | 0.94 |
| ITSDRY | 1.380 | −1.065 | 0.295 | 0.448 | −0.03 | −0.115 | 0.98 |
| Sm + 10 °C | 6138.05 | −5140.85 | 2054.74 | 3965.11 | −384.44 | −1106.29 | 0.98 |
| Sm + 25 °C | 1672.79 | −1901.95 | 1214.75 | −6058.27 | 812.55 | −375.63 | 0.96 |
| KIC | 9.31 | −6.74 | 1.7 | 6.42 | −0.45 | −0.44 | 0.91 |
| Standard Estimates | Desirability | Quality of Product |
|---|---|---|
| 1.00 | Excellent | Ultimate in “satisfaction” or quality; an improvement beyond this point would have no appreciable value |
| 1.00–0.80 | Very good | Acceptable and good. Represents an improvement over the best commercial quality, the latter having the value of 0.63 |
| 0.63–0.37 | Satisfactory | Acceptable but poor. Quality is acceptable to the specification limits, but improvement is desired |
| 0.37–0.20 | Bad | Unacceptable. Materials of this quality would lead to failure of the project |
| 0.20–0.00 | Very bad | Completely unacceptable |
| Criterion | nw (%) | RC (MPa) | ITSDRY (MPa) | Sm +10 °C (MPa) | KIC (N/mm1,5) |
|---|---|---|---|---|---|
| better | 1.0 | min | 0.50 | min | 30.0 |
| worse | 5.0 | max | 0.25 | max | 25.0 |
| weight | 0.2 | 0.2 | 0.2 | 0.2 | 0.2 |
© 2020 by the authors. Licensee MDPI, Basel, Switzerland. This article is an open access article distributed under the terms and conditions of the Creative Commons Attribution (CC BY) license (http://creativecommons.org/licenses/by/4.0/).
Share and Cite
Buczyński, P.; Iwański, M.; Mazurek, G.; Krasowski, J.; Krasowski, M. Effects of Portland Cement and Polymer Powder on the Properties of Cement-Bound Road Base Mixtures. Materials 2020, 13, 4253. https://doi.org/10.3390/ma13194253
Buczyński P, Iwański M, Mazurek G, Krasowski J, Krasowski M. Effects of Portland Cement and Polymer Powder on the Properties of Cement-Bound Road Base Mixtures. Materials. 2020; 13(19):4253. https://doi.org/10.3390/ma13194253
Chicago/Turabian StyleBuczyński, Przemysław, Marek Iwański, Grzegorz Mazurek, Jakub Krasowski, and Maciej Krasowski. 2020. "Effects of Portland Cement and Polymer Powder on the Properties of Cement-Bound Road Base Mixtures" Materials 13, no. 19: 4253. https://doi.org/10.3390/ma13194253
APA StyleBuczyński, P., Iwański, M., Mazurek, G., Krasowski, J., & Krasowski, M. (2020). Effects of Portland Cement and Polymer Powder on the Properties of Cement-Bound Road Base Mixtures. Materials, 13(19), 4253. https://doi.org/10.3390/ma13194253