Article

Fabrication of Metal-Substituted Polyoxometalates for Colorimetric Detection of Dopamine and Ractopamine

1
Jilin Provincial Key Laboratory of Wooden Materials Science and Engineering, Beihua University, Jilin 132013, China
2
Key Lab of Polyoxometalate Science of Ministry of Education, Northeast Normal University, Changchun 130024, China
3
Department of Chemical Engineering and Applied Chemistry, University of Toronto, Toronto, ON M5S 3B3, Canada
*
Authors to whom correspondence should be addressed.
Materials 2018, 11(5), 674; https://doi.org/10.3390/ma11050674
Submission received: 4 April 2018 / Revised: 22 April 2018 / Accepted: 23 April 2018 / Published: 26 April 2018

Abstract

:
A novel colorimetric detection method based on the peroxidase-like activity of metal-substituted polyoxometalates (POMs) of SiW9M3 (M = Co2+, Fe3+, Cu2+, Mn2+) has been established. POMs can catalyze oxidation of dopamine (DA) and ractopamine (RAC) by H2O2 in aqueous solutions. SiW9Co3-based POMs detect DA at concentrations as low as 5.38 × 10⁻⁶ mol·L−1 simply by observation of the color change from colorless to orange using the naked eye. RAC is detected by observing the change from colorless to slight red by SiW9Cu3 with a detection limit of 7.94 × 10⁻⁵ mol·L−1. This study shows that colorimetric DA and RAC detection using SiW9Co3 and SiW9Cu3 is highly selective and sensitive as well as visually observable.

1. Introduction

β-agonists are known as phenylethanolamines with different substituent groups on the aromatic ring and the terminal amino group. Usually, β-agonists are applied for the treatment of pulmonary disease and asthma. In recent years, β-agonists have been illegally used to promote animal growth and increase the percentage of lean meat in pig carcasses. However, the excessive addition of β-agonists in animal feed results in accumulation in human tissue after consumption of the defective meat, which can lead to acute or chronic poisoning. Therefore, there is a need to develop fast, easy, selective, and accurate methods for detecting β-agonists for protecting public health.
Dopamine (DA) and ractopamine (RAC) are the two main β-agonists in the list of banned feed additives in China and European Union (EU). A series of approaches have been developed for detecting DA, such as electrochemical analysis [1], high performance liquid chromatography (HPLC) [2], and the chemiluminescence method [3]. Methods for the detection of RAC have also been established, including capillary electrophoresis [4], HPLC [5], enzyme-linked immunoassay (ELISA) [6], electrochemical detection [7], and colloidal gold [8]. However, these methods involve complicated sample treatment procedures and have poor reproductivity. In the past decades, colorimetric detection, as one convenient approach, has been explored for providing naked-eye readout signals with simple and rapid detection assays. However, the activity and selectivity of catalysts are of crucial importance for the colorimetric detection.
In recent years, various inorganic nanomaterials have been found to have activities much like natural enzymes, which can catalyze chemical reactions in a series of physiological conditions. The activity of nano-enzymes is similar to that of natural enzymes and they both are active under physiological conditions. However, nano-enzymes have several attractive properties: they have stable activity with convenient active adjustment, and are cheap, with easy preparation. It has been found that Au nanoparticles (AuNPs) possess intrinsic peroxidase-like activity, which can catalyze oxidation substrates with H2O2 to develop colored compounds. Recently, AuNPs have been shown to oxidize the peroxidase substrate of 3,3′,5,5′-tetramethylbenzidine (TMB) in the presence of H2O2, and colored products are generated [9]. Nowadays, the application of AuNPs as peroxidase nanomimetics has gained increasing attention. They have good stability and are easily prepared, with flexibility of design for the colorimetric detection of DA through the color change associated with aggregation (red-to-purple or blue) and redispersion (purple-to-red) [10]. However, the resulting color change cannot be easily observed using naked-eye readouts, and requires a measurement instrument. A novel, rapid, and sensitive detection system is needed in this field.
Polyoxometalates (POMs) are a distinctive class of inorganic metal–oxygen clusters, which have wide applications in catalysis, materials, and nanotechnology because their transition metals are in the highest oxidation states. Therefore, POMs can show diverse peroxidase-like activity by changing the type of metals in their structure. Due to their intrinsic oxidase activity, POMs have played important roles in the colorimetric detection of cancer cells [11,12], H2O2 [13], and various other biomolecules. For the first time, Wang et al. [14] found that H3PW12O40 exhibited intrinsic peroxidase-like activity and the system of POMs/H2O2/TMB could be used for the detection of H2O2 or glucose. Then, iron-substituted POMs as peroxidases were prepared for colorimetric immunoassays of H2O2 [13] and cancer cells [12]. In recent years, progress has been made in the detection of DA with POMs by electrochemical biosensors [15,16,17]. However, to the best of our knowledge, few investigations have focused on the utilization of POMs as colorimetric immunoassay agents for rapid and sensitive chromogenic detection of DA and RAC.
Inspired by this concept, the adjustable peroxidase-like activity of POMs is proposed to be superior to that of AuNPs in the colorimetric detection of DA and RAC. Here, different metal-substituted polyoxometalates are prepared for colorimetric detection of DA and RAC. The four main findings are as follows. Firstly, the peroxidase-like activity of POMs was adjustable by varying POM structures and the substitution of transition metals, which led to changing the oxidation state of different series of POMs. Secondly, the types of metals in the structure of POMs were very important for the selective oxidation of DA and RAC. The number of metals contributed to the sensitivity of the detection system. Thirdly, the utilization of POMs could overcome the issue of the color change not being easily observable when AuNPs were used for the chromogenic detection of DA. Few studies in the literature have focused on the colorimetric detection of RAC and DA by POMs with H2O2. Fourthly, a novel method was established in this study for the colorimetric detection of RAC and DA, which was simple, rapid, easy to observe, and highly selective and sensitive.

2. Materials and Methods

2.1. Preparation of Catalysts

POMs of K4SiW12O40 (SiW12), K8SiW11O39·13H2O (SiW11), K8[γ-SiW10O36]·12H2O (SiW10), and α-Na10SiW9O34·18H2O (SiW9) were synthesized according to the method previously reported [18]. Catalysts of SiW11M, SiW10M2 and SiW9M3 (M = Co2+, Fe3+, Cu2+, Mn2+) were prepared by methods described in [19,20,21], respectively. The detailed procedure of catalysts was described in the supporting information. Chemical reagents were all of analytical grade and used without further purification. Aqueous solutions were prepared from deionized water. DA (98%), glycine, alanine, glucose, and urea were purchased from Aladdin (Shanghai, China). RAC (97%) was provided by J&K Scientific LTD (Hong Kong, China).

2.2. Procedure for the Detection of RAC

POMs (8 mM) and H2O2 (200 mM) were added into an aqueous solution of 1 mL. RAC (5 mM) was added into the above mixture, and then blended again. Reaction time was from 0 to 25 min. The sample solution was measured at 515 nm by a Shimadzu (Kyoto, Japan) UV-2700 UV-VIS spectrophotometer (200–600 nm).

2.3. Procedure for the Detection of DA

POMs (10 mM) and H2O2 (100 mM) were added into an aqueous solution of 1 mL. DA (8 mM) was added into the above mixture, and then blended again. The mixed solution was laid aside for 0–15 min. The resulting solution was measured at 475 nm by a Shimadzu UV-2700 UV-VIS spectrophotometer (200–600 nm).

2.4. Other Analytical Measurements

FT-IR spectra (4000–400 cm−1) were collected using KBr discs on a Nicolet Magna (Madison, America) 560 IR spectrometer. XRD (X-ray diffraction) patterns of catalysts were characterized by Japan Rigaku Dmax (ToKyo, Japan) 2000 X-ray diffractometer with Cu Kα radiation (λ = 0.154178 nm). XPS (X-ray photoelectron spectroscopy) spectra were recorded on an Escalab-MK II (London, England) photoelectronic spectrometer with Al Kα (1200 eV).

3. Results

3.1. Characterization of Catalysts

FT-IR and UV-VIS were used to identify the different structural among SiW11M, SiW10M2, and SiW9M3 in Table S1. These three kinds of POMs are all derivatives of Keggin POMs. The typical peaks of UV-VIS at 200 nm and 250 nm were attributed to the transition of Od-W and Ob/Oc→W, respectively, in the heteropolyacid anion. This was in accordance with the characteristic peaks of the Keggin heteropolyanions.
FT-IR results indicated that peaks in the range of 600–1100 cm−1 corresponded to the asymmetric vibrations of P-Oa, W-Od, W-Ob, and W-Oc of the Keggin structure [22]. This confirmed the compounds all maintained the Keggin structure. However, the FT-IR spectrum of SiW9M3 (Figure S1) differed from those of SiW11M and SiW10M2 due to the splitting of the peak at 600–800 cm−1 [21], and the particular results from the vibration of W-Oc-W corresponded to the structure of SiW9M3.
XRD patterns were collected to characterize the solid structure of SiW9M3, SiW9, SiW10, SiW11, and SiW12 in Figure S2. The obvious peaks of SiW9, SiW10, SiW11, and SiW12 could be observed due to their distinctive crystal structures. As derivatives of Keggin structure, catalysts of SiW9M3 also kept similar diffraction peaks to pure SiW12 (18.14°, 20.56°, 25.34°, 29.32° and 34.78°) [23]. This indicated that the primary structure of heteropolyacids remained in the series of polyoxometalates. The difference was attributed to the introduction of different metals ions.
The binding energy of SiW9M3 in the spectra of XPS gave the peaks of W 4f, Si 2p, K 2p and O 1s at 35.08, 102.8, 284.08, and 531.089 eV, respectively, confirming that elements of O and W existed as O2− and W6+ (Figure S3a) [24,25] High-resolution spectra of different metal ions are shown in Figure S3b–e, which corresponded to the energy of Co2+, Cu2+, Fe3+, and Mn2+ in the catalysts of SiW9M3.

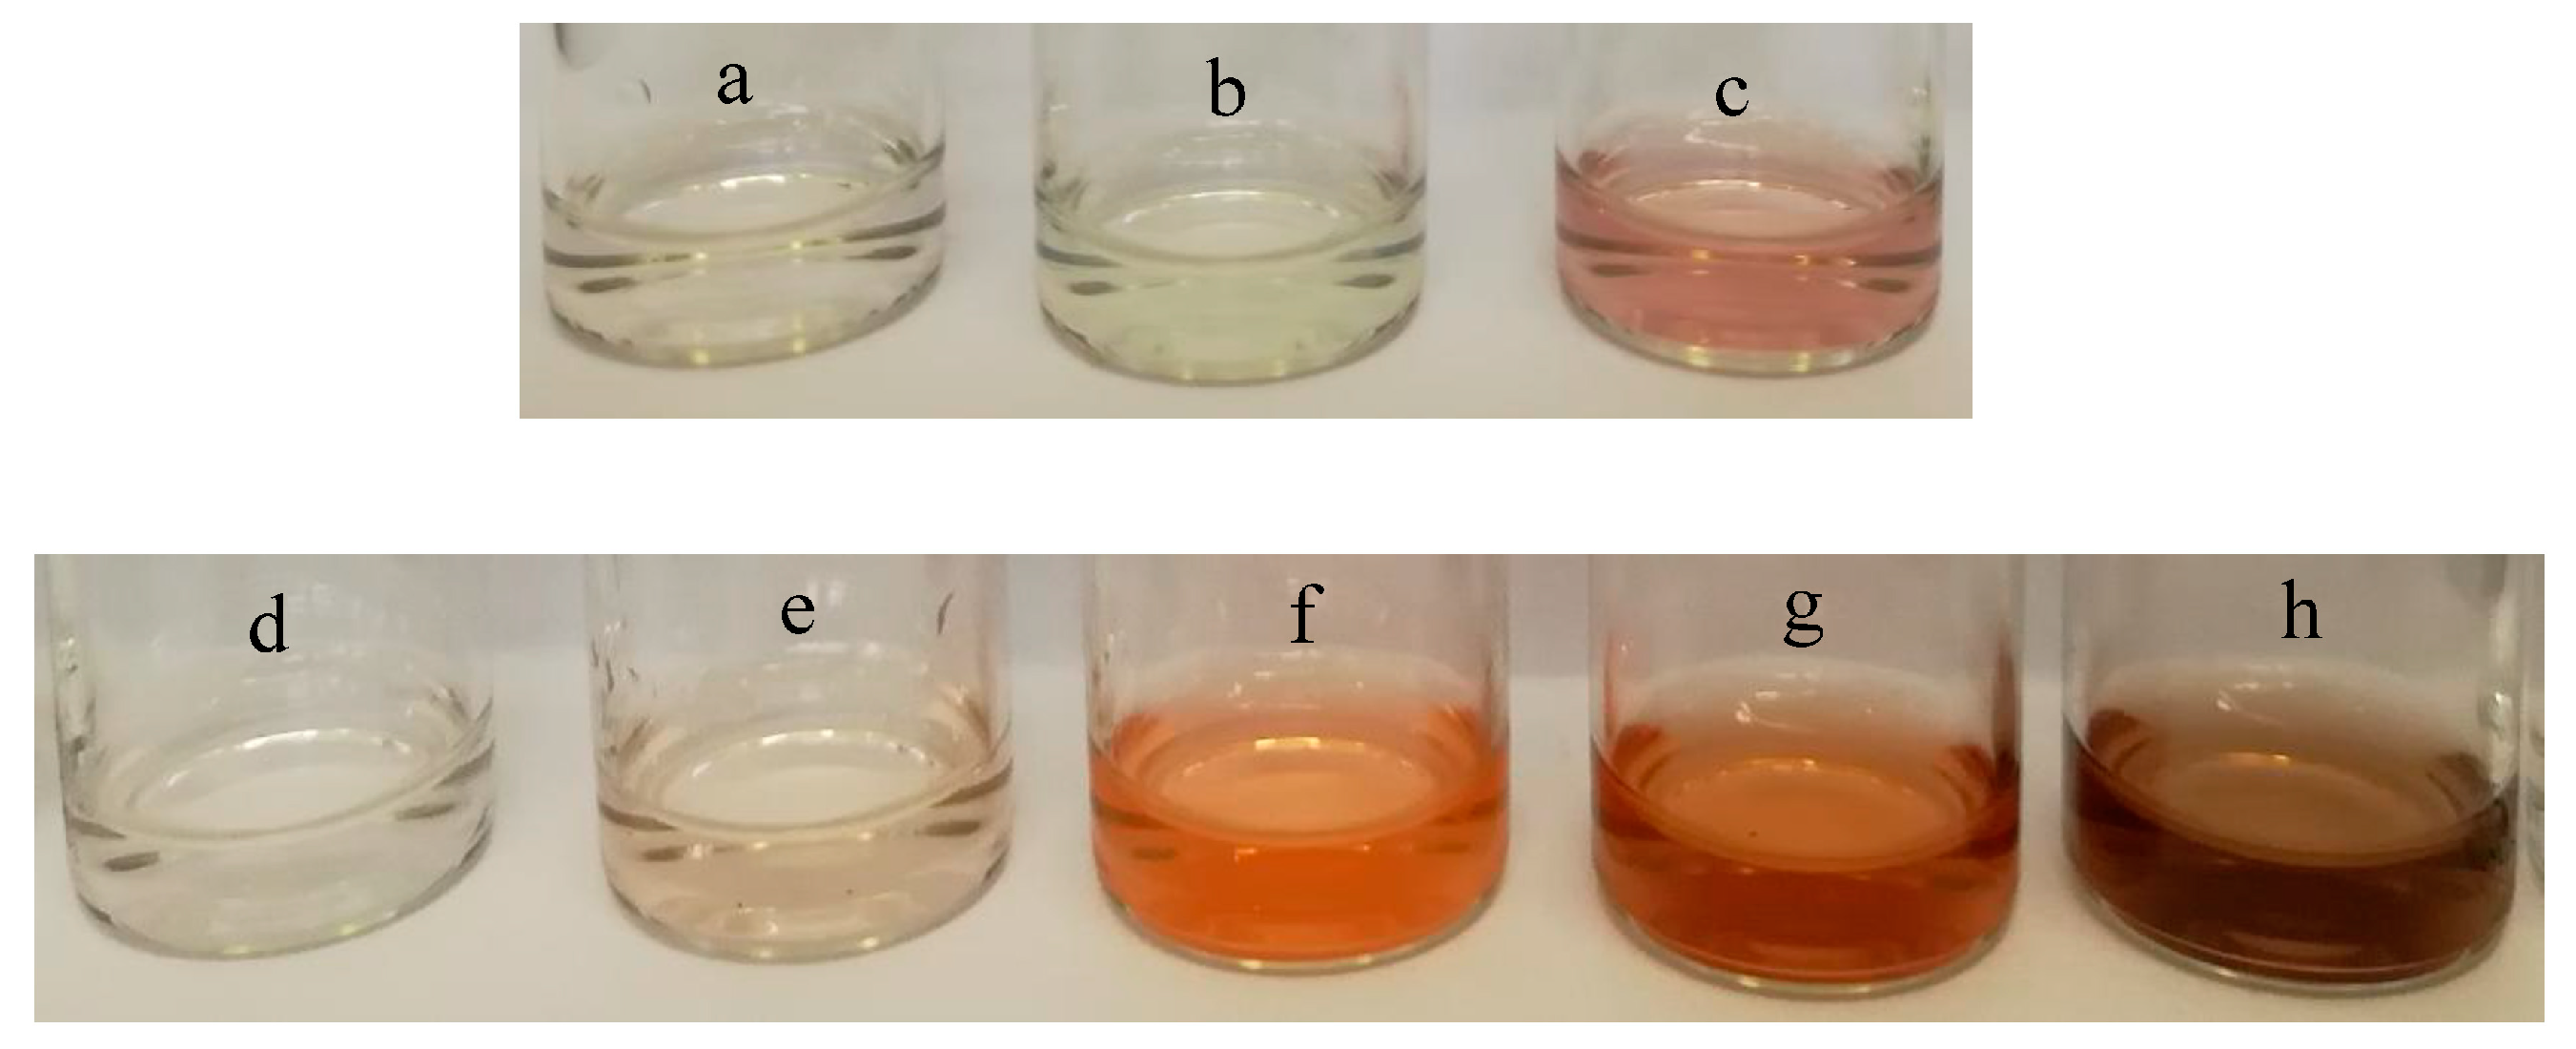
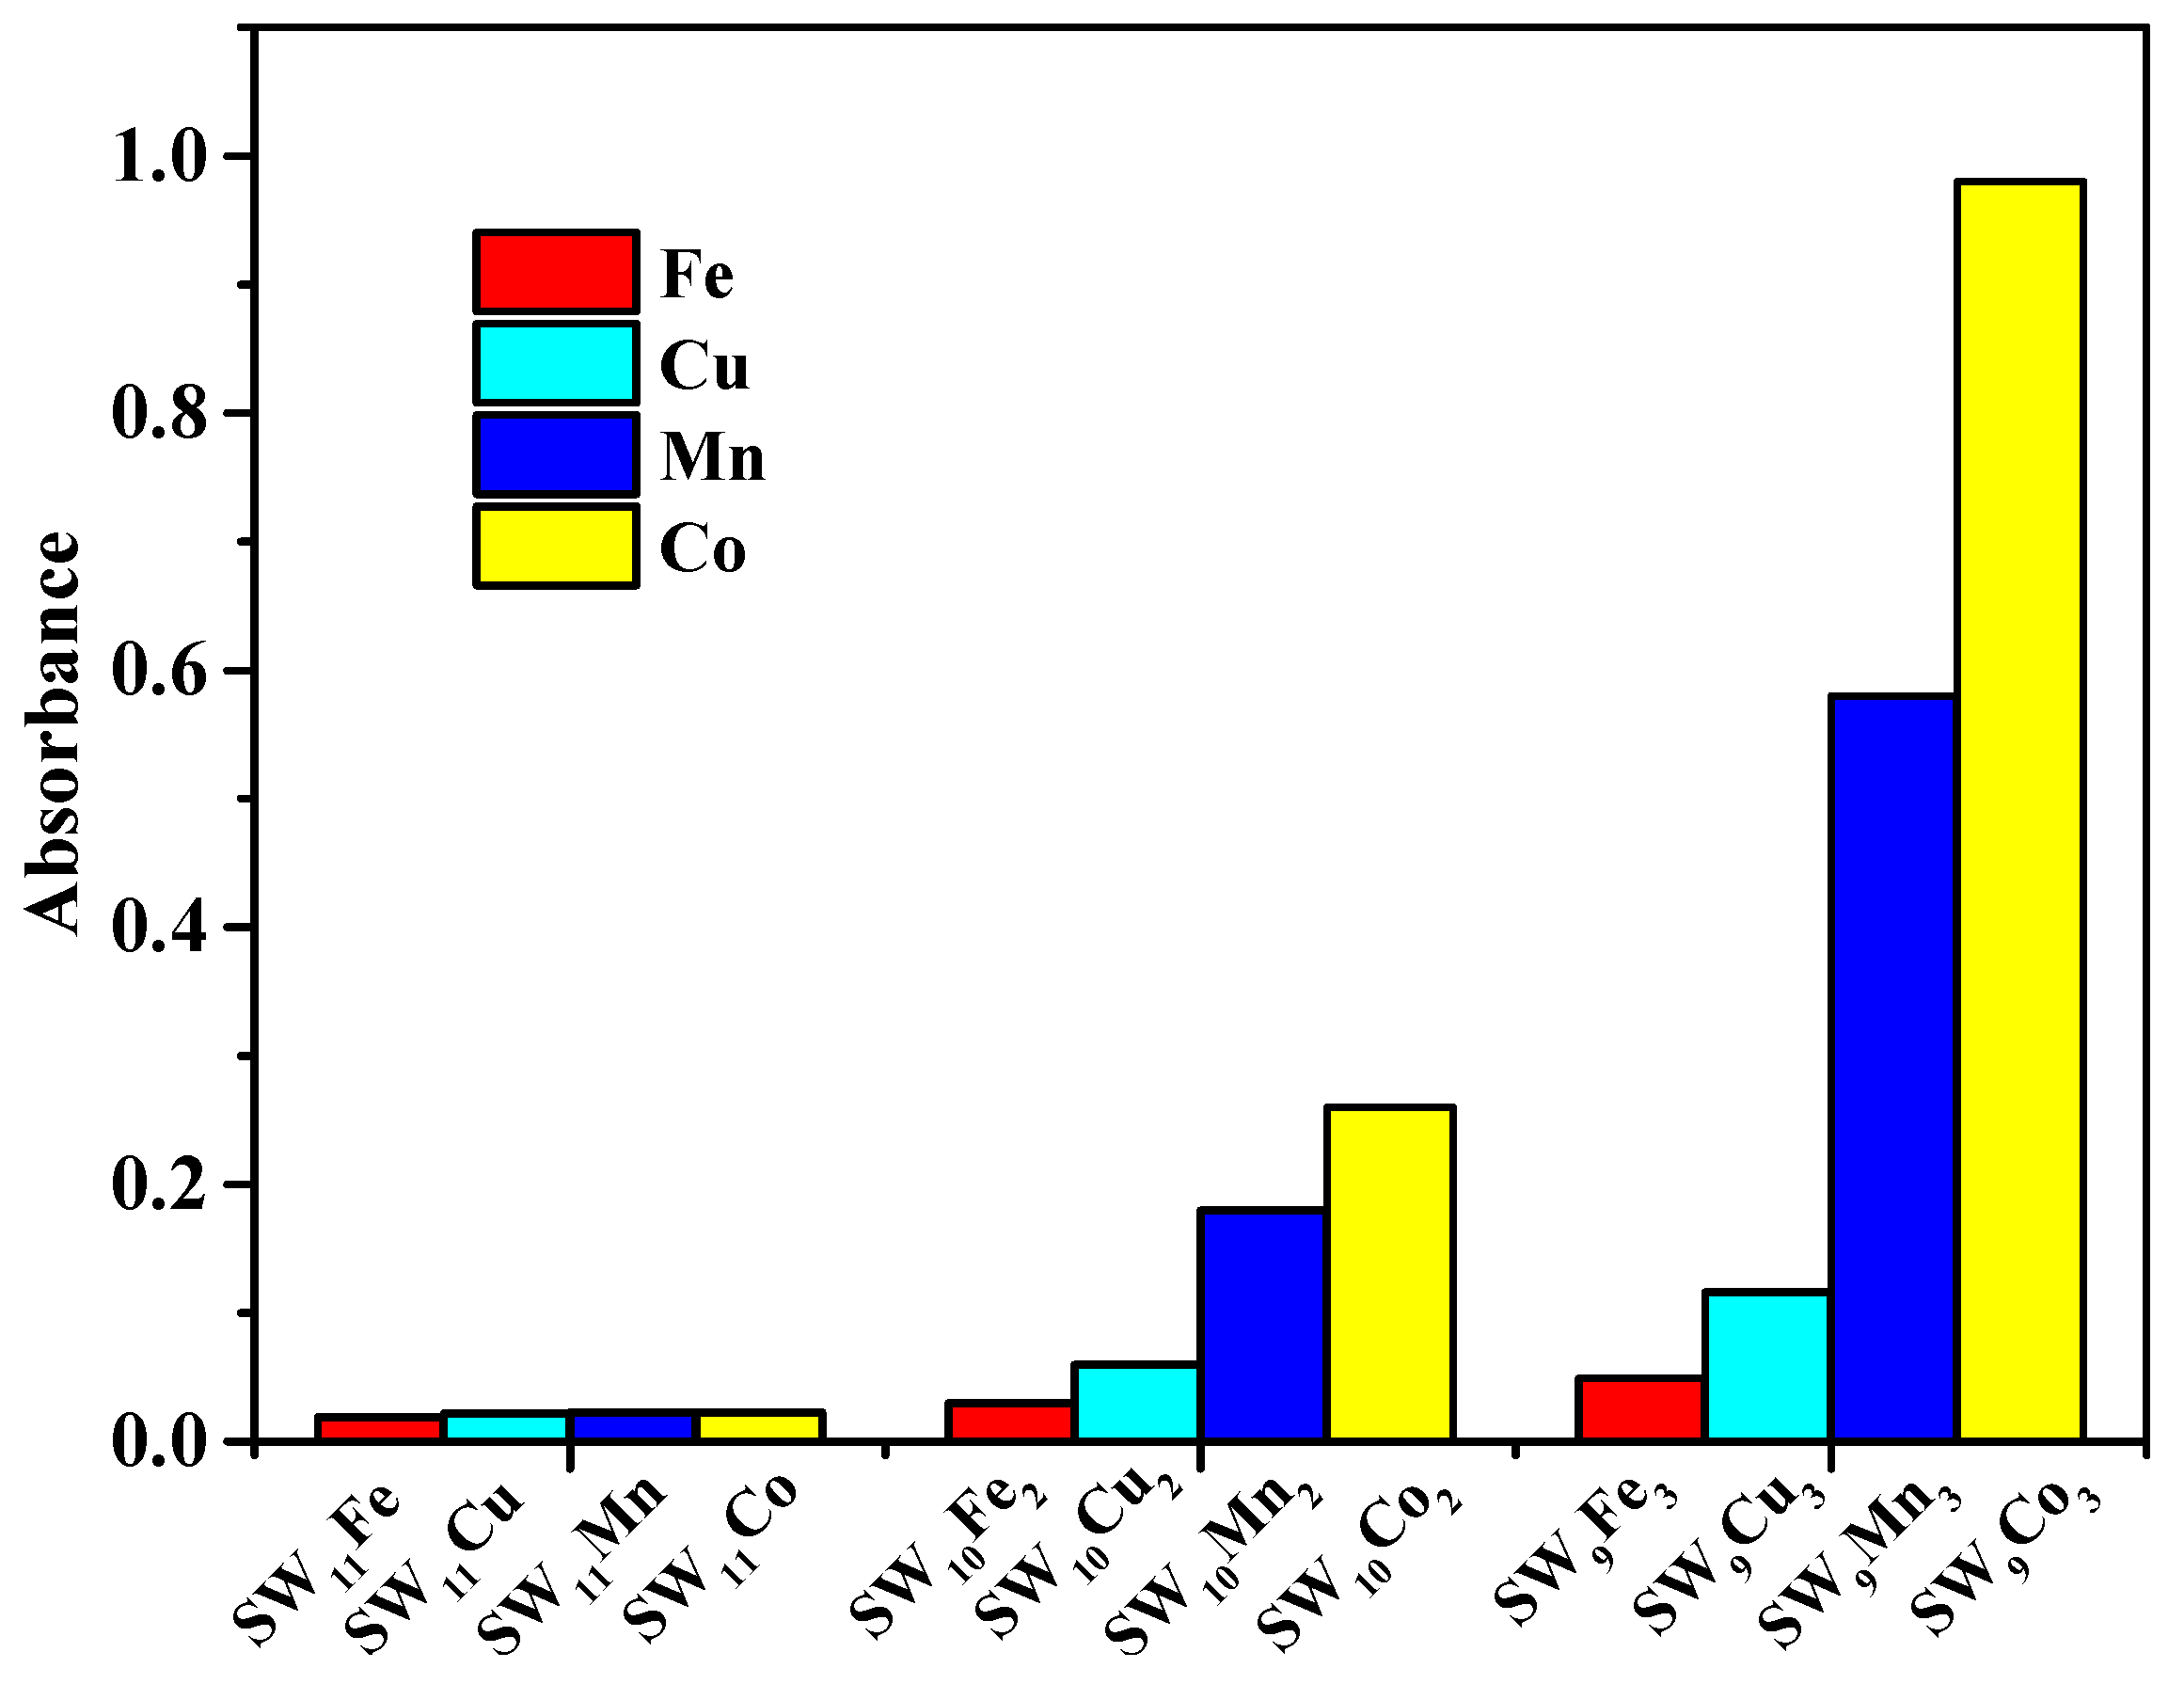
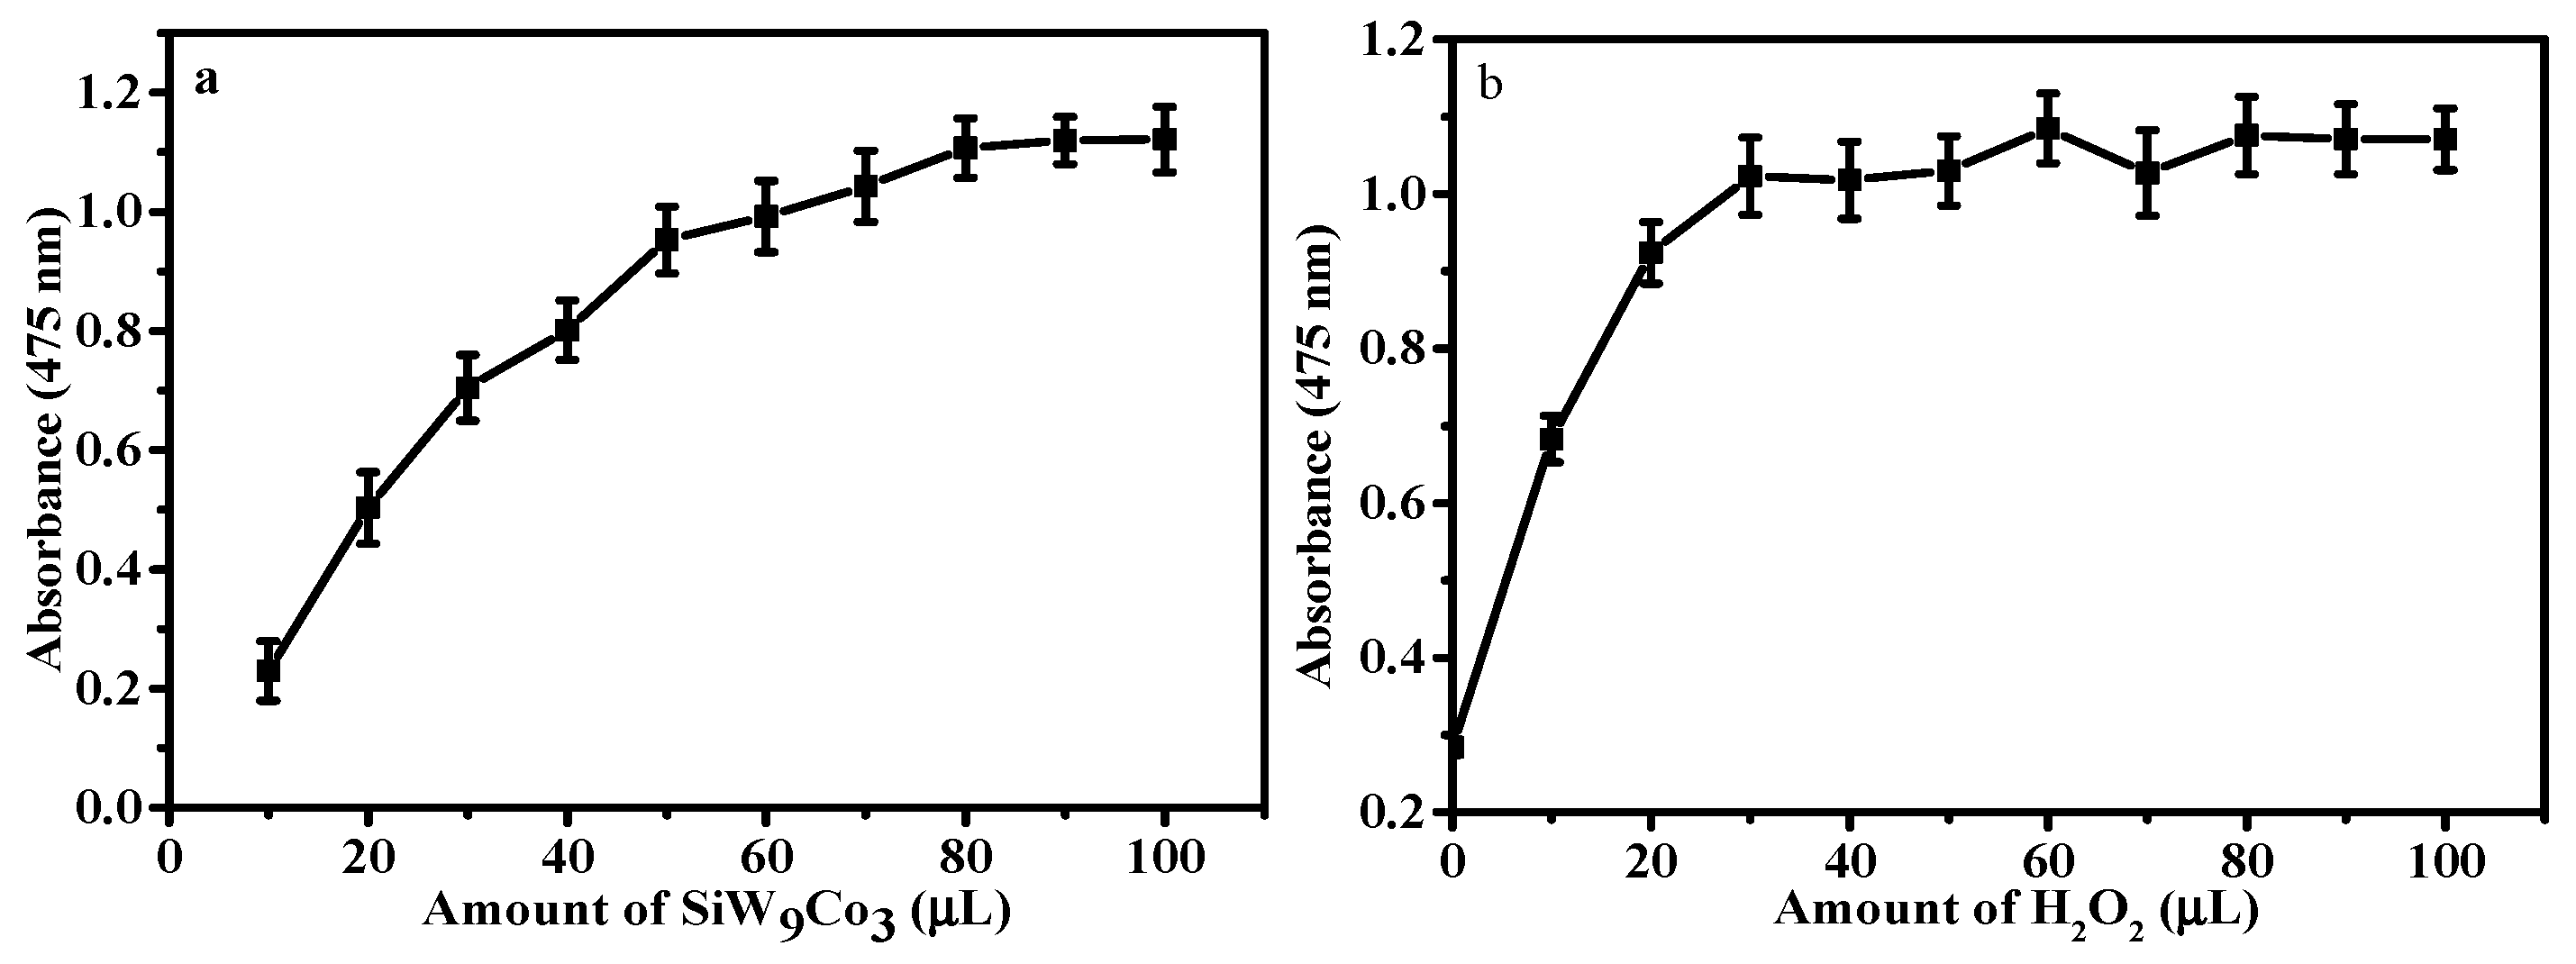
3.2. Catalytic Activity of POM Catalysts

POMs are distinctive due to their fast and reversible multi-electron redox processes, even under wild conditions. The redox property of POMs was adjusted by the type and amount of metal ions to complete the reaction with different substrates. In our investigation, it has been confirmed that the type and number of transition metal ions had a crucial effect on the catalytic results when the different POMs catalysts were used for the detection of DA and RAC.
For the detection of RAC, only the tri-substituted catalyst of SiW9Cu3 affected the colorimetric detection and provided the obvious color change from colorless to slight red (Figure 1 top). Hence, the subsequent detections of RAC were all carried out by SiW9Cu3. For the detection of DA, the catalytic activity (Figure 2) was in the order SiW9M3 > SiW10M2 > SiW11M. This indicated that the increasing number of transition metal ions led to the stronger redox property of POMs, which was beneficial to the colorimetric detection of DA. The effect of metal ions was in the order of Co > Mn > Cu > Fe, and SiW9Co3 exhibited the highest catalytic performance from colorless to orange (Figure 1 bottom). Hence, the following detection studies of DA were all carried out by SiW9Co3. The above results confirmed that the type of transition metal ions had an effect on the catalytic performance and selectivity when different POM catalysts were used for the detection of DA. The obvious color change was easy for visual discrimination, and showed a superior performance to that of AuNPs.

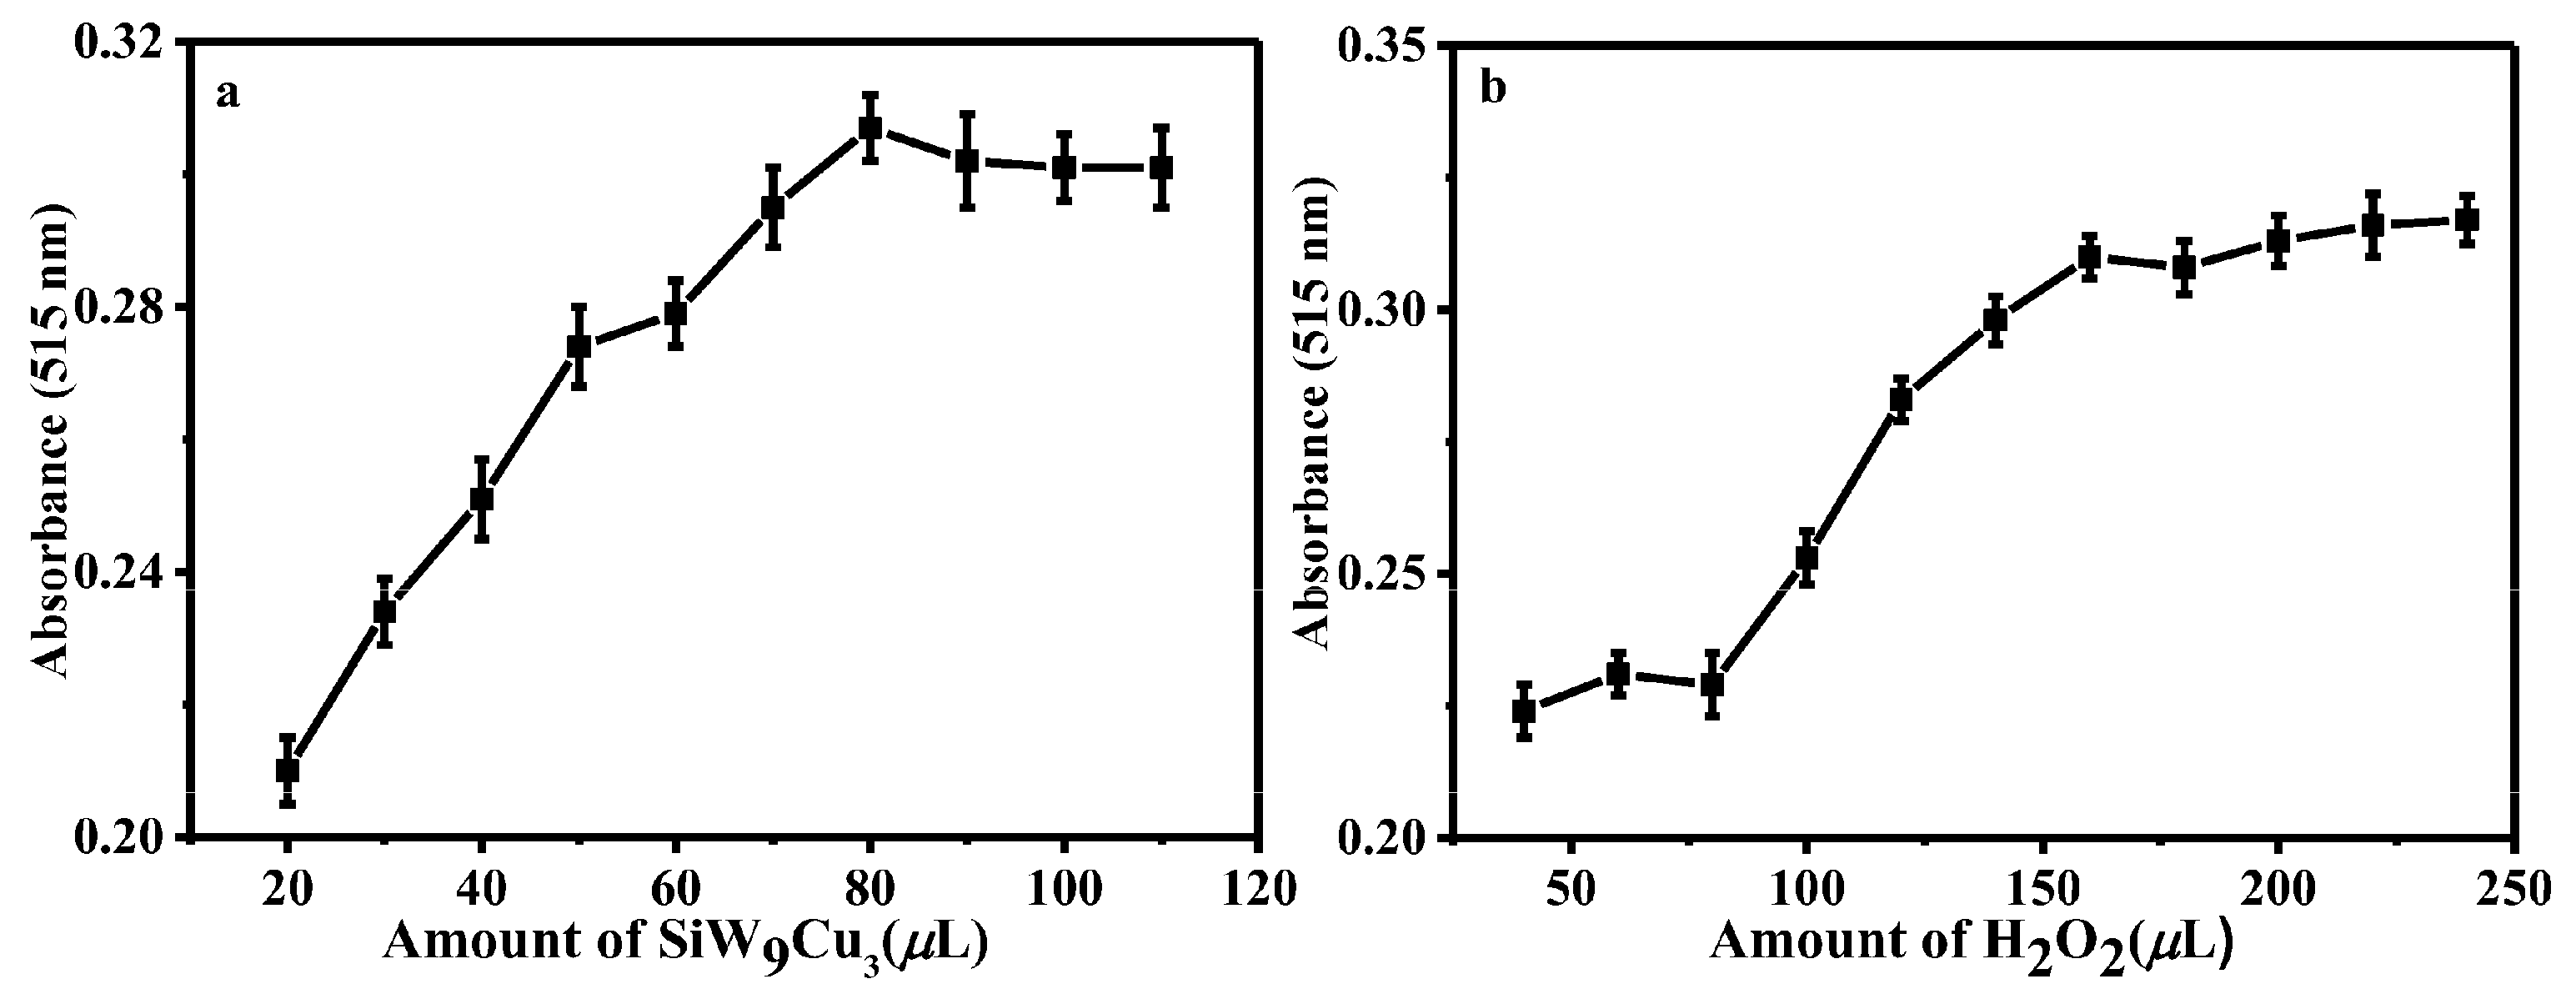
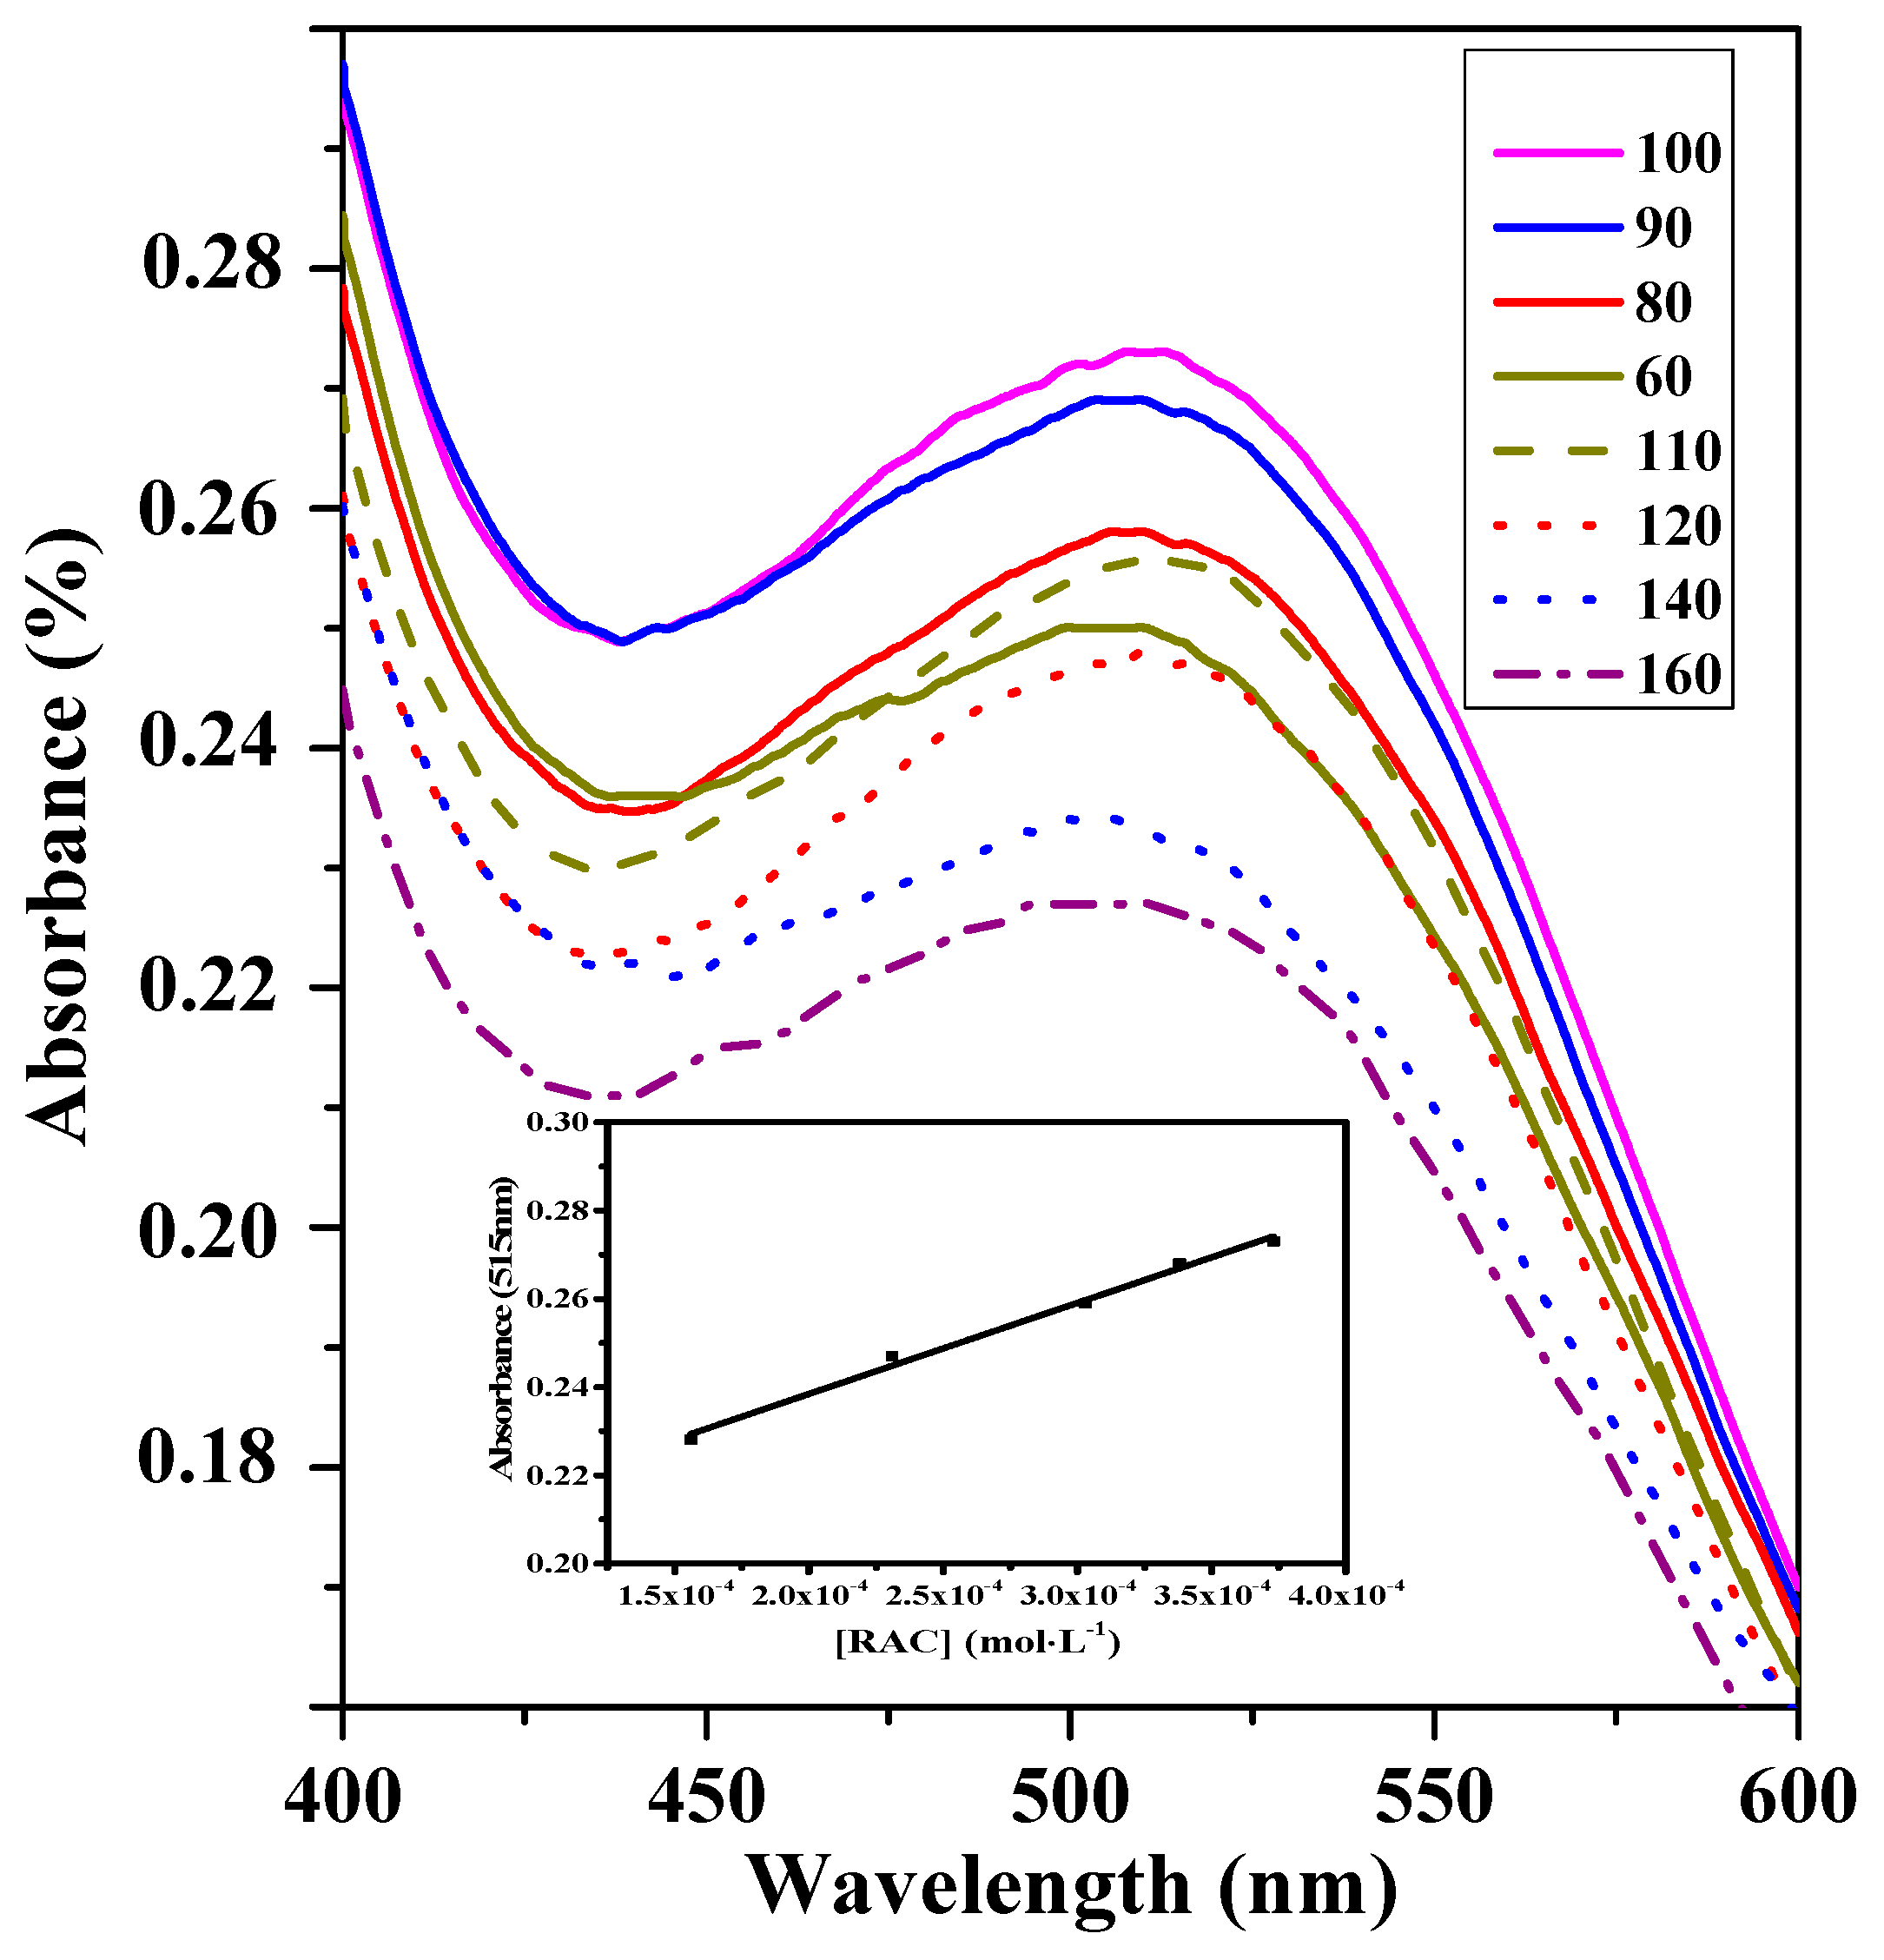
3.3. Detection of RAC
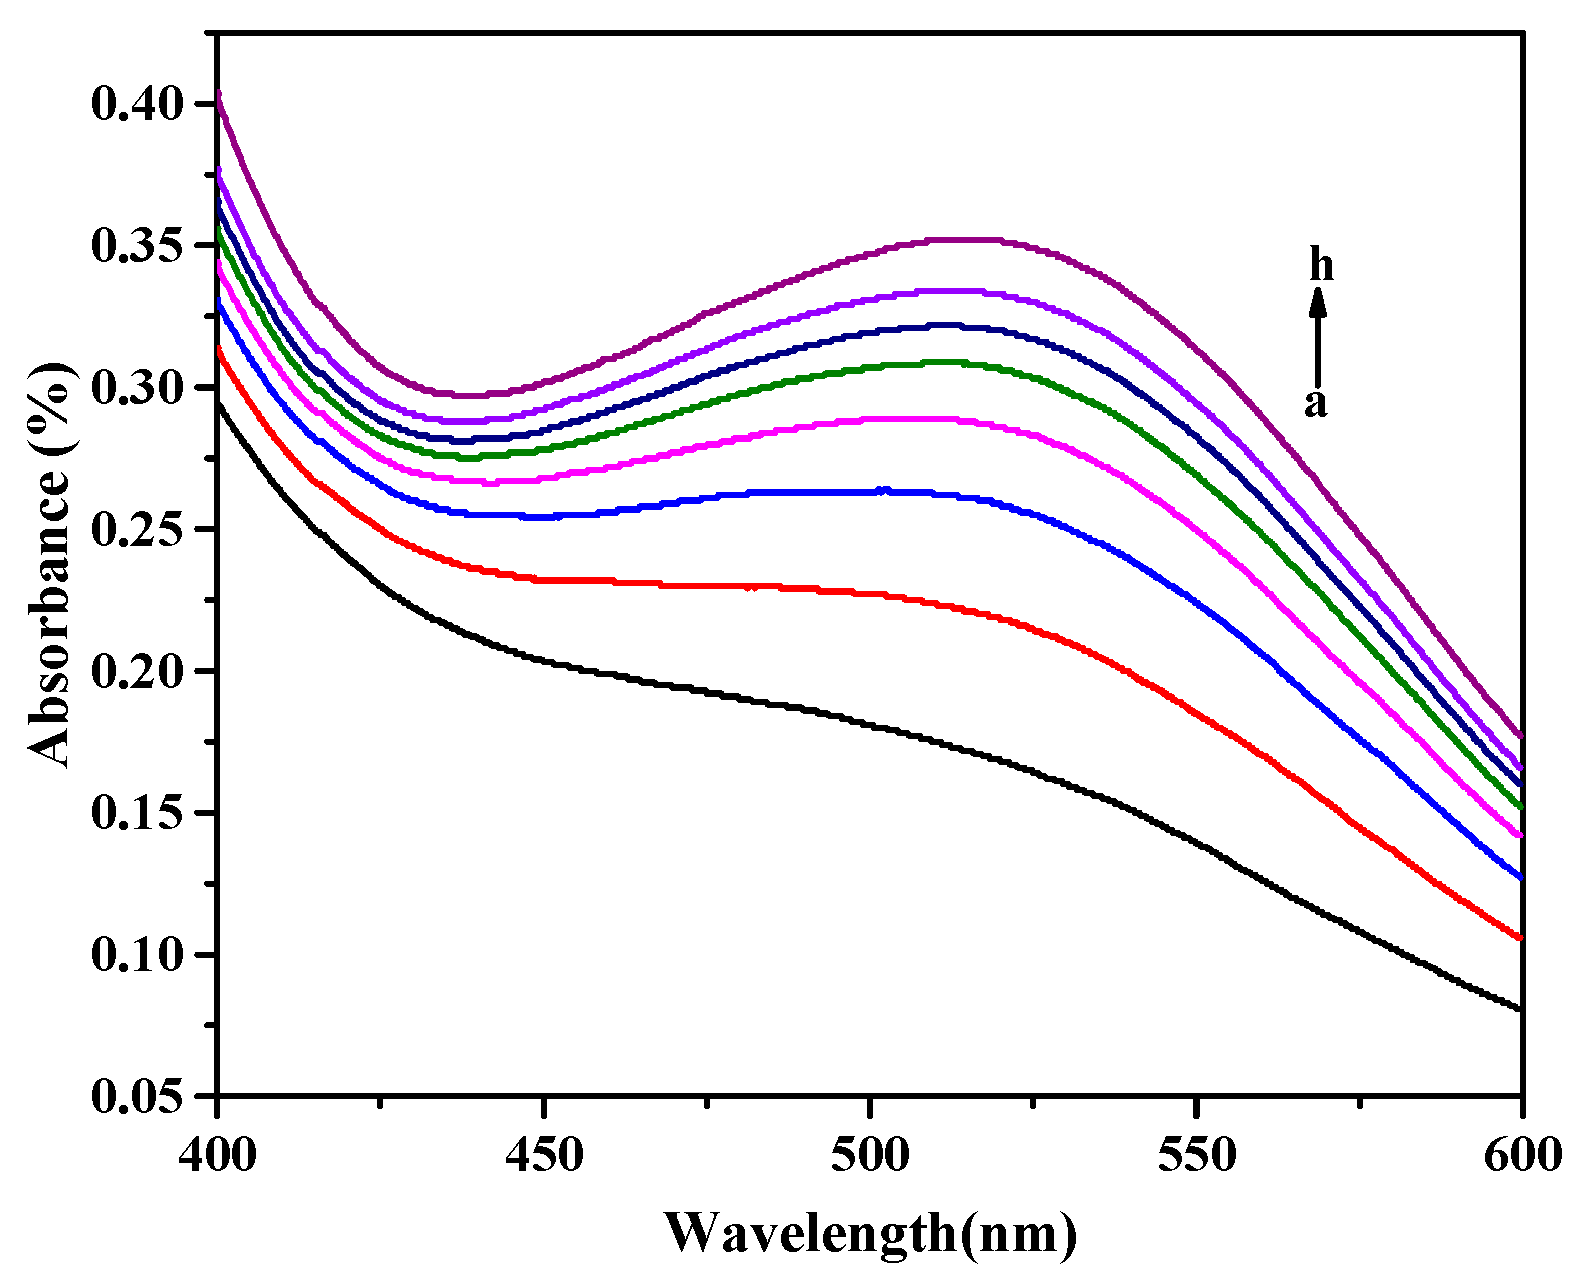
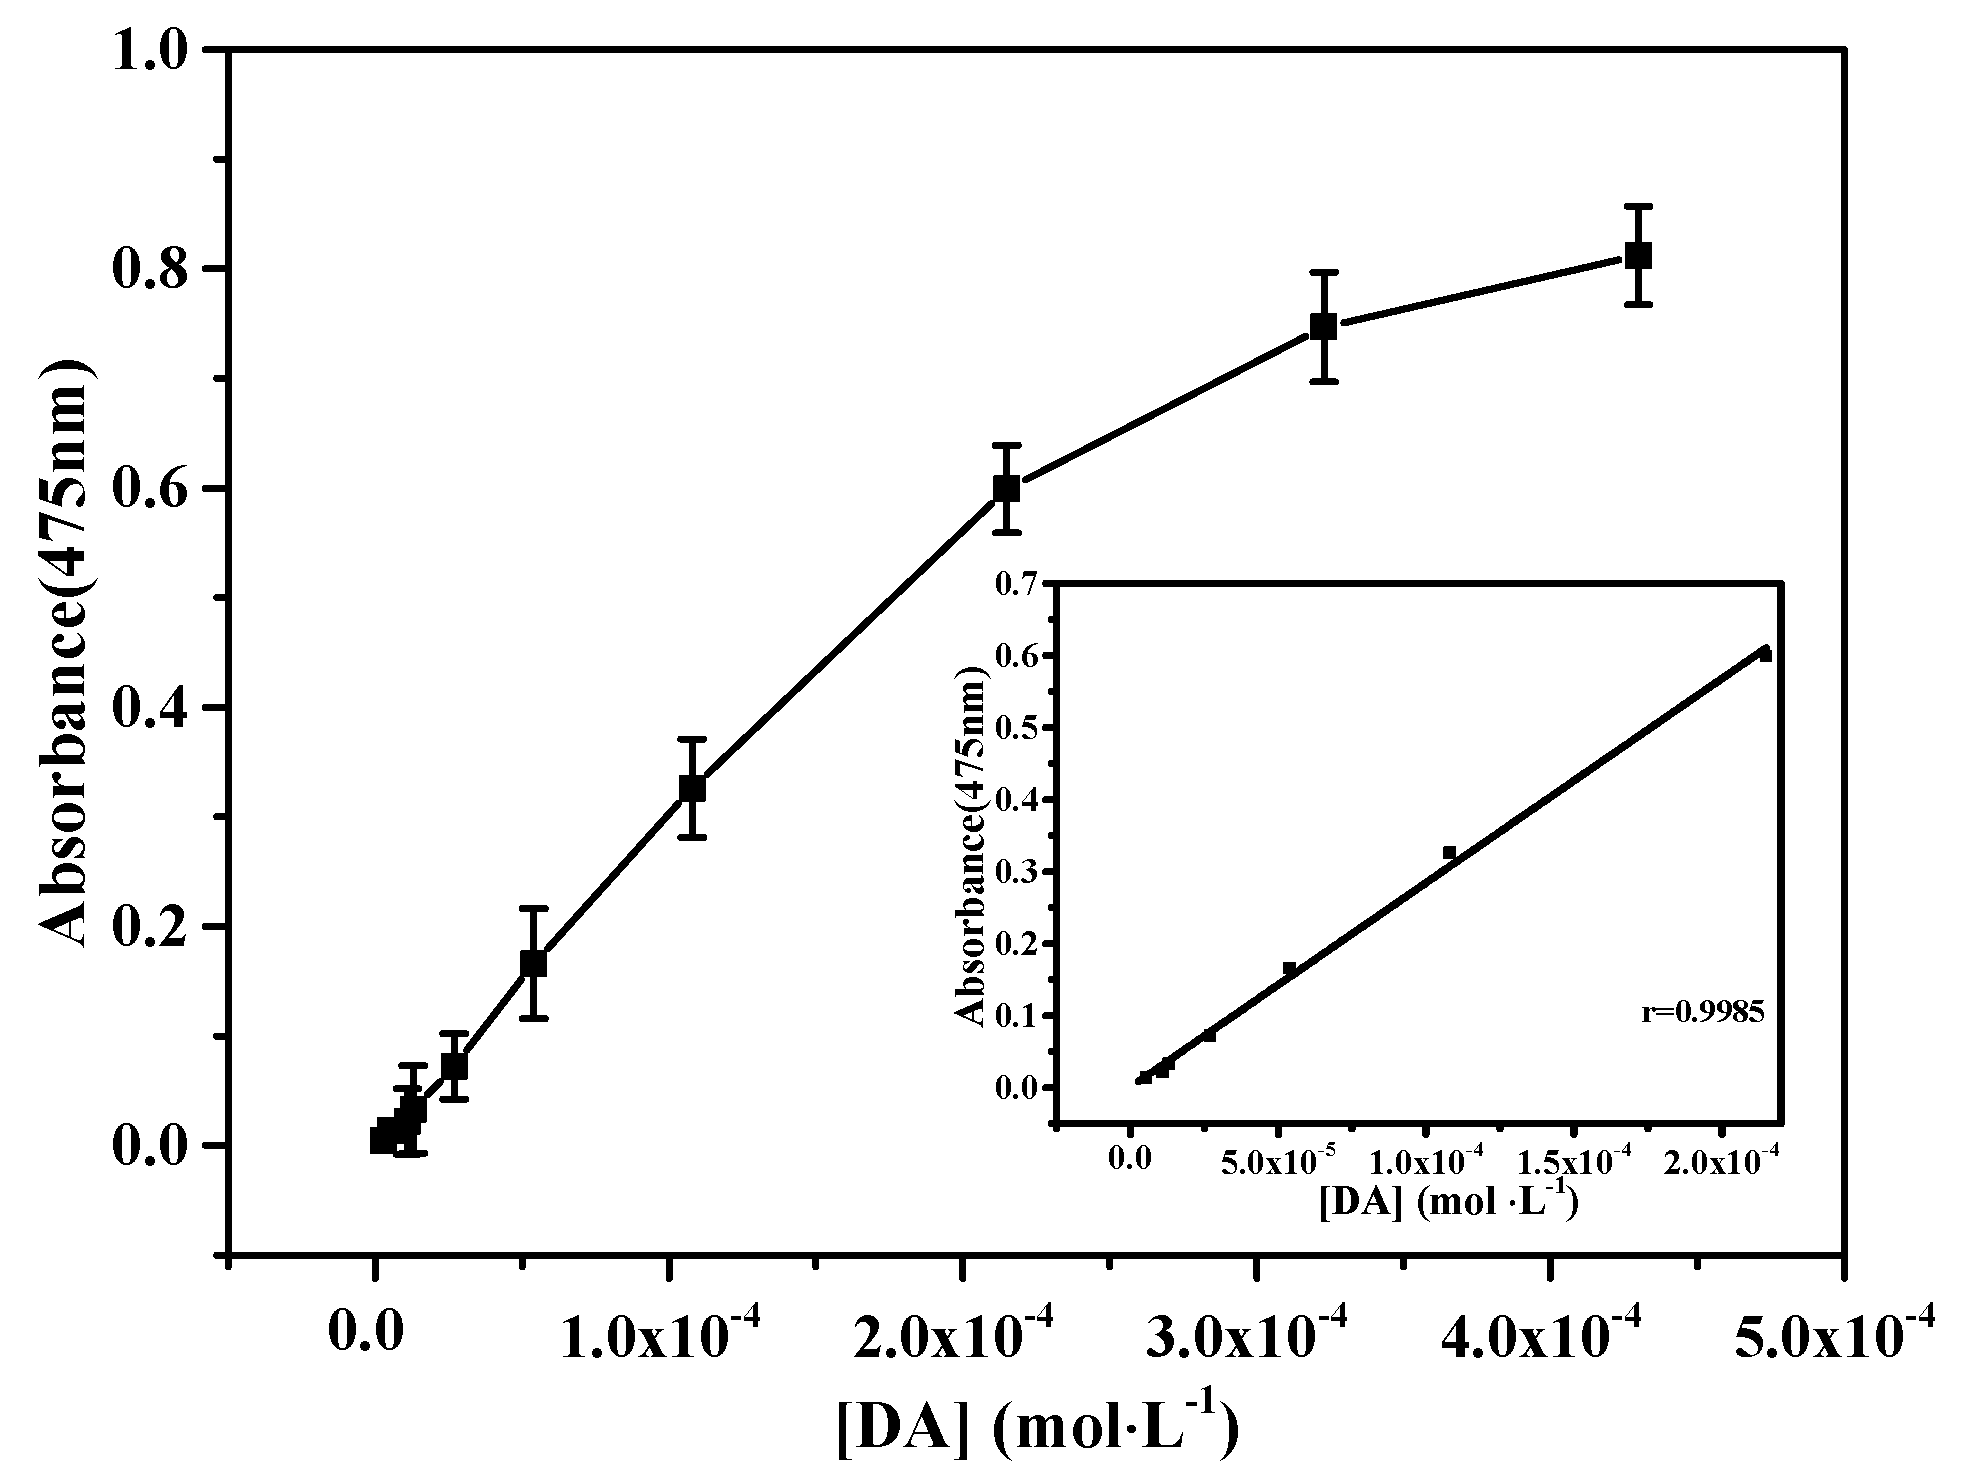
In this study, the effect of the amount of SiW9Cu3 (Figure 3a) was in the range of 20–110 µL. It was investigated at room temperature. The absorbance increased with the concentration of the catalyst, which illustrated that the POM detection system was highly specific for RAC. The performance at the concentration of 4.78 × 10⁻⁴ mol·L−1 (80 µL) was the highest, and the absorbance of 90–110 µL was slightly decreased. Hence, 80 µL of catalyst was chosen for the naked-eye observation of RAC.
As a key factor, the oxidant content of H2O2 has decisive influences on the catalysis of RAC. Results are shown in Figure 3b and increasing amounts of H2O2 caused increasing absorption. When the concentration reached 2.39 × 10⁻² mol·L−1 (160 µL), the maximum absorption was obtained. However, with further increasing the amount of H2O2, there was no obvious improvement in absorbance.
The absorption of samples was tested at room temperature every 5 min and the longest reaction time was 60 min (Figure 4). The obvious color change was observed from colorless to slight red at just under 5 min. After prolonging the response time, an increasing absorbance was obtained, but an apparent deepening of color was not observed. When reaction time was 25 min, the shape of absorption curve was significantly superior to the others. At an even longer time, the absorbance showed a slow increase and the curve shape kept constant. Thus, the optimum reaction time was determined as 25 min. The color of the solution was also stable even if the solution was laid aside for 60 min, which indicated that this system was suitable for the colorimetric detection of RAC with SiW9Cu3 in aqueous solution.
Figure 5 illustrated the amount of RAC had an effect on the colorimetric change. In the series of experiments, the amount of RAC was varied in the range of 60 to 160 µL and the solutions all showed a slight red color, which proved that the new system was suitable for qualitative detection of RAC with obvious color change. The maximum absorption was obtained at 100 µL of RAC. On further increasing the usage of RAC, the decreasing absorbance could be observed, which was attributed to the decreasing concentration of active catalyst sites and the shortage of oxidizing capacity of the system with increasing amounts of RAC. The linear range was in the range from 1.56 × 10⁻⁴ to 3.73 × 10⁻⁴ mol·L−1 and the limit of detection was 7.94 × 10⁻⁵ mol·L−1. Therefore, the optimum conditions could be considered as 80 µL SiW9Cu3, 100 µL RAC, and 160 µL H2O2, with a reaction time of 25 min.

3.4. DA Detection

As β-agonists and the most important catecholamine neurotransmitters, DA has crucial effects in the human central nervous system under physiological conditions. Hence, the following experiments were all conducted in aqueous solutions, representing a wide range of application conditions in the biometric technology, medical, and pharmaceutical fields.
Figure 6a illustrates the effect of the concentration of SiW9Co3 on the oxidation of DA at room temperature. When the usage of SiW9Co3 was in the range of 0–7.81 × 10⁻⁴ mol·L−1, the absorbance increased with the concentration of catalyst, which illustrated that the system was highly specific to DA. The concentration of 6.35 × 10⁻⁴ mol·L−1 (80 µL) was considered as the optimum usage amount.
The influence of H2O2 (Figure 6b) was also detected at room temperature in the experiment. The absorption increased remarkably with the concentration of oxidant. The maximum absorption was observed at 4.76 × 10⁻³ mol·L−1 (60 µL). Then, the results were slightly decreased by increasing the concentration of H2O2. This indicated that the amount of H2O2 was crucial in the experiment.
The appropriate reaction time is also one of the necessary reaction conditions for the colorimetric detection of DA. The results of absorbance (Figure 7) increased with the prolonged reaction time and the optimum time was 10 min. However, with further increasing reaction time, the color of solution was changed from orange to dark brown, which was less observable using the naked eye for readouts.
It was confirmed that SiW9CoII3 was oxidized by H2O2 and then the product of SiW9CoIIImCoII3-m reacted with DA by the reaction of catalytic oxidation [26,27]. As a result, the orange aminochrome (AC) was formed, which was detected at 475 nm with UV-VIS spectrometer, and could be applied for colorimetric detection. Figure 1 (bottom photographs) demonstrates the colorimetric process for DA with SiW9Co3 and an obvious color change could be observed from colorless to orange by the naked eye within an appropriate reaction time. However, a longer reaction time was not beneficial to the color observation because the AC can regroup as 5,6-dihydroxyindole (DHI) which was further oxidized to indole-5,6-quinone (IQ). Finally dark brown neuromelanin was generated.
The concentration of DA could be detected by SiW9Co3 under the optimum reaction condition. As shown in Figure 8, the calibration plot for absorbance at 475 nm against catalyst activity of DA was detected with a linear range from 1.08 × 10⁻⁴ to 5.38 × 10⁻⁶ mol·L−1. The linear relationship indicated that the detection was kinetically controlled by DA and thus the reporting system could be used for the DA activity assay.
According to CODEX, the highest limitation of RAC is 2.96 × 10⁻⁸ mol·L−1 (10 ppb). DA is also one of the main β-agonists. Thus, studies [28,29,30,31,32,33,34] have been put forward (Table 1). In recent years, electrochemical biosensors [15,16,17] based on POMs have made a rapid progress in the detection of DA. Compared with the other results in the colorimetric detection of DA and RAC, SiW9Co3 is shown to represent a rapid simple detective system for DA with the addition of only H2O2. In recent years, few studies have reported on the use of POMs for the colorimetric detection of RAC. A new detection system of RAC was put forward in this study that was simple, easily observable using the naked eye, and stable over time.

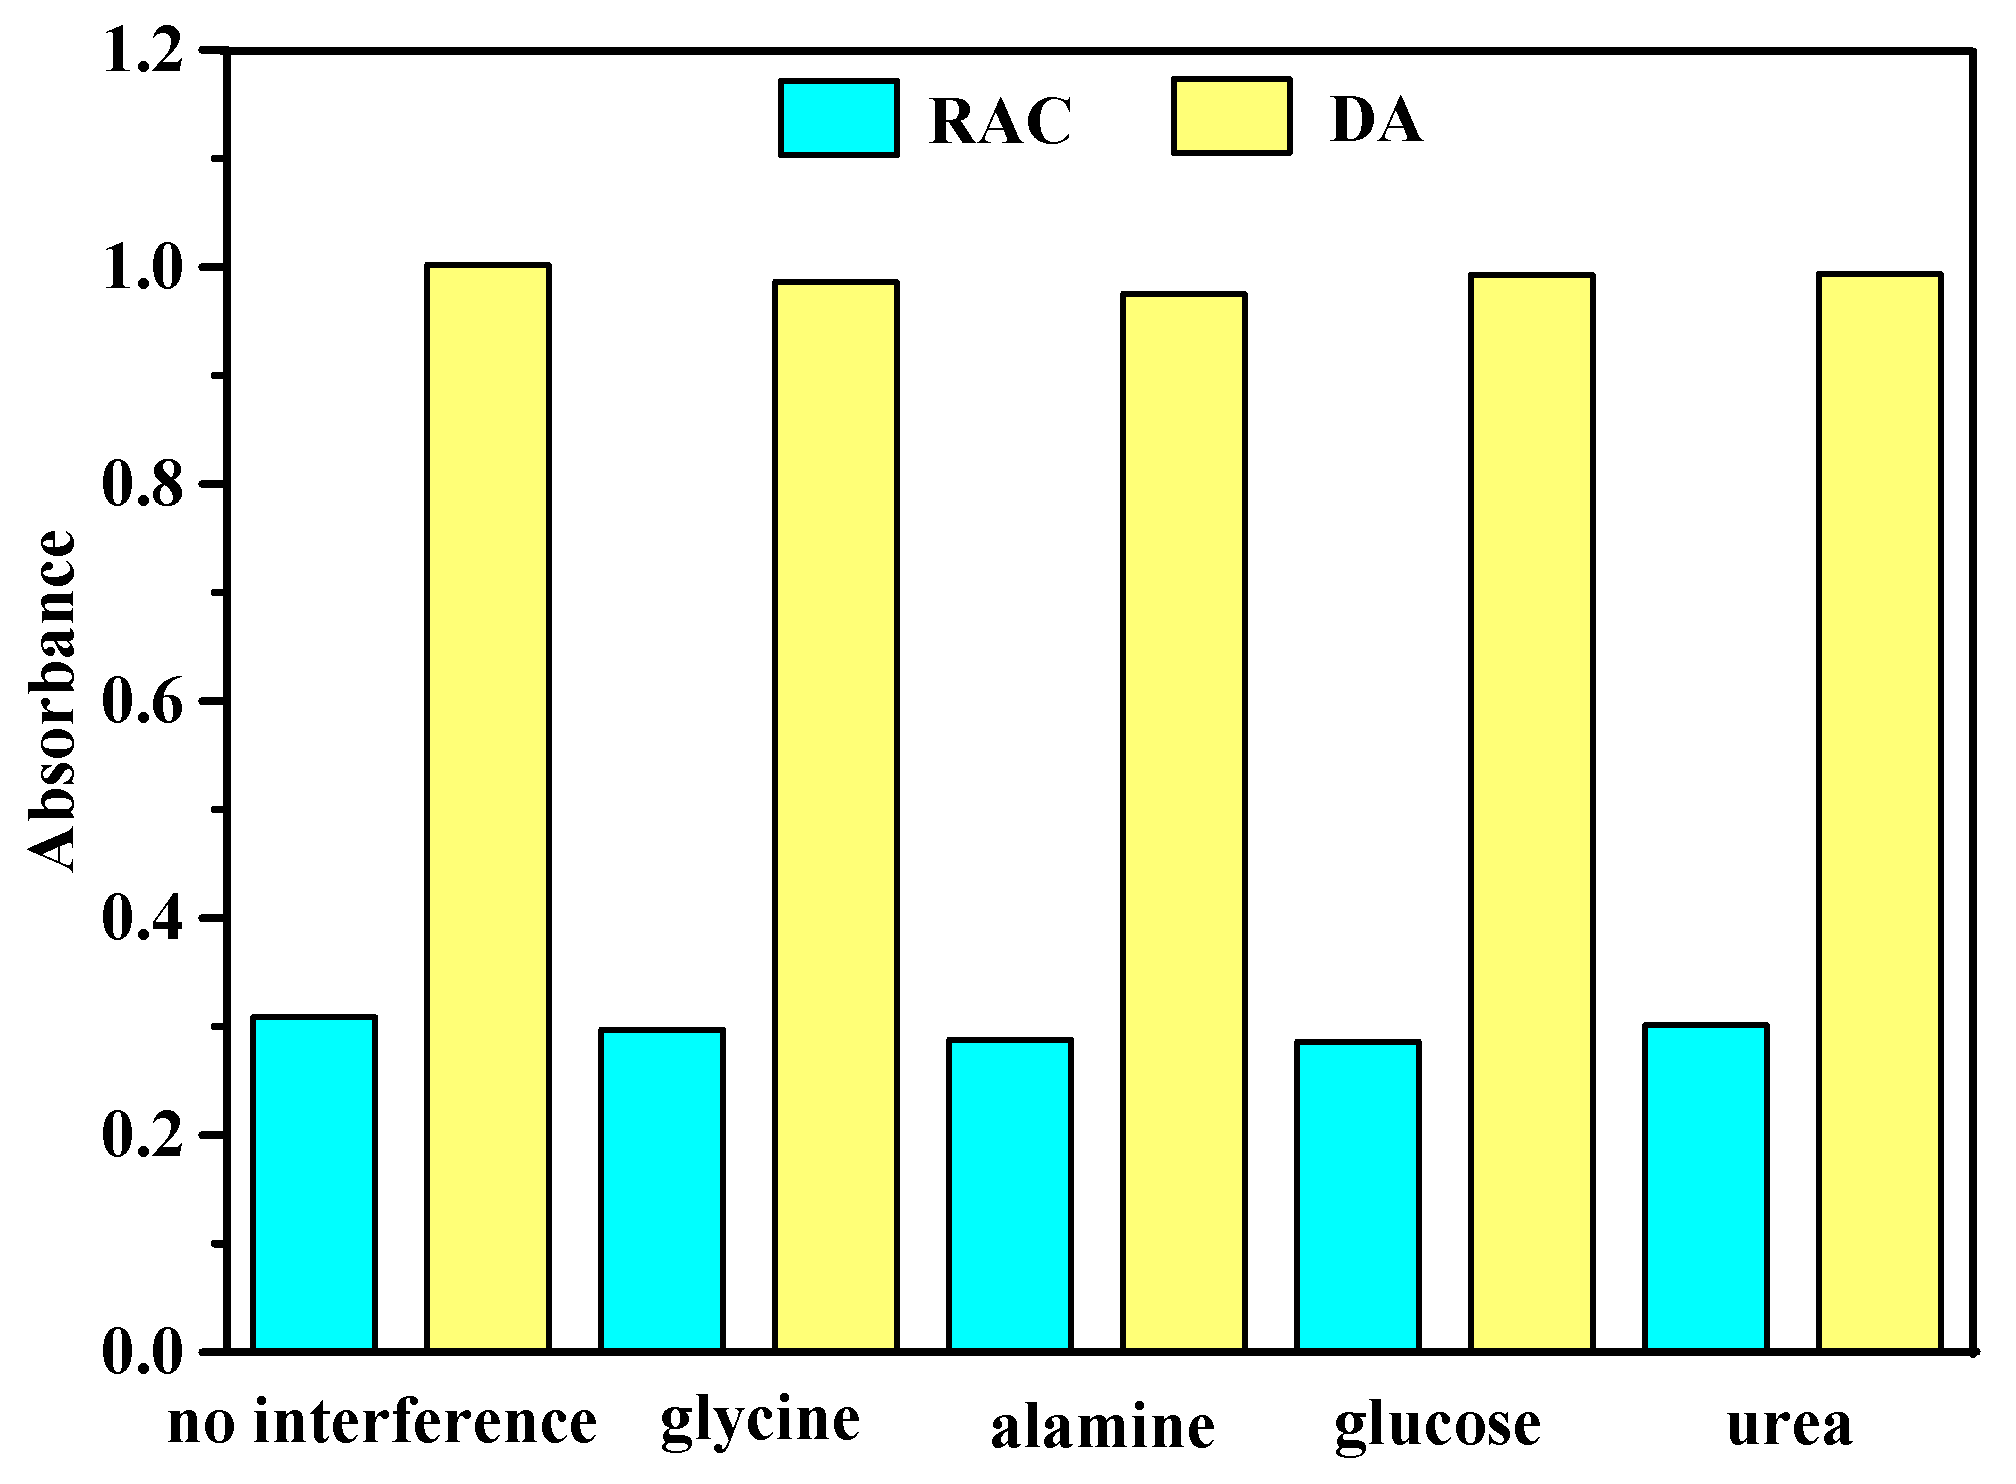
3.5. Interference Detection

The amino group was effective in the structure of DA and RAC for colorimetric detection [35]. In order to validate the reliability of the proposed method, the influence of the other molecules containing the amino group should be discussed in the sample detection. Four chemicals, including glycine, alanine, glucose, and urea, were selected as interfering substances to evaluate the selectivity of catalysts, and results are presented in Figure 9. It was evident that interfering substances did not lead to a higher absorbance, which revealed that the system was highly selective for DA and RAC. Therefore, it was clear that SiW9Co3 and SiW9Cu3 were specific for the colorimetric detection of DA and RAC, respectively.

4. Conclusions

Novel detection systems for DA and RAC have been established with POMs with highly visible color change for the first time. SiW9Co3 exhibited a color change from colorless to orange with H2O2 for the detection of DA. SiW9Cu3 produced a color change from colorless to slight red for the detection of RAC with H2O2. SiW9Co3 and SiW9Cu3 both led to a more convenient method for observation using the naked eye only. Therefore, these catalysts have great application potential for the detection of DA and RAC in aqueous solutions, and the corresponding detection system is simple, rapid, selective, and sensitive to DA and RAC.

Supplementary Materials

The following are available online at https://www.mdpi.com/1996-1944/11/5/674/s1. Table S1: Results of FT-IR and UV-VIS of SiW11M, SiW10M2, and SiW9M3 (M = Co2+, Fe3+, Cu2+, Mn2+). Figure S1: FT-IR spectra of SiW9M3 (M = Co2+, Fe3+, Cu2+, Mn2+). Figure S2: XRD patterns of SiW9M3 (M = Co2+, Fe3+, Cu2+, Mn2+), SiW9, SiW10, SiW11, and SiW12. Figure S3: XPS spectra of SiW9M3 (M = Co2+, Fe3+, Cu2+, Mn2+). Survey (a) high-resolution of Co 2p (b), Cu 2p (c), Fe 2p (d), and Mn 2p (e). Preparation of catalysts including K4SiW12O40 (SiW12), K8SiW11O39·13H2O (SiW11), K8[γ-SiW10O36]·12H2O (SiW10), α-Na10SiW9O34·18H2O (SiW9), SiW11M, SiW10M2, and SiW9M3 (M = Co2+, Fe3+, Cu2+, Mn2+).

Author Contributions

X.D. designed and performed the experiments and contributed to the manuscript preparation. Z.B. and X.S. assisted in finalizing the research work. J.X. analyzed the data, and N.Y. revised the manuscript. J.S. and X.W. put forward the main research idea. All authors discussed and approved the final manuscript.

Acknowledgments

We acknowledge financial support from the National Natural Science Foundation of China (21401007).

Conflicts of Interest

The authors declare no conflict of interest.

References

  1. Baldrich, E.; Rodrigo, G.; Gemma, G.X.; Francesc, M. Magnetic entrapment for fast, simple and reversible electrode modification with carbon nanotubes: Application to dopamine detection. Biosens. Bioelect. 2011, 26, 1876–1882. [Google Scholar] [CrossRef] [PubMed]
  2. Syslova, K.; Rambousek, L.; Kuzma, M.; Najmanova, V.; Bubenikova-Valesova, V.; Slamberova, R.; Kacer, P. Monitoring of dopamine and its metabolites in brain microdialysates: Method combining freeze-drying with liquid chromatography–tandem mass spectrometry. J. Chromatogr. A 2011, 1218, 3382–3391. [Google Scholar] [CrossRef] [PubMed]
  3. Li, L.L.; Liu, H.Y.; Shen, Y.Y.; Zhang, J.R.; Zhu, J.J. Electrogenerated chemiluminescence of Au nanoclusters for the detection of dopamine. Anal. Chem. 2011, 83, 661–665. [Google Scholar] [CrossRef] [PubMed]
  4. Wang, W.; Zhang, Y.; Wang, J.; Shi, X.; Ye, J. Determination of beta-agonists in pig feed, pig urine and pig liver using capillary electrophoresis with electrochemical detection. Meat Sci. 2010, 85, 302–305. [Google Scholar] [CrossRef] [PubMed]
  5. Du, W.; Zhao, G.; Fu, Q.; Sun, M.; Zhou, H.; Chang, C. Combined microextraction by packed sorbent and high-performance liquid chromatography-ultraviolet detection for rapid analysis of ractopamine in porcine muscle and urine samples. Food Chem. 2014, 145, 789–795. [Google Scholar] [CrossRef] [PubMed]
  6. Pleadin, J.; Persi, N.; Vulic, A.; Milic, D.; Vahcic, N. Determination of residual ractopamine concentrations by enzyme immunoassay in treated pig’s tissues on days after withdrawal. Meat Sci. 2012, 90, 755–758. [Google Scholar] [CrossRef] [PubMed]
  7. Chen, D.; Yang, M.; Zheng, N.J.; Xie, N.; Liu, D.L.; Xie, C.F.; Yao, D.S. A novel aptasensor for electrochemical detection of ractopamine, clenbuterol, salbutamol, phenylethanolamine and procaterol. Biosens. Bioelectron. 2016, 80, 525–531. [Google Scholar] [CrossRef] [PubMed]
  8. Zhang, M.Z.; Wang, M.Z.; Chen, Z.L.; Fang, J.H.; Fang, M.M.; Liu, J.; Yu, X.P. Development of a colloidal gold-based lateral-flow immunoassay for the rapid simultaneous detection of clenbuterol and ractopamine in swine urine. Anal. Bioanal. Chem. 2009, 395, 2591–2599. [Google Scholar] [CrossRef] [PubMed]
  9. Jv, Y.; Li, B.; Cao, R. Positively-charged gold nanoparticles as peroxidiase mimic and their application in hydrogen peroxide and glucose detection. Chem. Commun. 2010, 46, 8017–8019. [Google Scholar] [CrossRef] [PubMed]
  10. Zhao, W.; Brook, M.A.; Li, Y.F. Design of gold nanoparticle-based colorimetric biosensing assays. ChemBioChem 2008, 9, 2363–2371. [Google Scholar] [CrossRef] [PubMed]
  11. Wang, J.J.; Mi, X.G.; Guan, H.Y.; Wang, X.H.; Wu, Y. Assembly of folate-polyoxometalate hybrid spheres for colorimetric immunoassay like oxidase. Chem. Commun. 2011, 47, 2940–2942. [Google Scholar] [CrossRef] [PubMed]
  12. Sun, Z.; Bie, H.Z.; Wei, M.J.; Wang, J.J.; Mi, X.G.; Wang, X.H.; Wu, Y. Fabrication of inorganic—Organic hybrid based on polyoxometalate SiW10Fe2 and folate as peroxidases for colorimetric immunoassay of cancer cells. Chin. Chem. Lett. 2013, 24, 76–78. [Google Scholar] [CrossRef]
  13. Sun, C.L.; Chen, X.L.; Xu, J.; Wei, M.J.; Wang, J.J.; Mi, X.G.; Wang, X.H.; Wu, Y.; Liu, Y. Fabrication of an inorganic–organic hybrid based on an iron-substituted polyoxotungstate as a peroxidase for colorimetric immunoassays of H2O2 and cancer cells. J. Mater. Chem. A 2013, 1, 4699–4705. [Google Scholar] [CrossRef]
  14. Wang, J.J.; Han, D.X.; Wang, X.H.; Qi, B.; Zhao, M.S. Polyoxometalates as peroxidase mimetics and their applications in H2O2 and glucose detection. Biosens. Bioelectron. 2012, 36, 18–21. [Google Scholar] [CrossRef] [PubMed]
  15. Zhou, C.L.; Li, S.; Zhu, W.; Pang, H.J.; Ma, H.Y. A sensor of a polyoxometalate and Au–Pd alloy for simultaneously detection of dopamine and ascorbic acid. Electrochim. Acta 2013, 113, 454–463. [Google Scholar] [CrossRef]
  16. Zhang, H.; Guo, L.Y.; Xie, Z.C.; Xin, X.; Sun, D.; Yuan, S.L. Tunable aggregation-induced emission of polyoxometalates via amino acid-directed self-assembly and their application in detecting dopamine. Langmuir 2016, 32, 13736–13745. [Google Scholar] [CrossRef] [PubMed]
  17. Zhang, L.; Ning, L.; Li, S.B.; Pang, H.J.; Zhang, Z.F.; Ma, H.Y.; Yan, H. Selective electrochemical detection of dopamine in the presence of uric acid and ascorbic acid based on a composite film modified electrode. RSC Adv. 2016, 6, 66468–66476. [Google Scholar] [CrossRef]
  18. Ginsberg, A.P. Inorganic Synthesis; John Wiley & Sons Inc.: New York, NY, USA, 1990; pp. 87–88. [Google Scholar]
  19. Xu, Q.Z.; Wang, X.F.; Zhu, Z.H.; Yu, D.J.; Chen, W.; Hua, Y.J.; Wang, C.T. Synthesis, characterization and electrochemical properties of Keggin-type Co-substituted heteropolyanion SiW11O39Co(II)(H2O)6−. J. Hainan Normal Univ. (Nat. Sci.) 2010, 23, 278–299. [Google Scholar]
  20. Ronny, N.; Mohammad, G. Highly active manganese-containing polyoxometalate as catalyst for epoxidation of akanes with hydrogen peroxide. J. Am. Chem. Soc. 1994, 116, 5509–5510. [Google Scholar]
  21. Liu, J.F.; Ortega, F.; Sethuraman, P.; Katsoulis, D.E.; Costello, C.E.; Pope, M.T. Trimetallo derivatives of lacunary 9-tungstosilicate heteropolyanions. Part 1, Synthesis and characterization. J. Chem. Soc. Dalton Trans. 1992, 12, 1901–1906. [Google Scholar] [CrossRef]
  22. Ilgen, F.; Ott, D.; Kralisch, D.; Reil, C.; Palmbergera, A.; König, B. Conversion of carbohydrates into 5-hydroxymethylfurfural in highly concentrated low melting mixtures. Green Chem. 2009, 11, 1948–1954. [Google Scholar] [CrossRef]
  23. Weakly, T.J.R. Some aspects of the heteropolymolybdates and heteropolytungstates. Struct. Bonding (Berlin) 1974, 18, 131–176. [Google Scholar]
  24. Newman, A.D.; Lee, A.F.; Wilson, K.; Young, N.A. On the active site in H3PW12O40/SiO2 catalysts for fine chemical synthesis. Catal. Lett. 2005, 102, 45–50. [Google Scholar] [CrossRef]
  25. Pawelec, B.; Mariscal, R.; Fierro, J.L.G.; Greenwood, A.; Vasudevan, P.T. Carbon-supported tungsten and nickel catalysts for hydrodesulfurization and hydrogenation reactions. Appl. Catal. A 2001, 206, 295–307. [Google Scholar] [CrossRef]
  26. Bisaglia, M.; Mammi, S.; Bubacco, L. Kinetic and structural analysis of the early oxidation products of dopamine. J. Biol. Chem. 2007, 282, 15597–15605. [Google Scholar] [CrossRef] [PubMed]
  27. Kim, H.W.; McCloskey, B.D.; Choi, T.H.; Lee, C.; Kim, M.J.; Freeman, B.D.; Park, H.B. Oxygen concentration control of dopamine-induced high uniformity surface coating chemistry. Appl. Mater. Interfaces 2013, 5, 233–238. [Google Scholar] [CrossRef] [PubMed]
  28. Yang, Z.Z.; Zhu, Y.; Chi, M.Q.; Wang, C.; Wei, Y.; Lu, X.F. Fabrication of cobalt ferrite/cobalt sulfide hybrid nanotubes with enhanced peroxidase-like activity for colorimetric detection of dopamine. J. Colloid Interface Sci. 2017, 511, 383–391. [Google Scholar] [CrossRef] [PubMed]
  29. Leng, Y.M.; Xie, K.; Ye, L.Q.; Li, G.Q.; Lu, Z.W.; He, J.B. Gold-nanoparticle-based colorimetric array for detection of dopamine in urine and serum. Talanta 2015, 139, 89–95. [Google Scholar] [CrossRef] [PubMed]
  30. Zheng, Y.; Wang, Y.; Yang, X.R. Aptamer-based colorimetric biosensing of dopamine using unmodified gold nanoparticles. Sens. Actuators B 2011, 156, 95–99. [Google Scholar] [CrossRef]
  31. Liu, J.M.; Wang, X.X.; Cui, M.L.; Lin, L.P.; Jiang, S.L.; Jiao, L.; Zhang, L.H. A promising non-aggregation colorimetric sensor of AuNRs–Ag+ for determination of dopamine. Sens. Actuators B 2013, 176, 97–102. [Google Scholar] [CrossRef]
  32. Tao, Y.; Lin, Y.H.; Ren, J.S.; Qu, X.G. A dual fluorometric and colorimetric sensor for dopamine based on BSA-stabilized Au nanoclusters. Biosens. Bioelectron. 2013, 42, 41–46. [Google Scholar] [CrossRef] [PubMed]
  33. Ngomane, N.; Torto, N.; Krause, R.; Vilakazi, S. A colorimetric probe for dopamine based on gold nanoparticles electrospun nanofibre composite. Mater. Today Proc. 2015, 2, 4060–4069. [Google Scholar] [CrossRef]
  34. Zhou, Y.; Wang, P.L.; Su, X.O.; Zhao, H.; He, Y.J. Colorimetric detection of ractopamine and salbutamol using gold nanoparticles functionalized with melamine as a probe. Talanta 2013, 112, 20–25. [Google Scholar] [CrossRef] [PubMed]
  35. Dessapt, R.; Collet, M.; Violaine, C.; Bujoli, D.M.; Jobic, S.; Lee, C.; Whangbo, M.H. Kinetics of coloration in photochromic organoammonium polyoxomolybdates. Inorg. Chem. 2009, 48, 574–580. [Google Scholar] [CrossRef] [PubMed]
Figure 1. Photographs of detection of ractopamine (RAC; top) by SiW9Cu3 and dopamine (DA; bottom) by SiW9Co3; (a) RAC + H2O2 + 25 min; (b) RAC + SiW9Cu3 + 25 min; (c) RAC + SiW9Cu3 + H2O2 + 25 min; (d) DA + H2O2 + 10 min; (e) DA + SiW9Co3 + 10 min; (f) DA + SiW9Co3 + H2O2 + 10 min; (g) DA + SiW9Co3 + H2O2 + 15 min; (h) DA + SiW9Co3 + H2O2 + 30 min.
Materials 11 00674 g001
Figure 2. Comparison of SiW11M, SiW10M2 and SiW9M3 catalysts for the detection of DA at 475 nm in aqueous solutions with 60 µL H2O2, 120 µL DA, and 80 µL of catalyst, with a reaction time of 10 min.
Materials 11 00674 g002
Figure 3. Effect of amount of SiW9Cu3 (a) and H2O2 (b) in the detection of RAC. (a) 100 µL RAC, 160 µL H2O2; and (b) 80 µL SiW9Cu3, 100 µL RAC, and reaction time of 25 min.
Materials 11 00674 g003
Figure 4. UV−VIS spectra of RAC catalyzed by SiW9Cu3, with 80 µL SiW9Cu3, 100 µL RAC, and 160 µL H2O2. Reaction times (a) 5, (b) 10, (c) 15, (d) 20, (e) 25, (f) 30, (g) 35, and (h) 60 min.
Materials 11 00674 g004
Figure 5. UV−VIS spectra of the amount of RAC with 80 µL SiW9Cu3, 160 µL H2O2, and reaction time of 25 min. Insert: the plot of absorbance at 515 nm versus the concentration of RAC.
Materials 11 00674 g005
Figure 6. Effect of the amount of SiW9Co3 (a) and H2O2 (b) for the detection of DA. (a) 120 µL DA, 60 µL H2O2; and (b) 80 µL SiW9Co3, 120 µL DA, and reaction time of 10 min.
Materials 11 00674 g006
Figure 7. Effect of reaction time with 80 µL SiW9Co3, 120 µL DA, and 60 µL H2O2.
Materials 11 00674 g007
Figure 8. The linear range for colorimetric detection of DA with SiW9Co3. Insert: the plot of absorbance at 475 nm versus the concentration of DA. Experiments: 80 µL SiW9Co3, 60 µL H2O2, and reaction time of 10 min.
Materials 11 00674 g008
Figure 9. Comparison of the effect of interferences on the colorimetric detection of RAC and DA. Experiments for RAC: 100 µL interference (5 mM), 80 µL SiW9Cu3, 100 µL RAC, 160 µL H2O2, and reaction time of 25 min. Experiments for DA: 120 µL interference (8 mM), 60µL H2O2, 120µL DA, 80µL SiW9Co3, and reaction time of 10 min.
Materials 11 00674 g009
Table 1. Comparison of DA and RAC obtained by different colorimetric catalysts in recent years. AuNPs: Au nanoparticles. AgNRs: Ag nanoparticles TMB: 3,3′,5,5′-tetramethylbenzidine. DBA: Dopamine-binding aptamer. UF: Un-functionalized. MA: Melamine. TGA: Thioglycolic acid.
CatalystDetectionTime (min)Linear Range (mol/L)Detection Limit (mol/L)Reference
CoFe2O4/CoSDA (TMB + H2O2)100–5 × 10⁻⁵ 5.8 × 10⁻⁷[28]
AuNPsDA (NaOH + TGA)200–10−6 5.7 × 10⁻⁷[29]
AuNPsDA (DBA + NaCl)205.4 × 10⁻⁷–5.4 × 10−63.6 × 10−7[30]
Au-AgNRsDA25 (70 °C)0.20–120.047[31]
BSA-AuNCsDA (TMB + H2O2)101 × 10−8–1 × 10−31 × 10−8[32]
UF-AuNPsDA55 × 10−7–5 × 10−45 × 10−7[33]
SiW9Co3DA (H2O2)101.08 × 10⁻⁴–5.38 × 10−65.38 × 10−6This work
MA–AuNPsRAC101 × 10−10–5 × 10⁻⁷ 1 × 10⁻¹¹[34]
SiW9Cu3RAC (H2O2)251.56 × 10⁻⁴–3.73 × 10−47.94 × 10−5This work

