Uptake of Tyrosine Amino Acid on Nano-Graphene Oxide


Abstract
:1. Introduction
2. Experimental
2.1. Material and Instruments
2.2. Methods
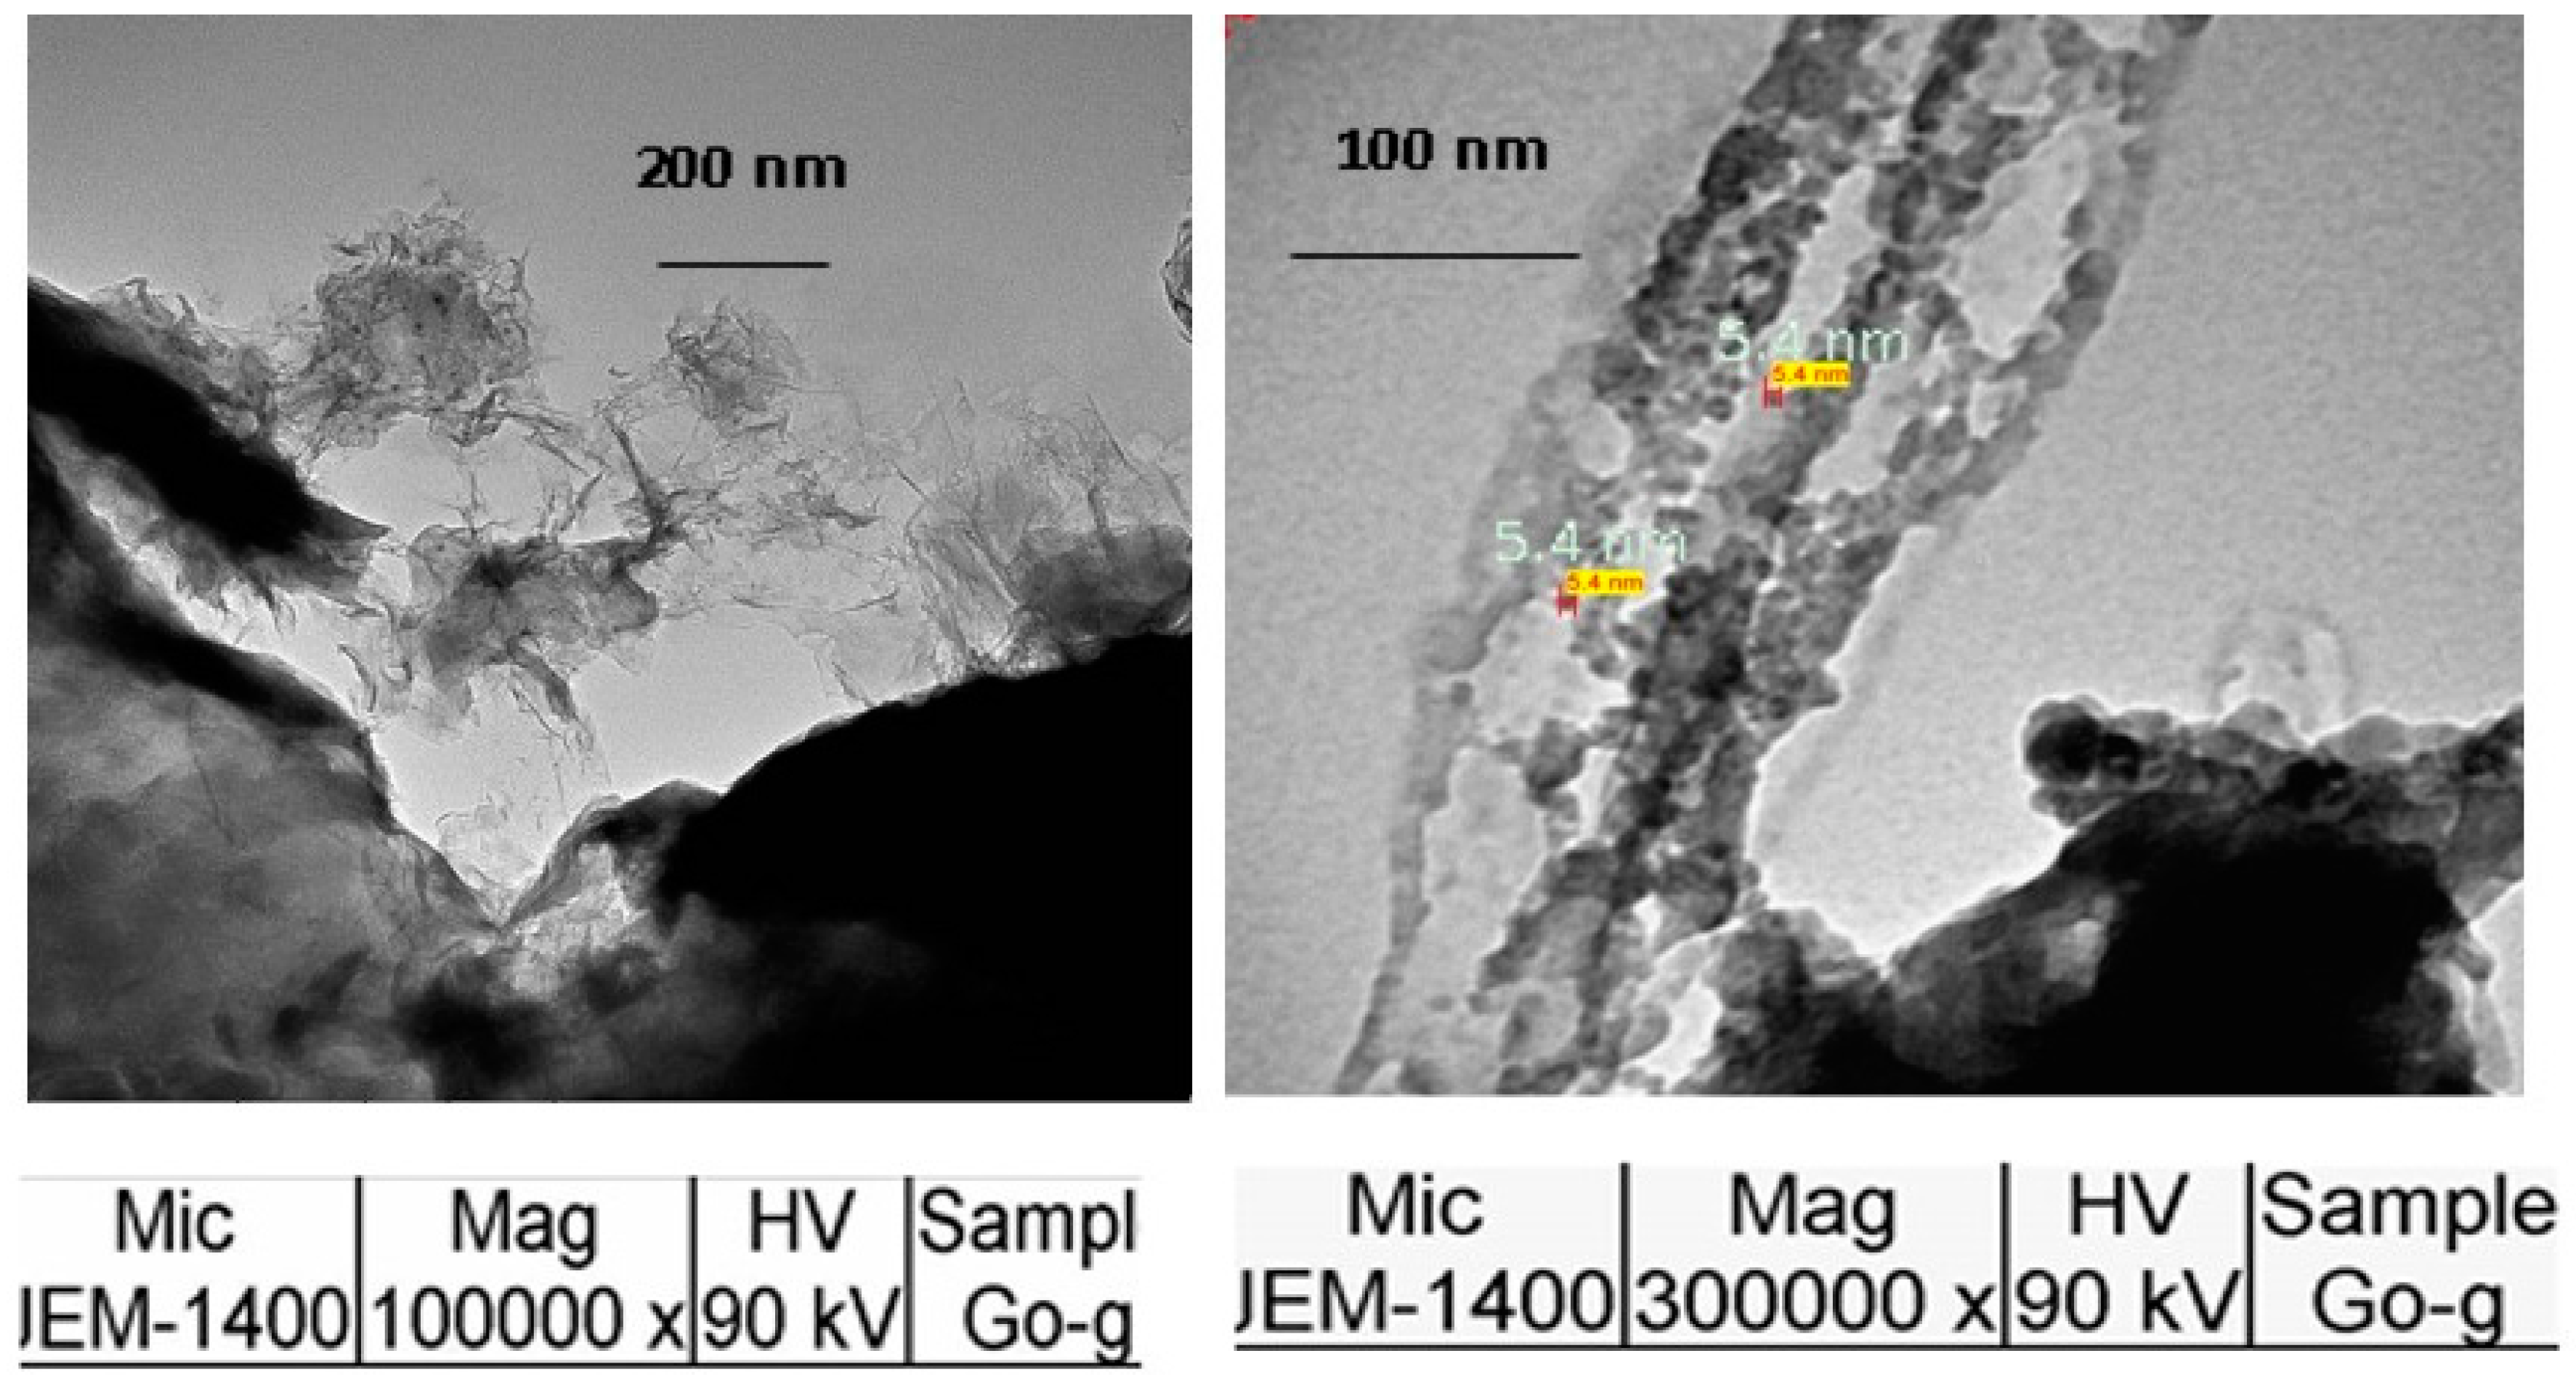
2.2.1. Particle Size Determination of GO
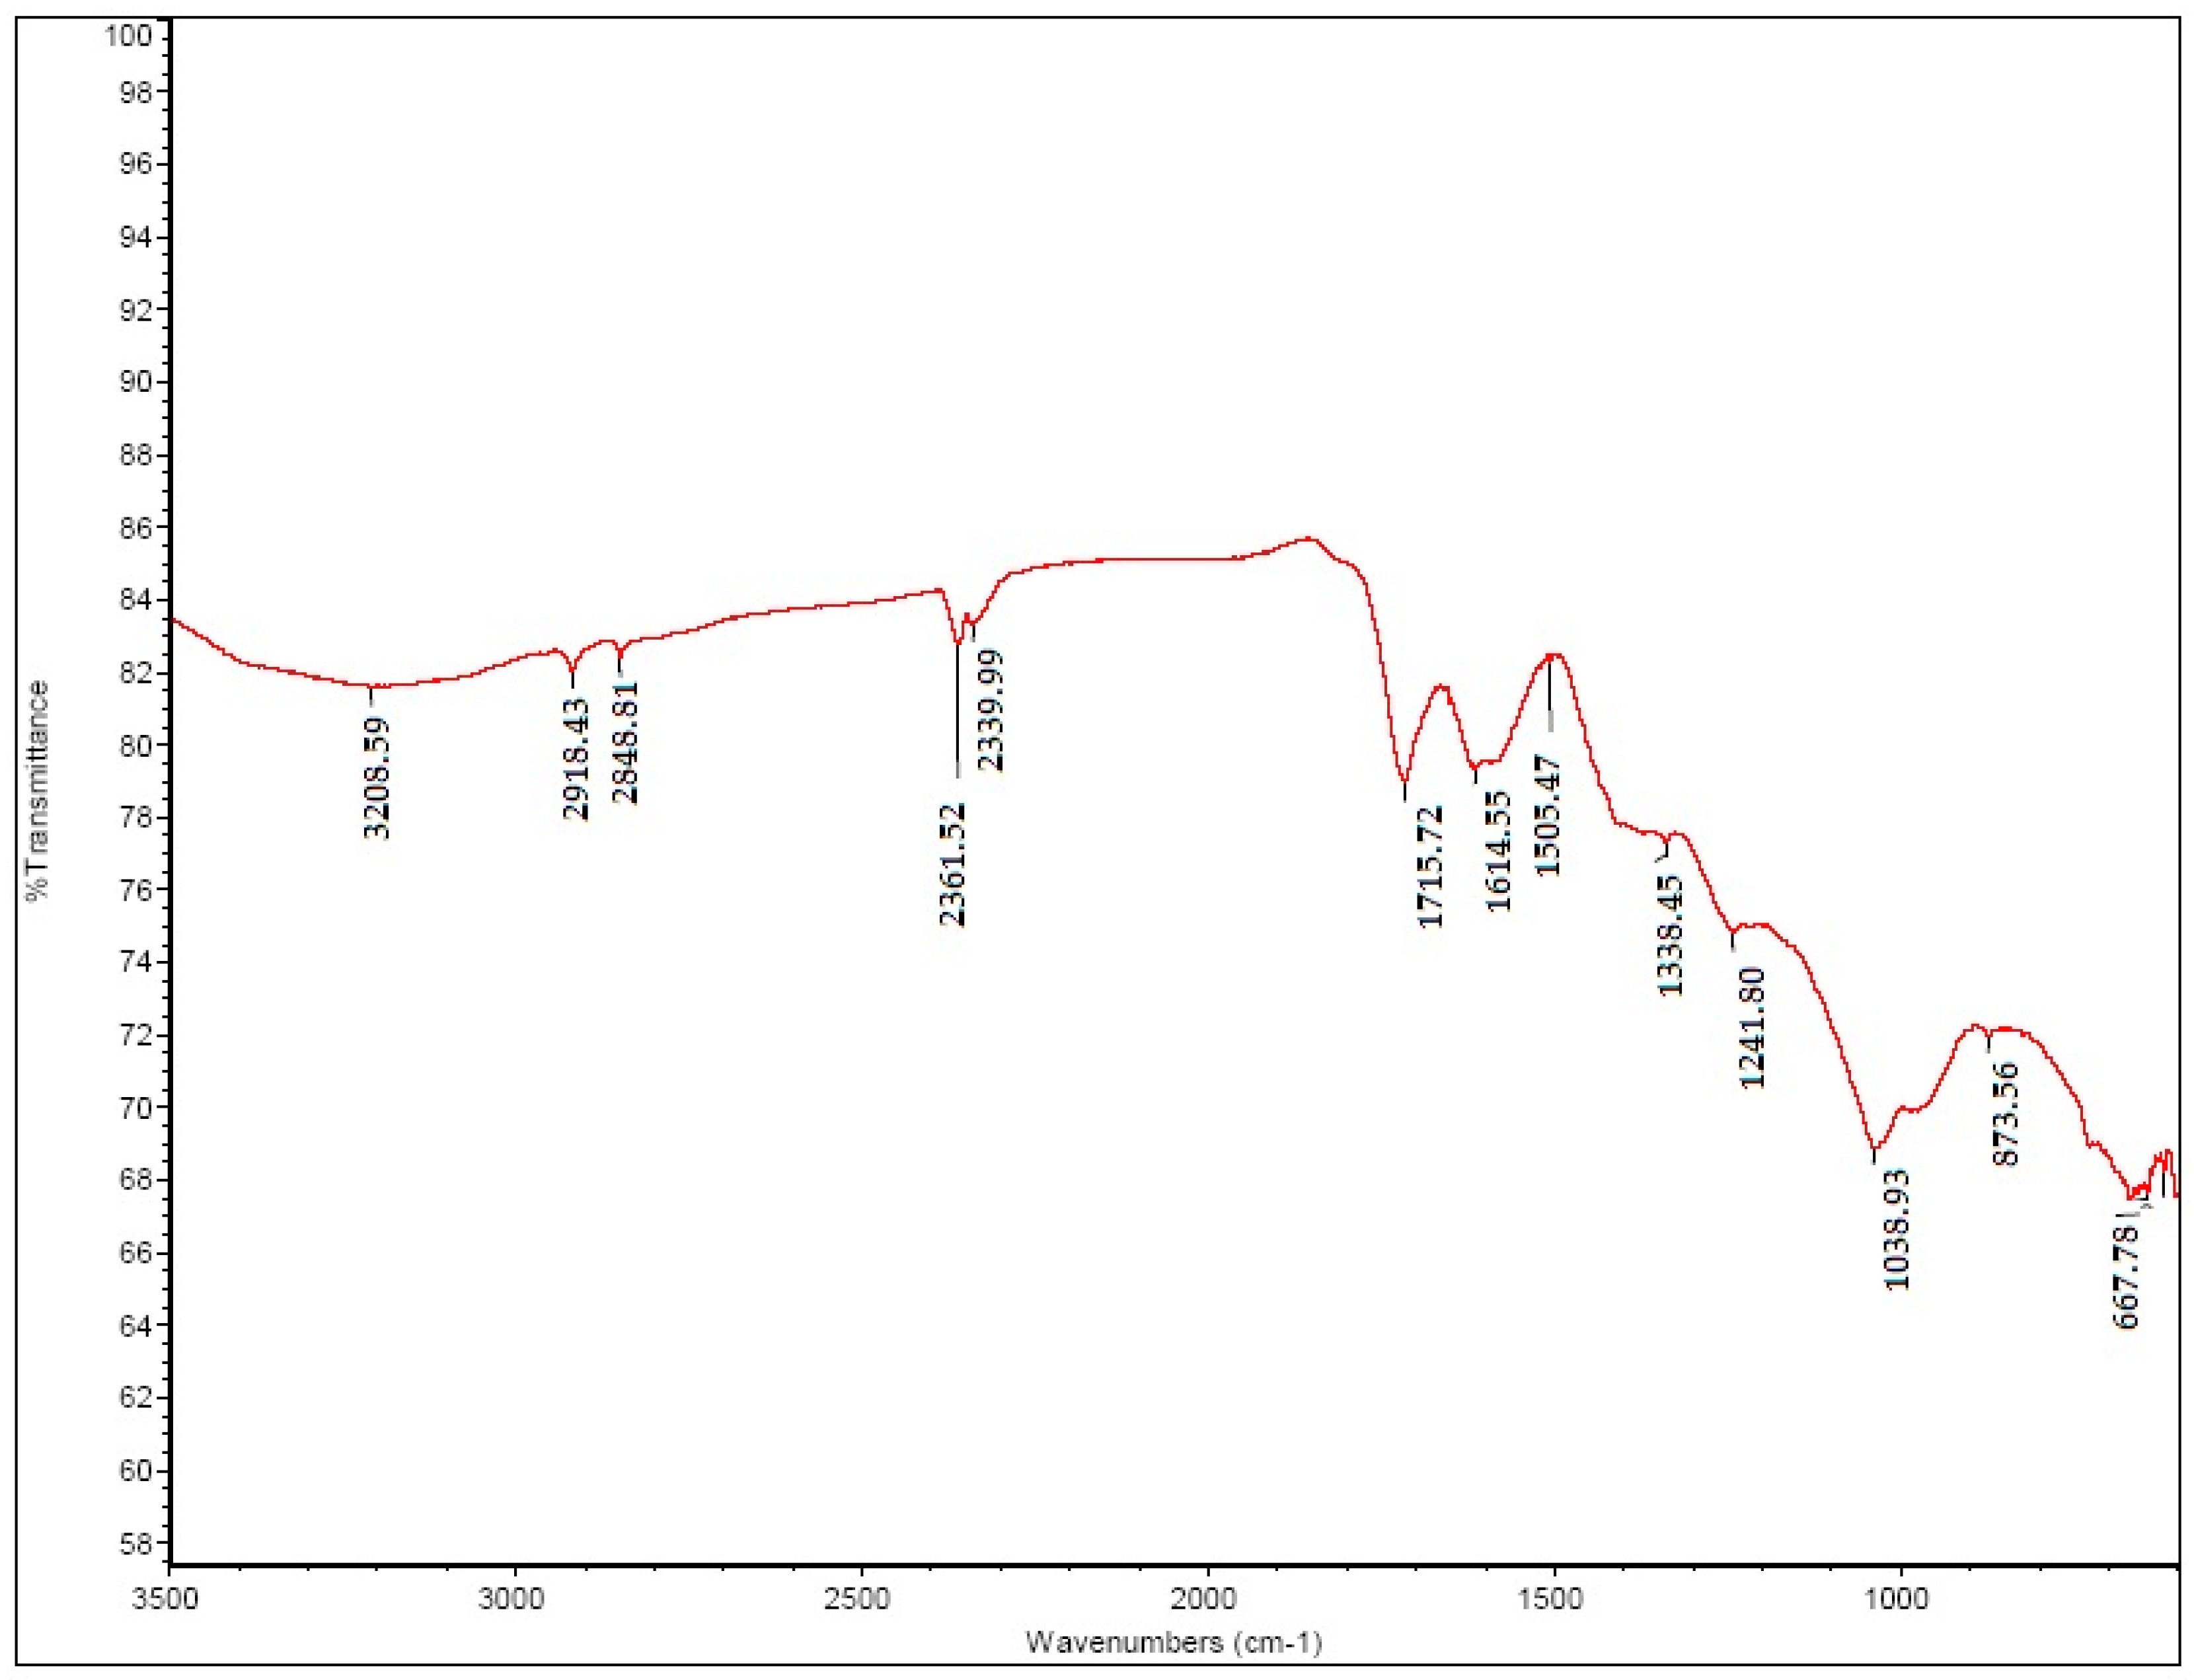
2.2.2. FT-IR of GO
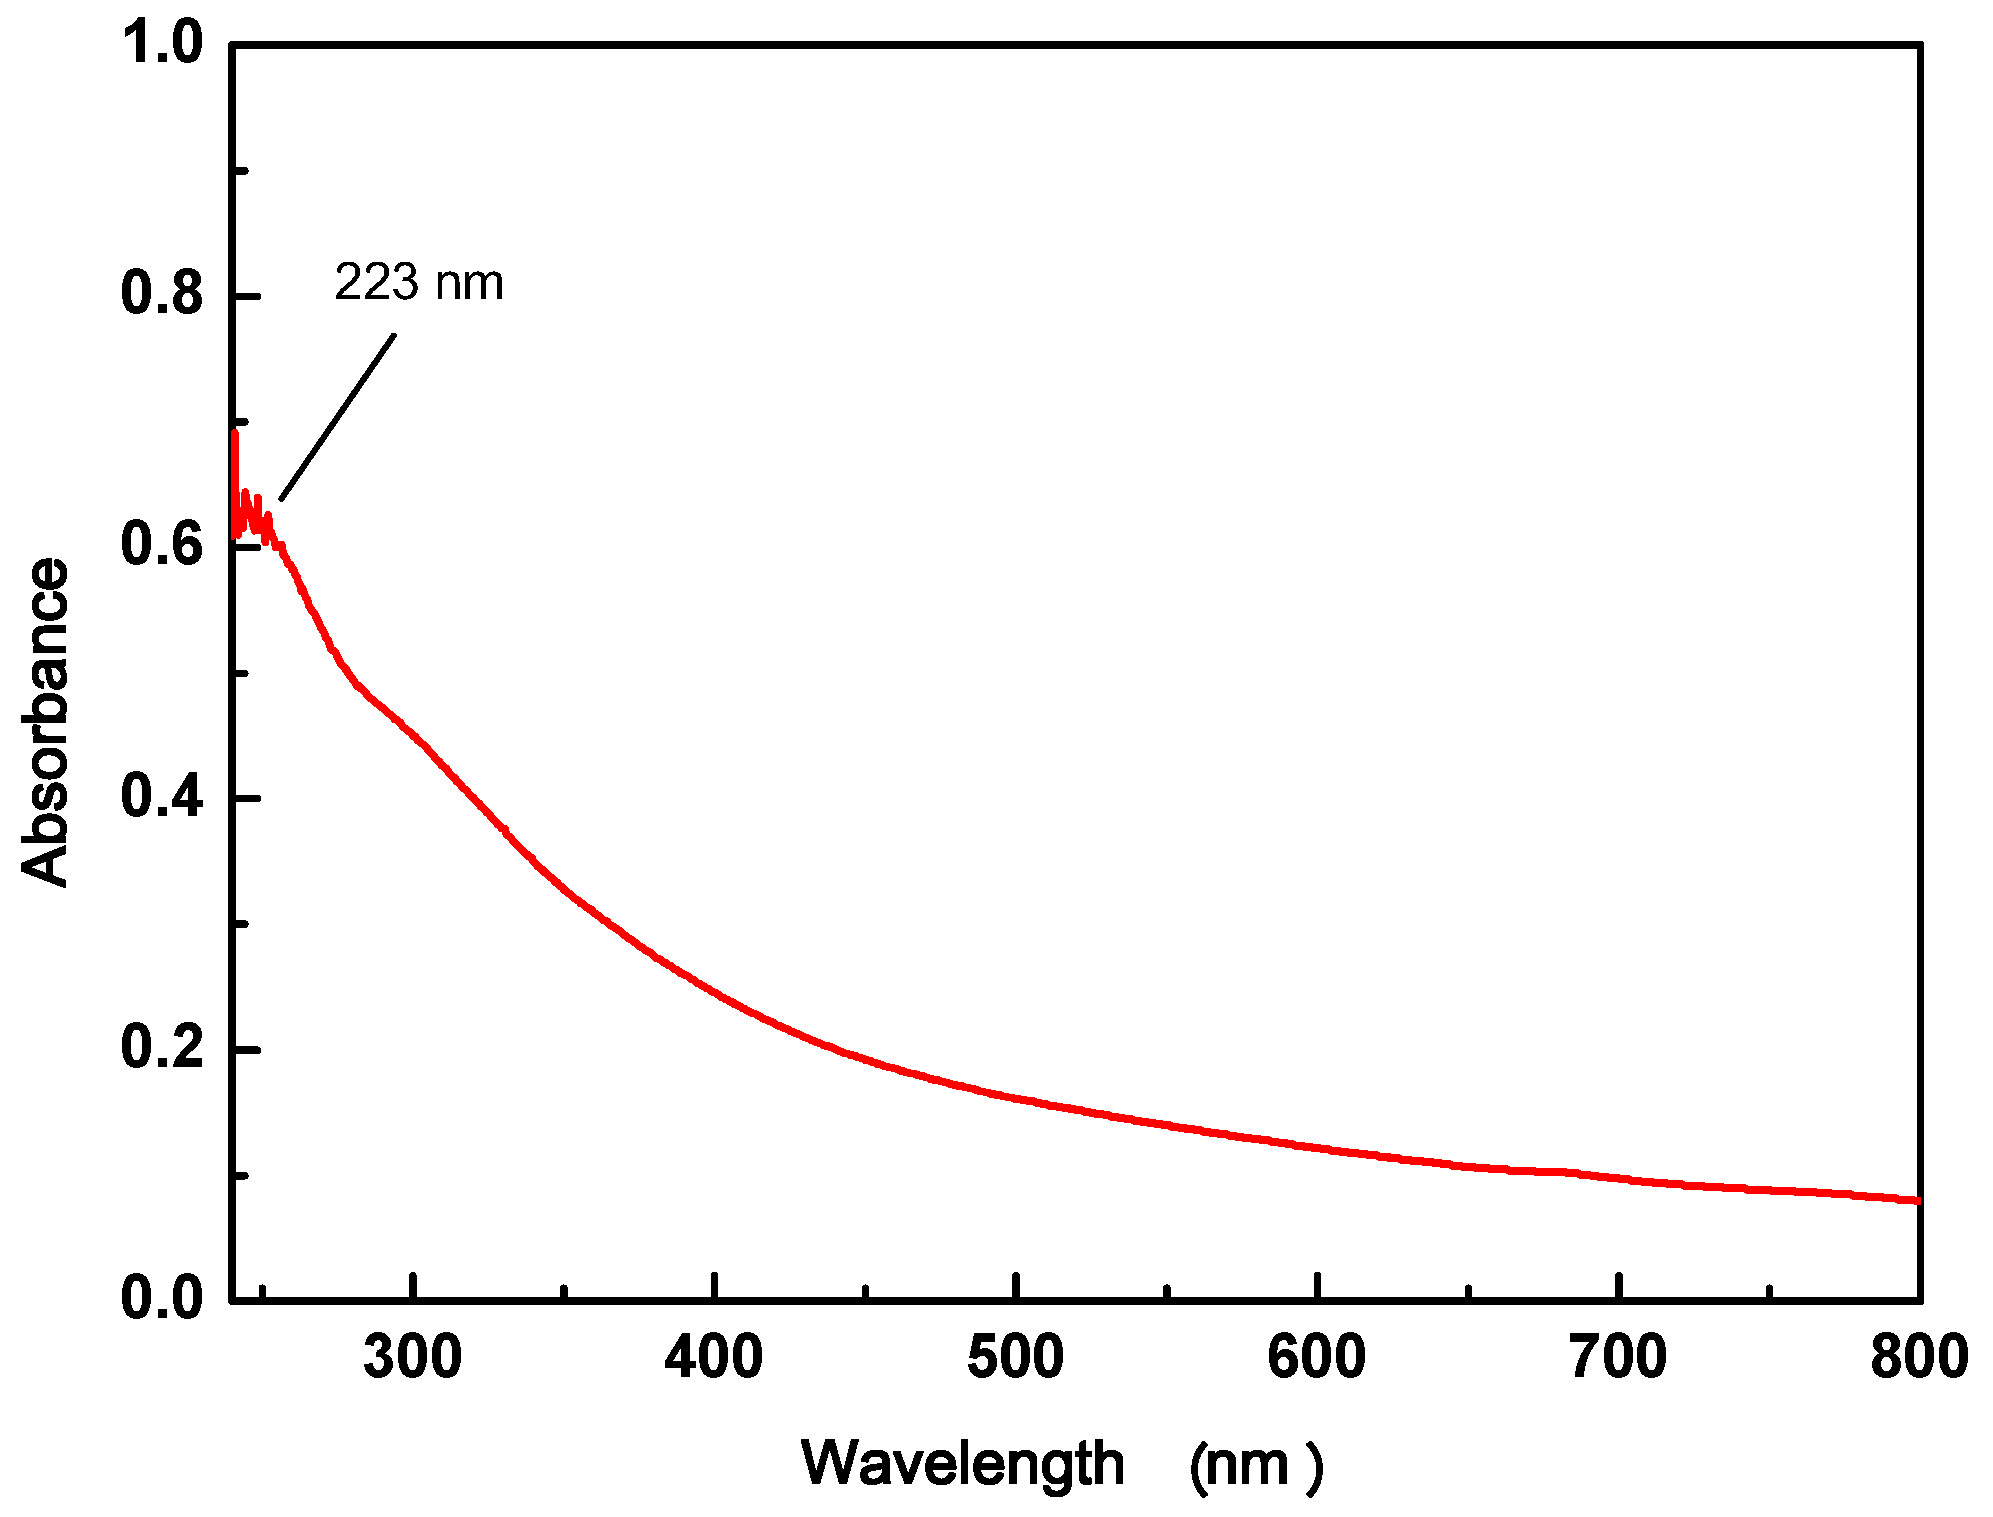
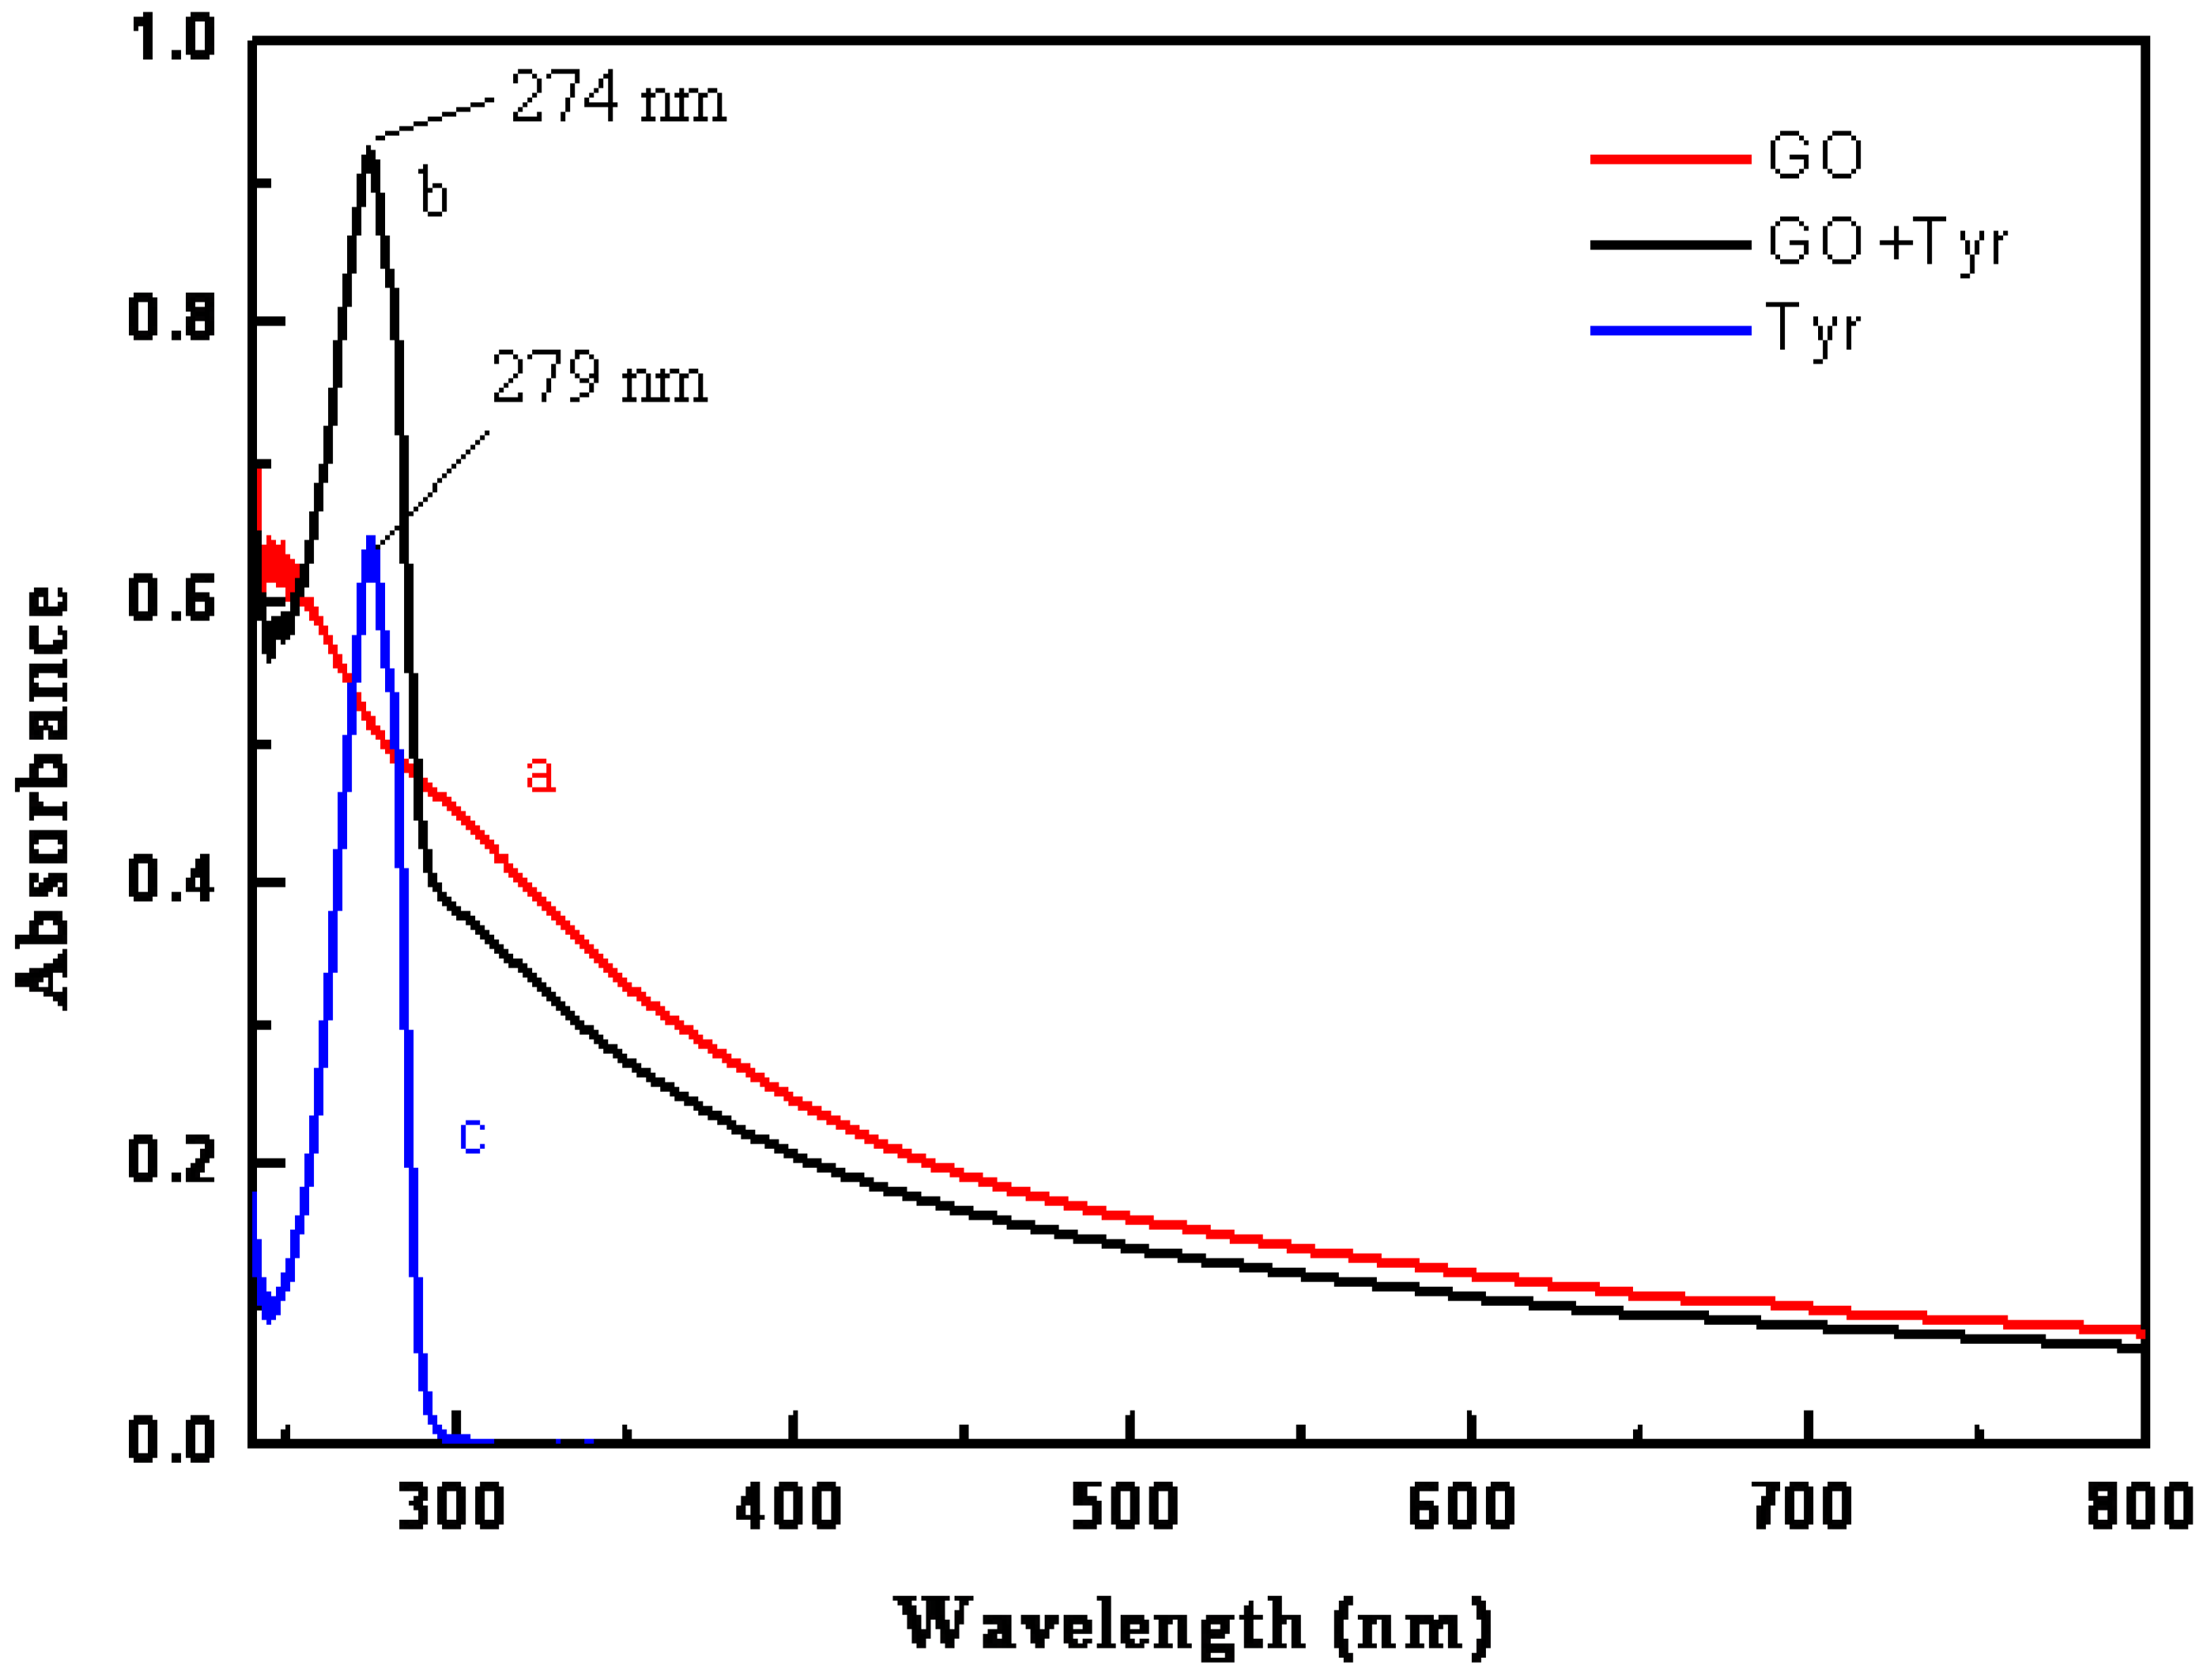
2.2.3. UV-vis of GO
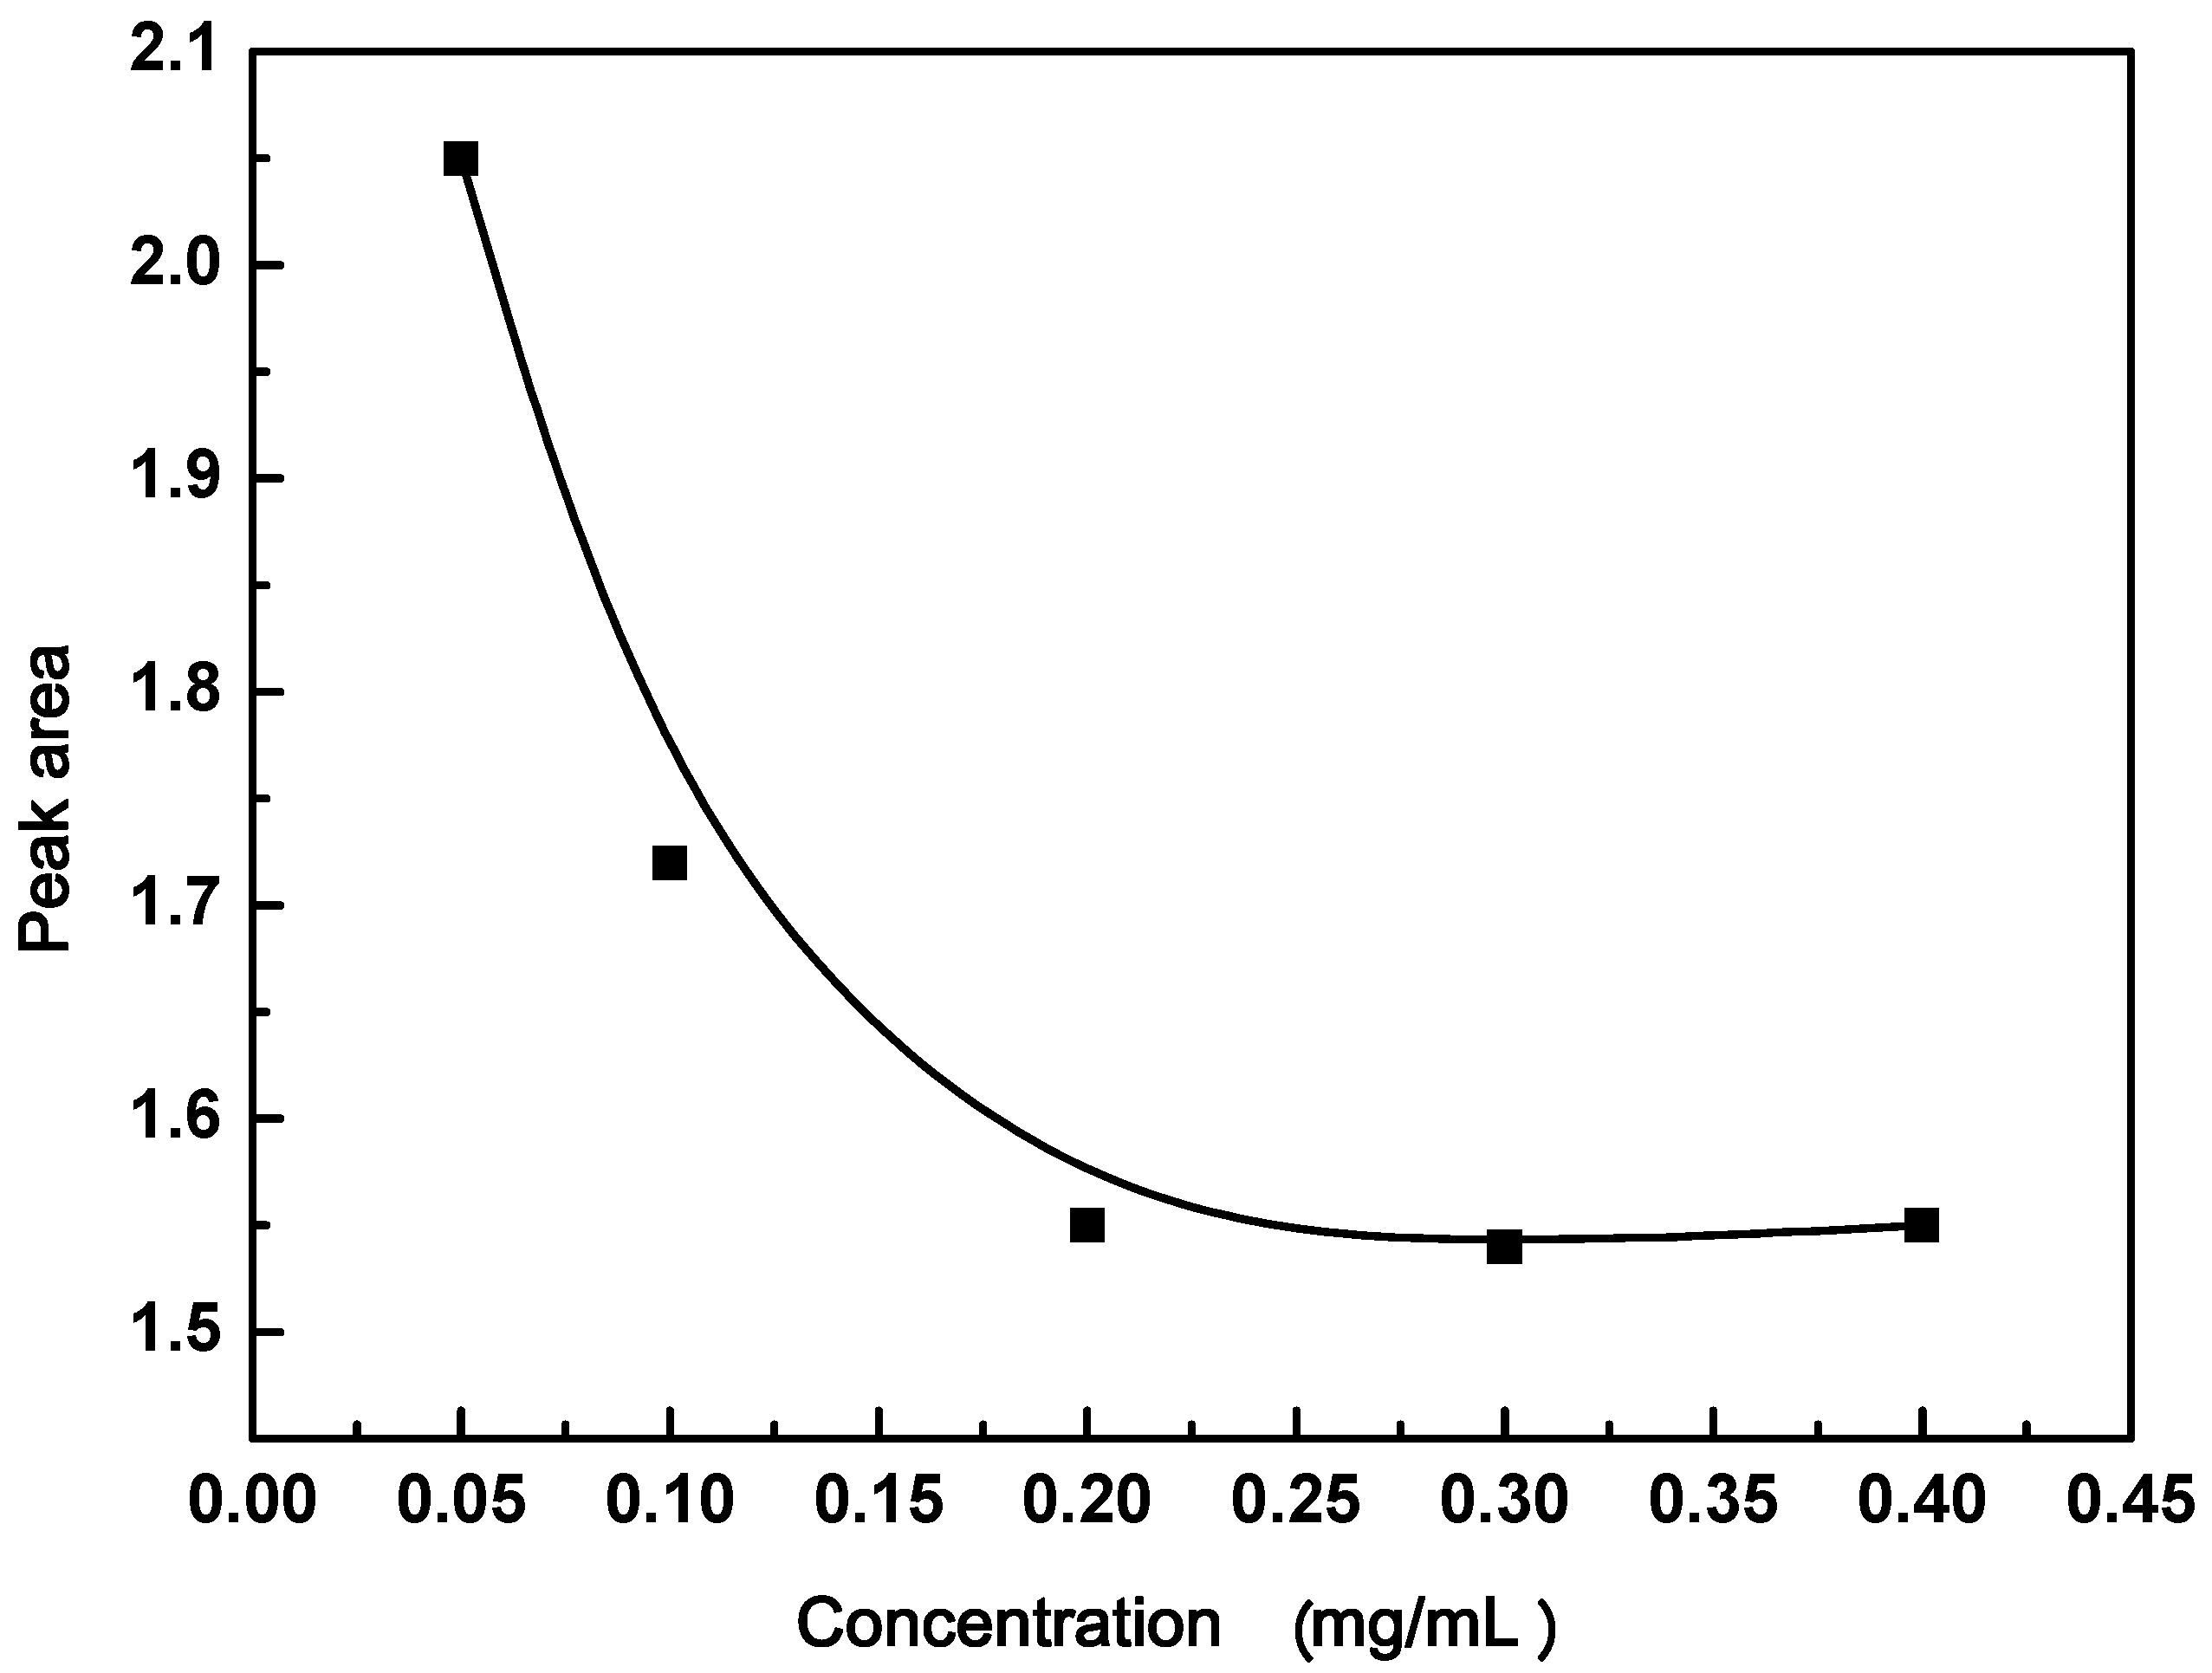
2.2.4. Effect of GO Concentration
2.2.5. Effect of pH
2.2.6. Effect of Temperature
2.2.7. Effect of Shaking Time
2.2.8. Uptake of Tyr Amino acid on GO
3. Results and Discussion
3.1. Characterization of GO
3.1.1. FT-IR of GO
3.1.2. UV-vis of GO
3.1.3. SEM of GO
3.2. Effect of GO Concentration
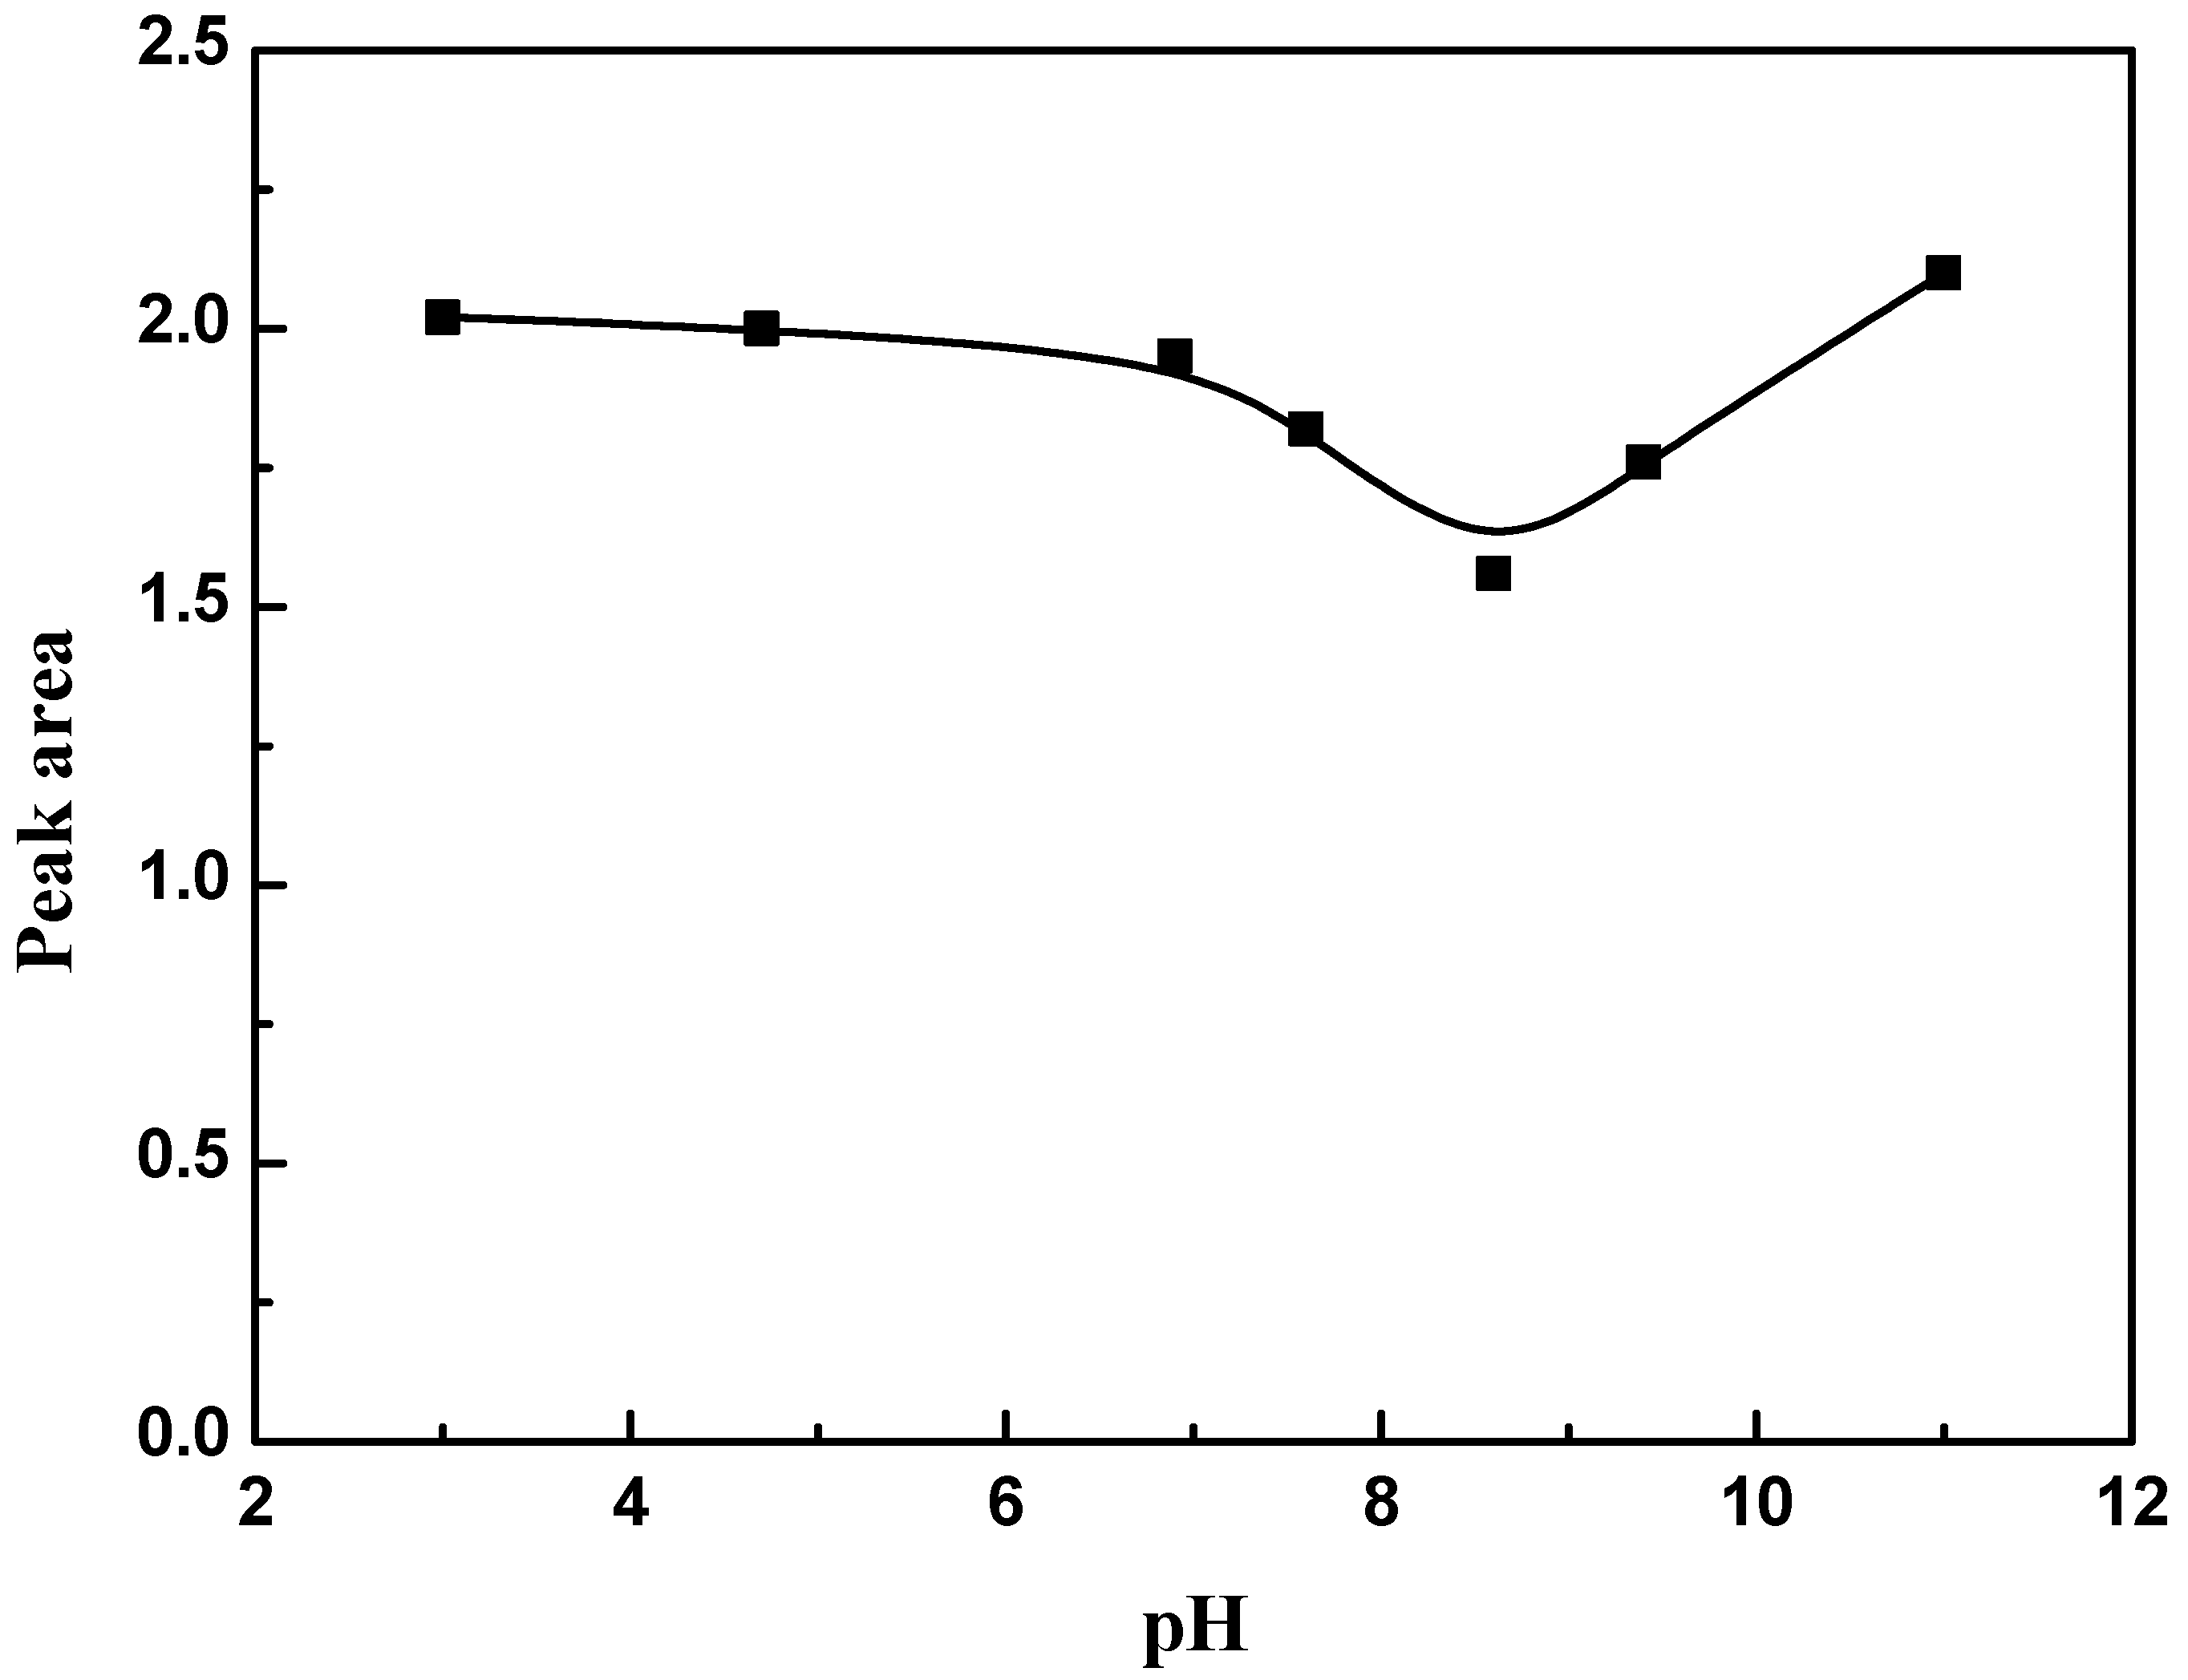
3.3. Effect of pH
3.4. Effect of Temperature
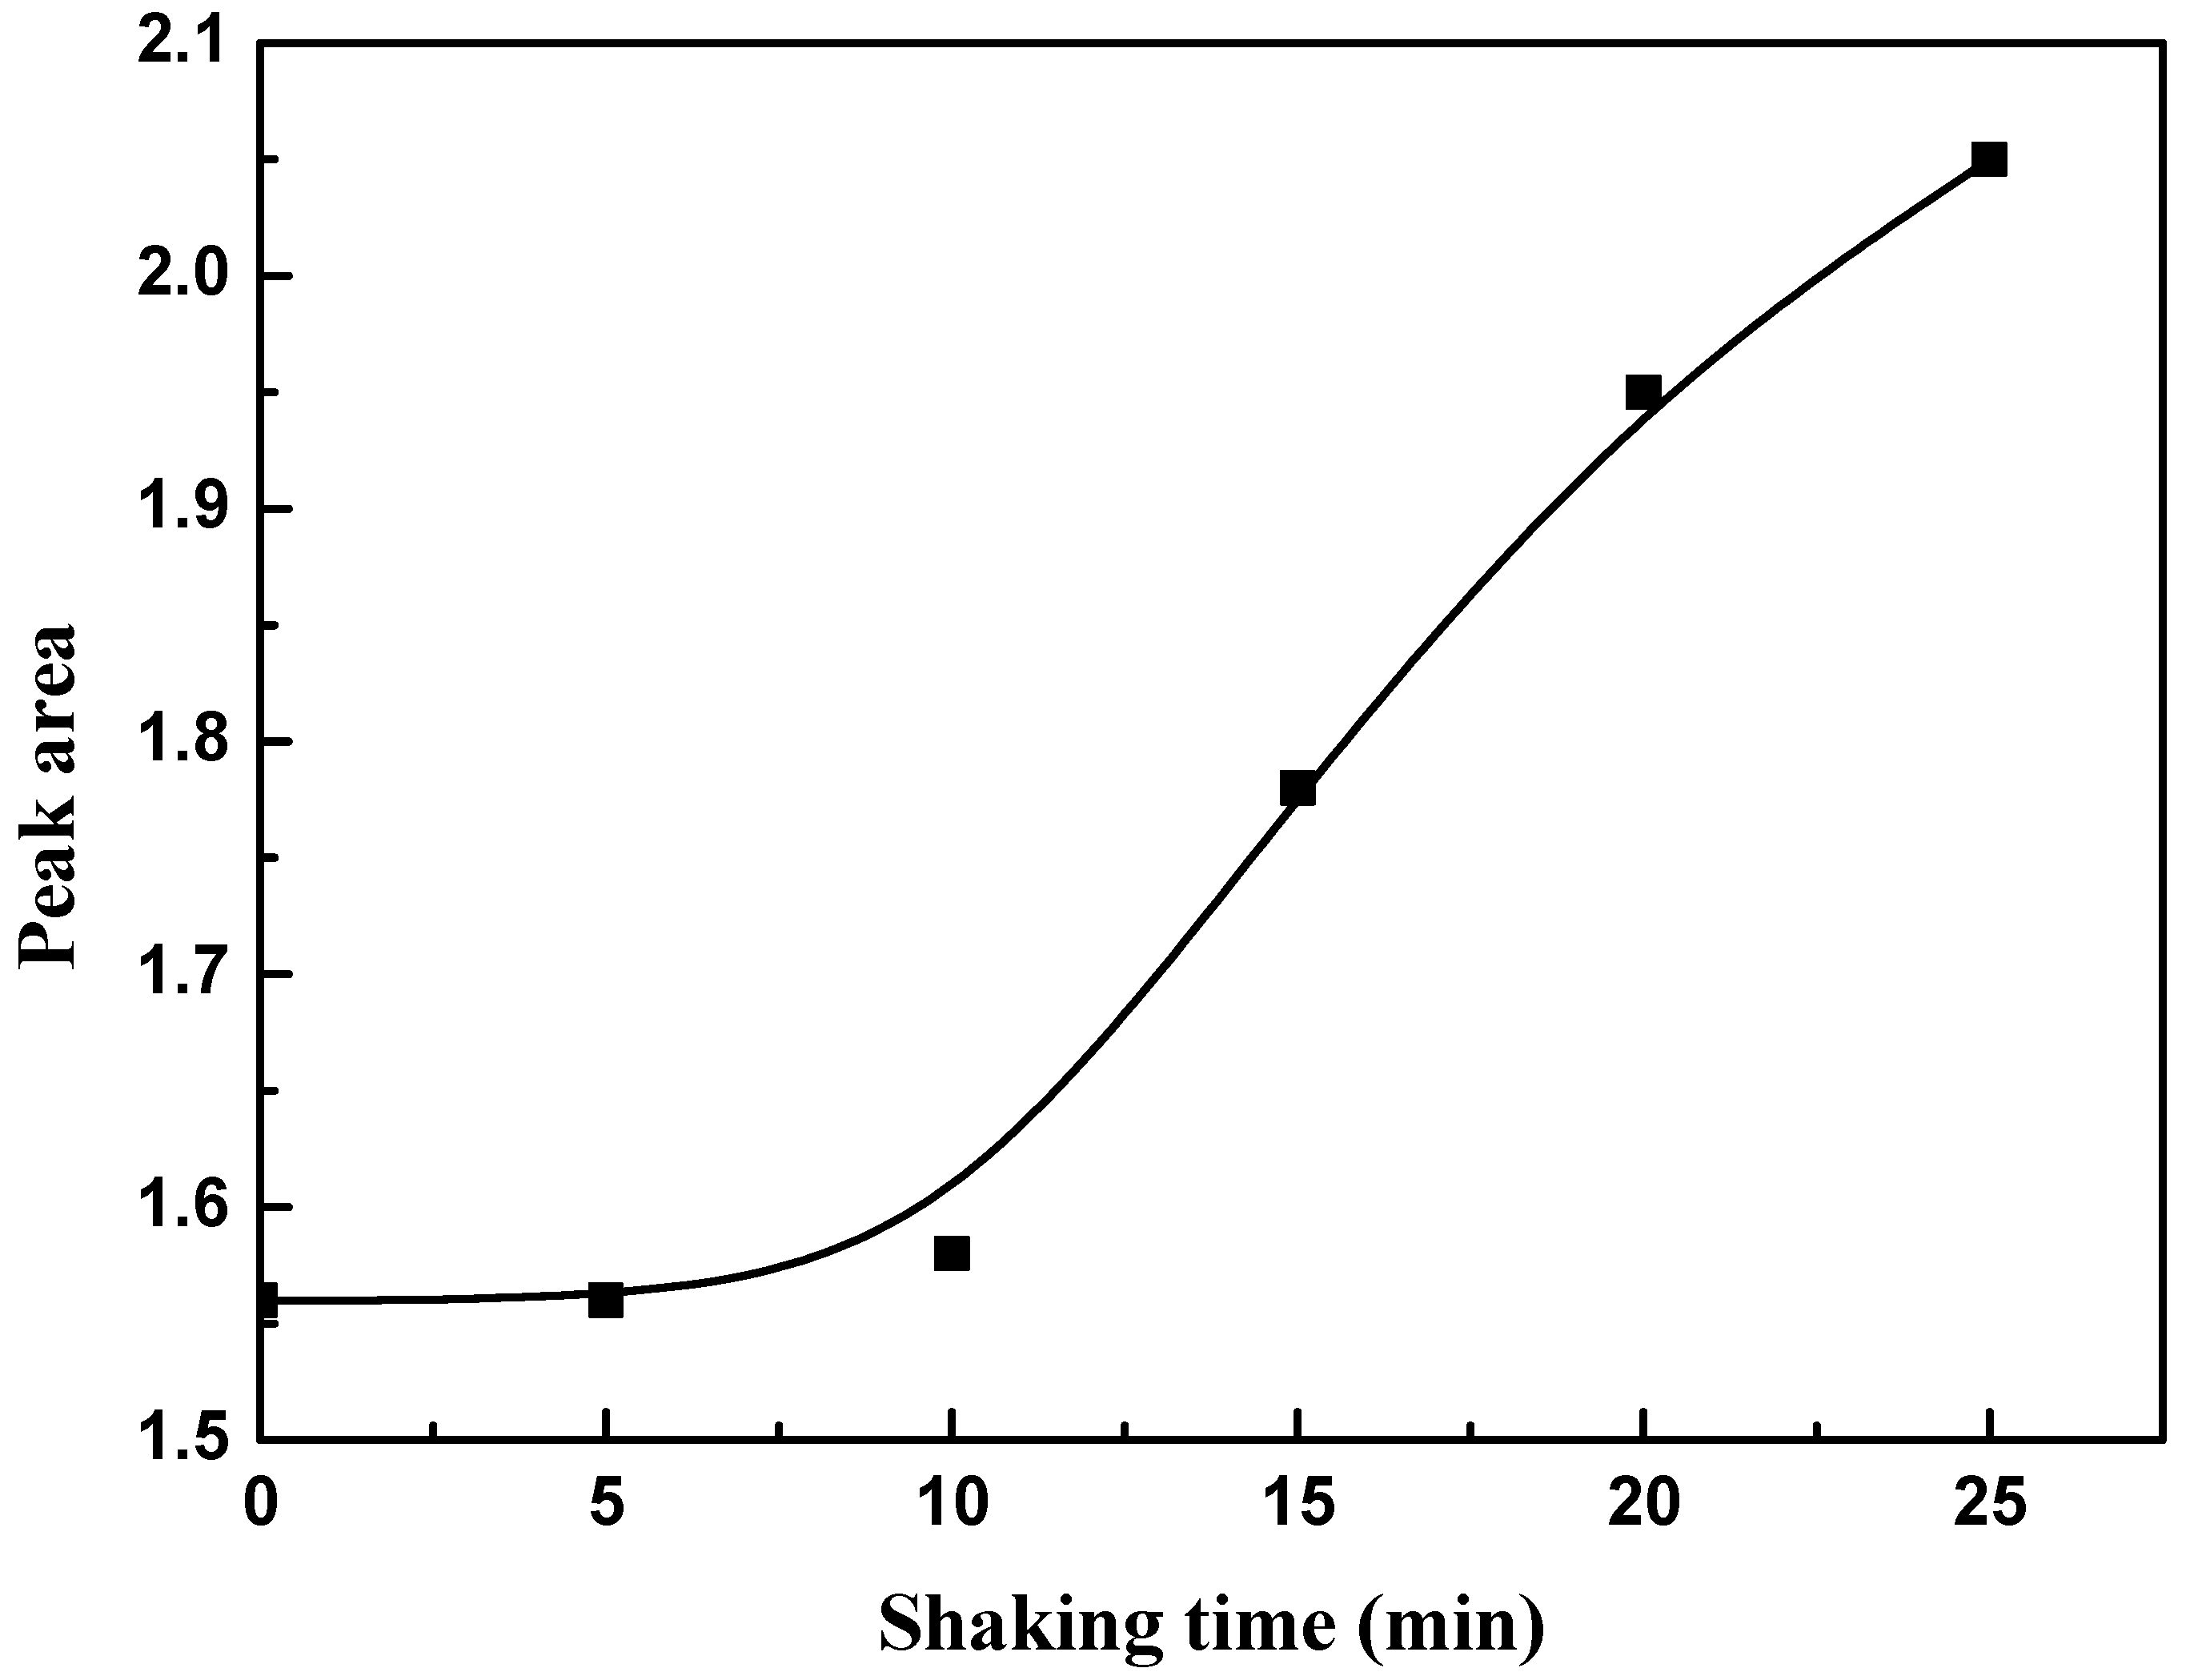
3.5. Effect of Shaking Time
3.6. Adsorption of Tyr Amino Acid on GO Surface
4. Conclusions
Supplementary Materials
Acknowledgments
Author Contributions
Conflicts of Interest
References
- Dreyer, D.R.; Park, S.; Bielawski, C.W.; Ruoff, R.S. The chemistry of graphene oxide. Chem. Soc. Rev. 2010, 39, 228–240. [Google Scholar] [CrossRef] [PubMed]
- Zheng, J.; Di, C.-A.; Liu, Y.; Liu, H.; Guo, Y.; Du, C.; Wu, T.; Yu, G.; Zhu, D. High quality graphene with large flakes exfoliated by oleyl amine. Chem. Commun. 2010, 46, 5728–5730. [Google Scholar] [CrossRef] [PubMed]
- Zhang, M.; Yin, B.-C.; Tan, W.; Ye, B.-C. A versatile graphene-based fluorescence “on/off” switch for multiplex detection of various targets. Biosens. Bioelectron. 2011, 26, 3260–3265. [Google Scholar] [CrossRef] [PubMed]
- Chen, J.-L.; Yan, X.-P.; Meng, K.; Wang, S.-F. Graphene oxide based photoinduced charge transfer label-free near-infrared fluorescent biosensor for dopamine. Anal. Chem. 2011, 83, 8787–8793. [Google Scholar] [CrossRef] [PubMed]
- Burress, J.W.; Gadipelli, S.; Ford, J.; Simmons, J.M.; Zhou, W.; Yildirim, T. Graphene oxide framework materials: Theoretical predictions and experimental results. Angew. Chem. Int. Ed. 2010, 49, 8902–8904. [Google Scholar] [CrossRef] [PubMed]
- Liu, Z.; Robinson, J.T.; Sun, X.; Dai, H. PE Gylated nanographene oxide for delivery of water-insoluble cancer drugs. J. Am. Chem. Soc. 2008, 130, 10876–10877. [Google Scholar] [CrossRef] [PubMed]
- Matko, V.; Koprivnikar, J. Quartz sensor for water absorption measurement in glass-fiber resins. IEEE Trans. Instrum. Meas. 1998, 47, 1159–1162. [Google Scholar] [CrossRef]
- Matko, V.; Milanović, M. Temperature-compensated capacitance–frequency converter with high resolution. Sens. Actuators A Phys. 2014, 220, 262–269. [Google Scholar] [CrossRef]
- Kim, J.; Cote, L.J.; Kim, F.; Huang, J. Visualizing graphene based sheets by fluorescence quenching microscopy. J. Am. Chem. Soc. 2009, 132, 260–267. [Google Scholar] [CrossRef] [PubMed]
- Zhang, M.; Yin, B.-C.; Wang, X.-F.; Ye, B.-C. Interaction of peptides with graphene oxide and its application for real-time monitoring of protease activity. Chem. Commun. 2011, 47, 2399–2401. [Google Scholar] [CrossRef] [PubMed]
- Pettit, L. Critical survey of formation constants of complexes of histidine, phenylalanine, tyrosine, l-DOPA and tryptophan. Pure Appl. Chem. 1984, 56, 247–292. [Google Scholar] [CrossRef]
- White, B.R.; Stackhouse, B.T.; Holcombe, J.A. Magnetic γ-Fe2O3 nanoparticles coated with poly-l-cysteine for chelation of As(III), Cu(II), Cd(II), Ni(II), Pb(II) and Zn(II). J. Hazard. Mater. 2009, 161, 848–853. [Google Scholar] [CrossRef] [PubMed]
- Malachowski, L.; Stair, J.L.; Holcombe, J.A. Immobilized peptides/amino acids on solid supports for metal remediation. Pure Appl. Chem. 2004, 76, 777–787. [Google Scholar] [CrossRef]
- Pacheco, P.H.; Smichowski, P.; Polla, G.; Martinez, L.D. Solid phase extraction of Co ions using l-tyrosine immobilized on multiwall carbon nanotubes. Talanta 2009, 79, 249–253. [Google Scholar] [CrossRef] [PubMed]
- Othman, A.M.; Li, S.; Leblanc, R.M. Enhancing selectivity in spectrofluorimetric determination of tryptophan by using graphene oxide nanosheets. Anal. Chim. Acta 2013, 787, 226–232. [Google Scholar] [CrossRef] [PubMed]
- Vacchi, I.A.; Spinato, C.; Raya, J.; Bianco, A.; Ménard-Moyon, C. Chemical reactivity of graphene oxide towards amines elucidated by solid-state NMR. Nanoscale 2016, 8, 13714–13721. [Google Scholar] [CrossRef] [PubMed]
- Li, S.; Mulloor, J.J.; Wang, L.; Ji, Y.; Mulloor, C.J.; Micic, M.; Orbulescu, J.; Leblanc, R.M. Strong and selective adsorption of lysozyme on graphene oxide. ACS Appl. Mater. Interfaces 2014, 6, 5704–5712. [Google Scholar] [CrossRef] [PubMed]
- Wang, Y.; Li, Z.; Wang, J.; Li, J.; Lin, Y. Graphene and graphene oxide: Biofunctionalization and applications in biotechnology. Trends Biotechnol. 2011, 29, 205–212. [Google Scholar] [CrossRef] [PubMed]
- Venkatesha, N.; Poojar, P.; Ashwini, R.; Qurishi, Y.; Geethanath, S.; Srivastava, C. Ultrafine graphene oxide–CoFe2O4 nanoparticle composite as T1 and T2 contrast agent for magnetic resonance imaging. RSC Adv. 2016, 6, 17423–17429. [Google Scholar] [CrossRef]
- Zhu, Y.; Murali, S.; Cai, W.; Li, X.; Suk, J.W.; Potts, J.R.; Ruoff, R.S. Graphene and graphene oxide: Synthesis, properties, and applications. Adv. Mater. 2010, 22, 3906–3924. [Google Scholar] [CrossRef] [PubMed]
- Kumar, A.; Lee, C.H. Advances in Graphene Science; InTech: Rijeka, Croatia, 2013. [Google Scholar]
- Chaiyakun, S.; Witit-Anun, N.; Nuntawong, N.; Chindaudom, P.; Oaew, S.; Kedkeaw, C.; Limsuwan, P. Preparation and characterization of graphene oxide nanosheets. Procedia Eng. 2012, 32, 759–764. [Google Scholar]
- Advanced Chemical Supplier (ACS) Material LLC. Single Layer Graphene. Available online: https://www.acsmaterial.com/single-layer-graphene-graphene-factory-986.html (accessed on 30 April 2010).


| Temperature (°C) | Peak Area (A) |
|---|---|
| 20.0 | 1.57 |
| 25.0 | 1.56 |
| 30.0 | 1.56 |
| 35.0 | 1.58 |
| 40.0 | 1.56 |
© 2018 by the authors. Licensee MDPI, Basel, Switzerland. This article is an open access article distributed under the terms and conditions of the Creative Commons Attribution (CC BY) license (http://creativecommons.org/licenses/by/4.0/).
Share and Cite
Nassef, H.M.; Hagar, M.; Malek, Z.; Othman, A.M. Uptake of Tyrosine Amino Acid on Nano-Graphene Oxide. Materials 2018, 11, 68. https://doi.org/10.3390/ma11010068
Nassef HM, Hagar M, Malek Z, Othman AM. Uptake of Tyrosine Amino Acid on Nano-Graphene Oxide. Materials. 2018; 11(1):68. https://doi.org/10.3390/ma11010068
Chicago/Turabian StyleNassef, Hossam M., Mohamed Hagar, Zeiad Malek, and Abdelhameed M. Othman. 2018. "Uptake of Tyrosine Amino Acid on Nano-Graphene Oxide" Materials 11, no. 1: 68. https://doi.org/10.3390/ma11010068
APA StyleNassef, H. M., Hagar, M., Malek, Z., & Othman, A. M. (2018). Uptake of Tyrosine Amino Acid on Nano-Graphene Oxide. Materials, 11(1), 68. https://doi.org/10.3390/ma11010068