3.2. Characterization of LiFe0.9Mn0.1PO4
DSC-TG (Differential Scanning Calorimetry–Thermo-Gravimetry) curves obtained under nitrogen flow for Fe
0.9Mn
0.1(C
6H
5PO
3)·H
2O (
P1)/Li
2CO
3 mixture (sample
S1) and for Fe(C
6H
5PO
3)·H
2O (
P2) and Mn(C
6H
5PO
3)·H
2O (
P3) (
P2:
P3 = 0.9:0.1)/Li
2CO
3 mixture (sample
S2) are reported, respectively, in
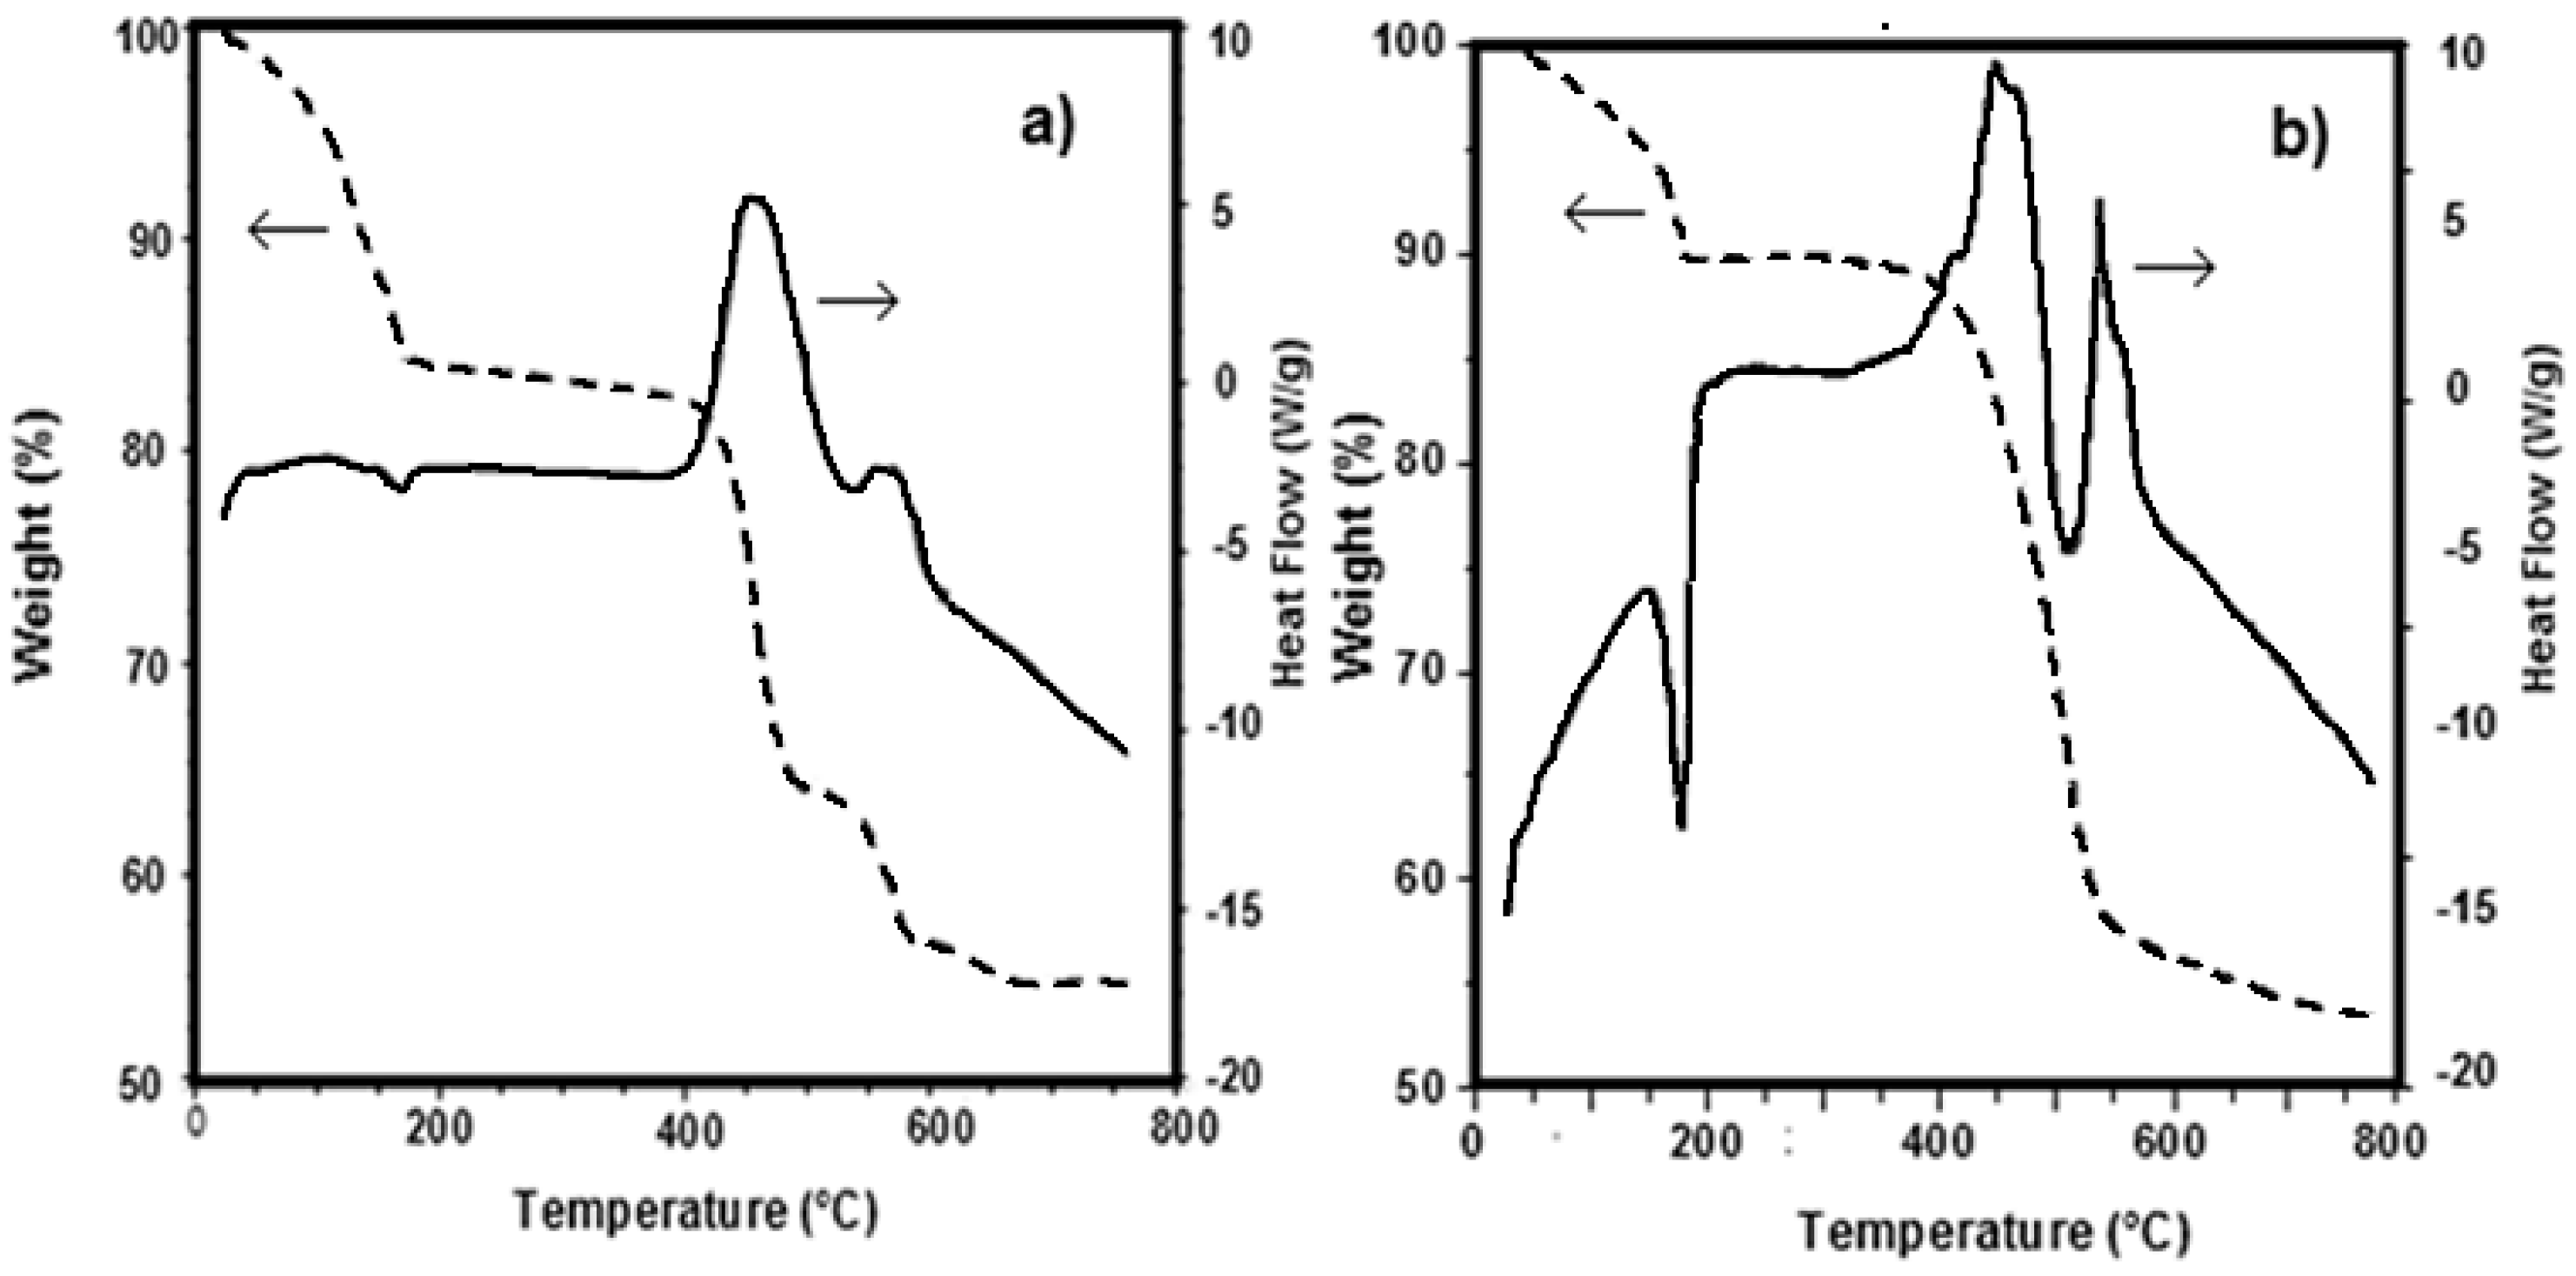
Figure 3a,b. The thermal behaviour of both mixtures resulted to be quite similar.
Part of the water, probably physically adsorbed on the sample, is lost at temperatures lower than 100 °C. The remaining part, i.e., the crystallization water, is lost at about 200 °C: this phenomenon is clearly highlighted by the end thermal peak observable in the DSC curves at 180 °C. The weight loss up to 180 °C is about 11–15%. At higher temperatures two exothermic effects are displayed in the DSC curves, namely at 400 and 550 °C, which are accompanied by a weight loss in the TG curves of about 25–30% and 8–10%, respectively.
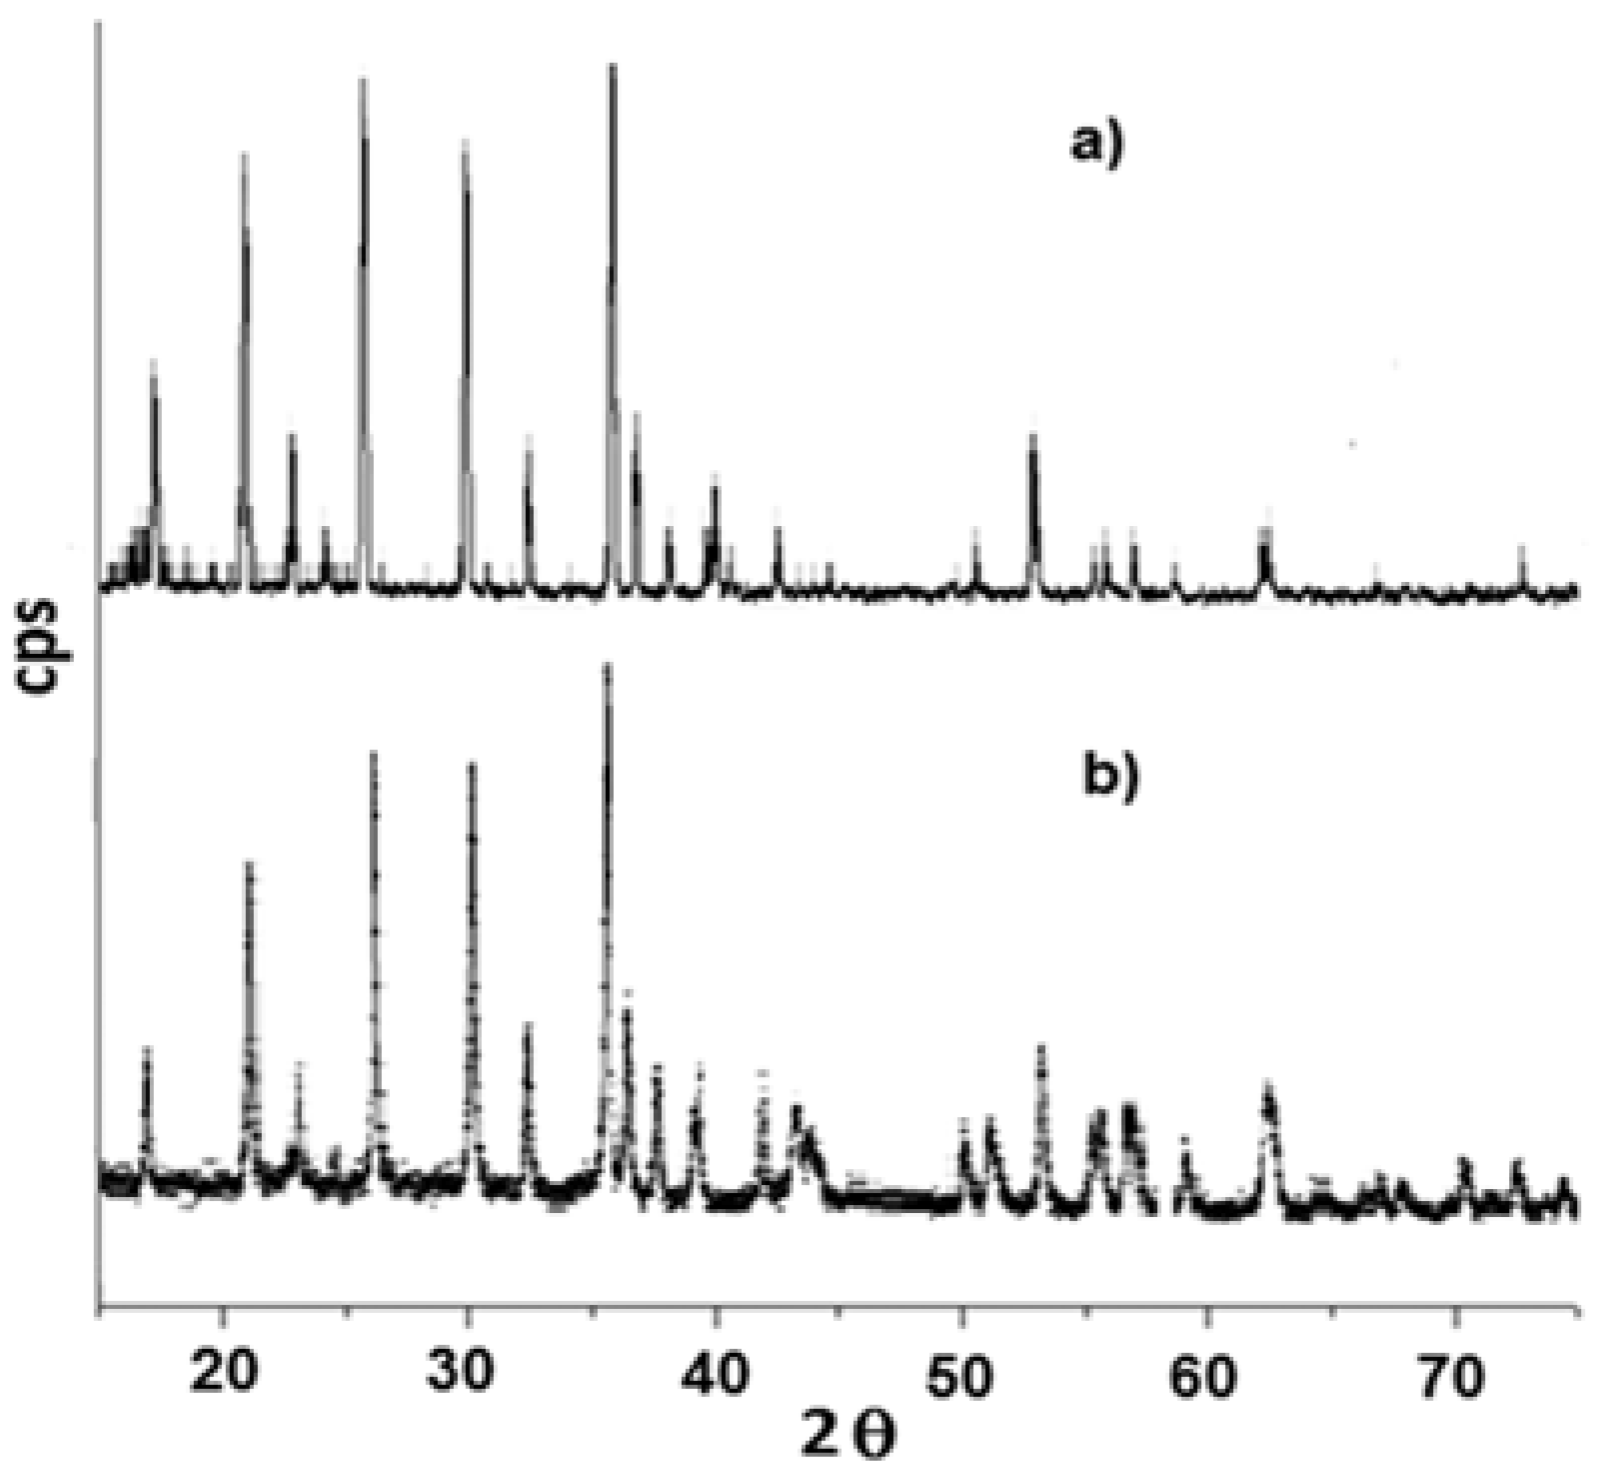
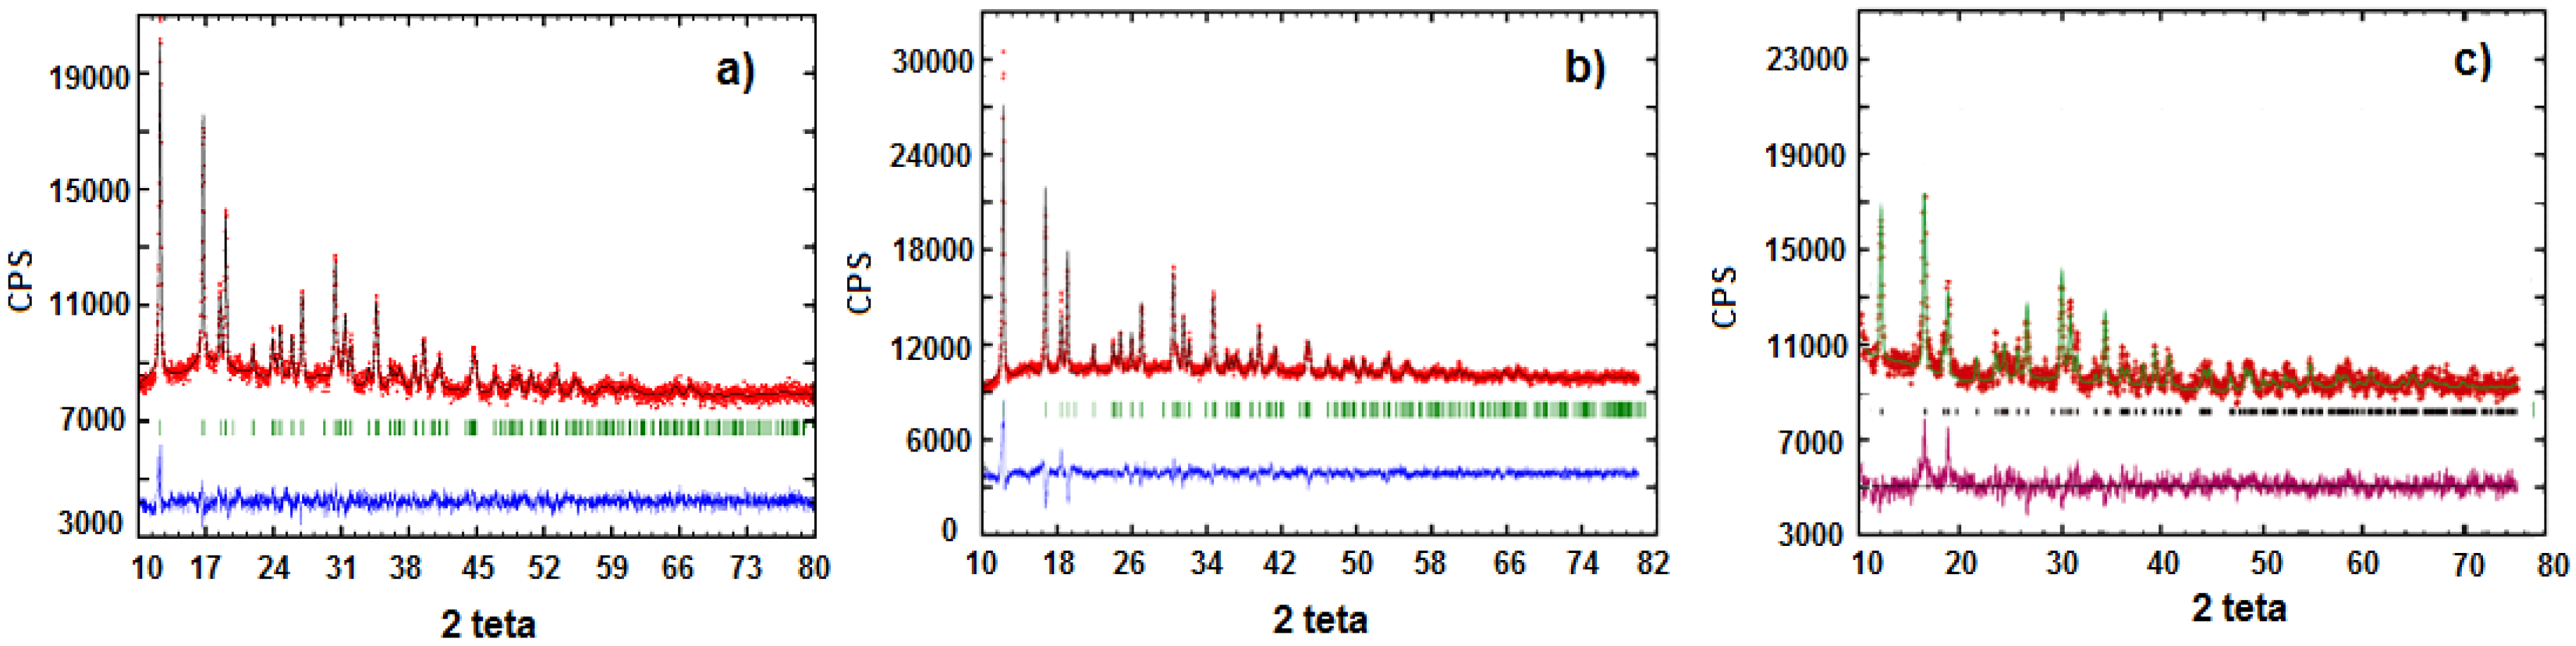
These effects are related to the decomposition of carbonate and organo-phosphonates and to the formation of lithium metal(II) phosphate. Such experimental evidences are in good agreement with literature, according with the dehydration of some hydrate metal phosphates which proceeds by both anion disproportion and condensation. The X-ray powder diffraction patterns of LiMn
0.1Fe
0.9PO
4 prepared from either
P1 and Li
2CO
3 or
P2,
P3, and Li
2CO
3 precursors are very alike as well, as shown in
Figure 4. Both belong to orthorhombic space group
Pnma (olivine like structure) [
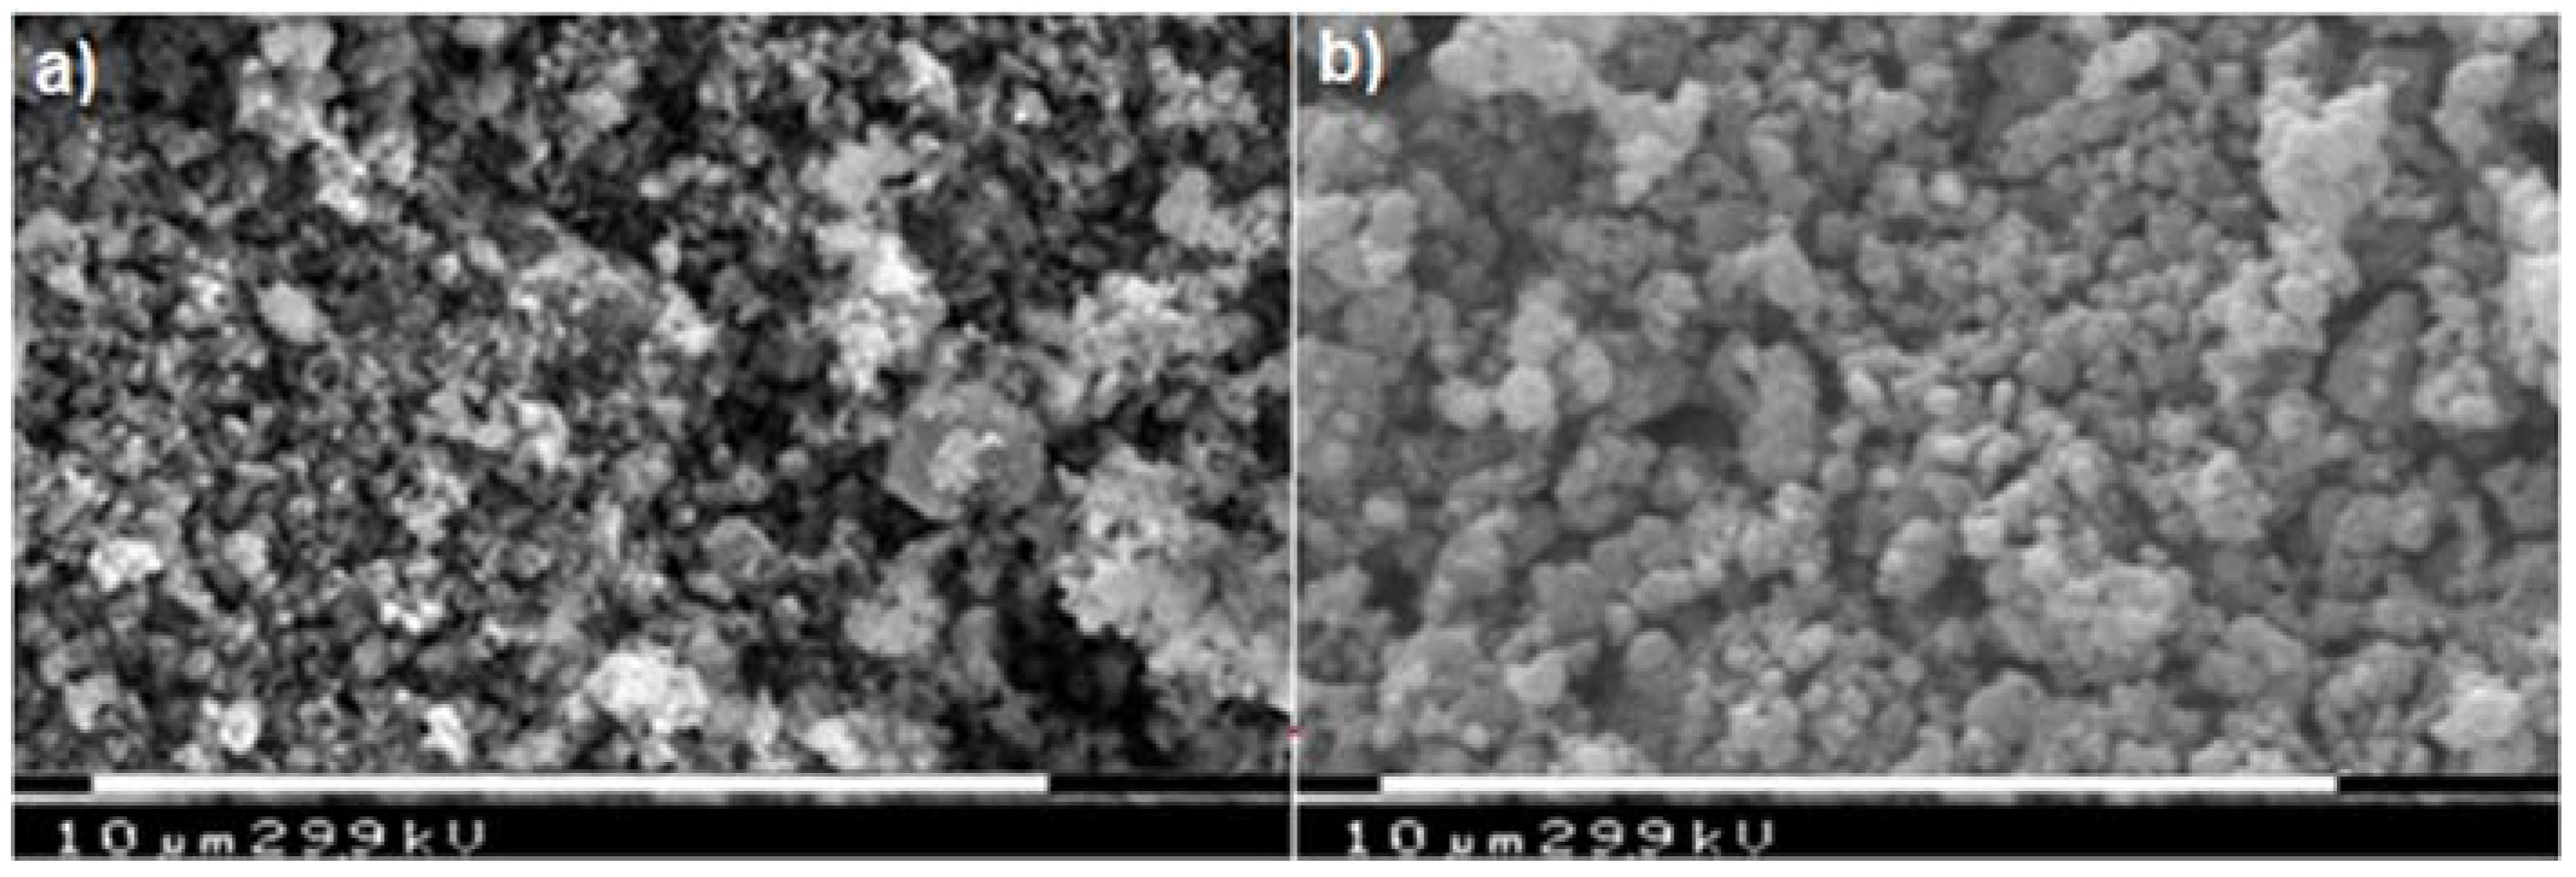
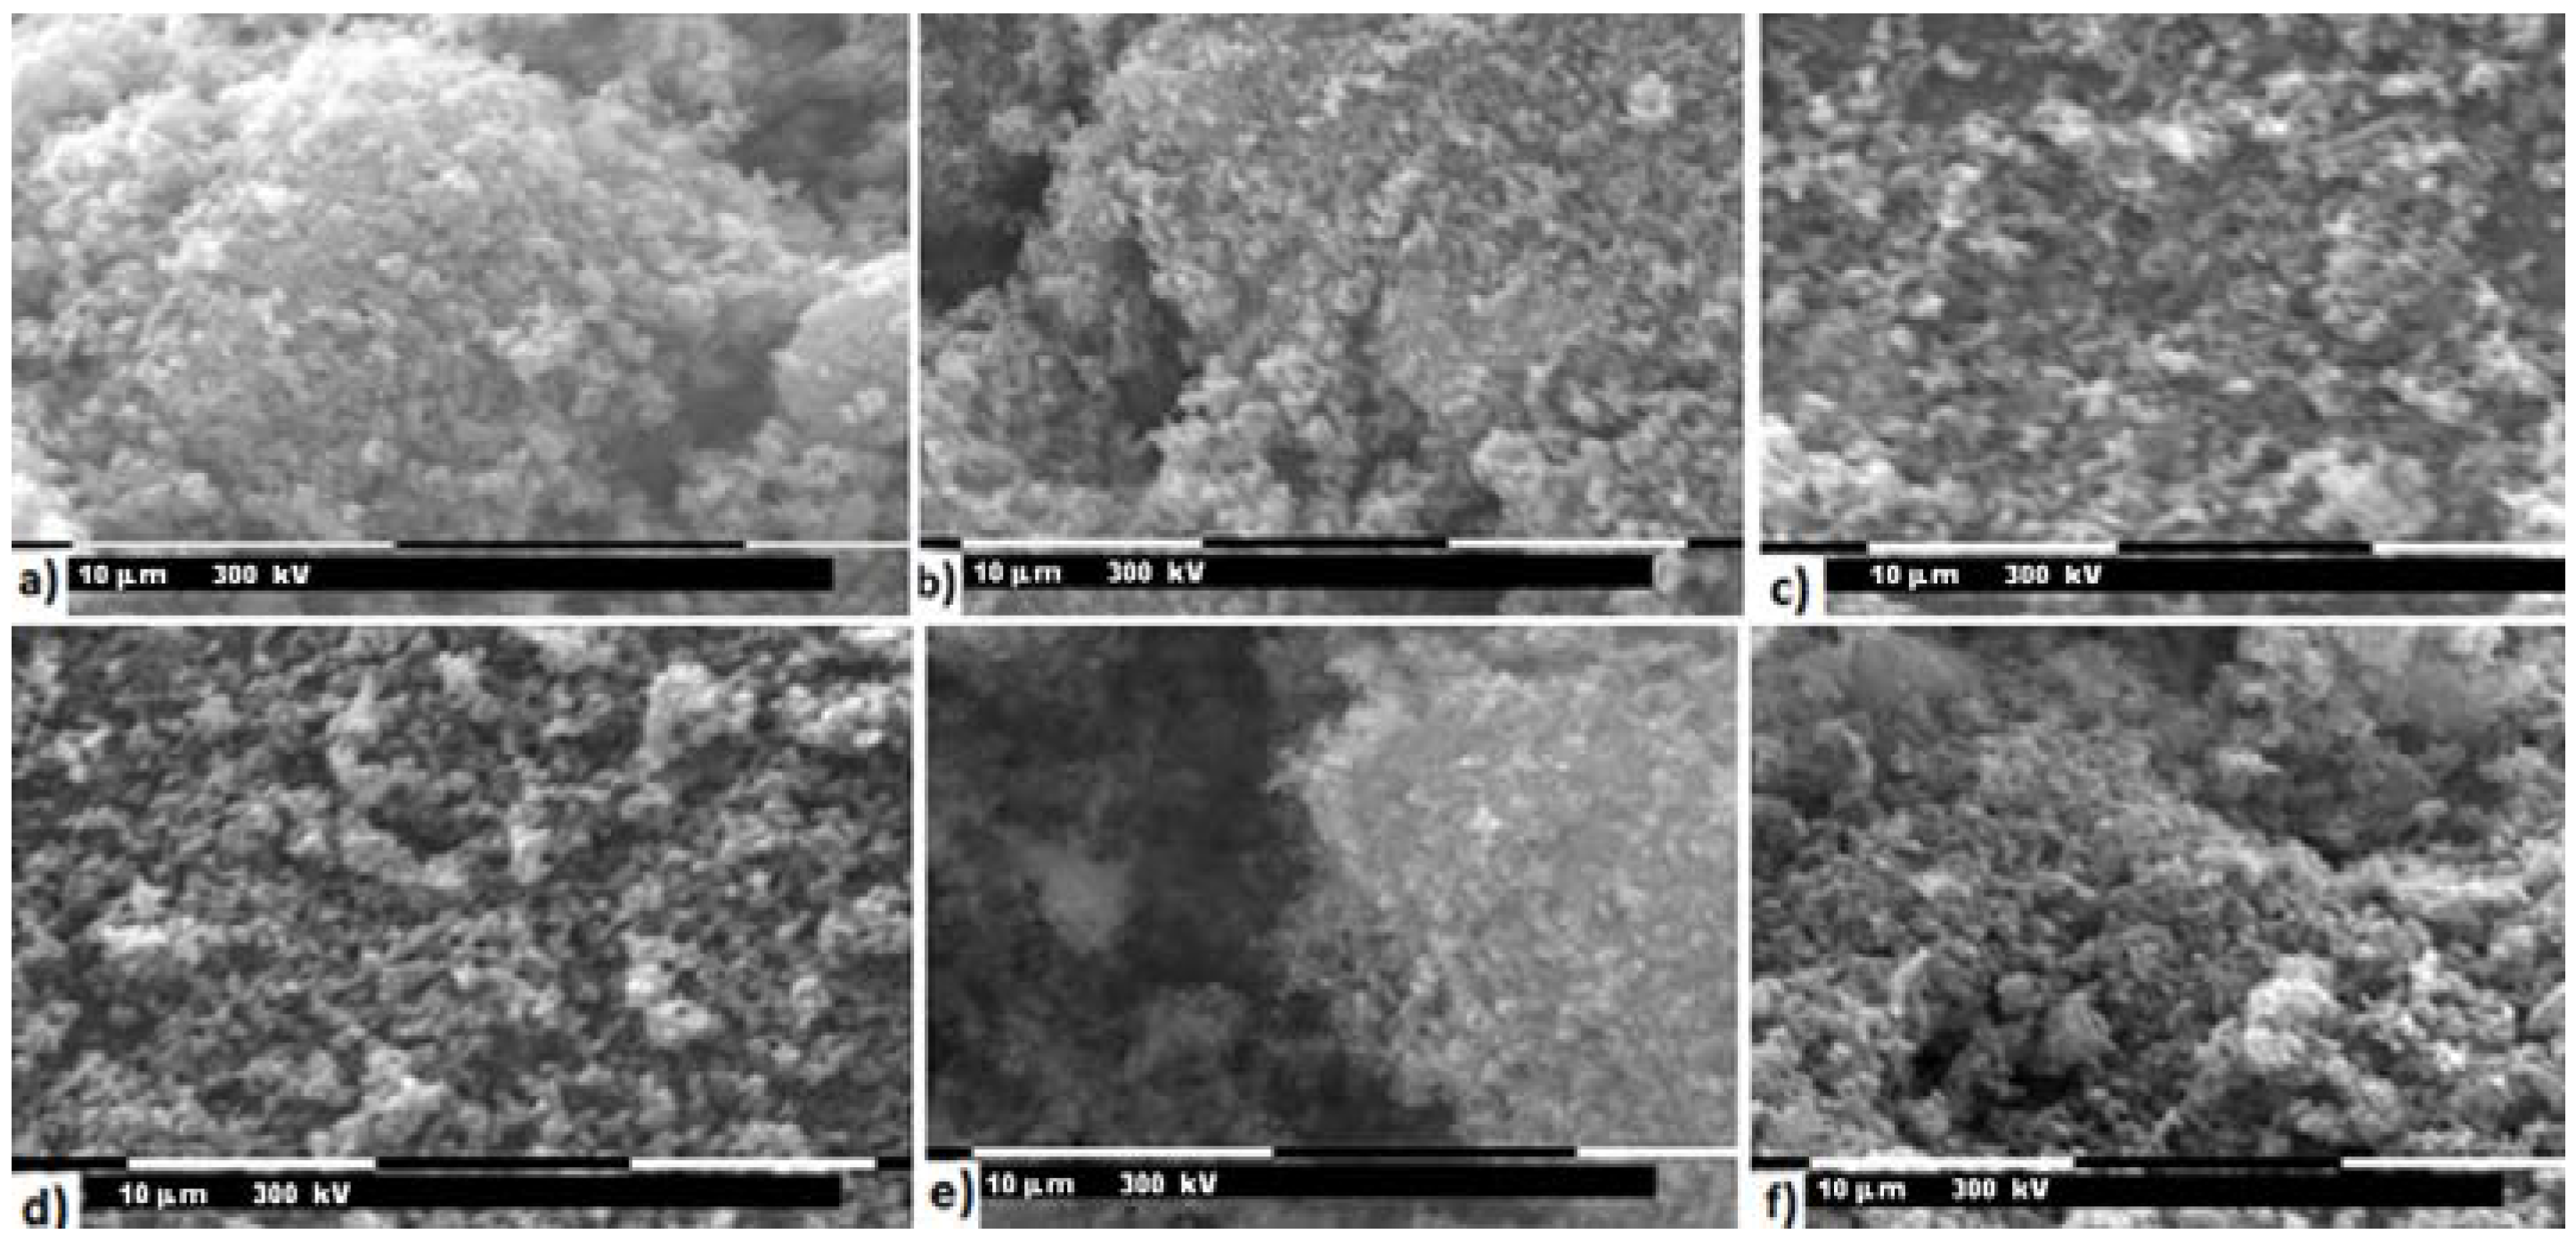
13]. The similarity between these two samples is evident also from SEM (Scanning Electron Microscopy) images reported in
Figure 5 and
Figure 6.
The particles show a comparable morphology. In both samples the particles appear agglomerated and the presence of two phases can be noted: the former, likely carbon, is characterized by very small spheres, while the second one (LiMn0.1Fe0.9PO4) is characterized by larger and less regular particles.
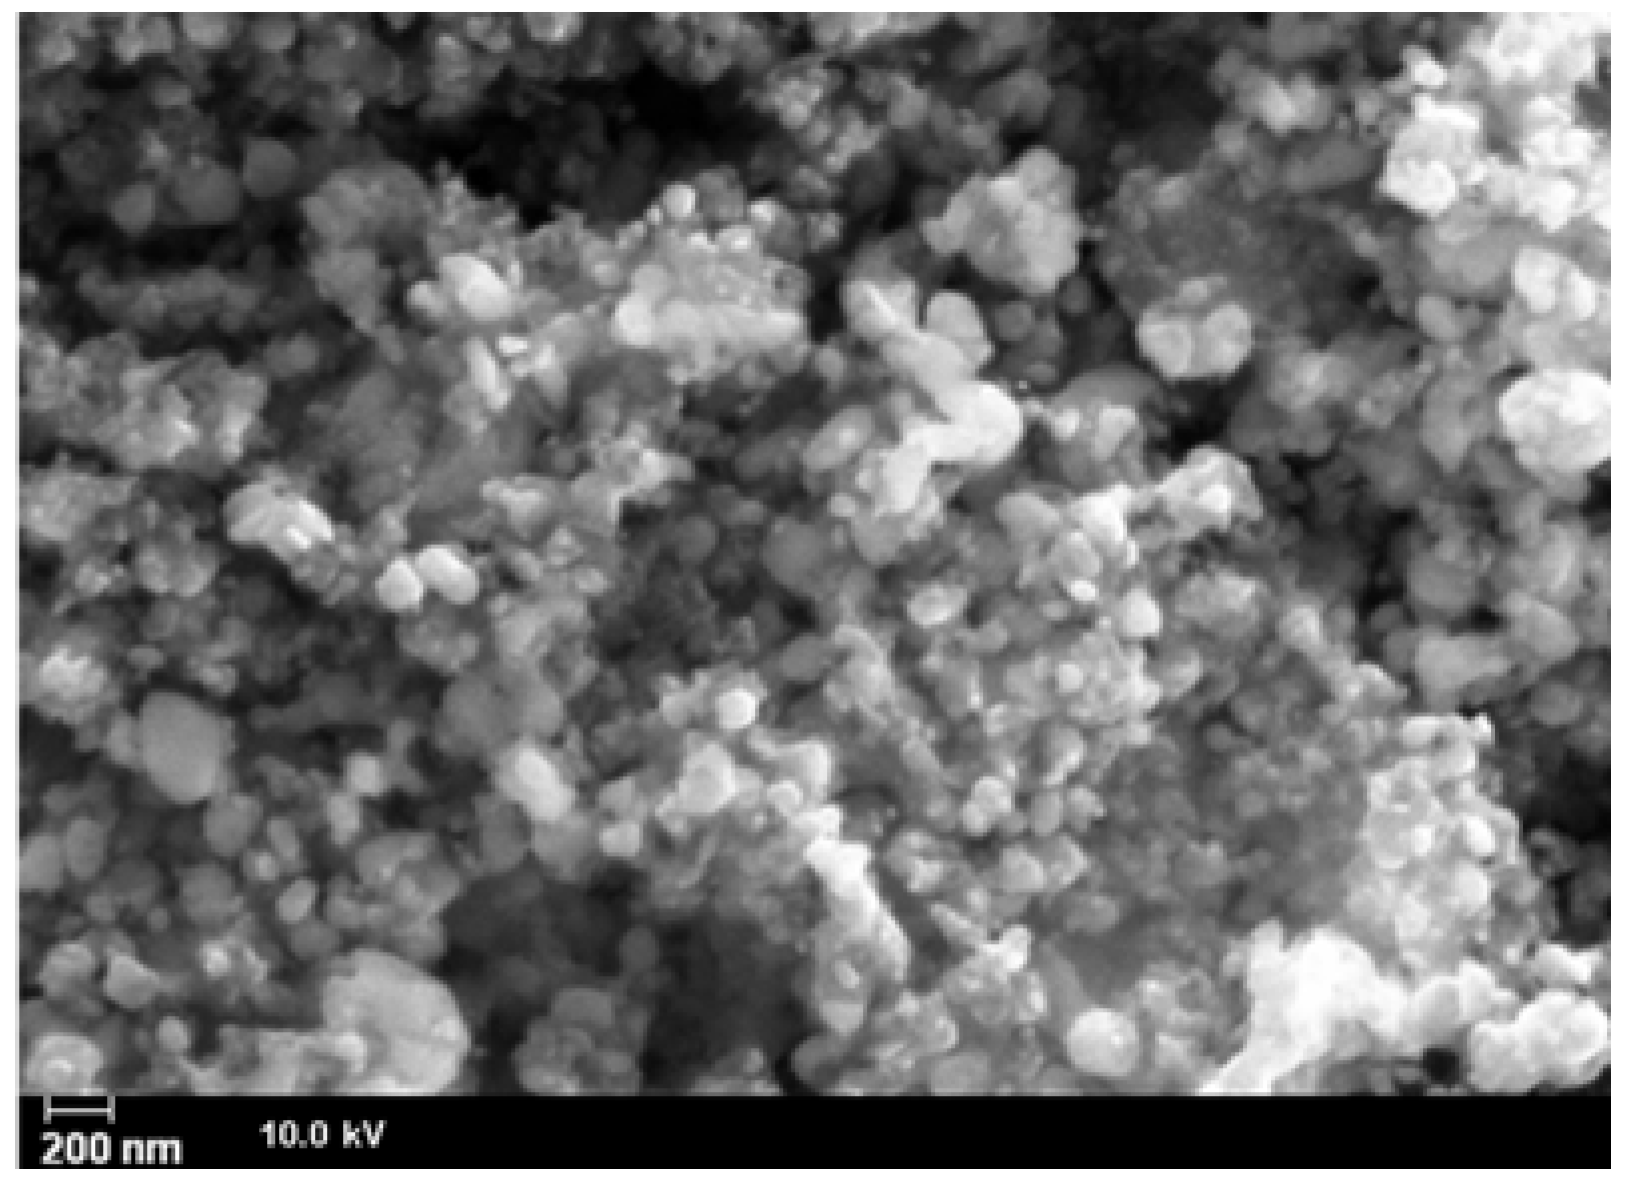
The particles are spheroidal, or in any case there is no dimension that prevails over the others during the growth, like for example in a needle structure; such experimental evidence suggests that during the thermal treatment strong nucleation with the formation of small nucleuses growing indifferently in all directions occurs. In
Figure 6 a higher magnification highlights the formation of very small particles with nanometric size. Actually, the formation of carbon on the active material surface can inhibit the particle grow ensuring a tiny granulometry and possibly can provide good conductibility and electric contact between particles [
13,
14,
15,
16,
17,
18,
19,
20,
21,
22,
23,
24,
25,
26,
27,
28].
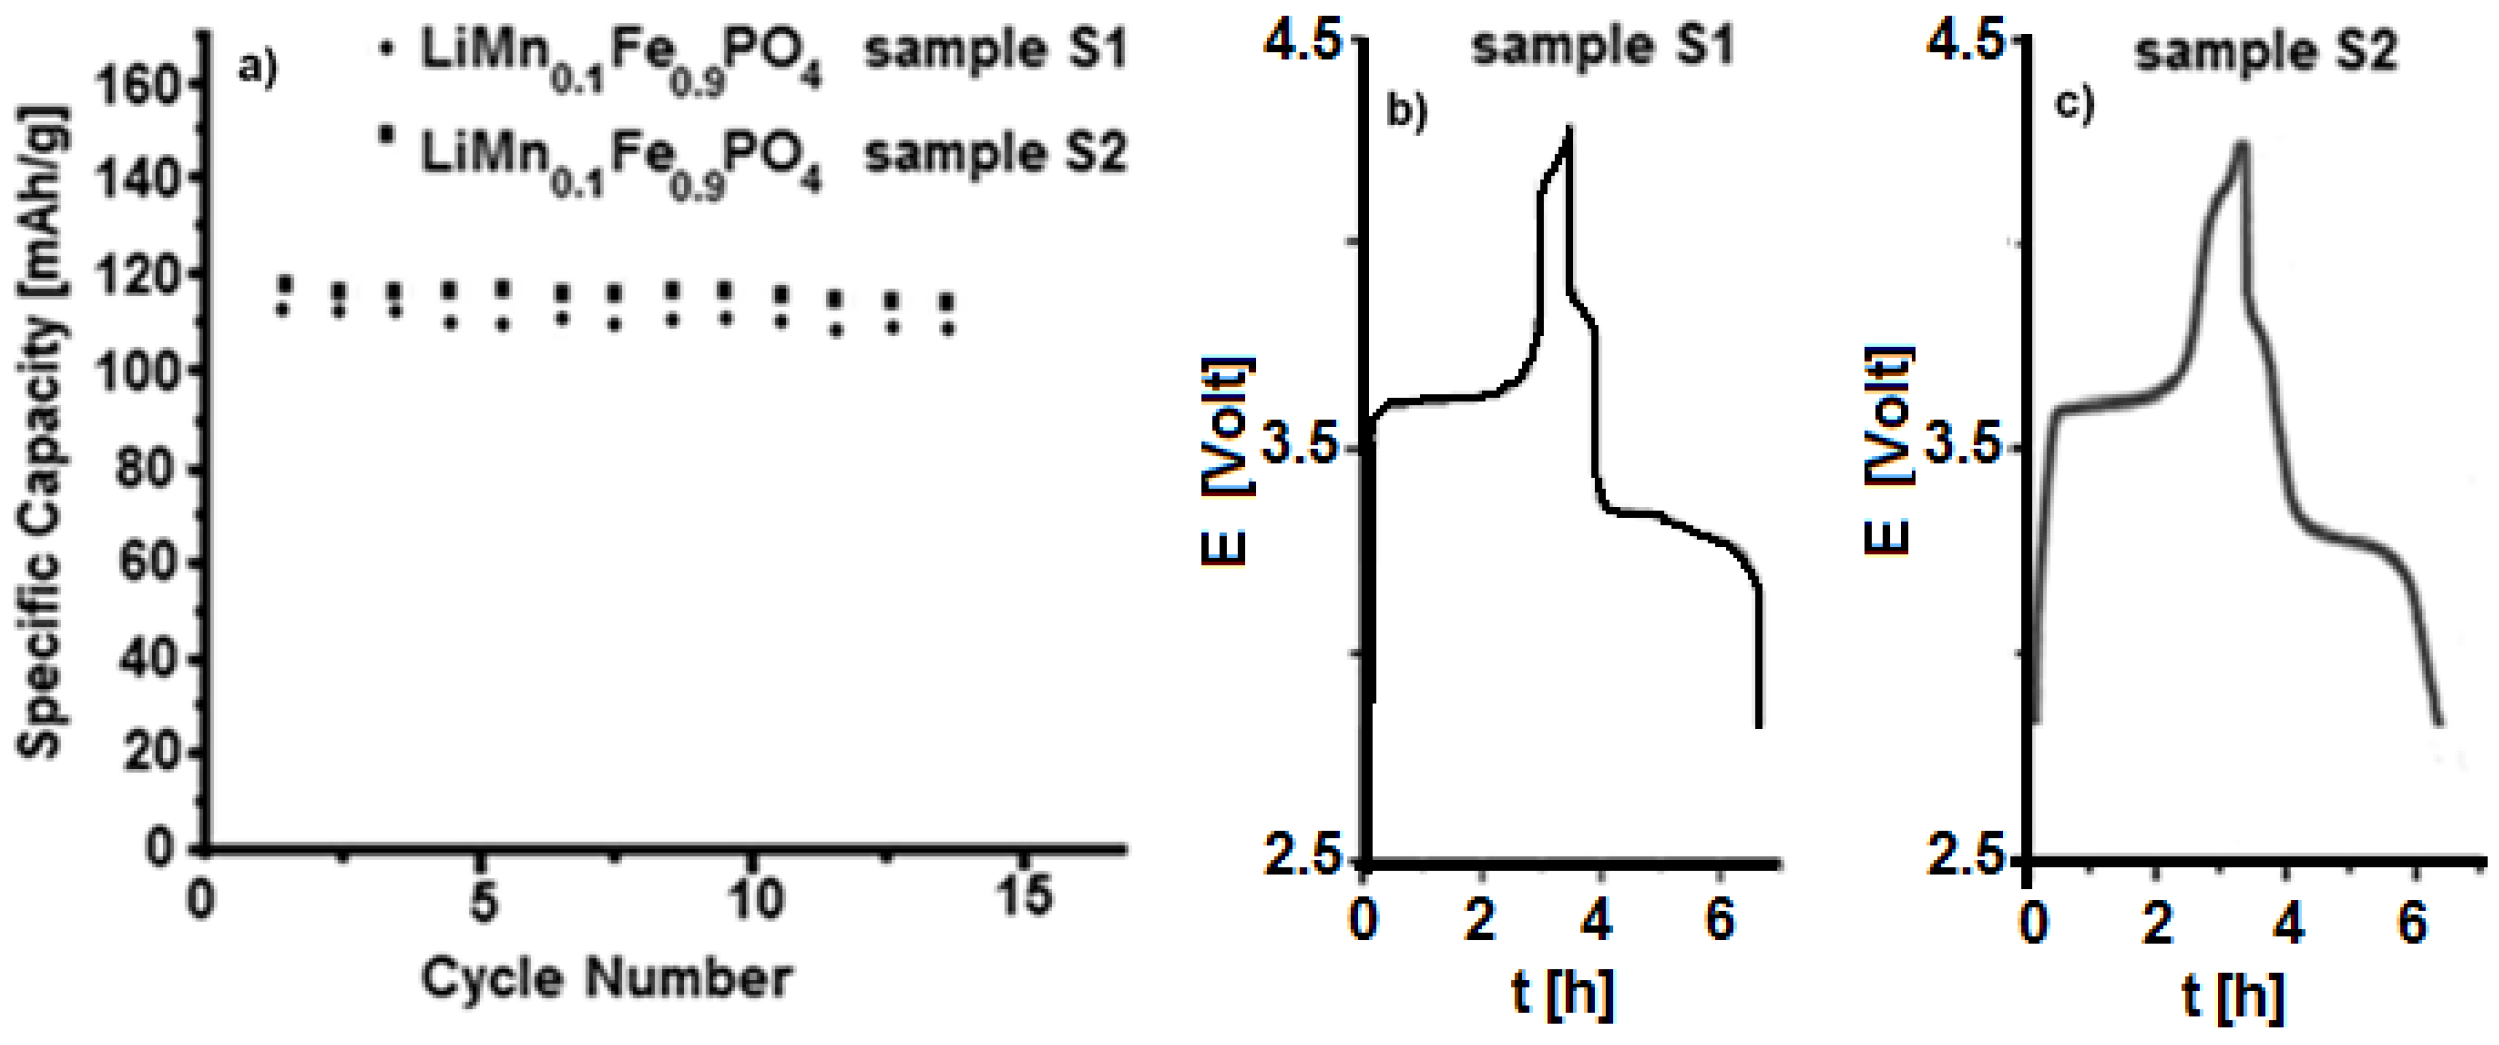
Electrochemical galvanostatic tests on both samples
S1 and
S2 are shown in
Figure 7. The cathode electrodes have been charged and discharged with a current value of C/5 and a specific capacity of about 115–120 mAh/g has been obtained. The materials seem to show similar behaviour, even though sample
S2, obtained by using
P2,
P3 and Li
2CO
3 precursors, presents higher capacity and seems to be more stable upon cycling. On the other hand, the synthesis by
P1 precursor always produces a less performing material, even though it is not straightforward to give an explanation for such different behaviour. Several tests have been performed for each material, and the results are well reproducible.
3.3. Characterization of LiMnxFe(1−x)PO4 (with x = 0, 0.05, 0.1, 0.5, 0.9, 0.95, and 1)
Furthermore, taking in consideration this electrochemical results, a series of LiMnxFe(1−x)PO4 (with x = 0, 0.05, 0.1, 0.5, 0.9, 0.95 and 1), obtained only from P2 and/or P3 and Li2CO3 precursors, have been prepared and characterized.
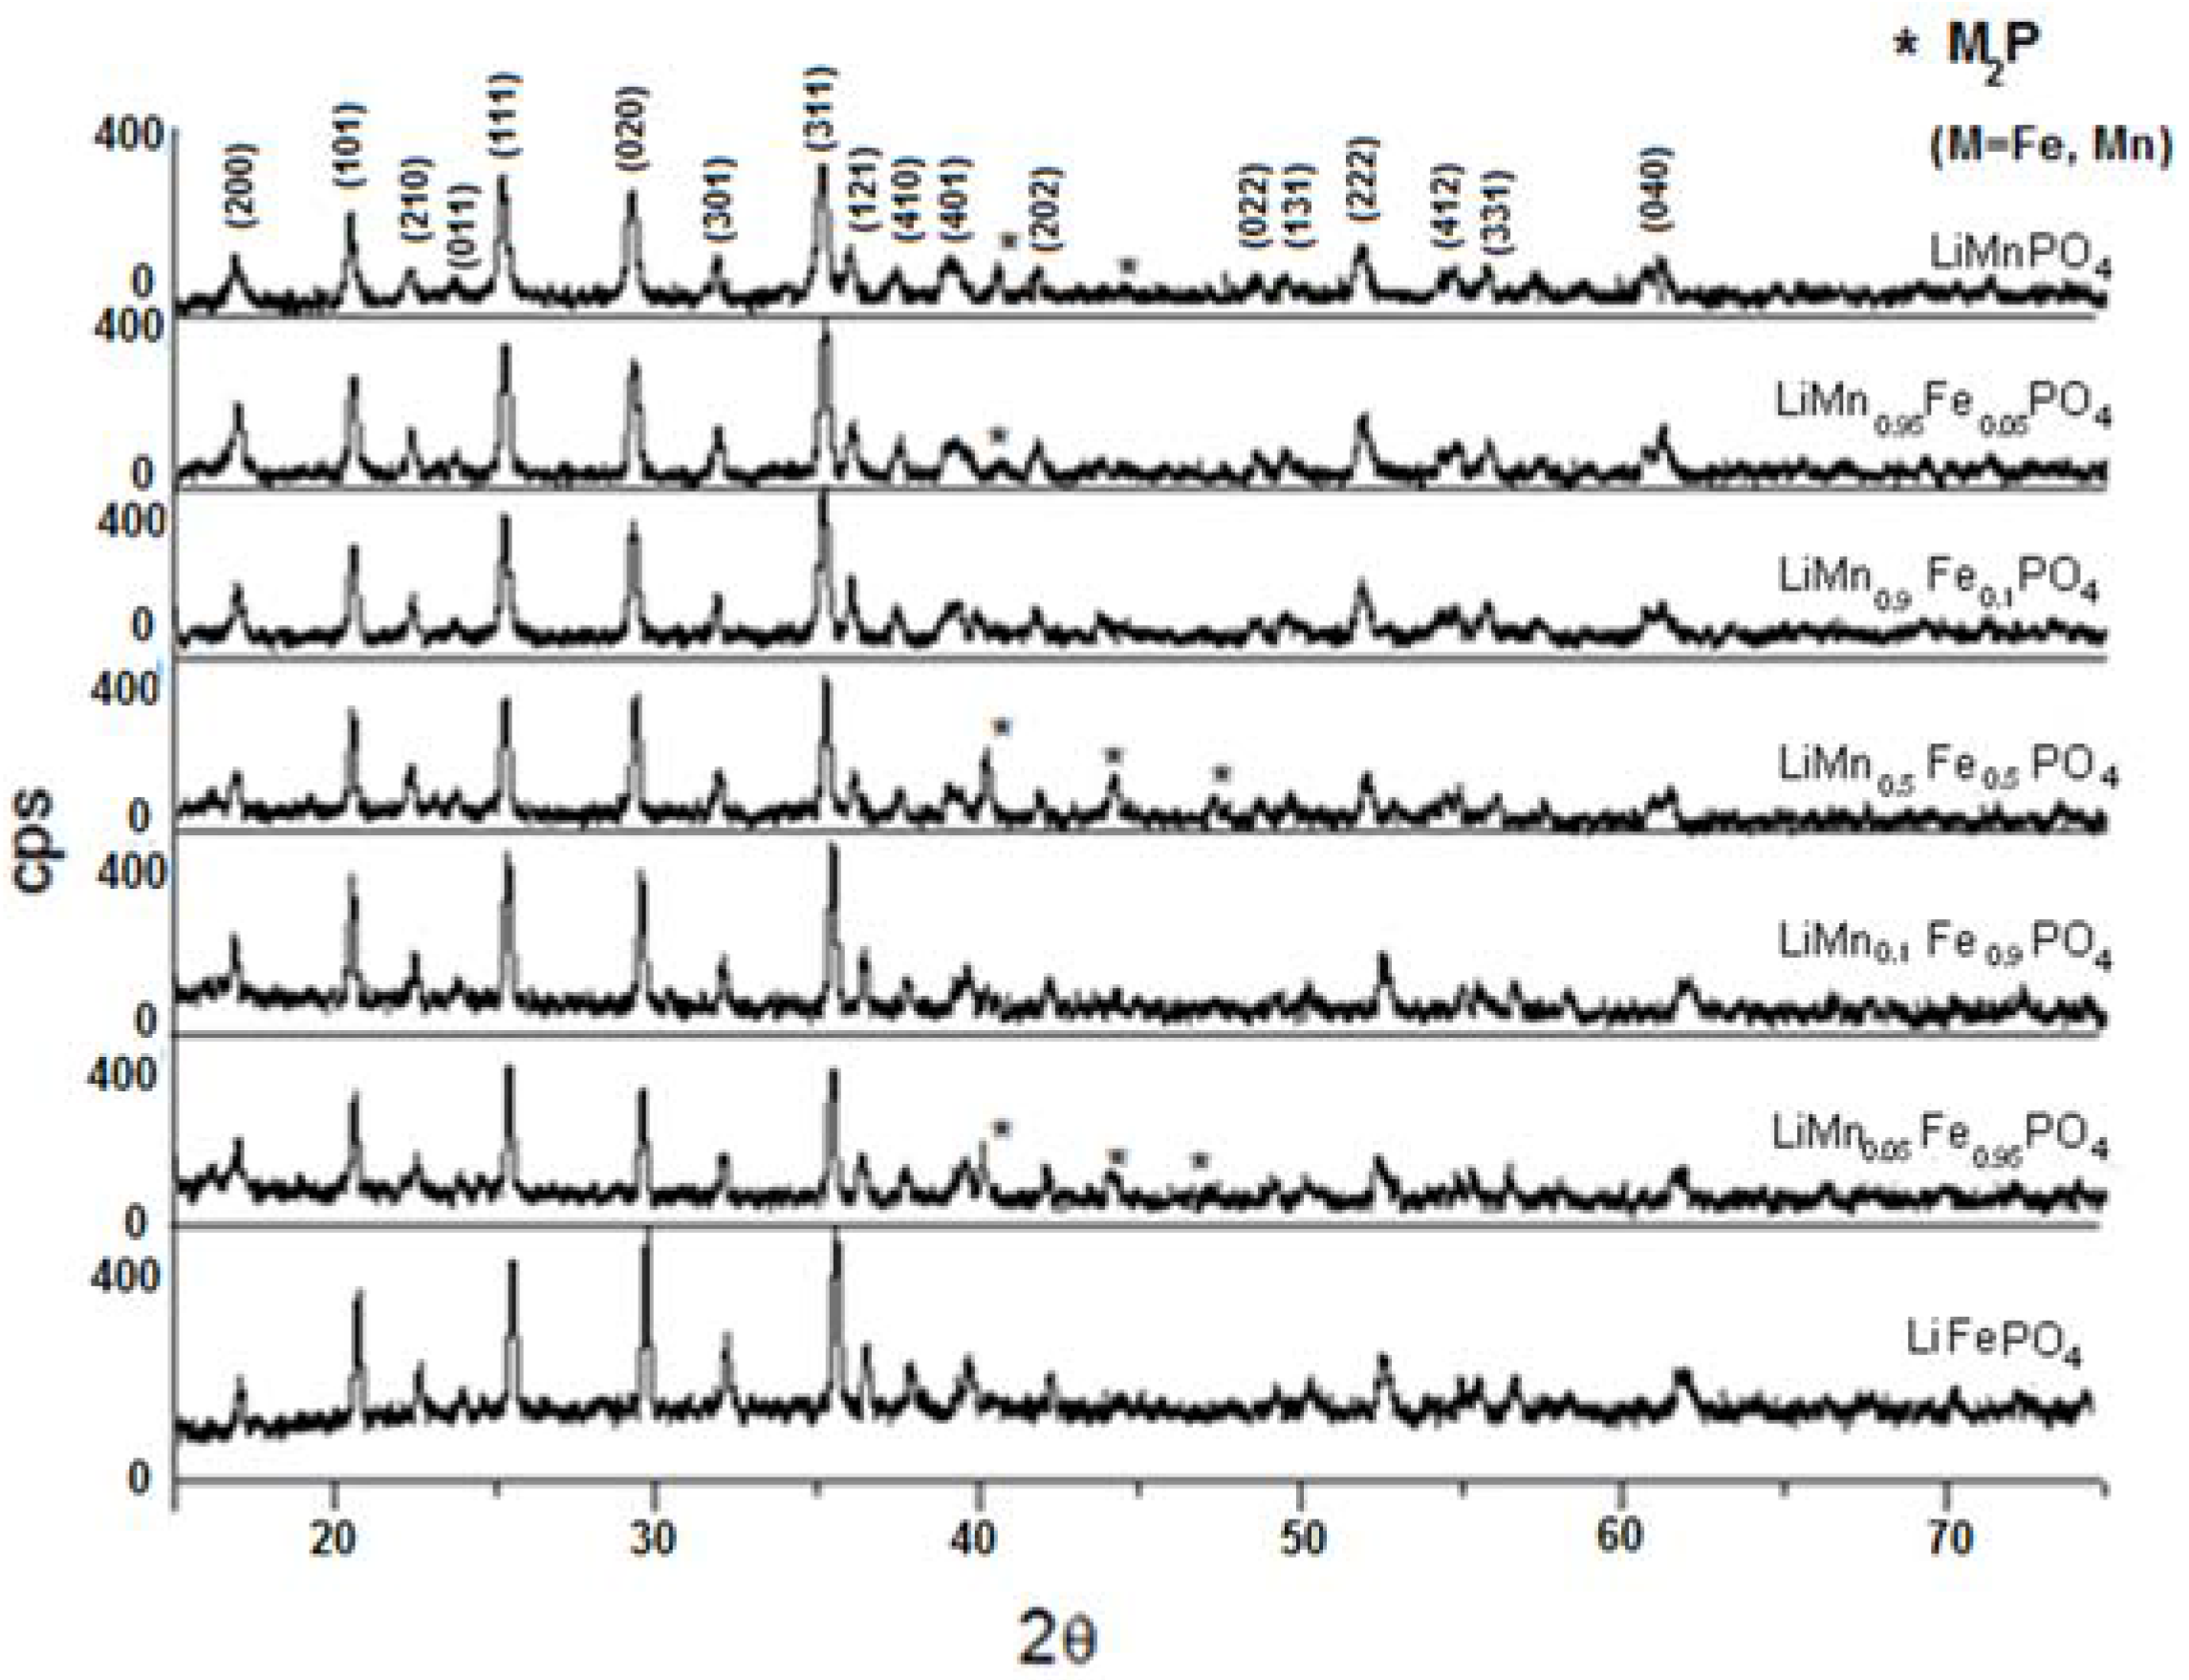
The powder X-ray diffraction spectra of LiMn
xFe
(1−x)PO
4 (x = 0; 0.05; 0.1; 0.5; 0.9; 0.95; 1) are shown in
Figure 8. As it can be observed, substituting manganese in lithium manganese phosphate with iron(II) slightly moves all peaks to the right, although the similarity of the crystalline structure of the two lithium metal(II) phosphates is clear.
Moreover, in
Table 3 the refinement results for cell parameters and crystallites size T, calculated by Scherrer equation (T = 0.9λ/Δ(2θ) cosθ), have been reported and it is clear that passing from LiFePO
4 to LiMnPO
4 the cell size slightly increases, while the crystallites size decreases.
In some samples (x = 0.05; 0.5; 0.95; 1) the presence of iron phosphide (Fe
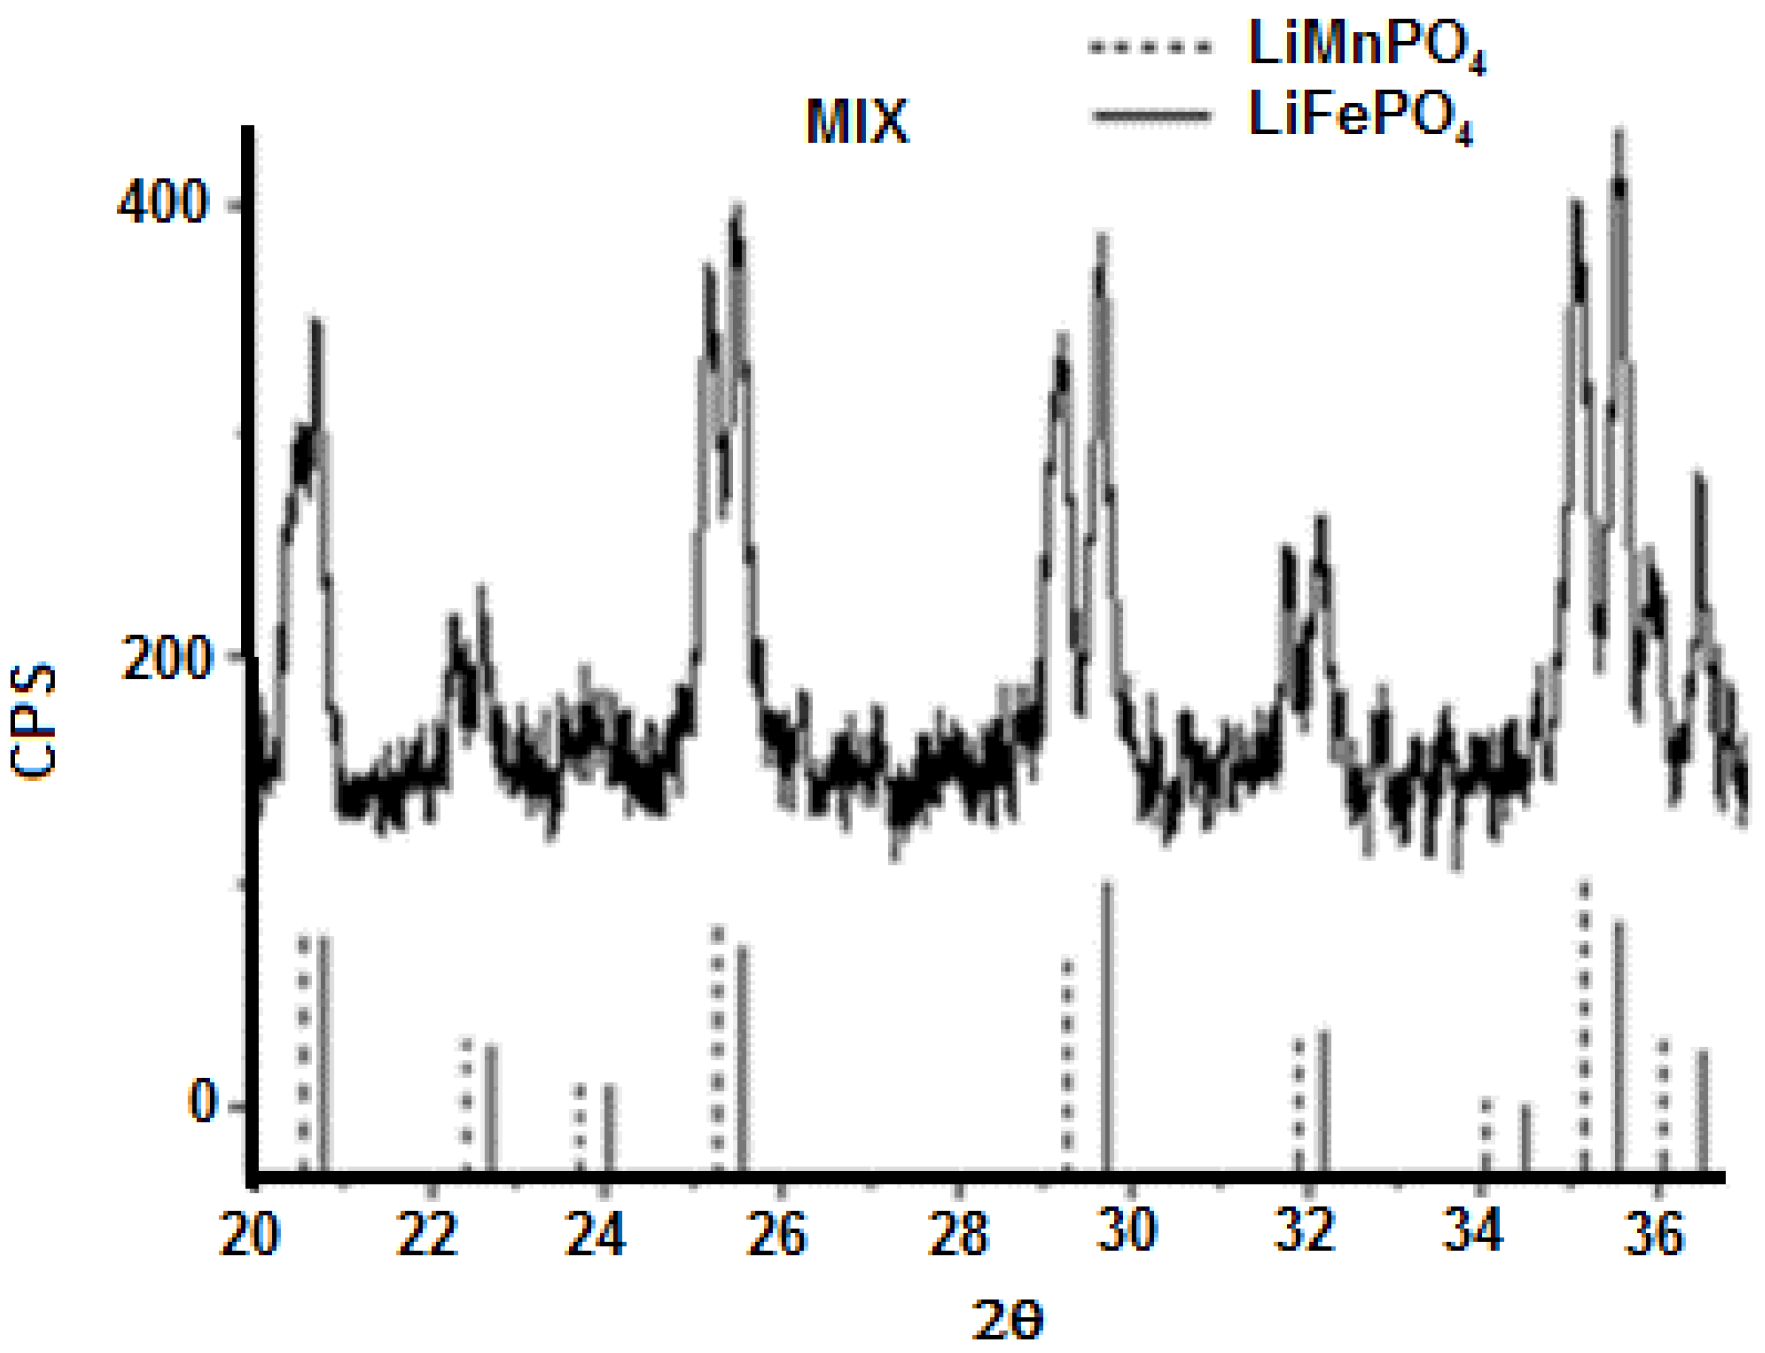
2P) impurities have been detected. Replacement of the bivalent hetero-metal atom does not affect the crystalline structure of pure lithium iron and manganese phosphate. Indeed the crystalline structure (space group) is the same but substitution of iron with manganese (different atomic radius) in effect shifts the peak positions slightly and this is visible also in the reported XRD spectra. What is important here is that for all samples one, unique crystalline phase has been detected while the mechanic mixture clearly shows peak splitting due to the presence of two crystalline phases. On the other hand, when simply mixing together (0.5:0.5) LiMnPO
4 and LiFePO
4, the observed X-ray diffractogram shows a splitting of the peaks, as reported in
Figure 9. Actually, in this case two similar crystalline structures presenting slightly different peak positions are present, therefore, two distinct phases and a splitting of peaks are evident. It is worth to note that in the case of manganese-iron phosphate synthesized from metal(II) phenylphosphonate mixtures as described before, even when Mn(II) and Fe(II) are present in equal ratio, as in LiMn
0.5Fe
0.5PO
4, formation of only one crystalline phase has been observed.
The results of BET analysis for cathodic powders obtained are reported in
Table 4 along with the carbon weight percentage determined by elemental analysis, which ranges from 10% to 13.7%. This percentage value has been also confirmed by EDX analysis performed on some samples. The average specific surface is equal to about 115 m
2·g
−1.
The SEM images in
Figure 10 show similarity of both morphology and particle size of the various samples. Indeed, identical considerations already done for LiMn
0.1Fe
0.9PO
4 and no particular differences can be highlighted.
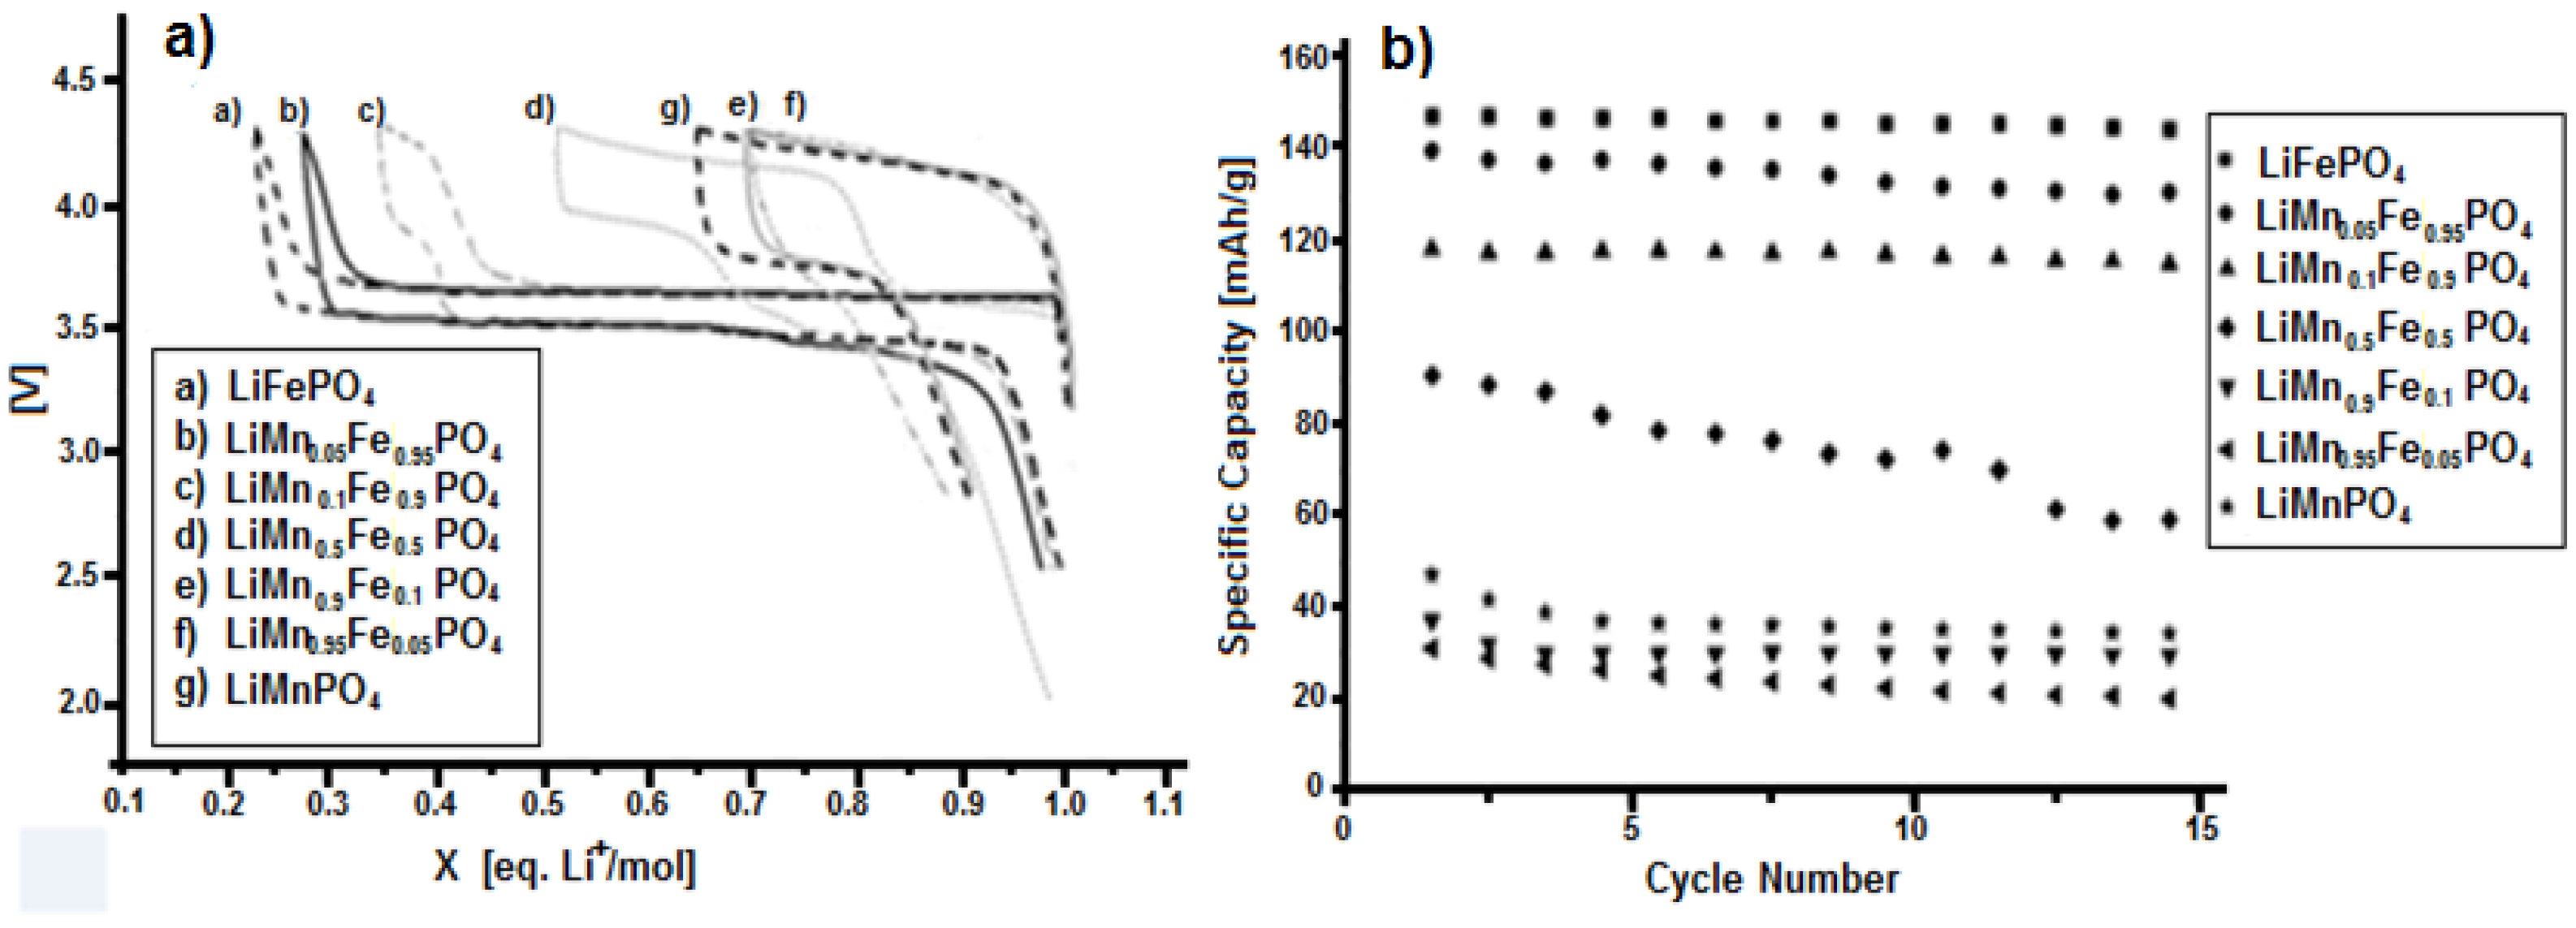
The electrochemical tests indicate that pure lithium iron phosphate is the material with the highest specific capacity, i.e., about 150 mAh·g−1. Upon increasing of manganese content, the capacity gradually drops, reaching the significantly low value of 23 mAh·g−1 for LiMn0.95Fe0.05PO4. Therefore, regarding the specific capacity, the presence of manganese does not seem to have particular advantages.
As it can be seen from
Figure 11a, the only advantage shown by the presence of manganese is a higher insertion-deinsertion potential value. In fact, the potential value of the Mn
3+/Mn
2+ redox couple is 4.15 V, while for the Fe
3+/Fe
2+ redox couple it results to be 3.5 V, both vs. Li
0/Li
+.
The LiMn0.5Fe0.5PO4 compound exhibits a poorly stability upon cycling, while the compounds with a higher percentage of manganese show a low capacities. Taking into consideration the two pure compounds, namely LiFePO4 and LiMnPO4, they both have capacity higher than the respective modified compounds. In particular, the presence of Mn(II) decreases the capacity of LiFePO4 more than the substituition of manganese with iron in LiMnPO4. Indeed the plateaus at 3.5 V for LiMn0.9Fe0.1PO4 and LiMn0.95Fe0.05PO4 are absent, while for LiMn0.5Fe0.5PO4 the plateau at 3.5 V is shorter than the one at 4.15 V. Even if there is just one phase, as it is possible to note by XRD, lithium ion insertion into the structure induces either reduction of Fe+3 to Fe+2 at about 3.5 V or the reduction of Mn+3 to Mn+2 at about 4.1 V, producing in both cases an equilibrium between the oxidized and reduced form (namely, MePO4/LiMePO4, where Me is Fe or Mn), and then determining the stress inside the structure. Such stress, produced by hetero-atom reduction, is even enhanced when its amount is very low, since, in this case, around its position dissimilar atoms are present and the redox reaction could be inhibited. However, the presence of low quantity of manganese can help the lithium insertion into the iron-base structure, but not vice versa.
Among the different compounds of the series, only those of lithium iron-phosphate with low manganese content have been taken into account for further investigation, since they have the highest capacities. To evaluate the performances of those samples, the reversibility degree of the insertion-deinsertion process, the pseudo-diffusion lithium coefficient and the charge transfer resistance, were calculate by PSV, PITT, and EIS experiments, respectively.
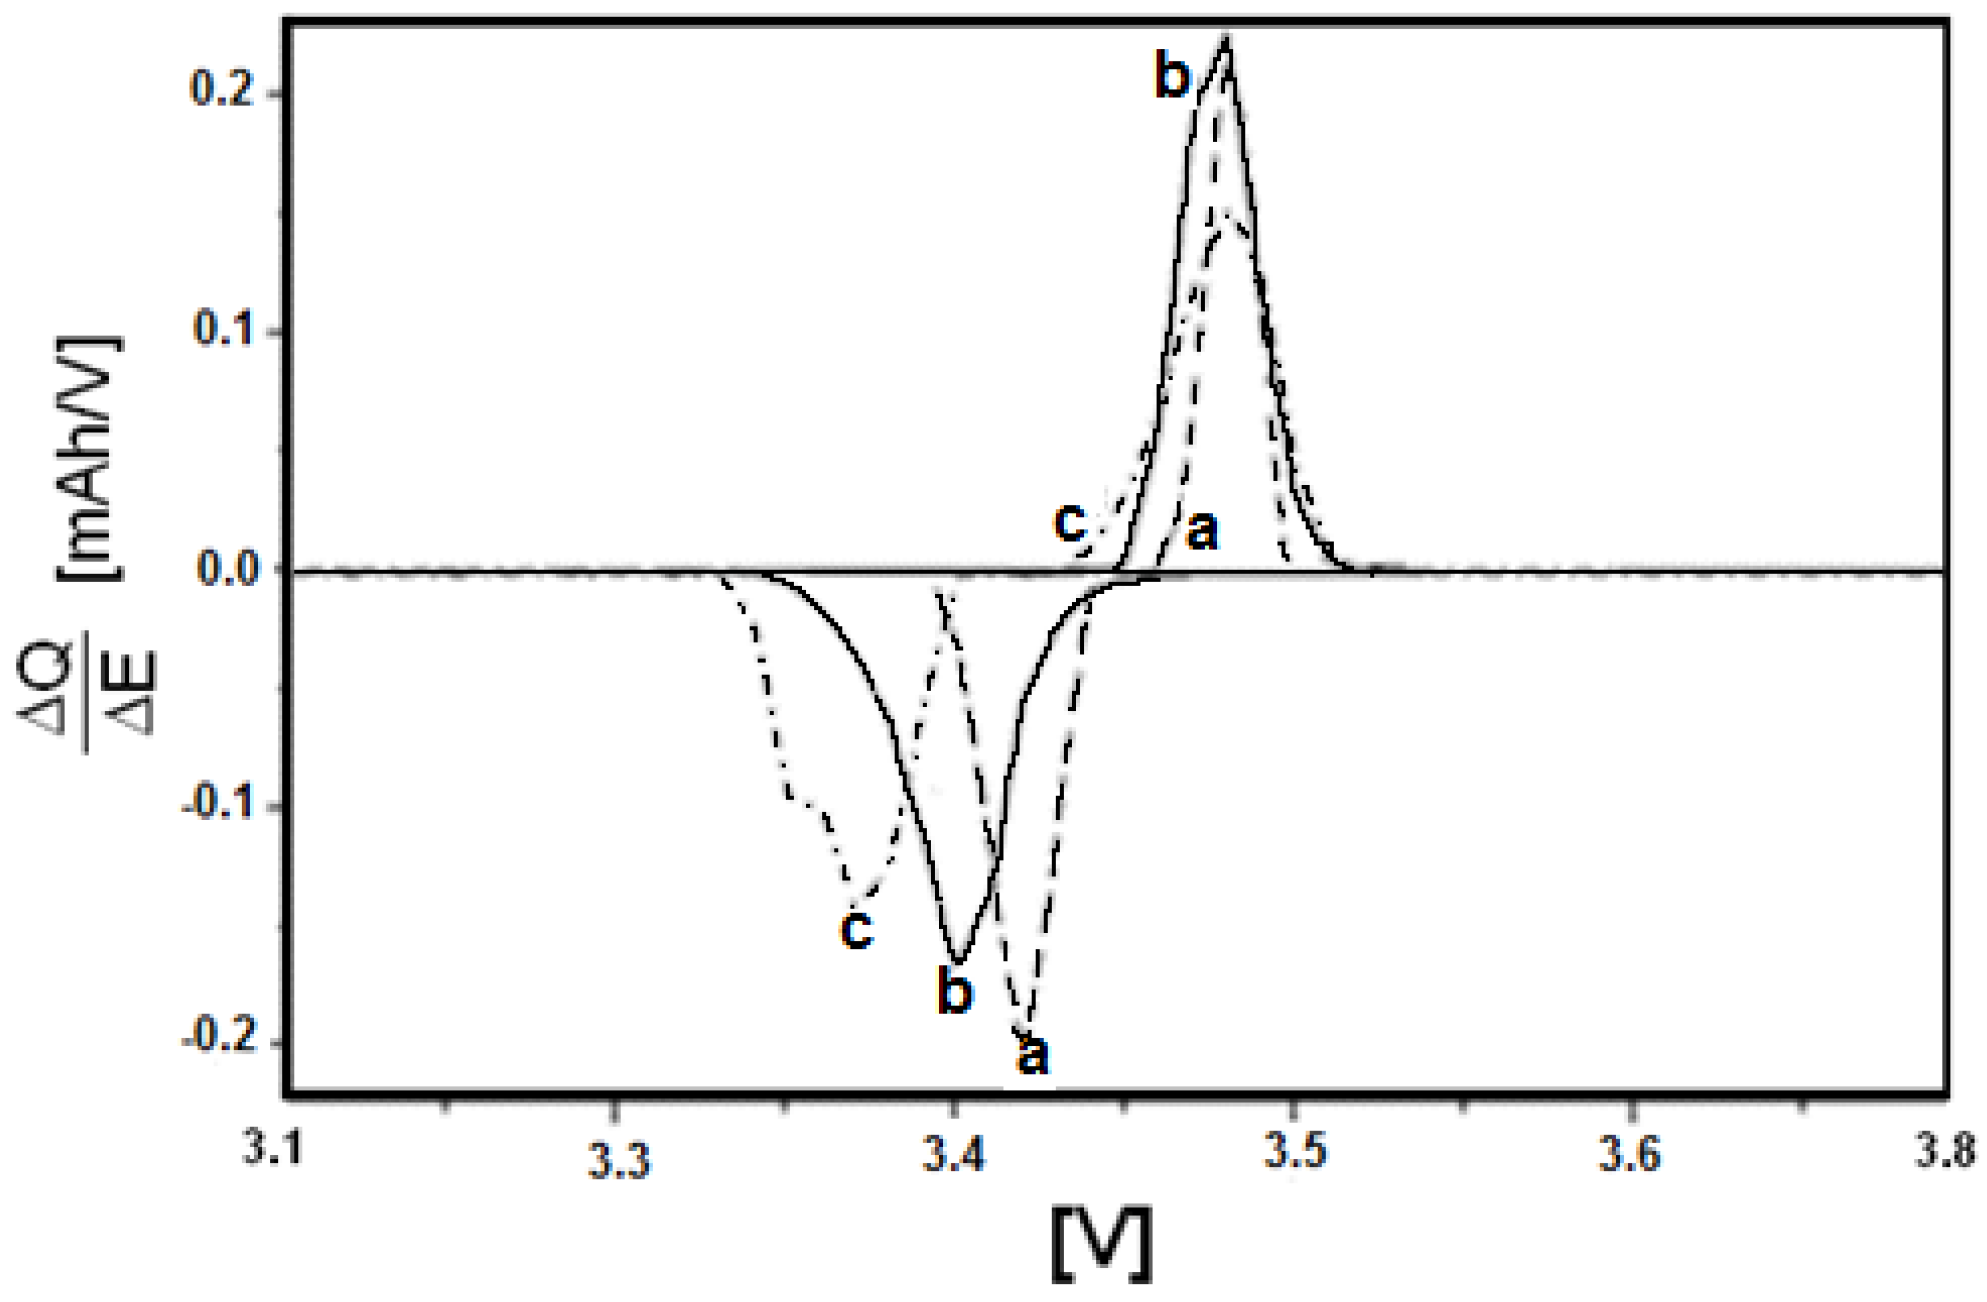
In
Figure 12 potential step voltammetry is shown for LiFePO
4, LiMn
0.05Fe
0.95PO
4, and LiMn
0.1Fe
0.9PO
4. In this picture, the insertion-deinsertion process can be observed in correspondence of two peaks. The upward peaks correspond to the oxidation process at approximately 3.47 V for all samples (odd sweeps), while the downward peaks represent the reduction process at approximately 3.37, 3.40, and 3.42 V (even sweeps) for LiFePO
4, LiMn
0.05Fe
0.95PO
4, and LiMn
0.1Fe
0.9PO
4, respectively. In general terms, the shorter the distance between oxidation and reduction peaks, the higher the reversibility of the process. In the present case it is possible to recognize that manganese content in LiFePO
4 increases the process reversibility. The average value of pseudo-diffusion coefficient has been also evaluated determining the Cottrell region for the potential step voltammetry corresponding to the deinsertion process, by using the PITT technique [
29,
30,
31], and assuming the average particle radius as the diffusion characteristic length, L, equal to about 0.1 × 10
−4 cm. Indeed, as said before, the insertion of lithium takes place by means of several reaction fronts, and a pseudo-diffusivity coefficient should be more correctly defined, despite McKinnon and Hearing’s assumption [
32], who found that it is not possible to distinguish between two different diffusion models based on continuous (solid solution formation) or not continuous (two-phase formation) charging procedures. In
Table 5 the pseudo-diffusion coefficient value for both pure LiFePO
4 and the materials with low manganese content has been reported. Increasing the manganese content, the value enhances very slightly, so that only few changes can be reached with manganese adding.
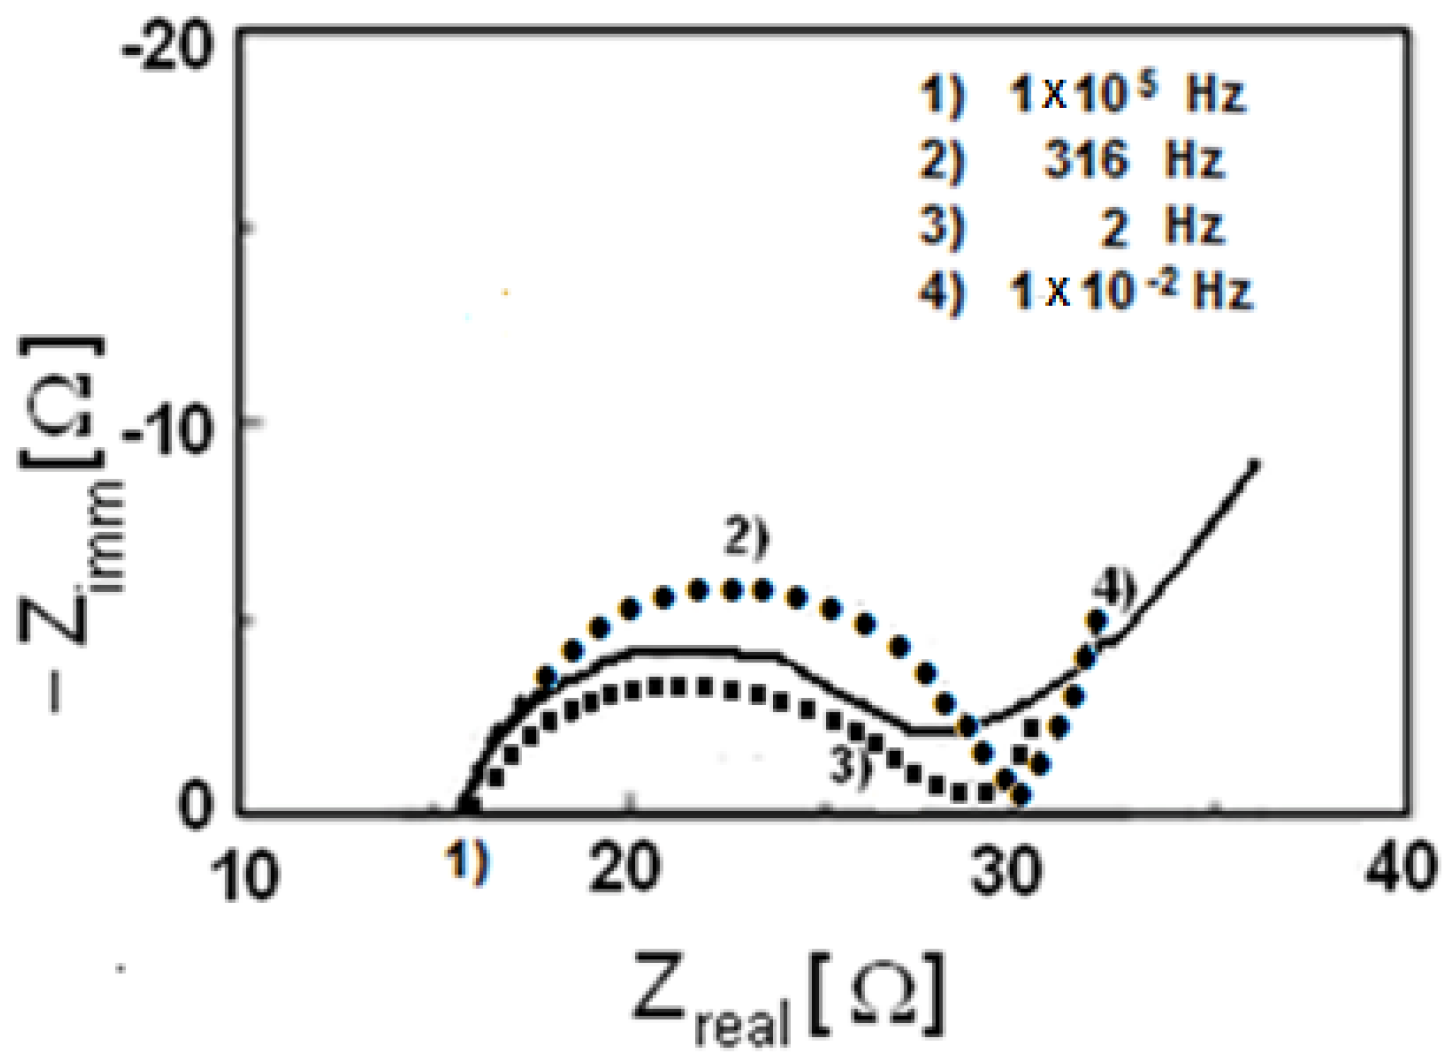
Impedance spectroscopy has been also performed on these three materials and in
Figure 13 (Nyquist diagram) the real and imaginary parts of impedance have been reported.
The electrolytic resistance R
el is the first intercept of the semicircle with the
x-axis, while the second intercept minus the electrolytic resistance R
el represents the charge transfer resistance R
ct. Therefore, it is possible to state that for all cases R
ct is about 15 Ω. It is known by literature that the transfer charge resistance for pristine LiFePO
4 without in situ carbon formation is higher than 40–50 Ω [
33,
34], so that by using this synthetic method a decrease of the charge transfer resistance has been, overall, reached.
Finally, we compared the synthesis and the electrochemical performances of our materials with analogous LiMn
xFe
(1−x)PO
4 already described in the literature and reported in
Table 6.
Saravanan et al. [
35] produced LiMn
xFe
(1−x)PO
4 /C (x = 0; 0.5; 1) with in situ carbon formation, by using the solvothermal method. They obtained a specific capacity equal to 150, 65, and 50 mAh/g for x equal to 0, 0.5 and 1, respectively, after 20 cycles at C/5. The same material obtained by Yoncheva et al. [
36] at 500 °C starting from a phosphonate-formate precursor, freeze-drying an aqueous solution containing Li, Fe and Mn phosphate and formate ions, on the other hand, showed a capacity of 140, 120, and 95 mAh/g for x equal to 0, 0.5 and 1, respectively, a C/20. Zhang et al. [
37] produced LiMn
xFe
(1−x)PO
4/C by solid state reaction with x = 0.7, 0.8, and 0.9, obtaining at C/10 a capacity ranging from 110 to 130 mAh/g as x decreases. Xu et al. [
38] synthesized carbon free materials through a direct hydrothermal process a 170 °C achieving a capacity of 140, 110, 95, 90, and 78 mAh/g for x equal to 0.1, 0.2, 0.05, 0, and 0.4, respectively, at C/10. The lowest charge transfer resistance has been obtained for x = 0.1 and it is about 200 Ω, while, for x = 0.2 and x = 0, it is 450 and 1400 Ω, respectively.
Finally Wang et al. [
39], which attained carbon-free LiMn
xFe
(1−x)PO
4 by mechano-activation assisted synthesis, reached, the best performance of 125 mAh/g for x equal to 0.2 at C/10.
On the basis of these considerations, our results are consistent and, in some cases, even better than those found in the literature.

 ,
, 


