Article

Effect of the Elastic Deformation of a Point-Sharp Indenter on Nanoindentation Behavior

1
Faculty of Art and Regional Design, Saga University, 1 Honjo-machi, Saga 840-8502, Japan
2
Laboratory for Materials and Structures, Institute of Innovative Research, Tokyo Institute of Technology, R3-24 4259 Nagatsuta, Midori, Yokohama 226-8503, Japan
*
Author to whom correspondence should be addressed.
Materials 2017, 10(3), 270; https://doi.org/10.3390/ma10030270
Submission received: 25 January 2017 / Accepted: 2 March 2017 / Published: 7 March 2017
(This article belongs to the Special Issue Advanced Nanoindentation in Materials)

Abstract

:
The effect of the elastic deformation of a point-sharp indenter on the relationship between the indentation load P and penetration depth h (P-h curve) is examined through the numerical analysis of conical indentations simulated with the finite element method. The elastic deformation appears as a decrease in the inclined face angle β, which is determined as a function of the elastic modulus of the indenter, the parabolic coefficient of the P-h loading curve and relative residual depth, regardless of h. This indicates that nominal indentations made using an elastic indenter are physically equivalent to indentations made using a rigid indenter with the decreased β. The P-h curves for a rigid indenter with the decreased β can be estimated from the nominal P-h curves obtained with an elastic indenter by using a procedure proposed in this study. The elastic modulus, yield stress, and indentation hardness can be correctly derived from the estimated P-h curves.

1. Introduction

Nanoindentation is a form of mechanical testing characterized as a depth-sensing indentation [1] to evaluate local mechanical properties through the analysis of the indentation load P versus the penetration depth h (P-h curve, hereafter). The analysis is principally based on a geometrical definition in which the indentation is carried out on a flat surface using an indenter geometrically defined such as flat-ended, spherical, ellipsoidal, point-sharp (e.g., conical, Berkovich, Vickers, cube corner, etc.). The point-sharp indentation has an advantage in local mechanical testing owes to the analytical simplicity for the geometrical similarity [2].
The bluntness of the indenter tip is one of the inevitable problems of undesirable tip geometry, especially for the point-sharp indentations, because it is impossible to make an ideally sharp indenter. The degree of the bluntness of a point-sharp indenter has been expressed in terms of the radius of curvature at the tip [3,4,5], but the actual geometry of a blunt tip is not guaranteed to be spherical. An area function [6,7] which gives the projected contact area at the maximum indentation load is another approach to express the bluntness of a point-sharp indenter, but the area function is theoretically valid only for hardness evaluation. A truncated tip which represents a blunt tip in an extremely poor situation [
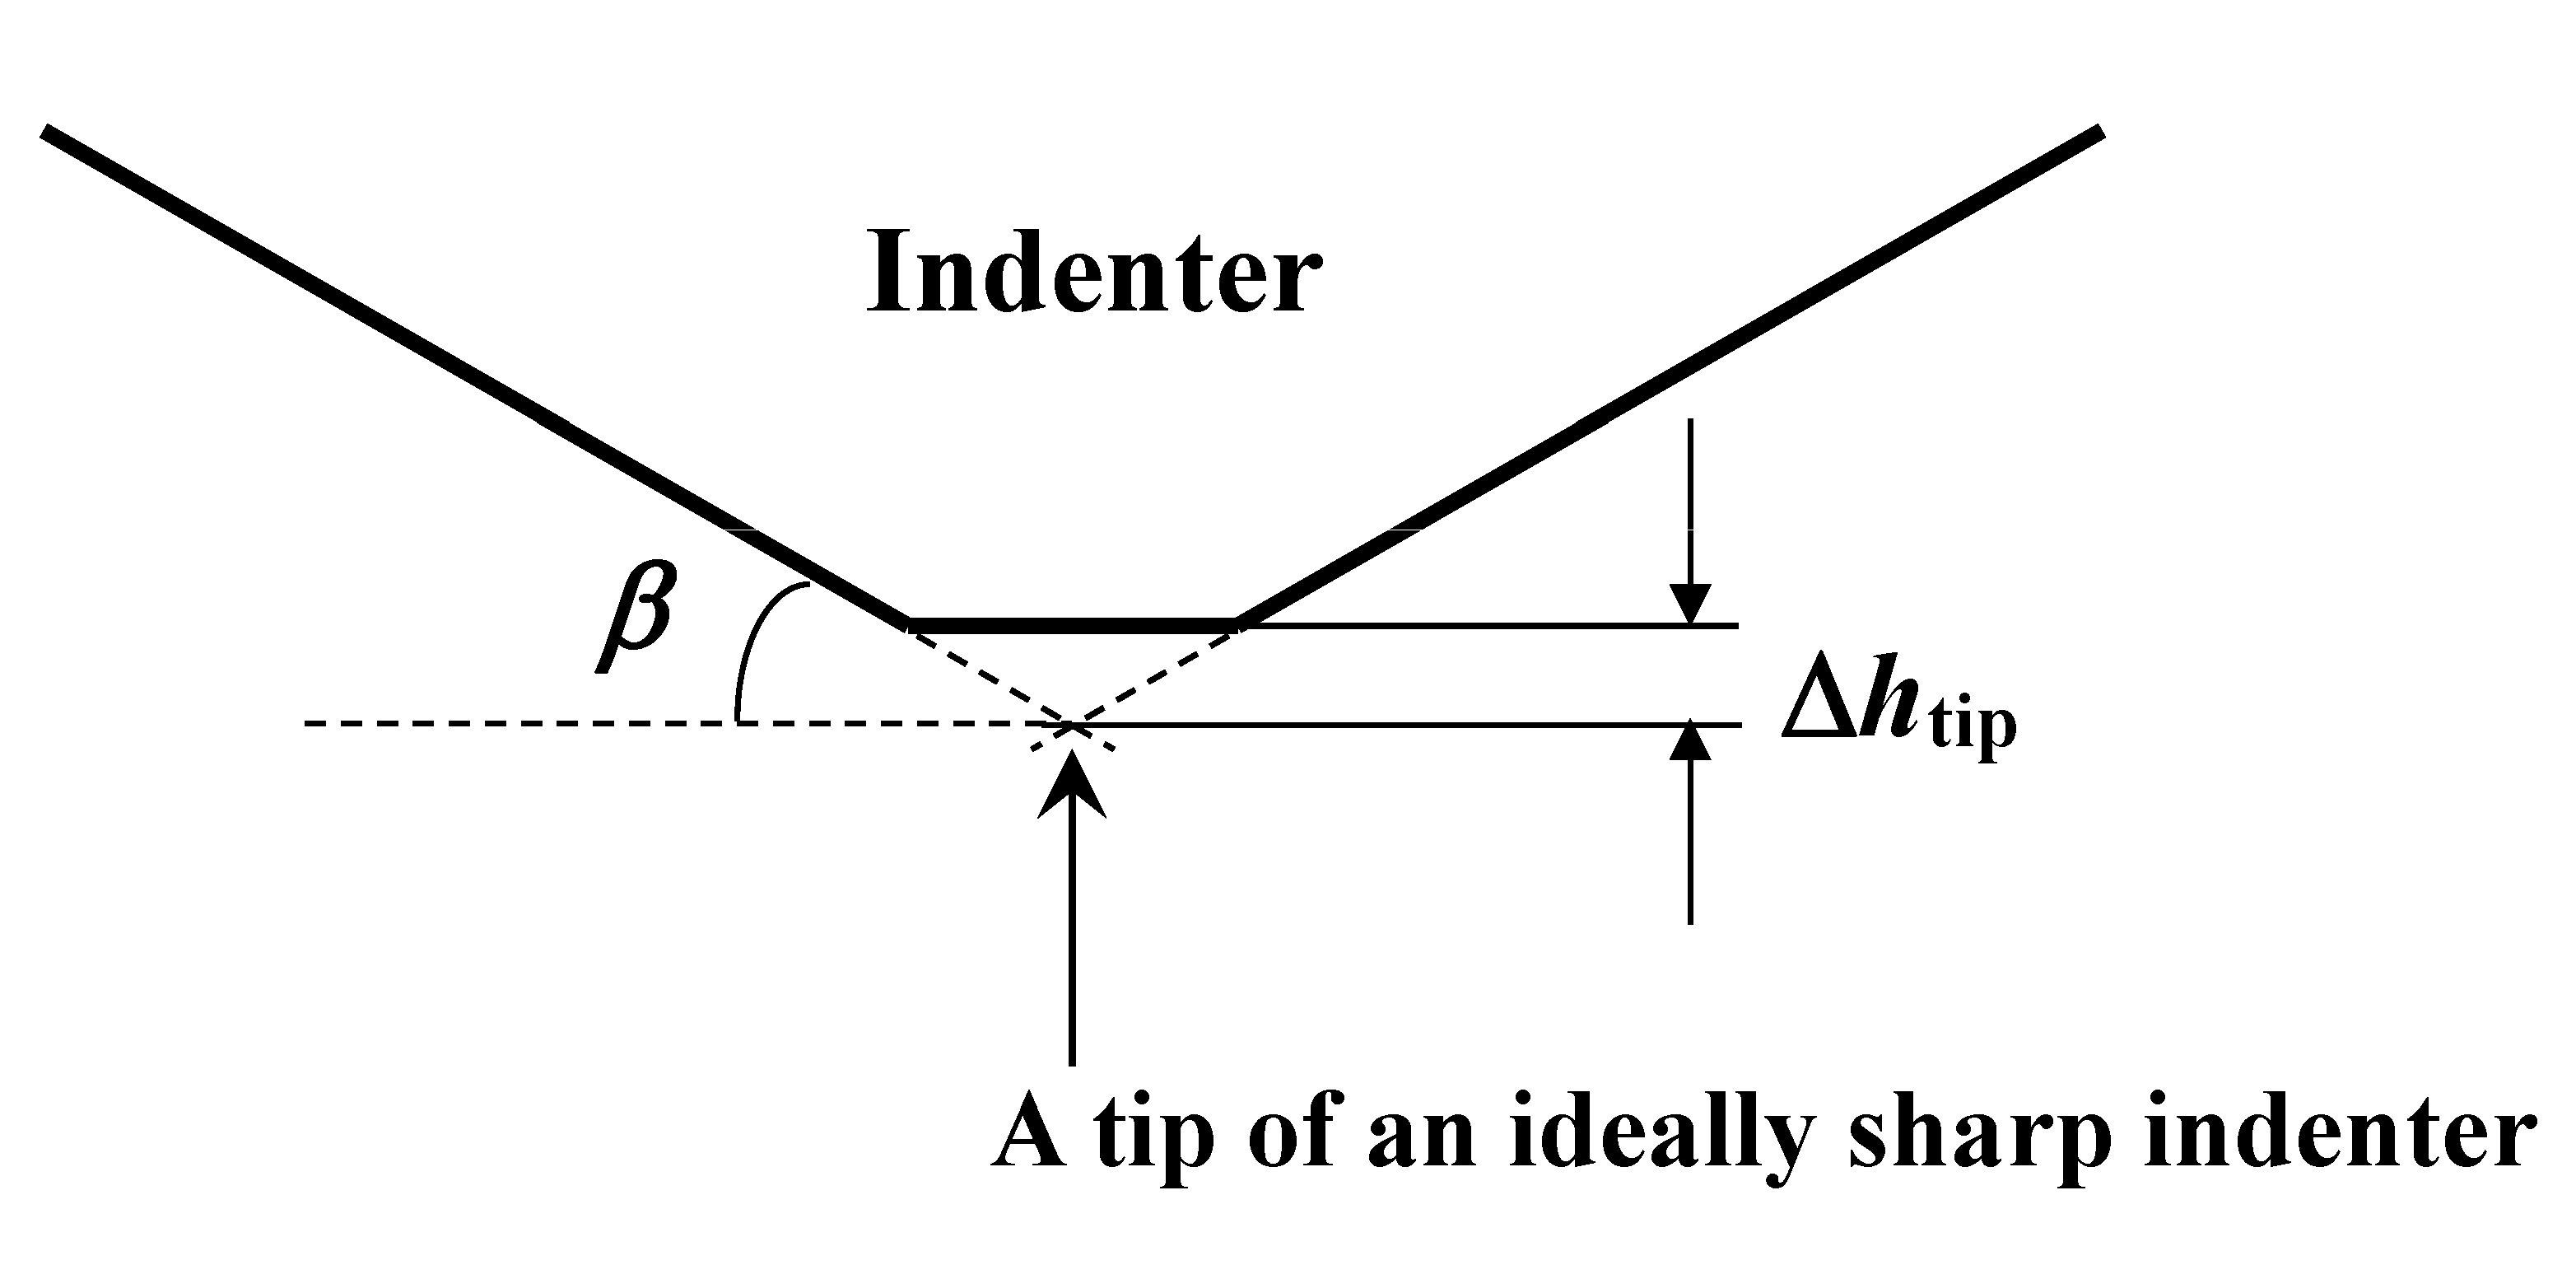
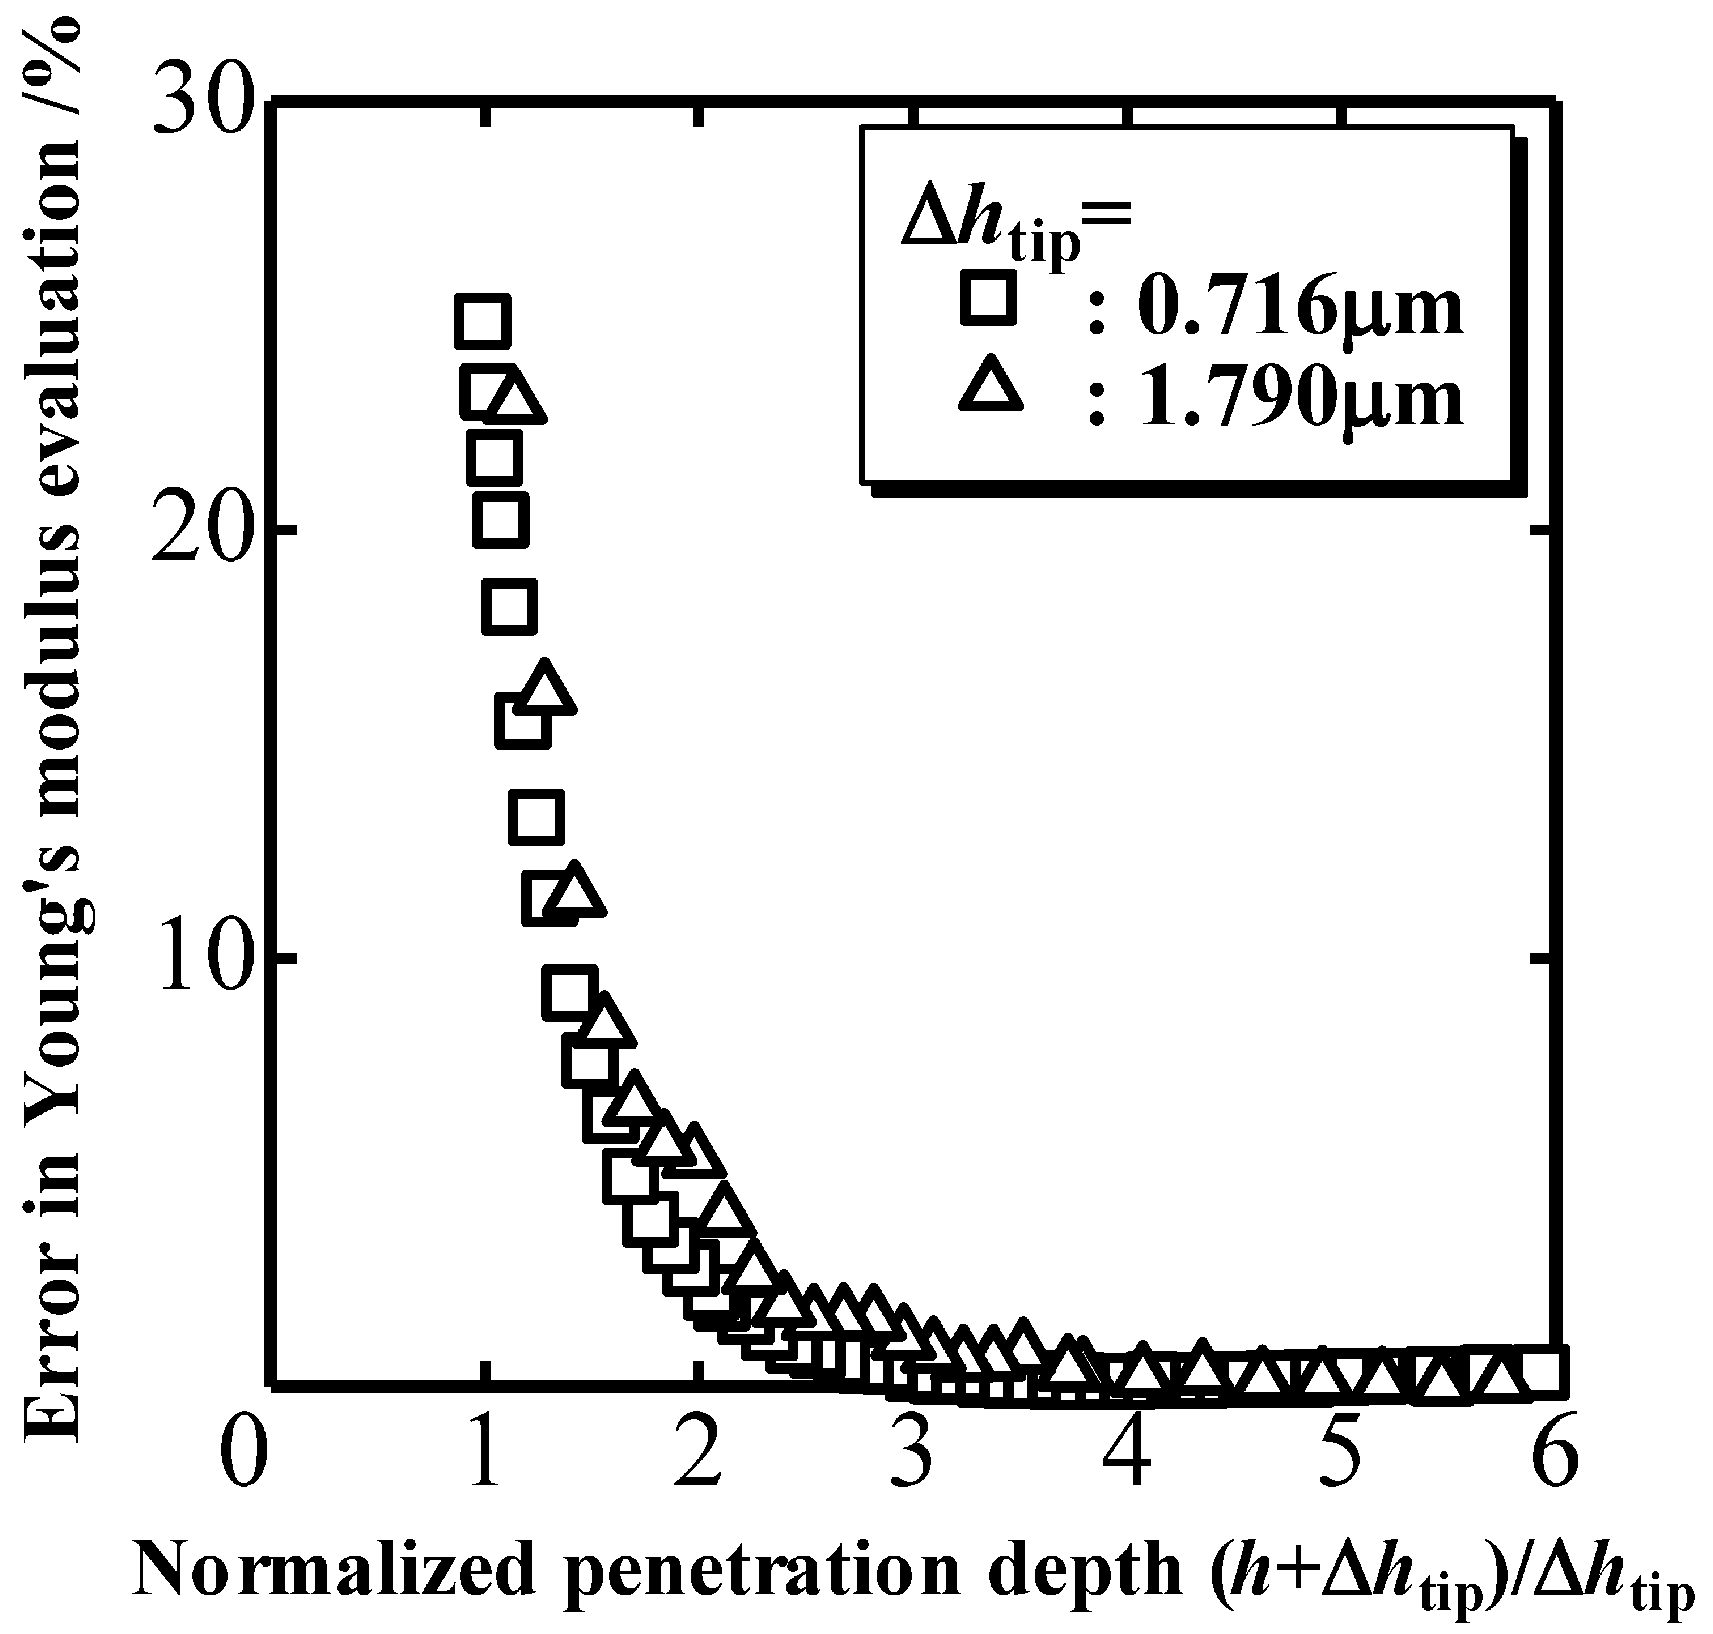
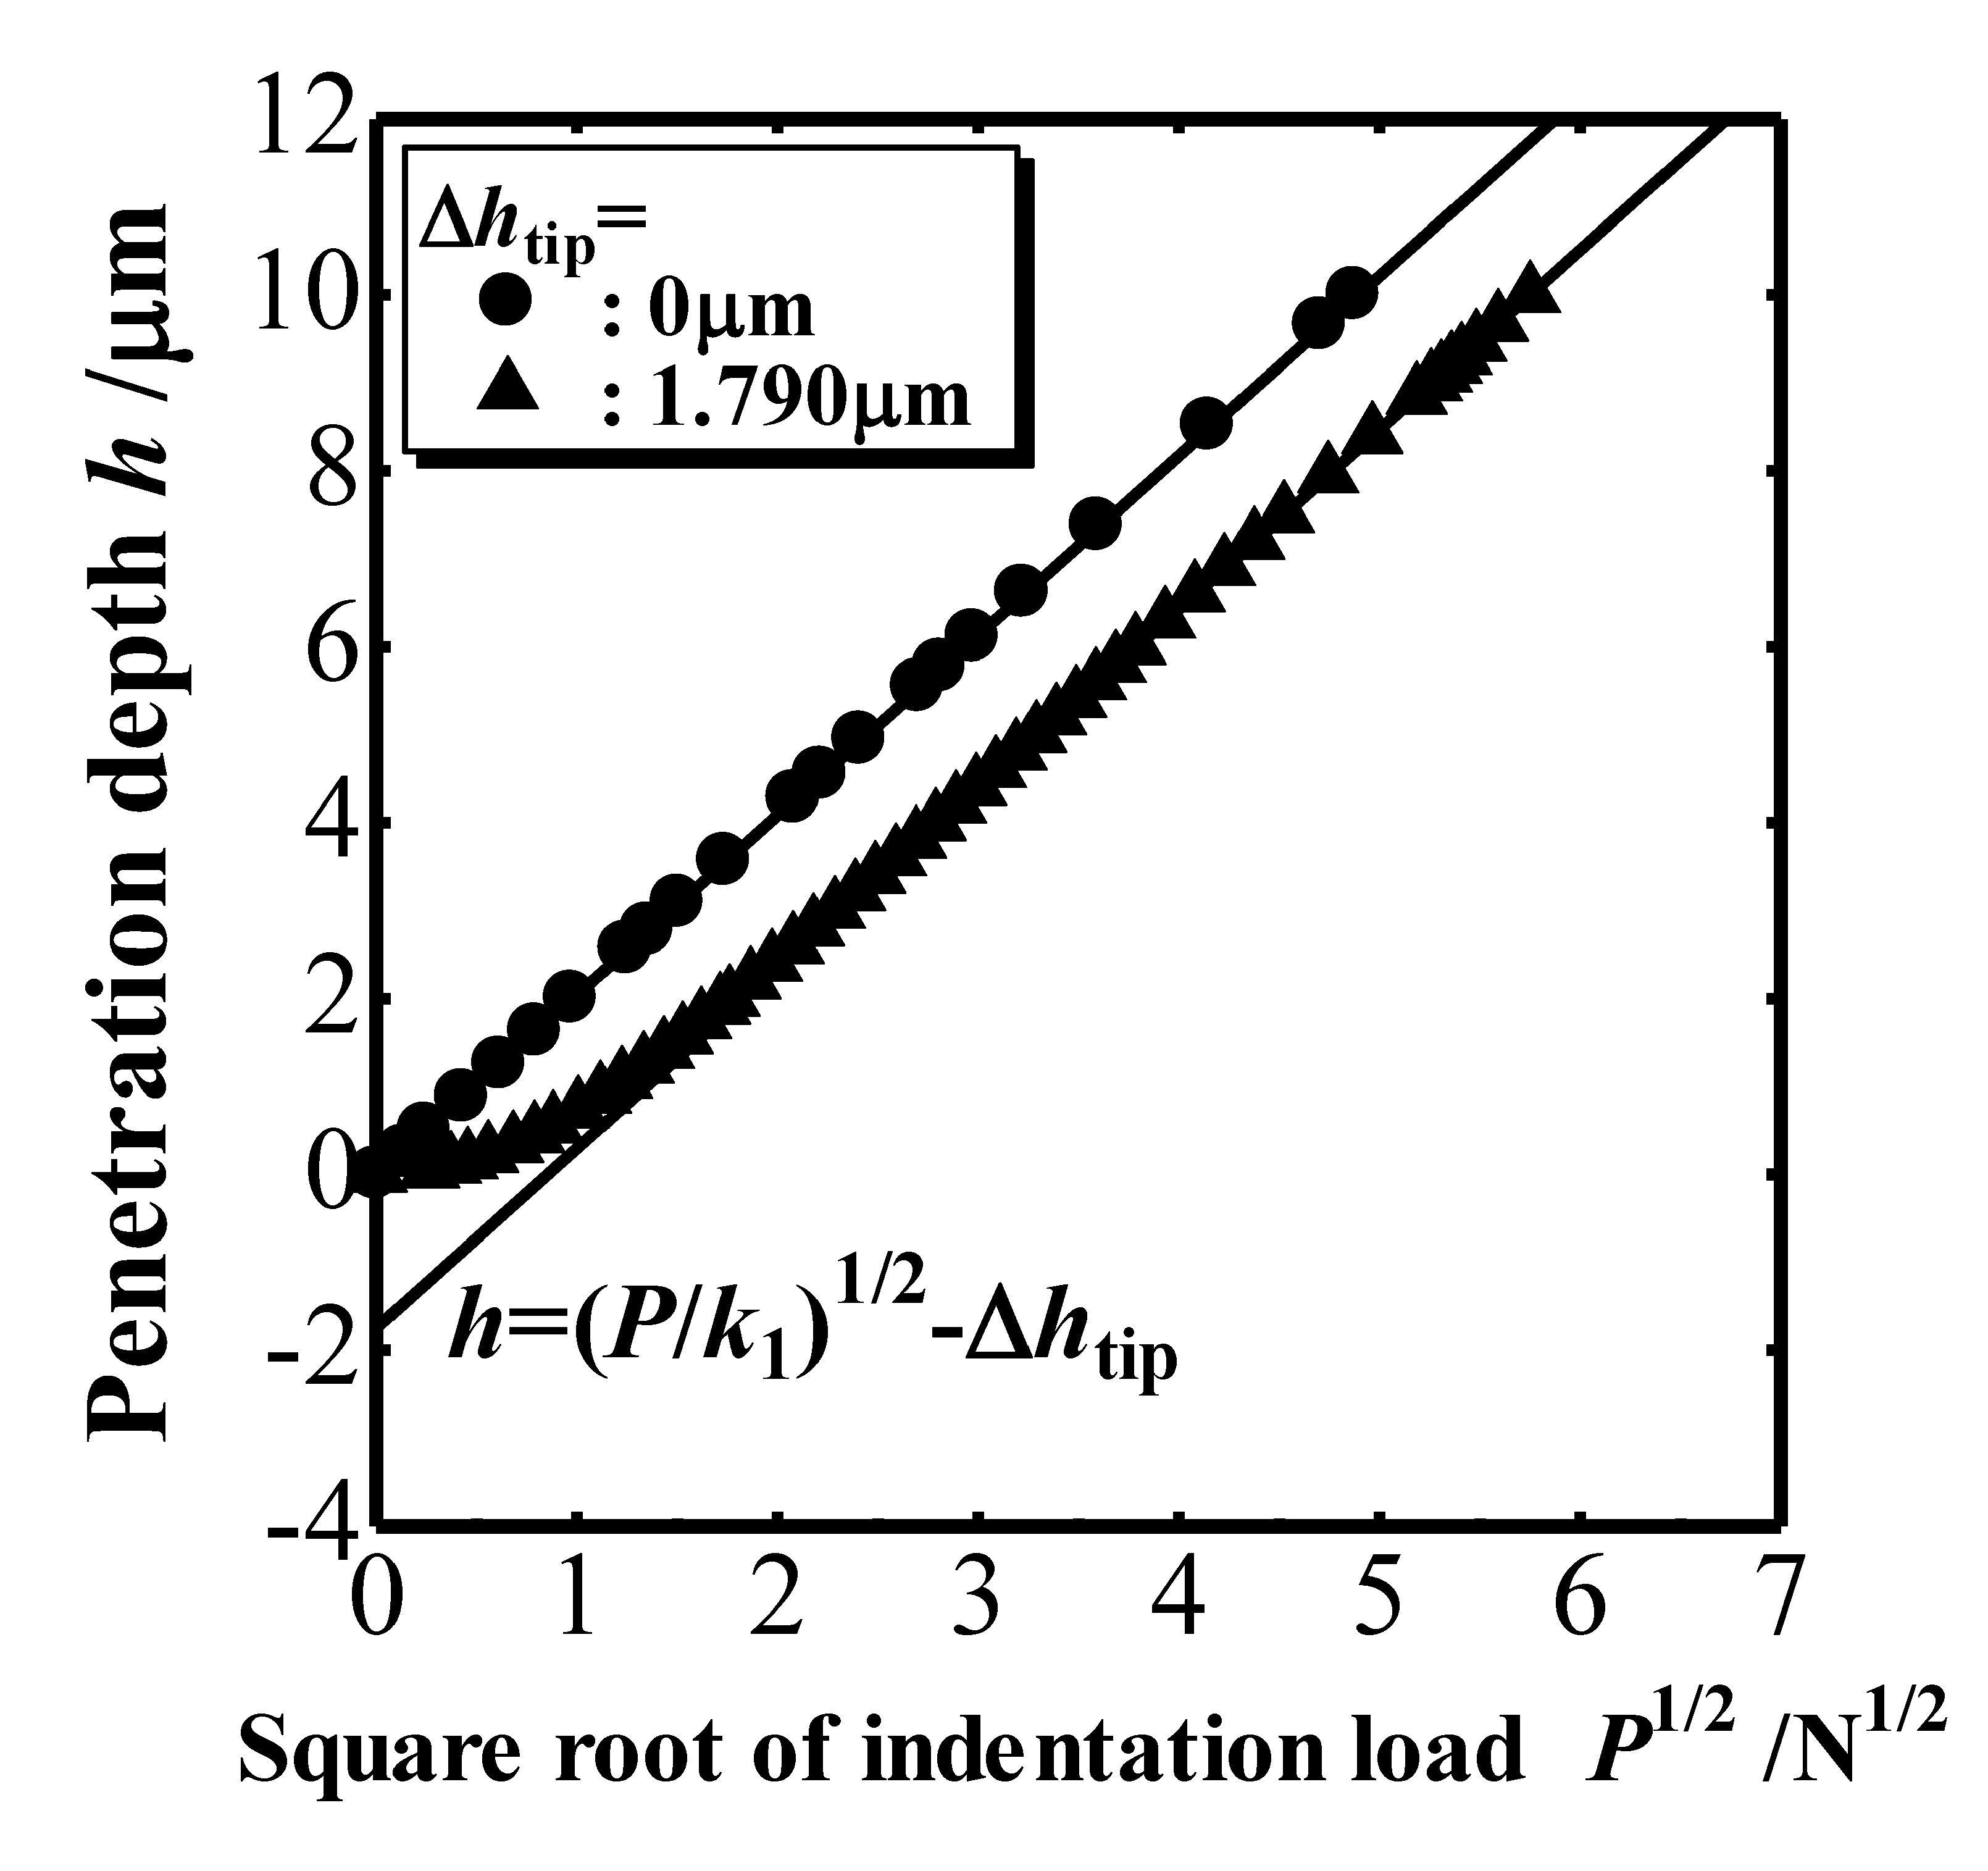
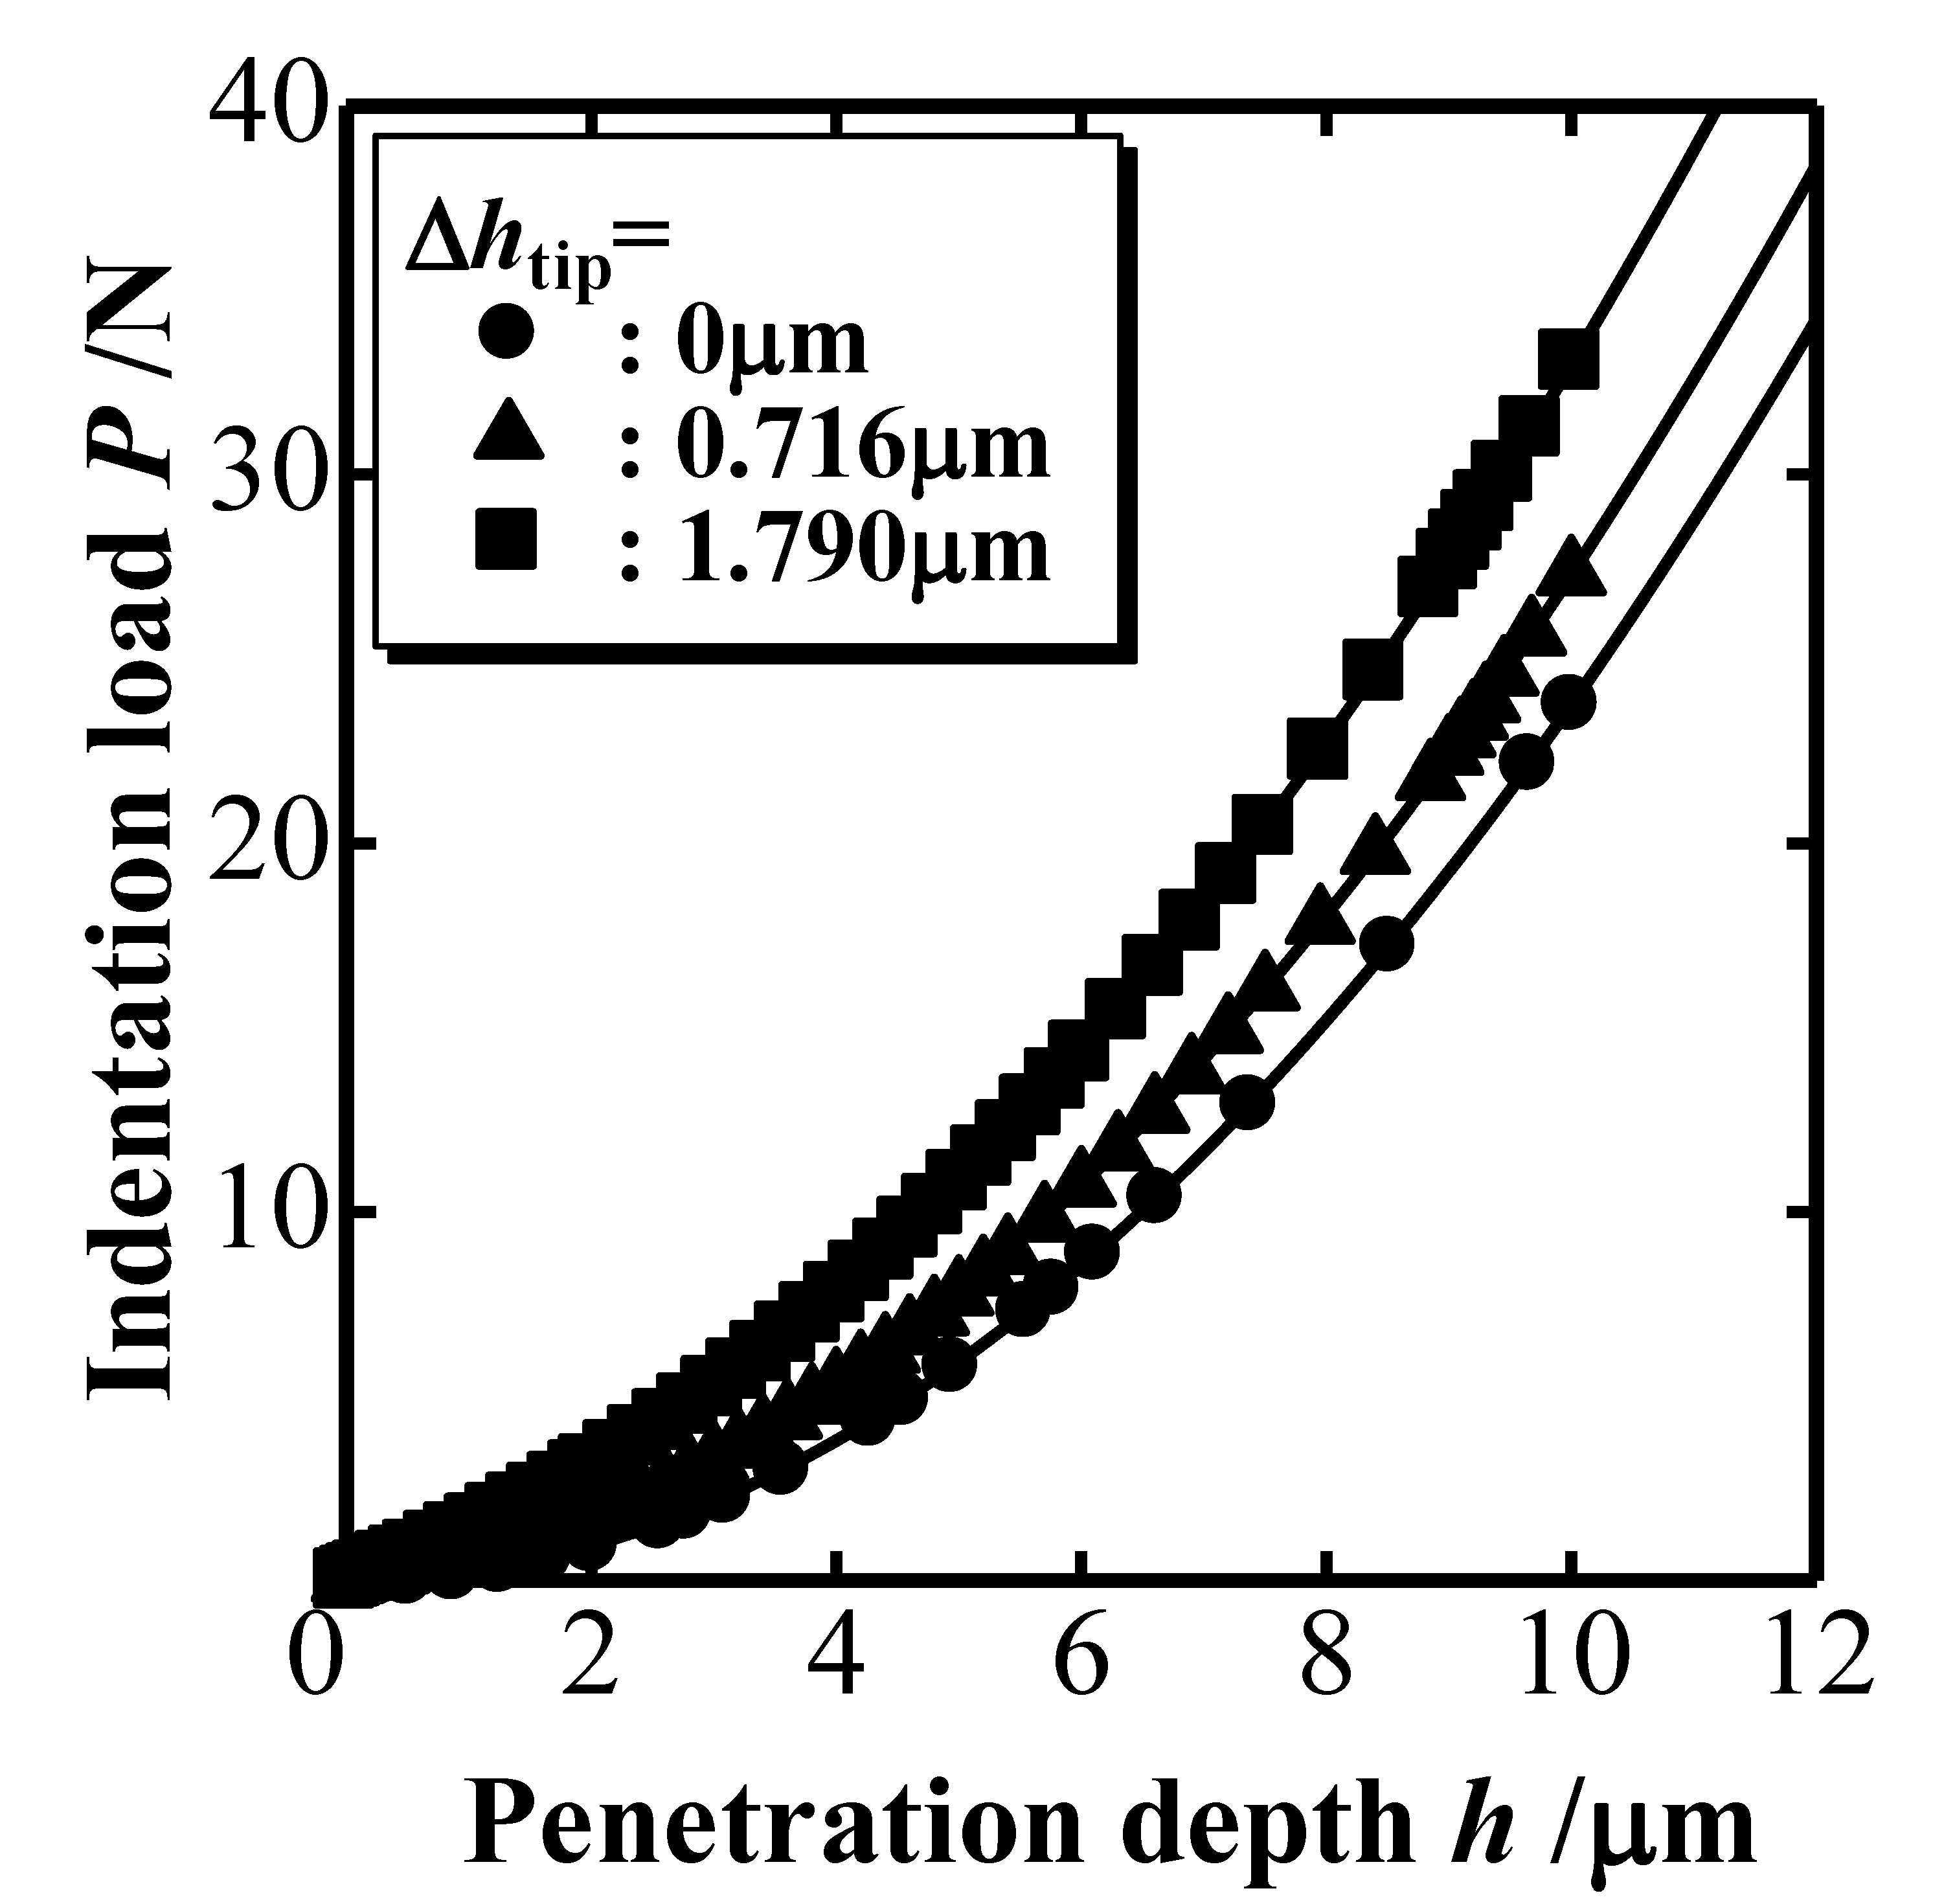
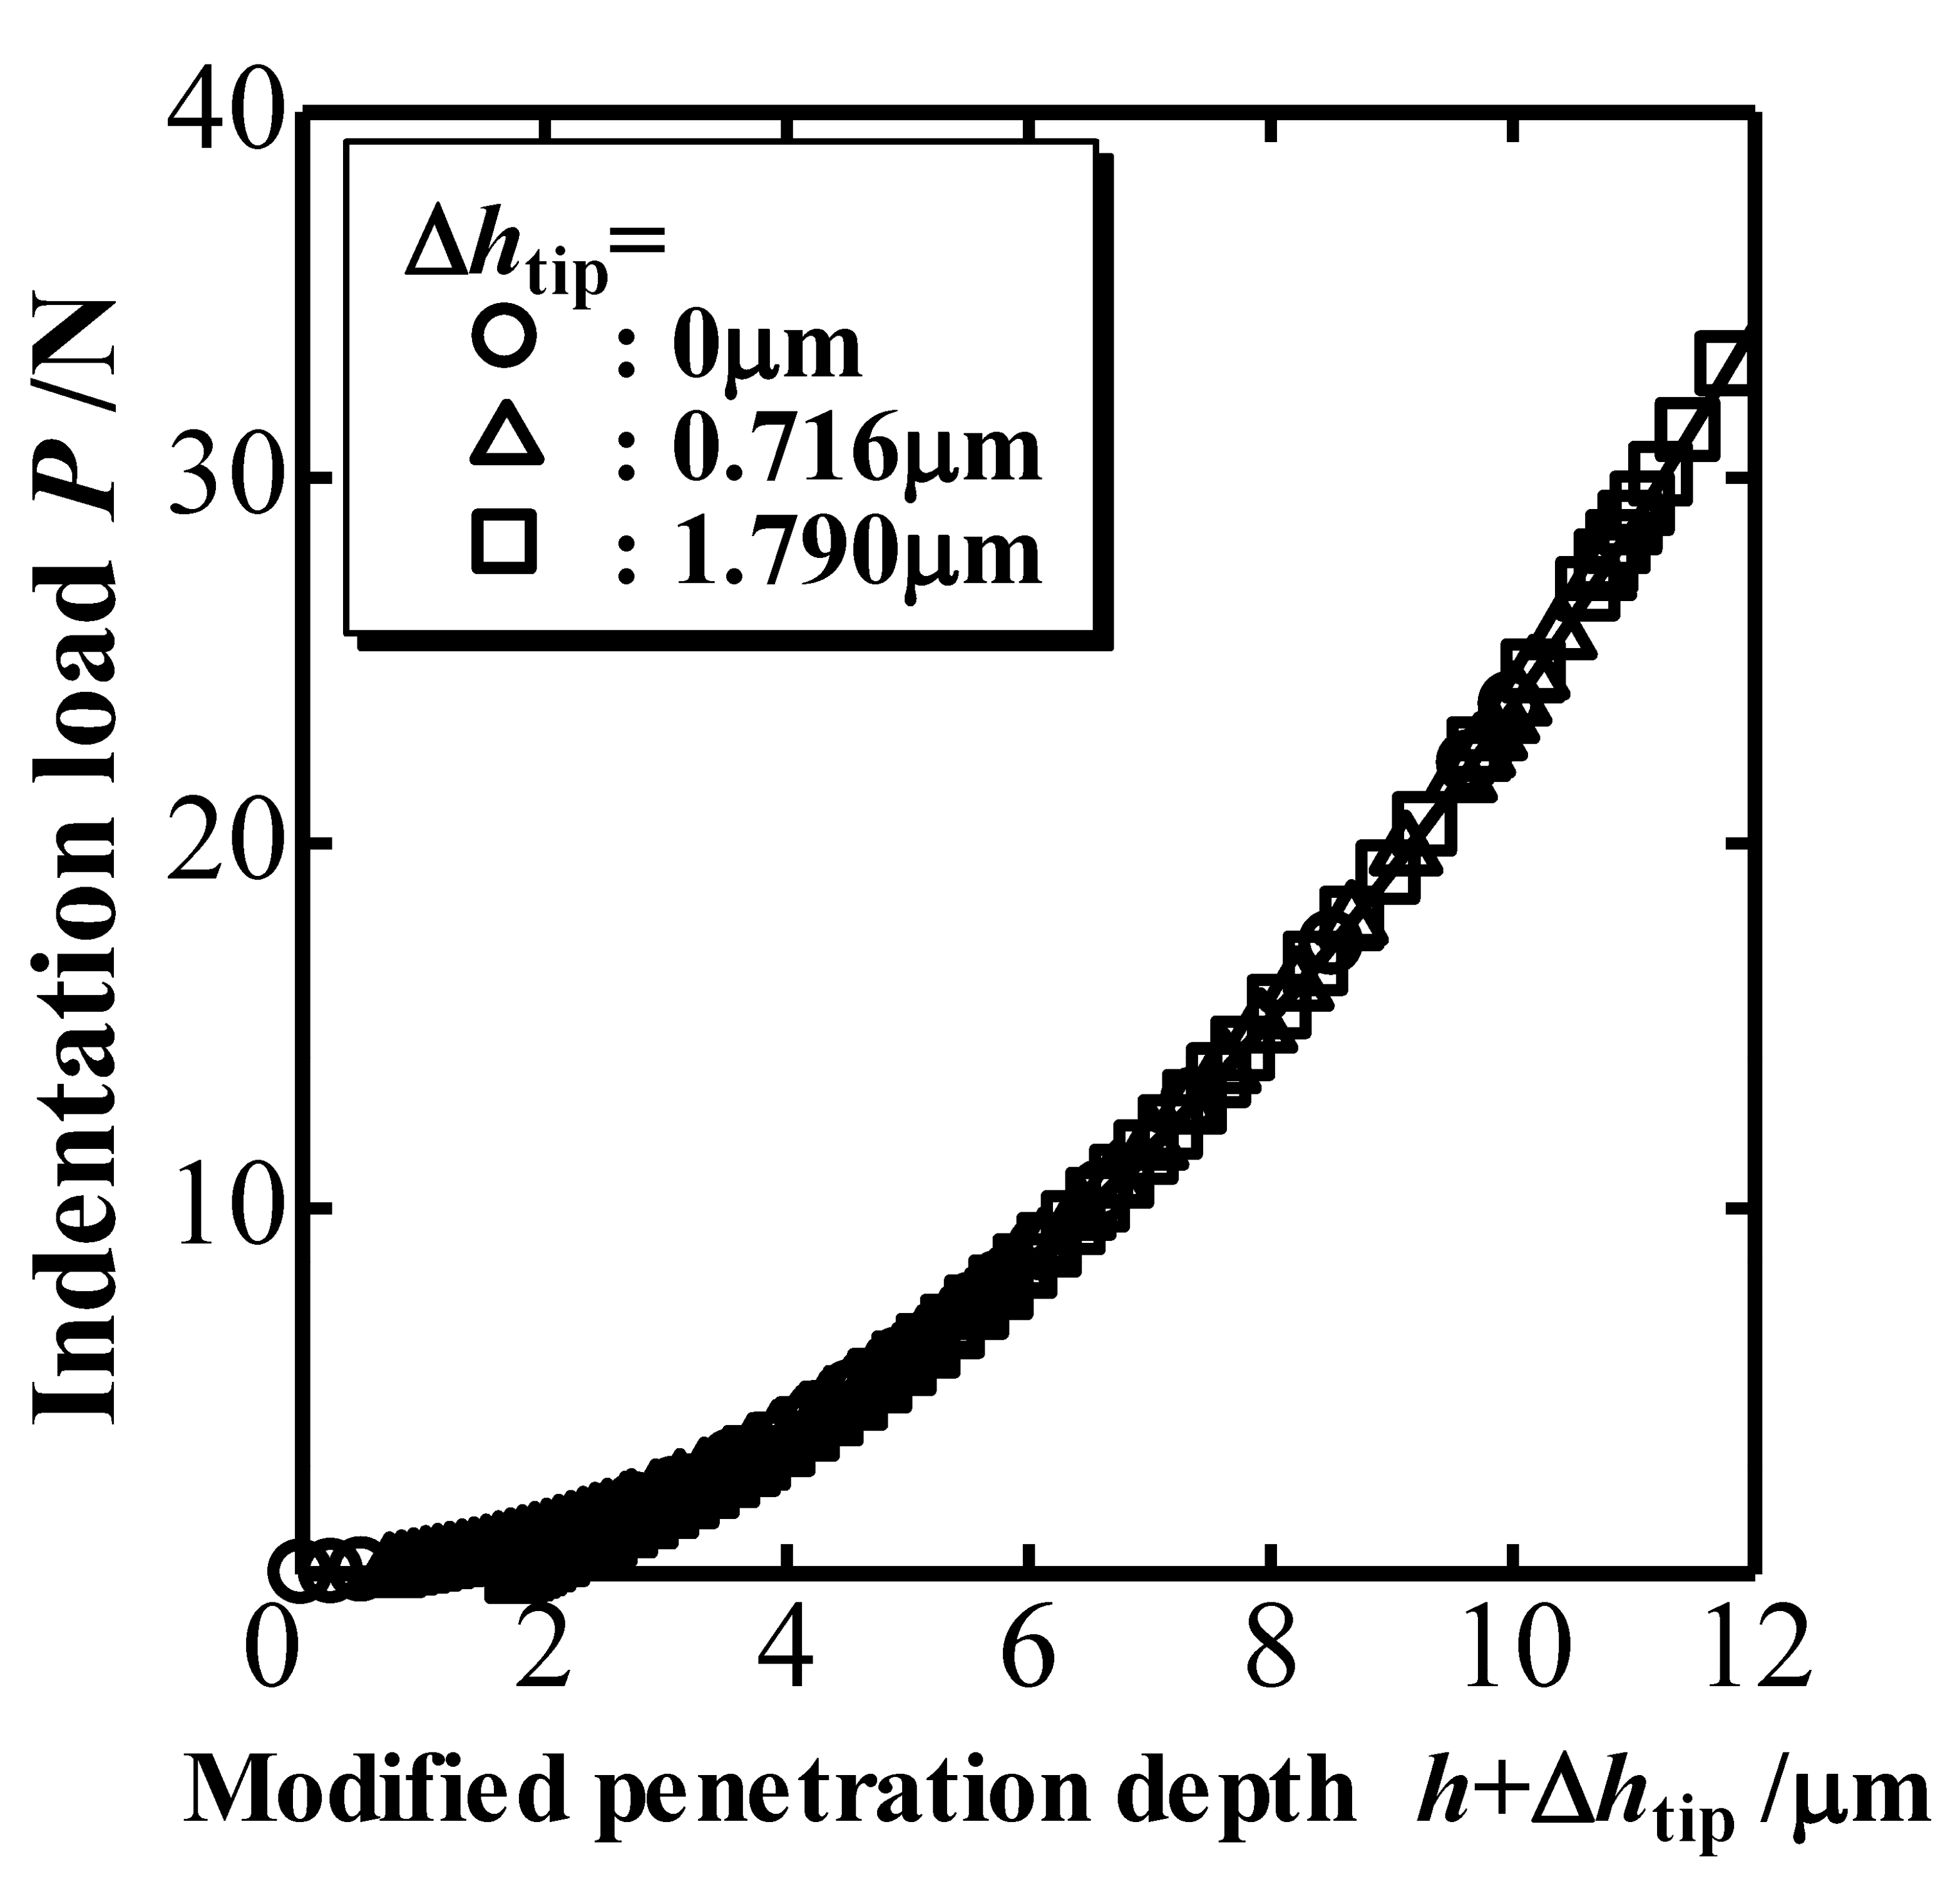
8] is a suitable model for a strict discussion on the effect of the tip bluntness on indentation behavior. According to the appendix of this paper, where a truncated tip is considered, the undesirable effect of the bluntness of a point-sharp indenter can be removed out simply if the P-h curve is shifted with Δhtip in the h direction for indentations deeper than 2Δhtip, where Δhtip is the distance between ideally sharp and blunt tips (see Figure A1, Figure A2, Figure A3 and Figure A4). In addition, Δhtip can be estimated through an extrapolation of the linear relationship between h and P*** observed in the large P and h region to P = 0 (see Figure A5).
The elastic deformation of an actual point-sharp indenter, which has been conventionally taken into account on the basis of Hertzian contact [6]; Hertzian contact was basically used for spherical indentations as a modification of the elastic modulus evaluation. It is also an inevitable problem of undesirable tip geometry, especially for indentations on a very hard material, and there is still some controversy whether the modification based on the Hertzian contact can be applied to point-sharp indentations. Moreover, there are no reports on the modifications of the indenter elastic deformation for other mechanical properties such as the indentation hardness or yield stress. The geometrical changes of a point-sharp indenter due to elastic deformation should be considered when evaluating local mechanical properties with the nanoindentation technique.
In this paper, the effect of the elastic deformation of a point-sharp indenter on a P-h curve is quantified in a numerical analysis of conical nanoindentation behaviors simulated with the finite element method (FEM). In addition, a procedure of deriving physically meaningful P-h curves, which should be utilized for mechanical property evaluation. Finally, the validity and accuracy of this method is examined.

2. FEM Simulation of Nanoindentation

A conical indentation on a cylindrical elastoplastic solid was modeled in order to avoid the difficulty of modeling a pyramidal indenter widely used for actual nanoindentations. The FEM simulation exploited the large strain elastoplastic capability of ABAQUS code (Version 5.8.1) in the same way as reported in the literature [9,10]. Indentation contact was simulated by the use of elastic cone indenters with two different inclined face angles β (19.7° and 30°). Young’s modulus of the elastic indenter was in the range of 300–1140 GPa. The finite-element mesh in the elastic indenter with β of 19.7° was composed of 775 4-node quadrilateral axisymmetric elements with 2443 nodes. The elastic indenter with β of 30° had 704 elements with 2258 nodes.
The FEM simulation used elastoplastic linear strain hardening rules, i.e., σ = E ε for σ < Y , and σ = Y + E p ε p for σ Y , where σ is the stress, E the Young’s modulus and ε the strain. Here, Y is the yield stress and Ep ( d σ / d ε p ) is the plastic strain hardening modulus, where , , e, and p are, respectively, the incremental values of stress, total, elastic, and plastic strains. Indentations were simulated for E, Y and Ep ranges of 50–1000 GPa, 0.1–60 GPa, and 0–200 GPa, respectively. The von Mises criterion with isotropic hardening was used to determine the onset of yielding flow.

3. Results and Discussion

A quadratic relationship between P and h on loading is theoretically guaranteed for a point-sharp indentation on the flat surface of a homogeneous elastoplastic solid [11,12]. The quadratic relationship was also observed in simulated P-h curves made with an elastic cone indenter. This indicates that the elastic deformation of a cone indenter can be described as a decrease in β determined regardless of h. Therefore, nominal indentations made with an elastic cone indenter with an original inclined face angle βo should be physically equivalent to indentations made with a rigid cone indenter with the decreased inclined face angle βd.
A nominal quadratic P-h relationship for an elastic cone indenter can be depicted as follows:
P = k 1 n h 2  for loading ,
where k1n is the nominal indentation loading parameter. Here, h in Equation (1) is the nominal penetration depth because the decrease in β from βo to 
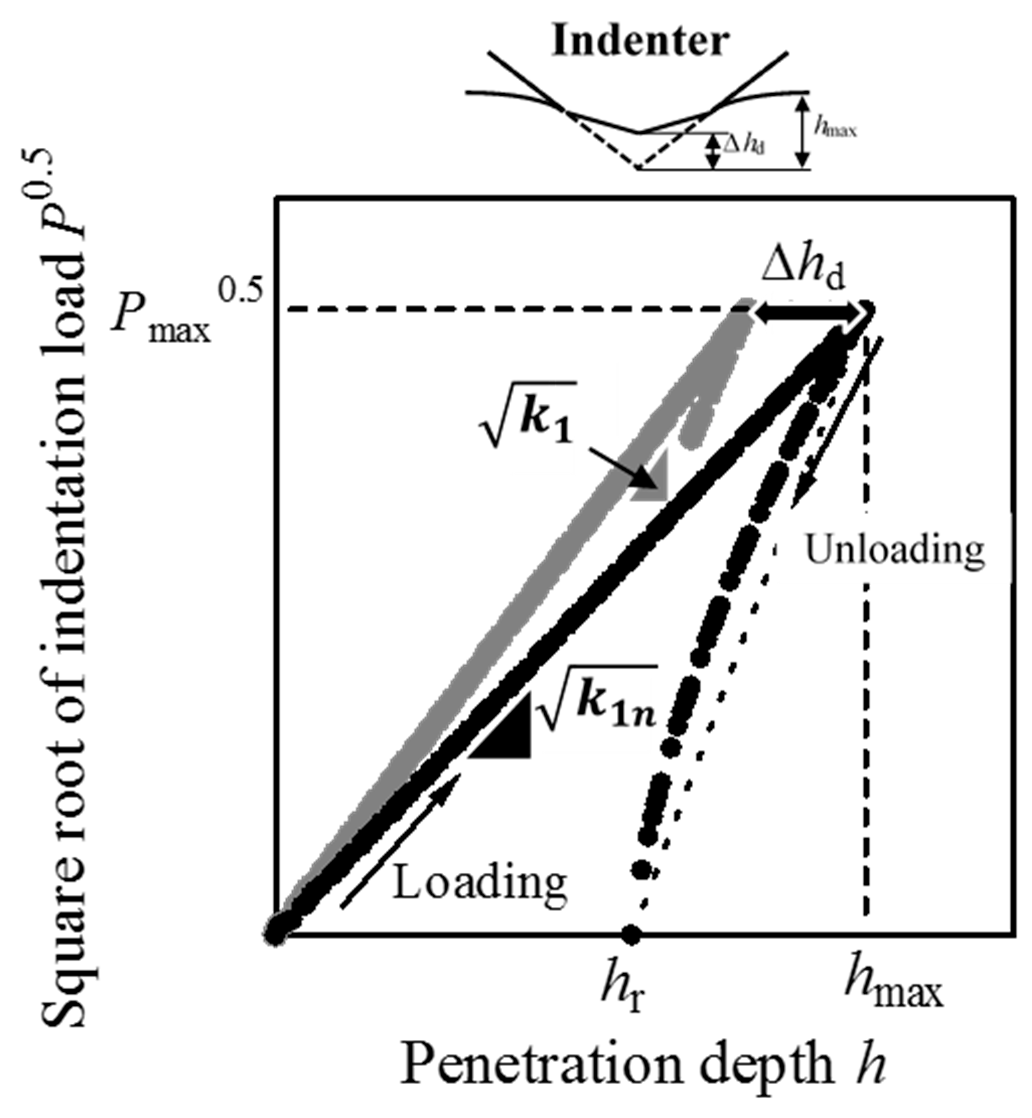
βd, due to the elastic deformation of a cone indenter, gives a decrease in real penetration depth. Thus, a physically meaningful P-h relationship can be written with a true indentation loading parameter k1, which should be observed in a P-h loading curve using a rigid cone indenter with βd as
P max = k 1 ( h max Δ h d ) 2 ,
where Δhd is the decrease in h at the maximum penetration depth hmax due to the elastic deformation of a cone indenter (see Figure 1). The combination of Equations (1) and (2) leads to the equation:
k 1 = k 1 n ( 1 Δ h d h max ) 2 .
This means that Δhd/hmax is a key parameter to estimating k1 from the nominal k1n. In other words, Δhd/hmax can be simulated as
Δ h d h max = 1 k 1 n k 1 ,
where k1n in Equation (3’) is observed in a simulated P-h loading curve with an elastic cone indenter and k1 in Equation (3’) is evaluated with the mechanical properties inputted into the FEM model [9,10]. In the following paragraph, the effect of Δhd/hmax on a P-h curve is examined quantitatively through numerical analysis.
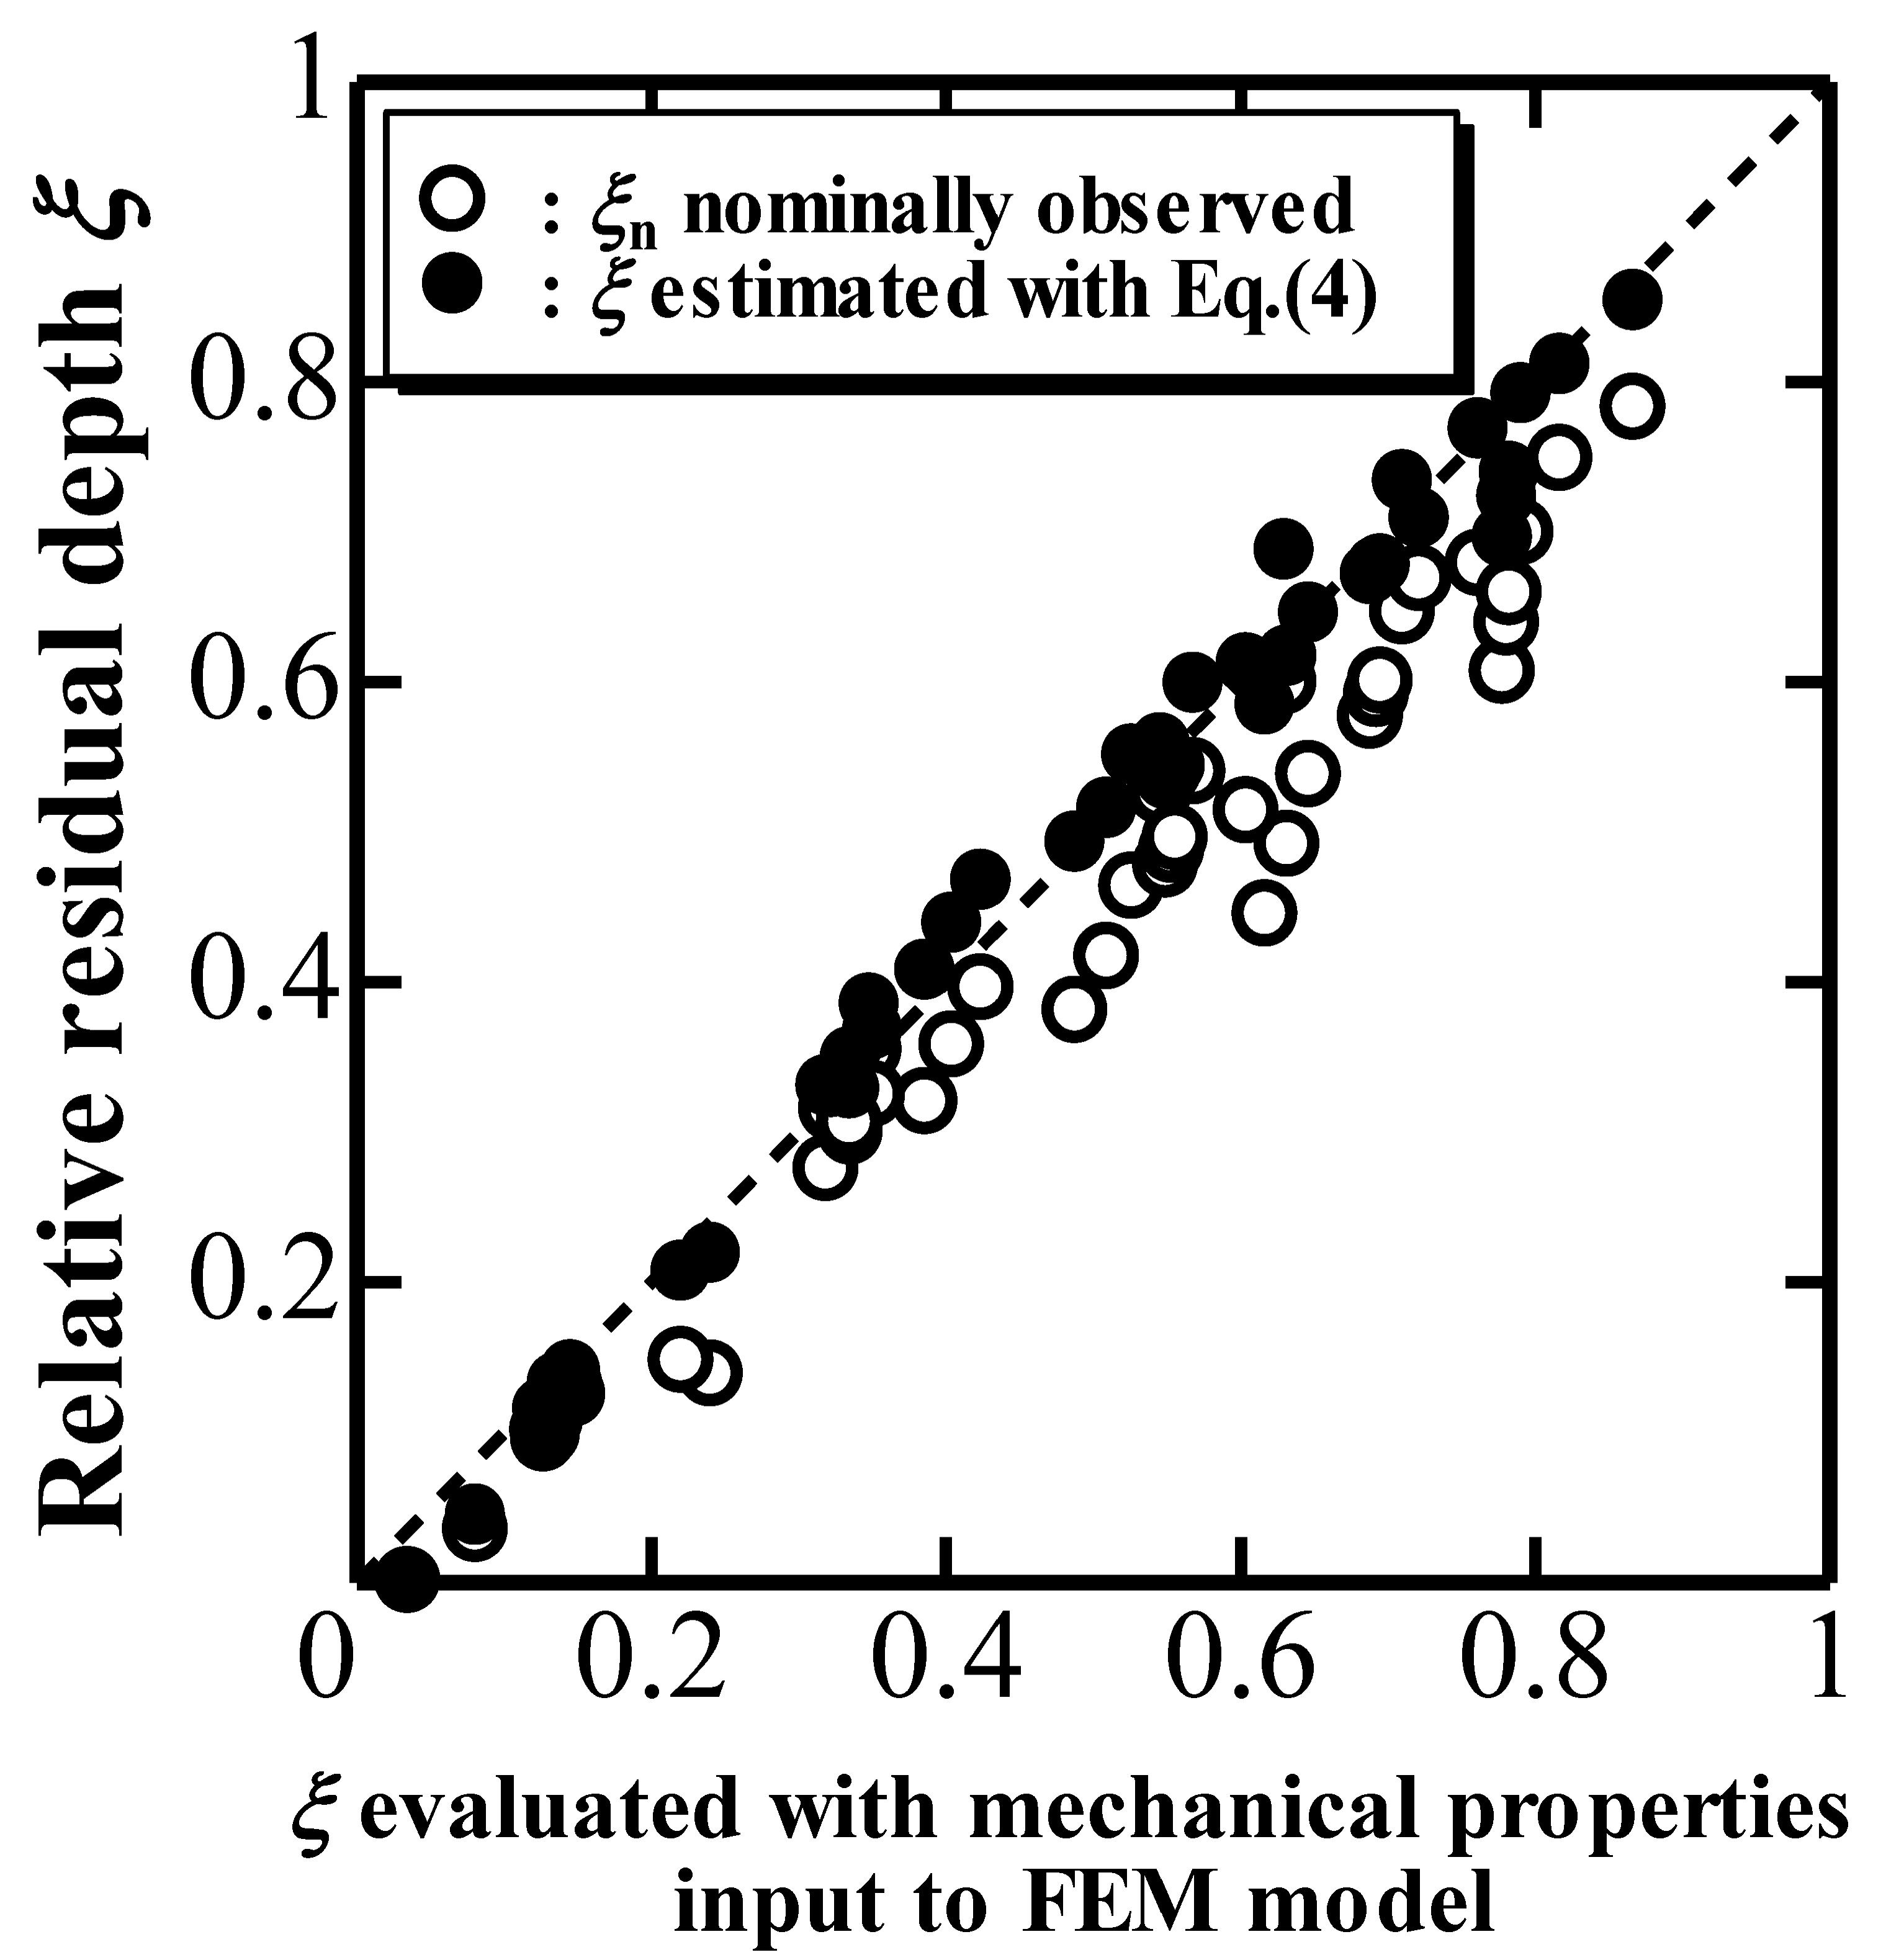
In addition to k1, the relative residual penetration depth ξ, defined as hr/hmax, where hr is the residual penetration depth, characterizes a P-h curve and nominally decreased by the elastic deformation of a cone indenter to be ξn. A true ξ-value, which should be observed in a P-h curve using a rigid cone indenter with βd, can also be evaluated with the mechanical properties inputted into the FEM model [9,10]. The numerical analysis revealed that the evaluated ξ can be correlated with the nominal ξn as a function of Δhd/hmax
ξ = ξ n { 1 ( Δ h d h max ) 0.85 } 0.50 .
Figure 2 plots ξ estimated with Equation (4) and ξn against the true ξ evaluated with the mechanical properties inputted into the FEM model [9,10]. The results indicate the validity of using Equation (4) to estimate ξ from the nominal ξn and Δhd/hmax. In addition, it is confirmed that ξn is smaller than ξ because of the overestimation of the penetration depth h due to the elastic deformation of the indenter. Moreover, a true indentation unloading parameter k2 defined as Pmax/(hmaxhr)*, which should be observed in an P-h unloading curve using a rigid cone indenter with βd, can be estimated from a simulated P-h curve with an elastic cone indenter characterized by k1n and ξn using Equations (3) and (4) as
k 2 = k 1 ( 1 ξ ) 2 = k 1 n ( 1 Δ h d h max ) 2 [ 1 ξ n { 1 ( Δ h d h max ) 0.85 } 0.50 ] 2 .
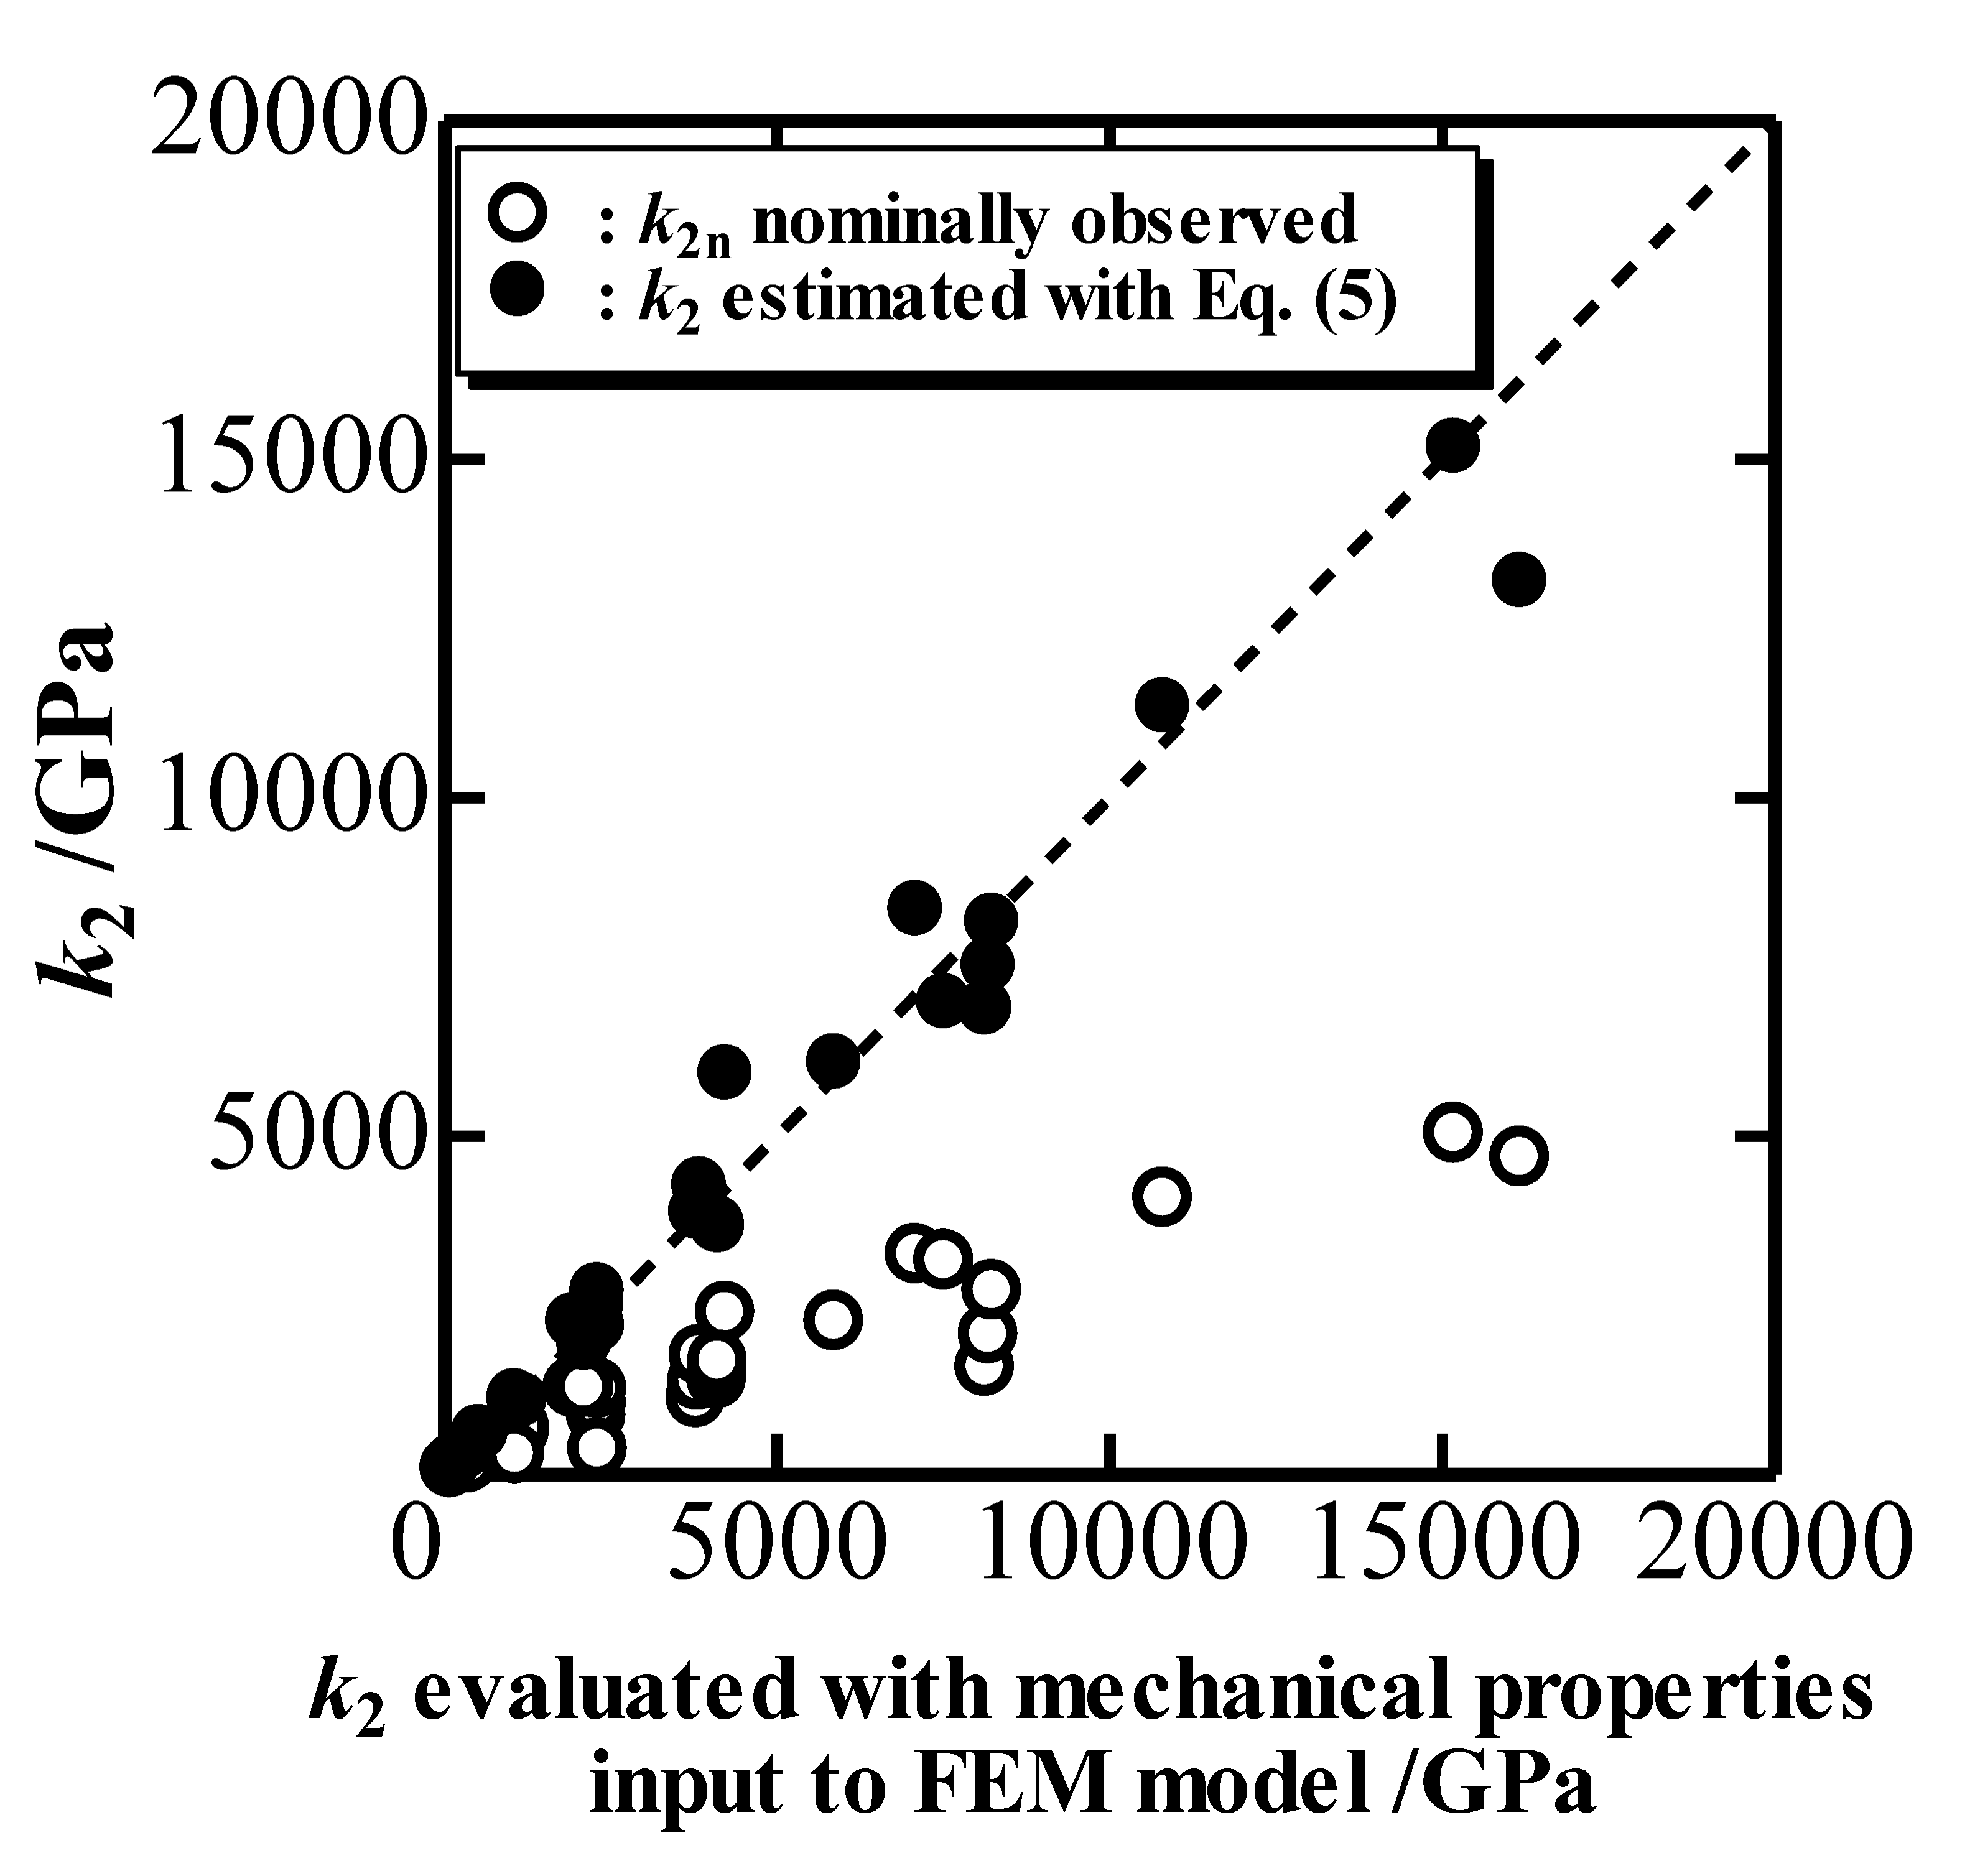
Figure 3 plots the estimated k2 with Equation (5) as well as the nominal indentation unloading parameter k2n determined from a simulated P-h curve with an elastic cone indenter against the true k2 evaluated with the mechanical properties inputted into the FEM model [9,10]. Figure 3 indicates that k2 can be estimated correctly by using Equation (5) with Δhd/hmax, and that the nominal k2n is quite far from k2 owing to the overestimation of h.
The numerical analysis also revealed that Δhd/hmax is determined to be
Δ h d h max = 0.616 { k 1 n E i ( 1 + ξ n 1.5 ) } 0.84 ,
where Ei′ is defined as Ei/(1 − νi*) and Ei and νi are Young’s modulus and Poisson’s ratio of an elastic indenter, respectively.
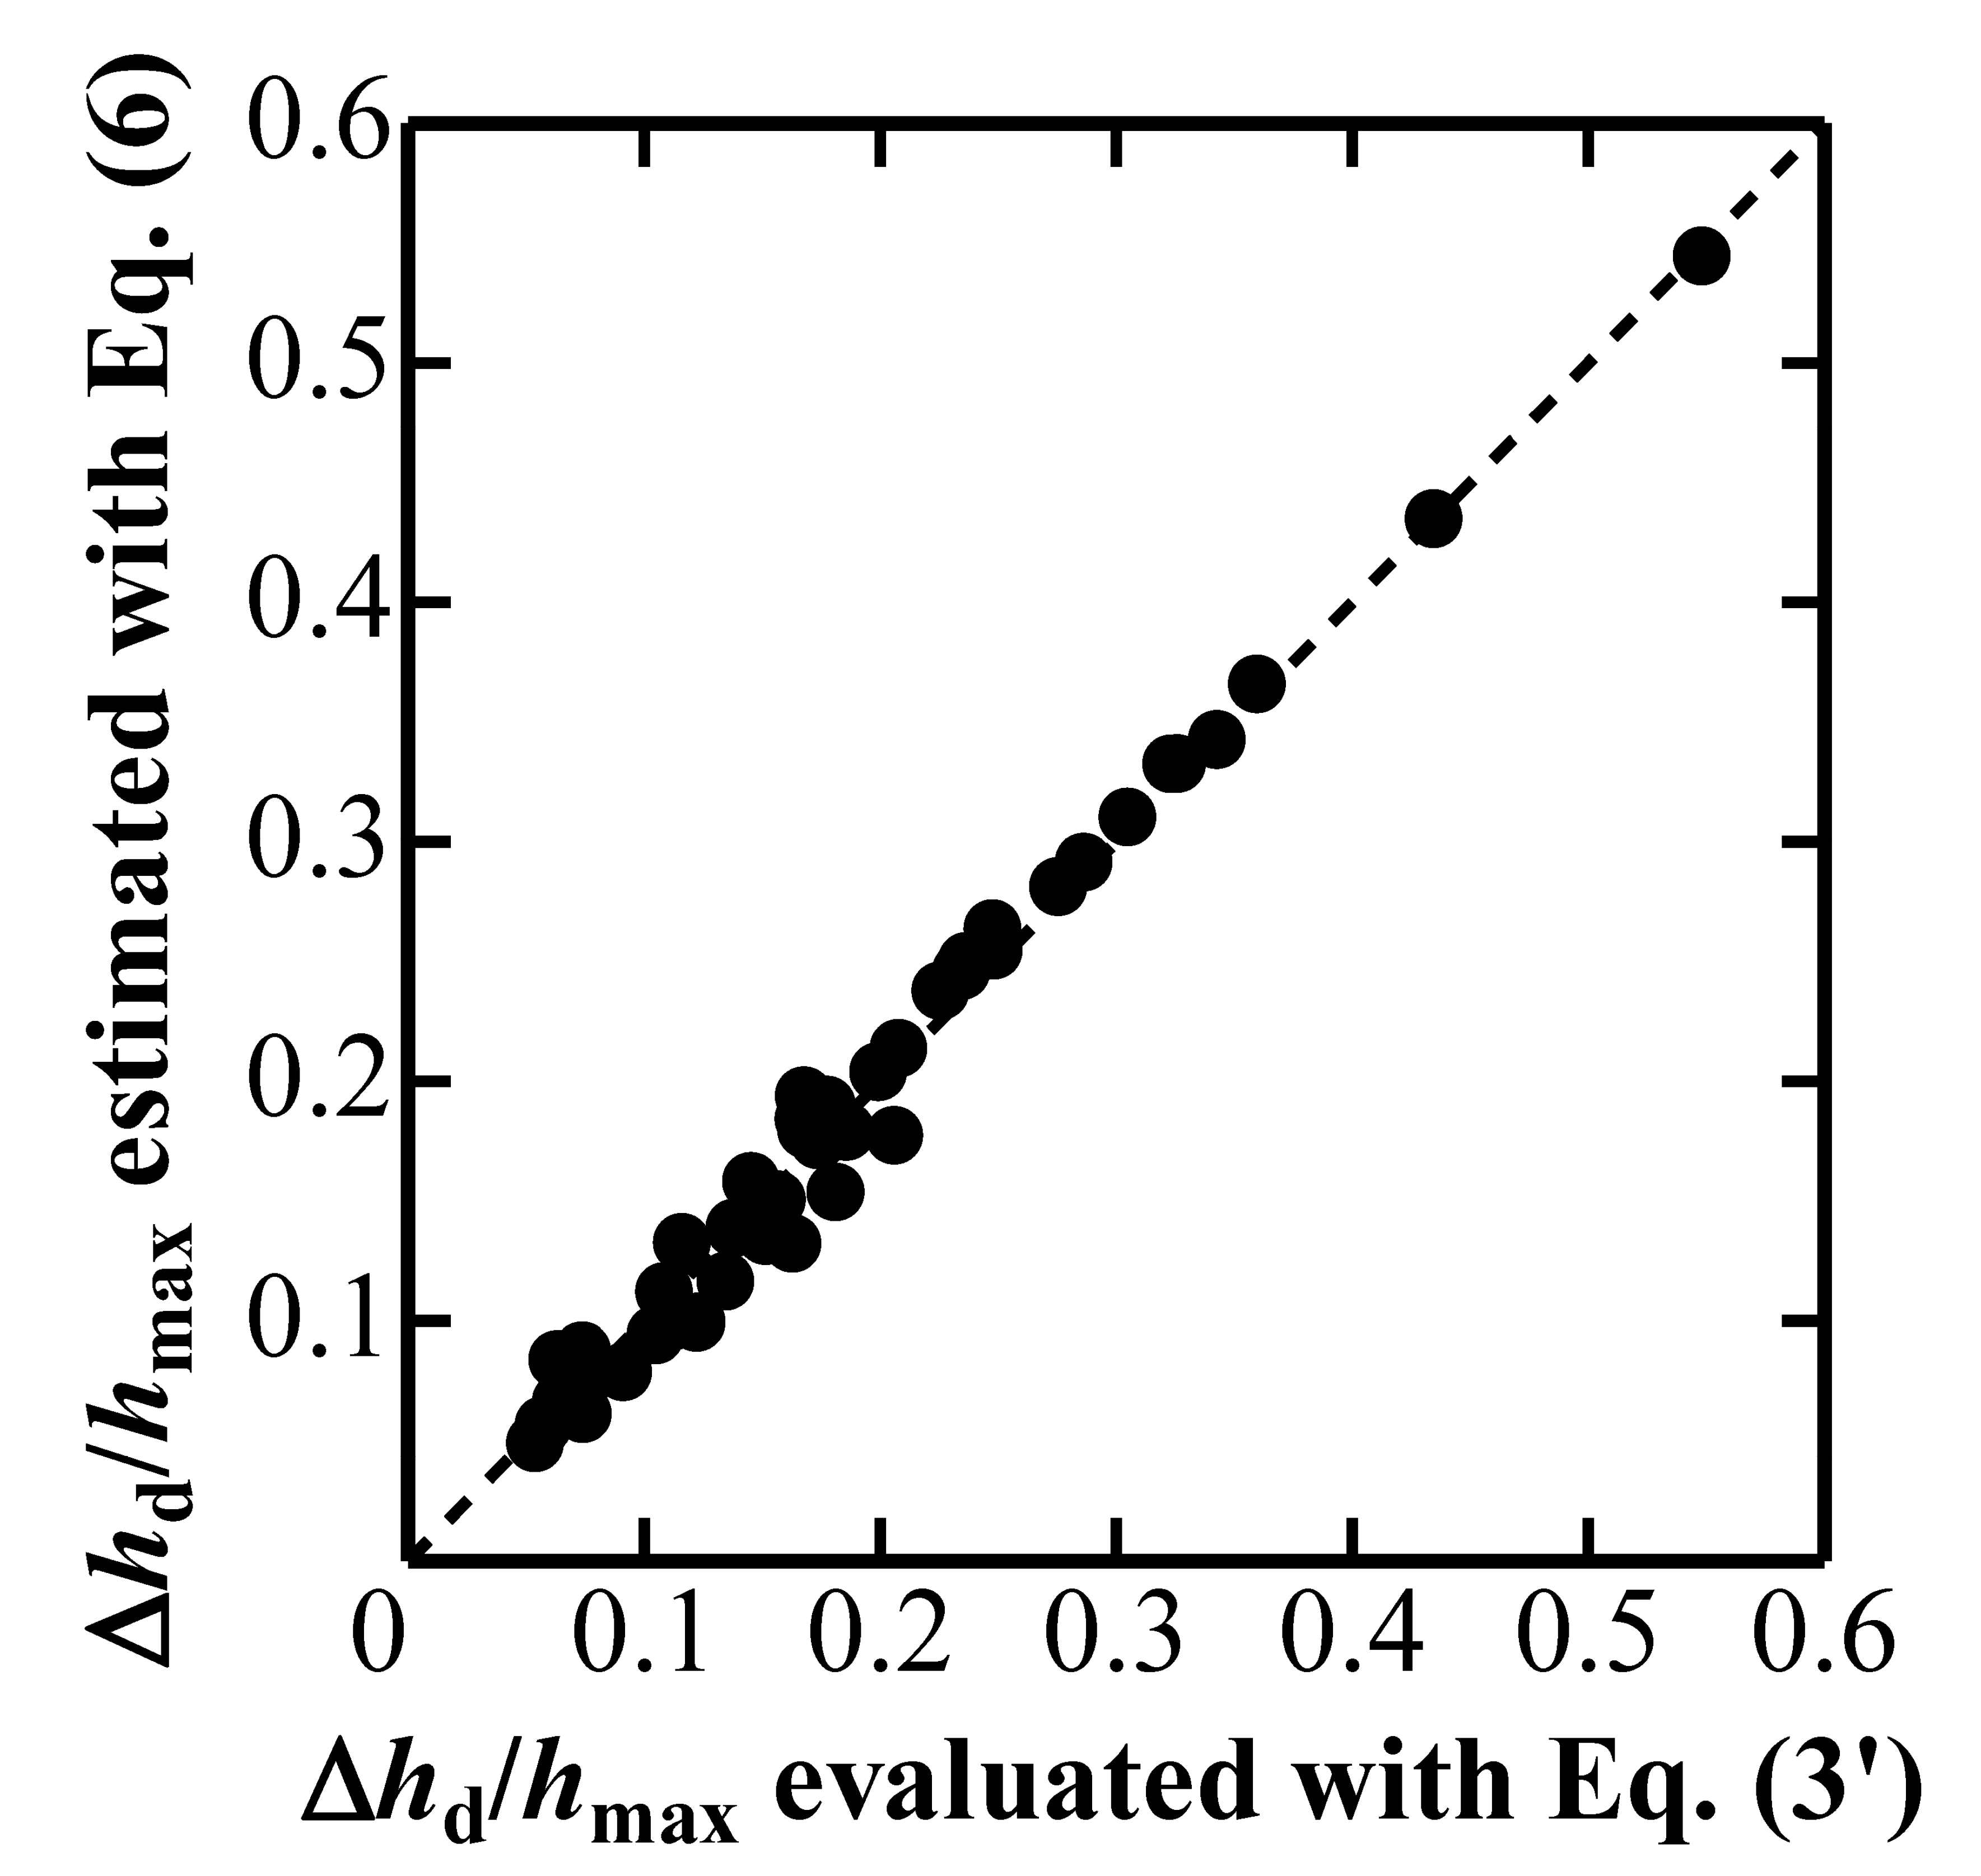
 Figure 4 plots Δhd/hmax estimated with Equation (6) against Δhd/hmax evaluated with Equation (3’). Figure 3 indicates that Δhd/hmax can be estimated by using Equation (6) with a nominally observed P-h curve characterized by k1n and ξn, and with the elastic properties of an elastic indenter characterized by Ei and νi.
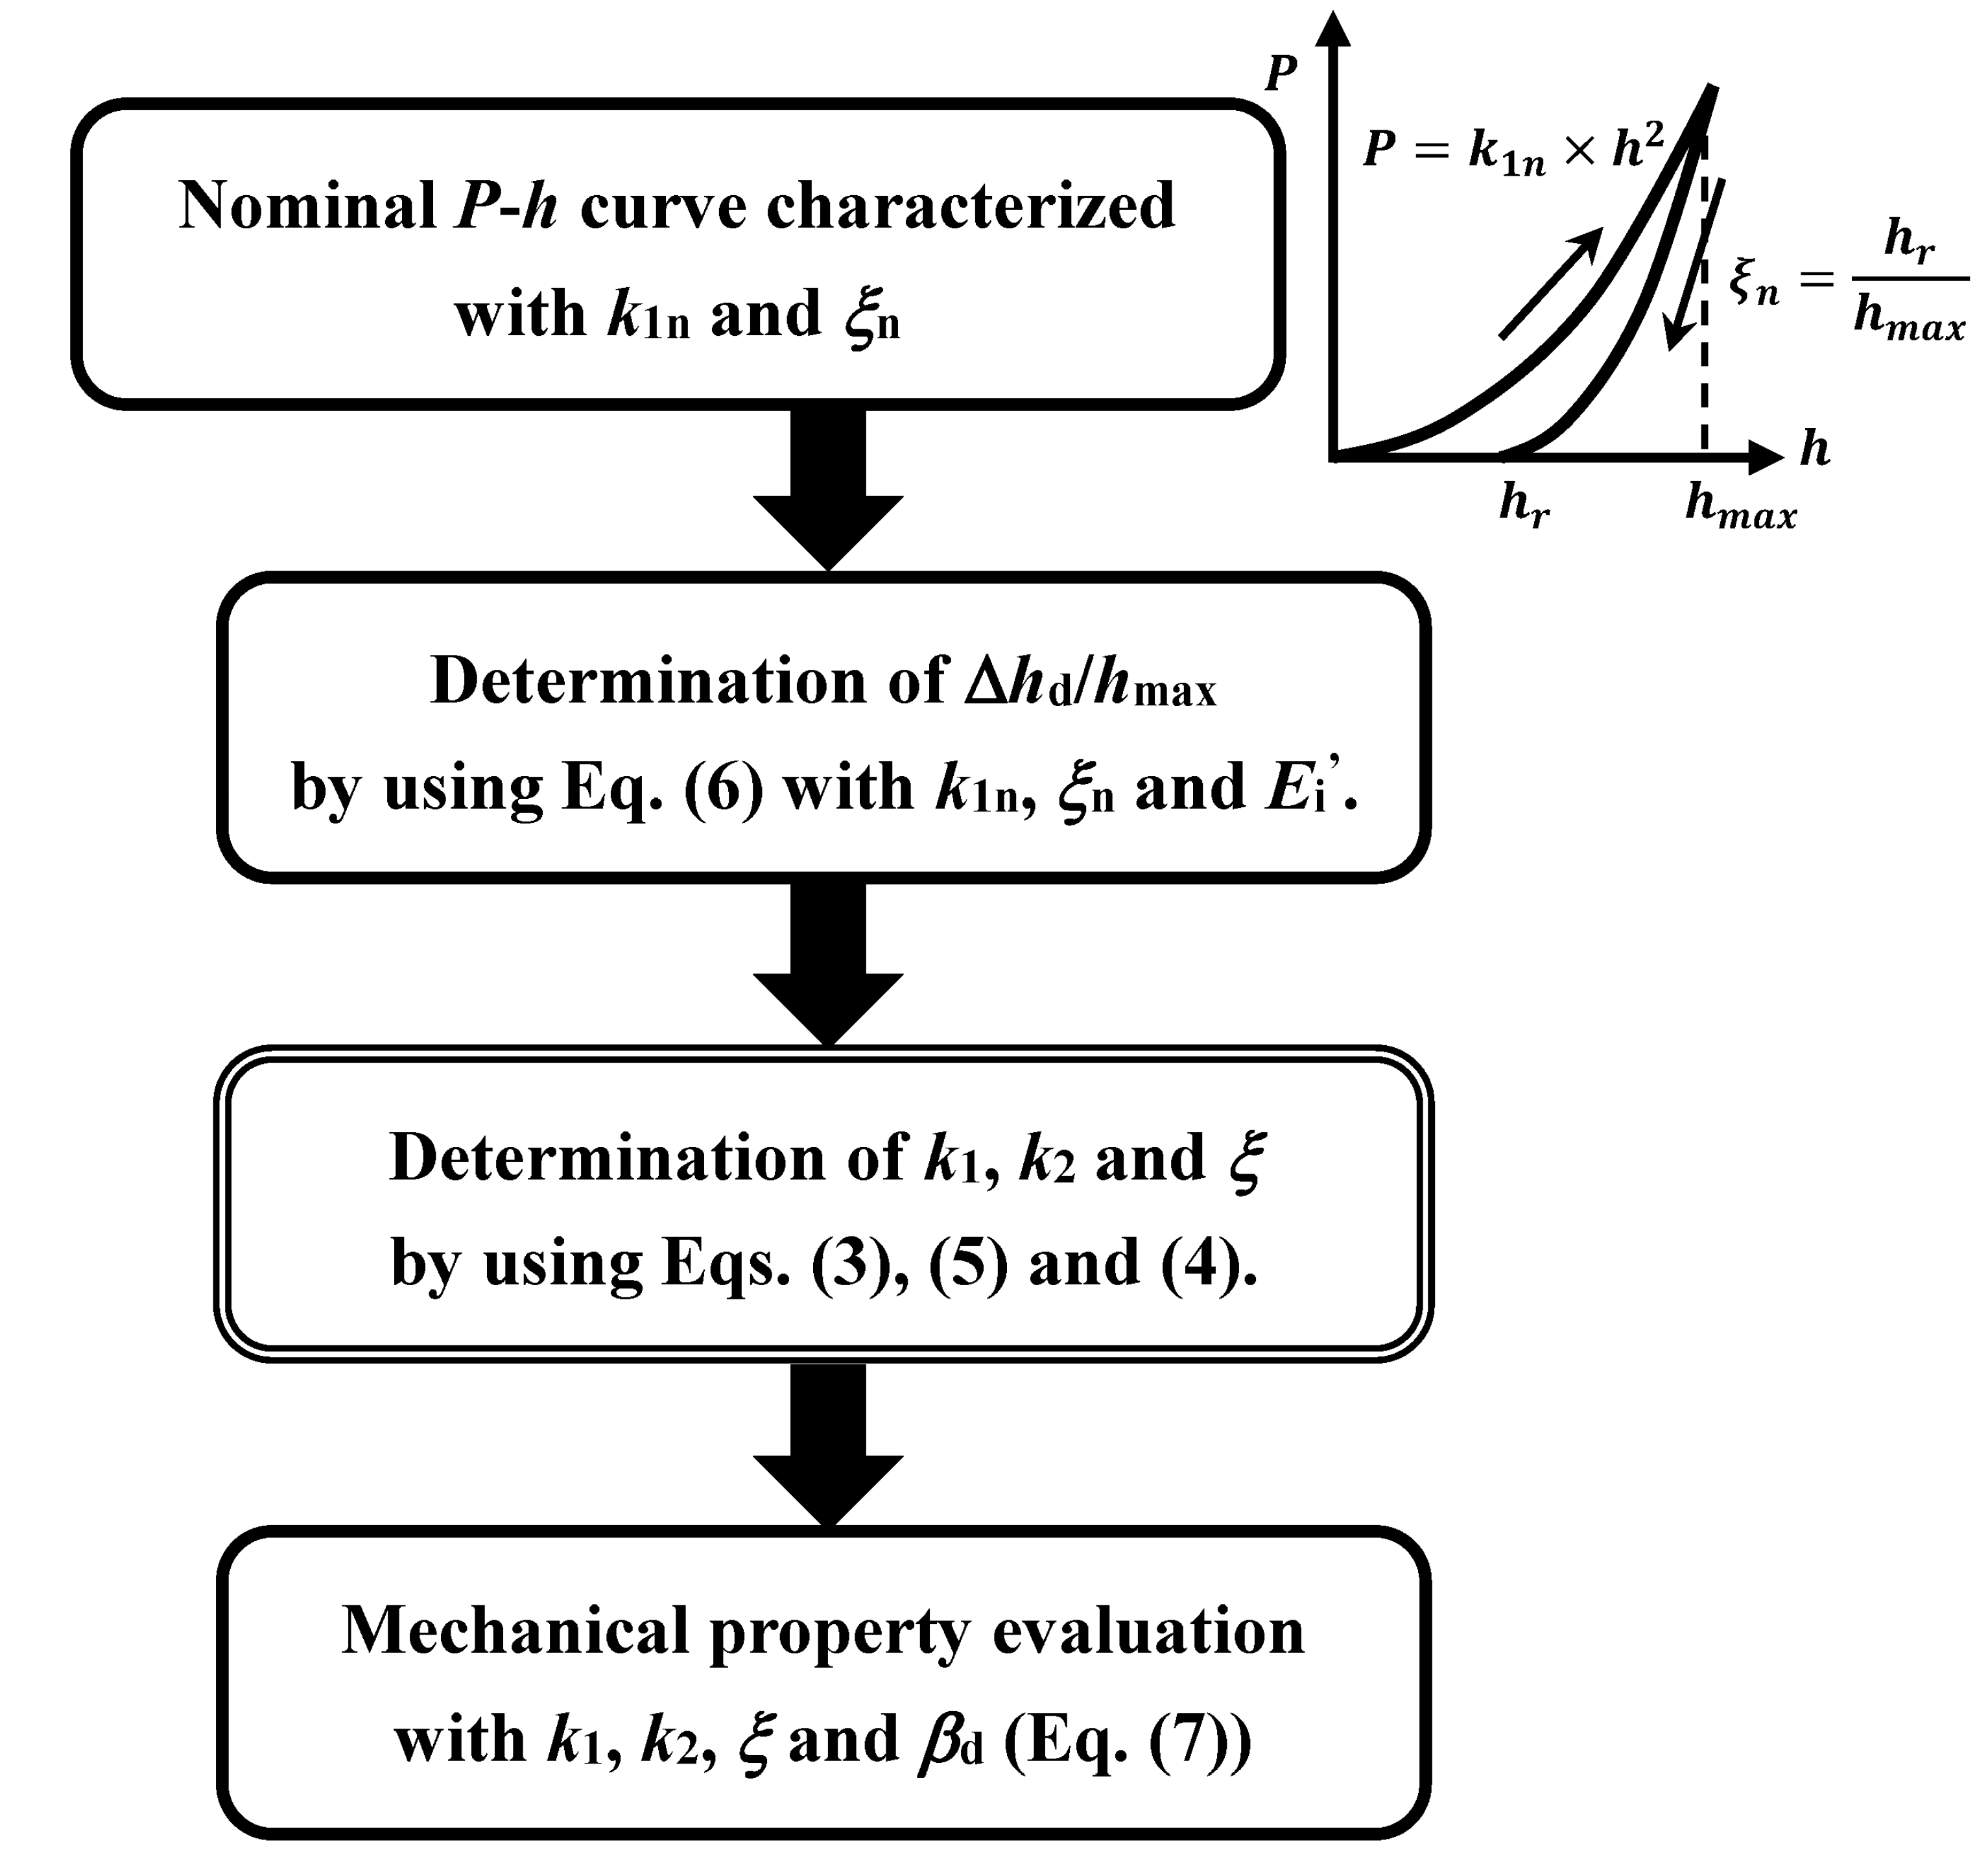
In order to estimate mechanical properties from a P-h curve characterized with k1, k2 and ξ, we should know the inclined face angle 
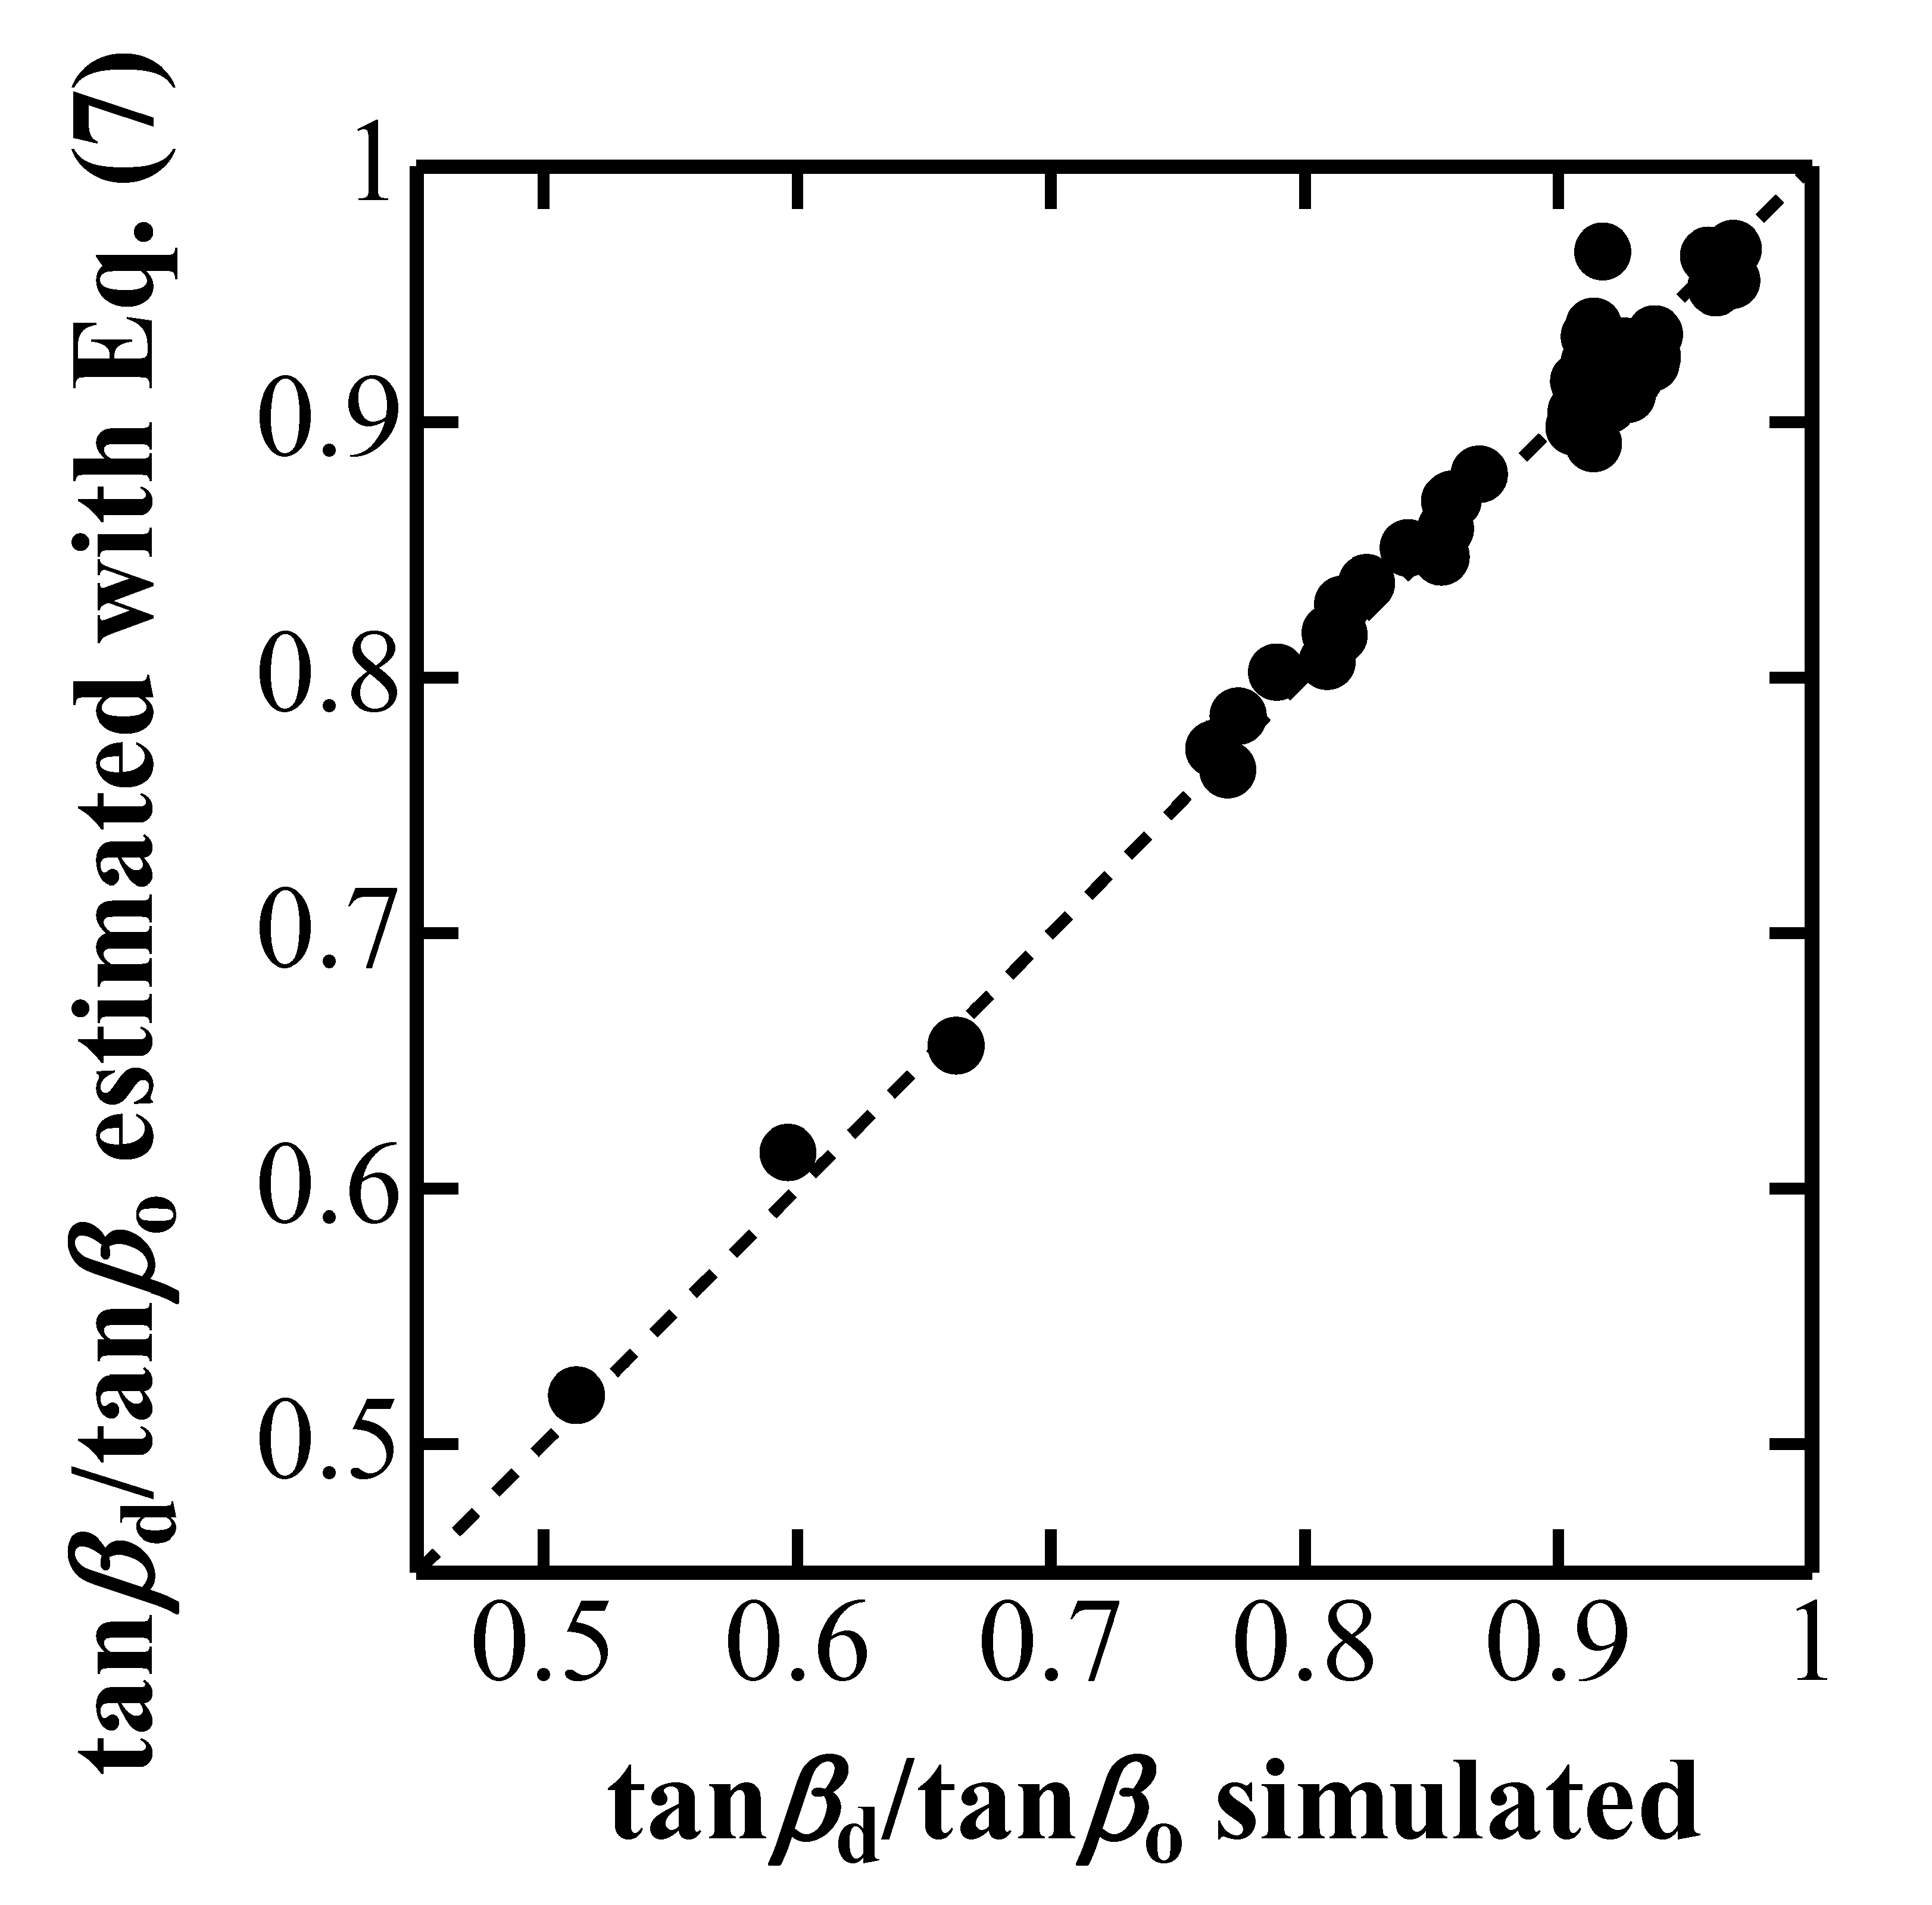
βd of the elastically deformed indenter. Numerical analysis revealed that βd is given as a function of βo, ξn and Δhd/hmax
tan β d tan β o = 1 ( 1 ξ n 0.80 ) 0.83 ( Δ h d h max ) 0.90 .
Figure 5 plots tan β d tan β o estimated with Equation (7) against tan β d tan β o observed in a simulated nanoindentation, and indicates the validity to estimate the inclined face angle βd of the elastically deformed indenter with Δhd/hmax.
The representative indentation elastic modulus E*, defined as E * = E 1 ( ν 0.225 tan 1.05 β d ) 2 in terms of βd [9], can be estimated from the simulated P-h curve using Equations (3)–(7) if we know Ei and νi, whereas it is evaluated with E and ν inputted into the FEM model and with βd observed in simulated nanoindentations. 
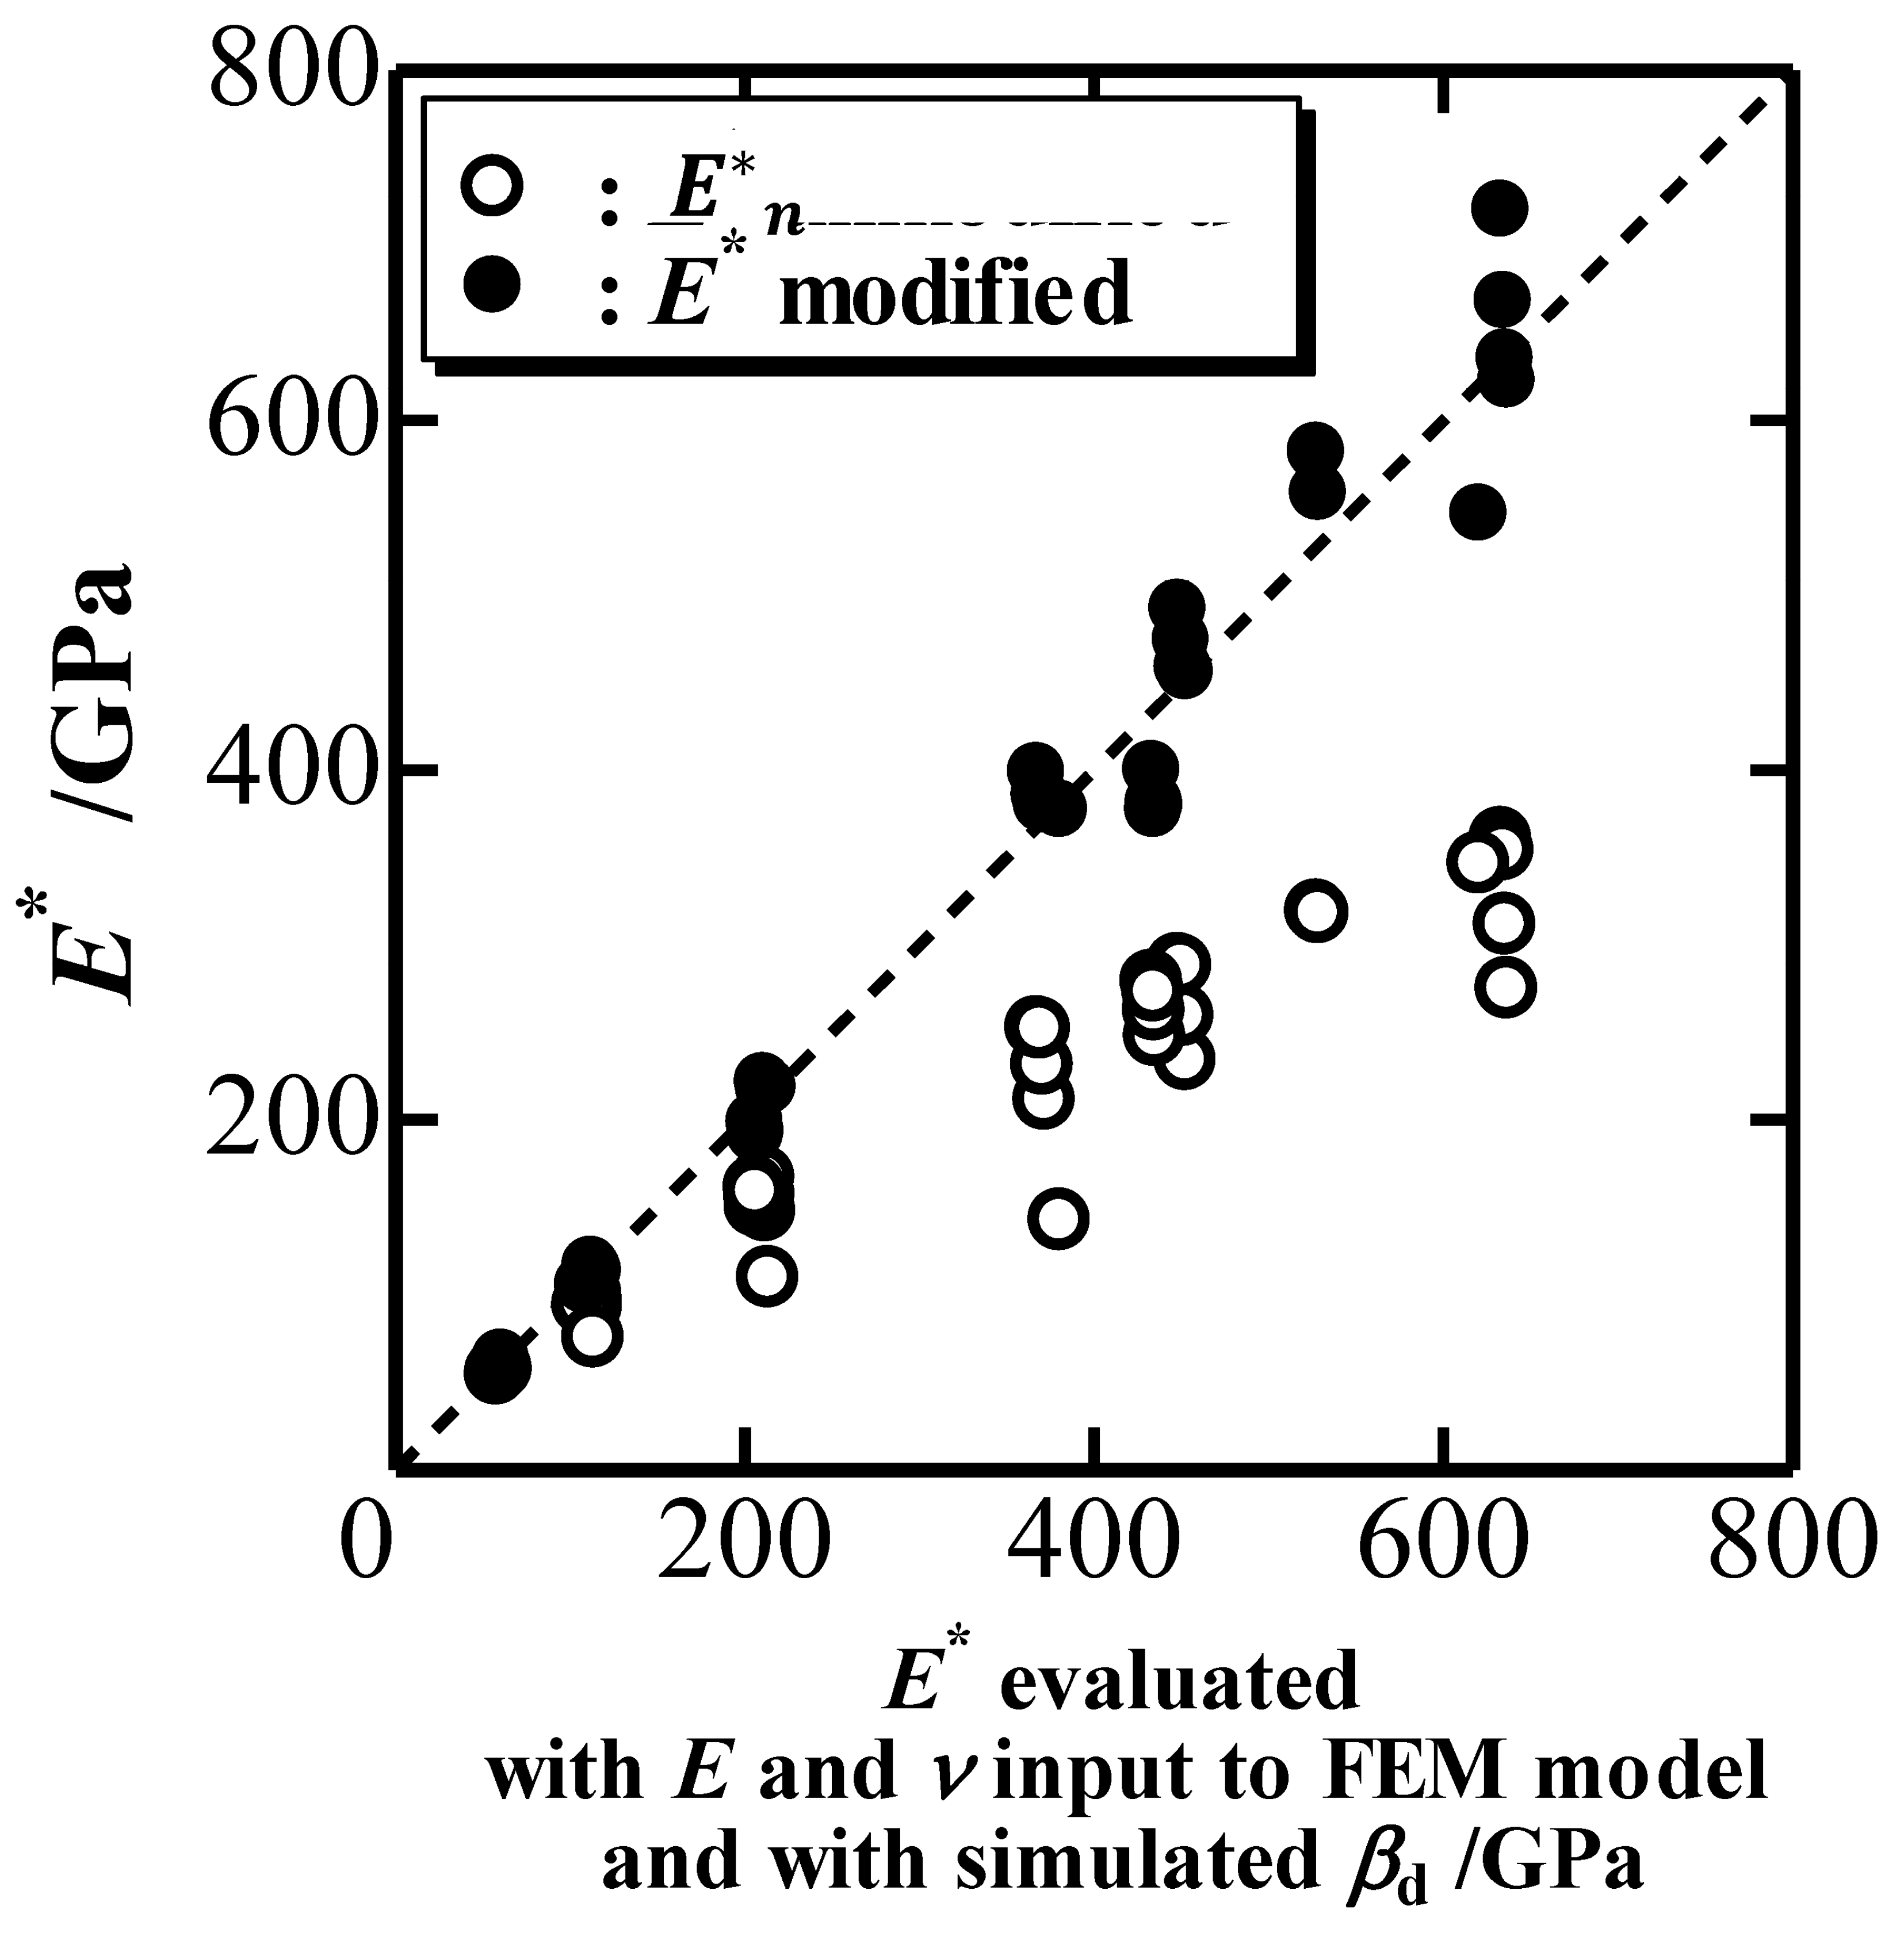
Figure 6 plots the estimated E* (black circles) against the evaluated E*. The white circles are E*n estimated with the nominal values of k2n and ξn [9], which means that the elastic deformation of an indenter is not modified for the estimation of E*. Figure 6 indicates the modification of the elastic deformation of an indenter can determine E* correctly. The underestimation of E* without the modification (the white circles in Figure 6) is caused by the overestimation of the elastic rebound during the unloading process because the extrinsic elastic deformation of the indenter is added to the intrinsic elastic deformation of the indented material.
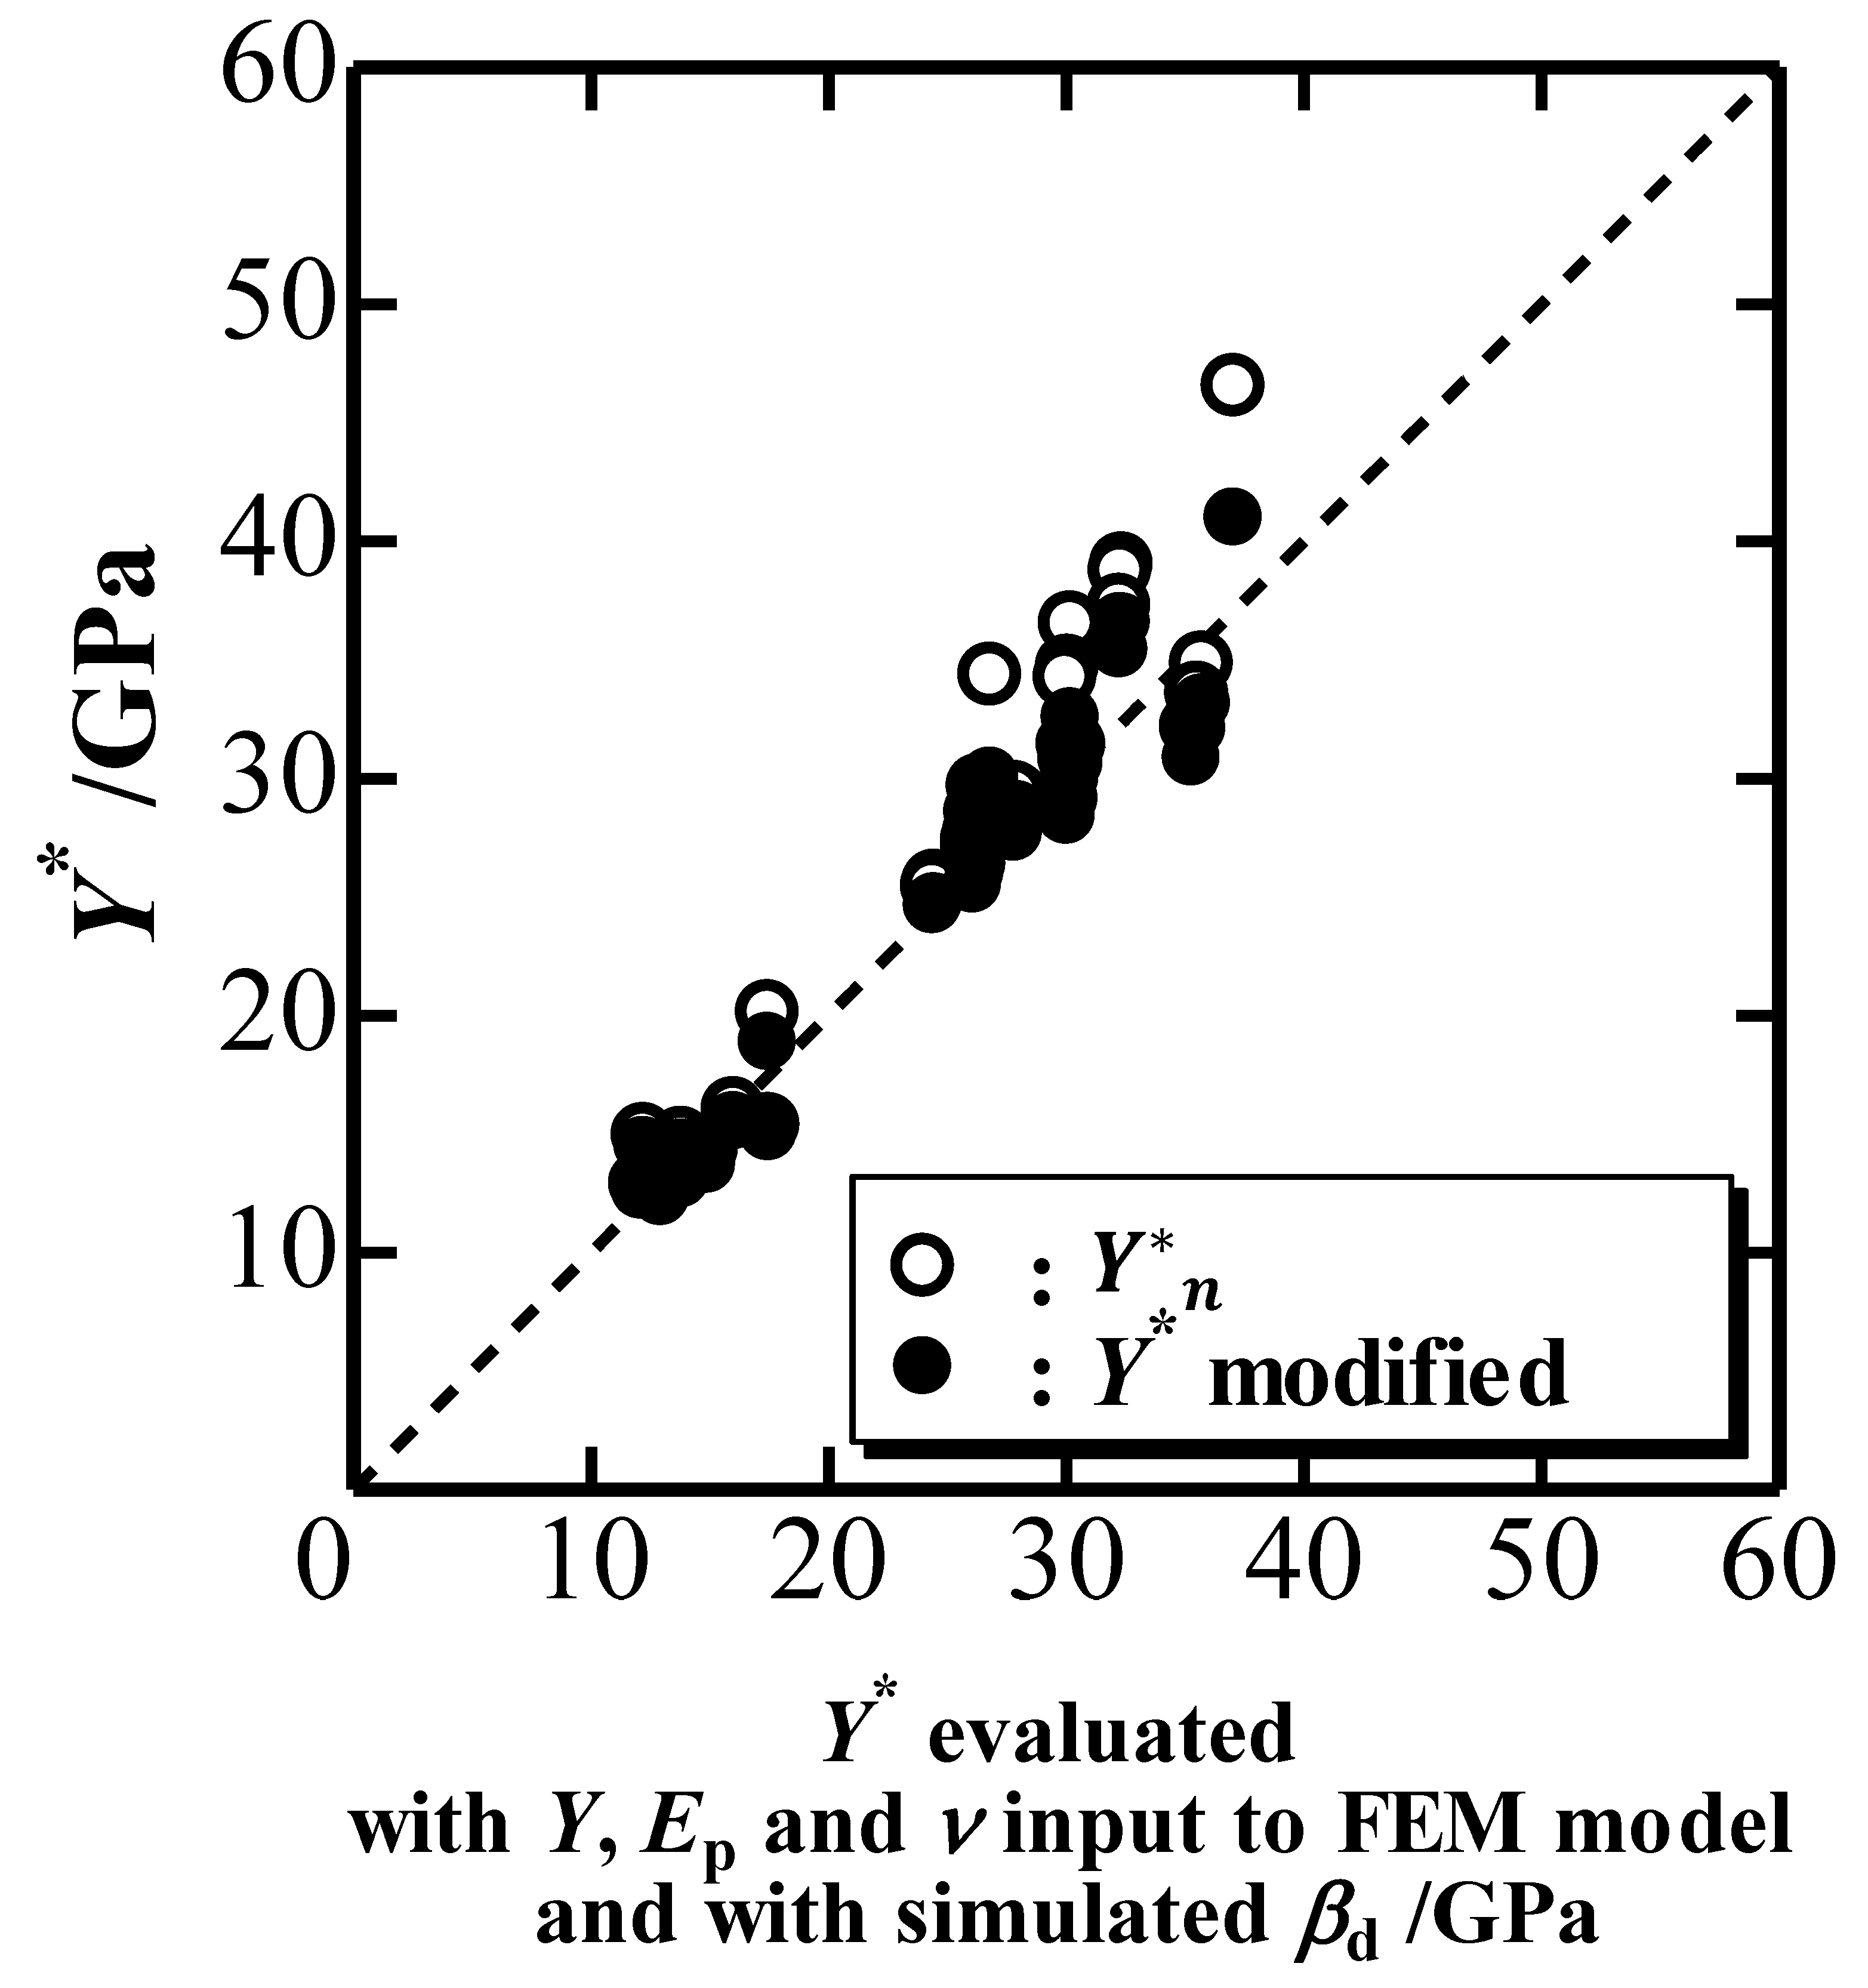
The representative indentation yield stress Y*, defined as Y * = Y + 0.25 E p tan β d 1 ( ν 0.225 tan 1.05 β d ) in terms of βd [10], can also be estimated using a simulated P-h curve and Equations (3)–(7) if we know Ei and νi. Moreover, it can be evaluated with Y, Ep and ν inputted into the FEM model and with βd of the simulated indentation. Figure 7 plots the estimated Y* (black circles) against the evaluated Y*. Y*n estimated with E*n, ξn and βo is plotted for comparison. This figure shows that the modification of the elastic deformation of an indenter more or less correctly estimates Y* although the difference between the modified and unmodified Y* is not so large with respect to the difference observed in E* (see Figure 6). A relatively large difference in Y* is typically found in the range of ξ less than 0.1, where plastic deformation is not dominant. The small difference observed in Figure 7 is attributed to the decrease in k1n and ξn due to elastic deformation of an elastic indenter, where the former decreases Y* nominally while the latter increases Y* apparently.
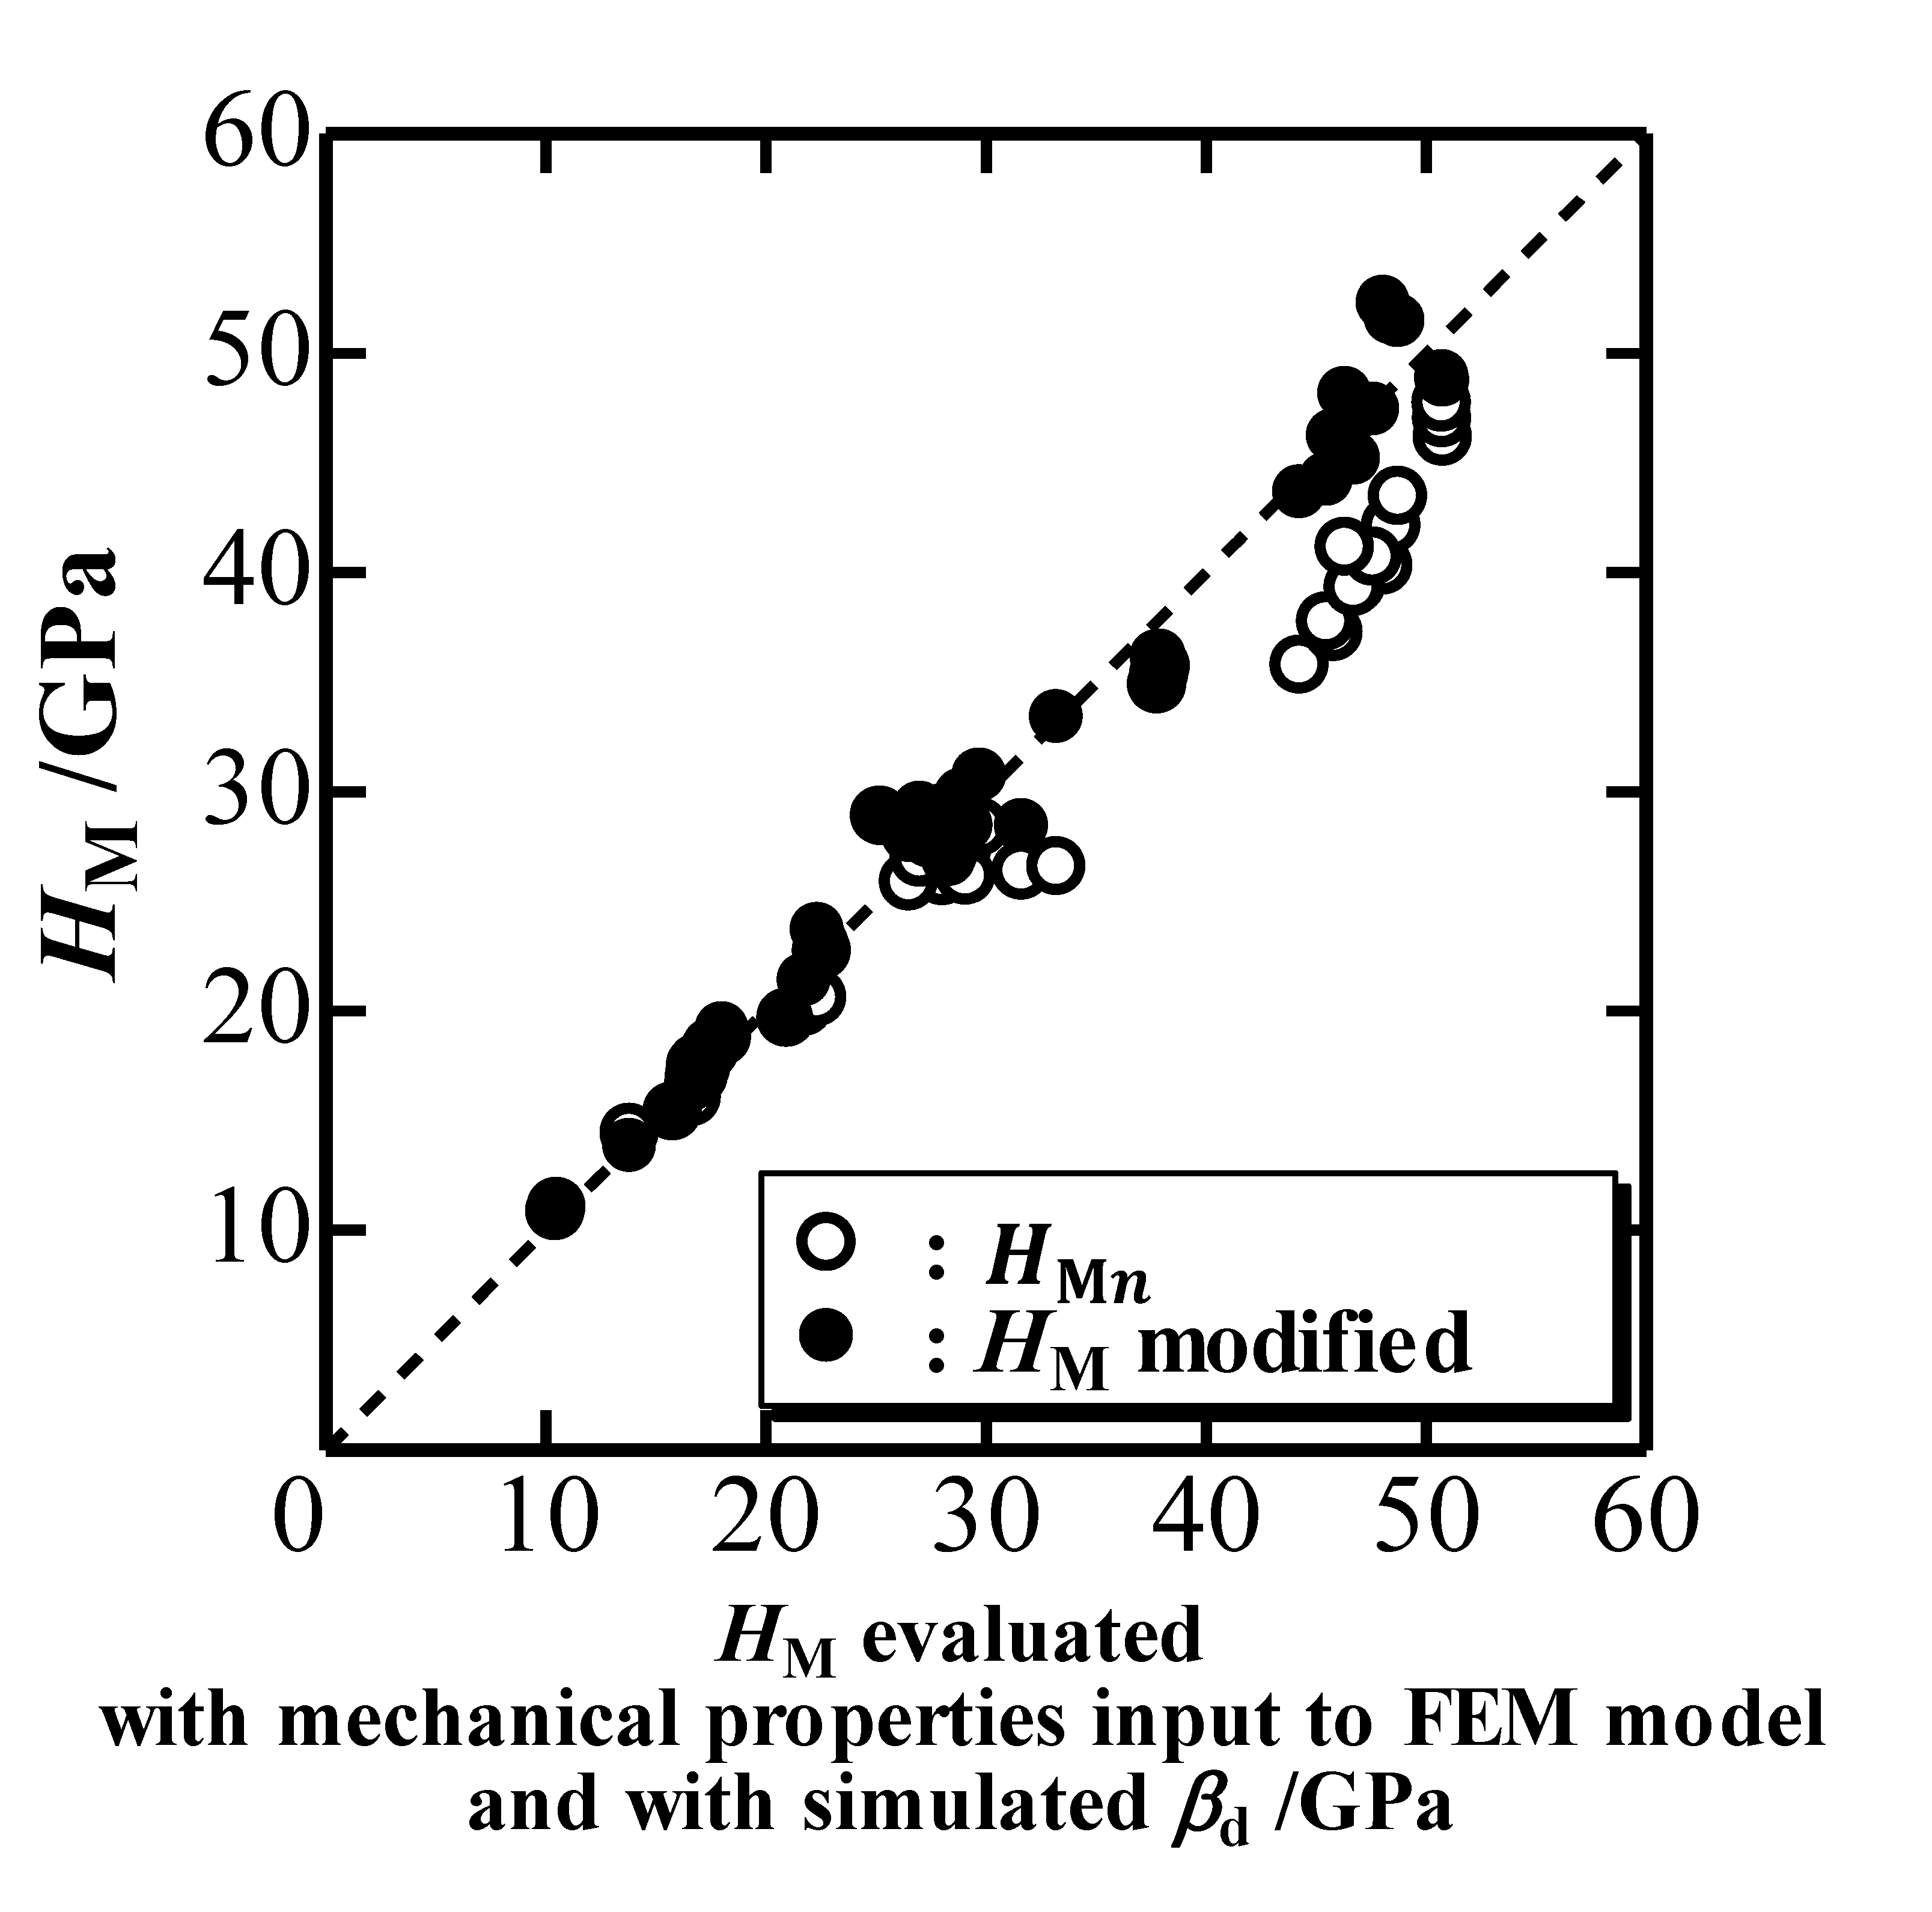
A previous study on the indentation hardness HM found that it can be evaluated with the mechanical properties inputted into the FEM model and with the simulated βd [9,10]. On the other hand, HM can be estimated from a true P-h curve characterized with k1, k2 and ξ. Figure 8 plots the estimated HM (black circles) against the evaluated HM. The nominal HMn estimated with the nominal P-h curve is plotted as white circles in Figure 8, and a comparison reveals that the modification more or less correctly estimates HM, although the difference between the estimated HM and the nominal HMn is not so large with respect to the difference observed in E* (see Figure 6). The difference is rather high in the large HM region, where elastic deformation of the indenter is most severe. The small difference observed in Figure 8 owes to the decrease in k1n and ξn due to elastic deformation of an elastic indenter, where the former decreases HM nominally while the latter increases HM apparently through the decrease of nominal contact depth.
We conducted nanoindentation experiments and reported E*, Y* and HM for several materials [9,10]. These values were evaluated with modified P-h curves (see Figure 9) considering elastic deformation of a diamond indenter with Young’s modulus and a Poisson’s ratio of 1140 GPa and 0.07, respectively. Table 1 shows these mechanical properties as well as those evaluated with a nominal P-h curve made without considering any elastic deformation of the indenter. Δhd/hmax and βd estimated with the numerical analysis developed in this study are shown in order to examine the degree of the elastic deformation of the indenter. Δhd/hmax and the change in ββ = βoβd) are large for relatively hard materials (e.g., fused silica and alumina), which would cause a large elastic deformation of the indenter. Even in that case, the changes in Y* and HM due to the elastic deformation of the indenter are not so large. In contrast, the change in E* is so large that it cannot be ignored. The underestimation of E* without the modification is caused by the overestimation of the elastic deformation during the unloading process because the extrinsic elastic deformation of the indenter is added to the intrinsic elastic deformation of the indented material.
According to Equation (6), the following equation can be derived
H M E i = γ 2 g ( 1 + ξ n 1.5 )    ( Δ h d 0.616 h max ) 1 0.84 .
When indentation hardness is not affected much by the indenter elastic deformation, where γ is the surface profile parameter defined as γ = hmax/hc, hc is the contact depth, and g is the geometrical factor of a point-sharp indenter to be 24.5 for β = 19.7°. Ei’ is required to be about 250 times larger than HM for Δhd/hmax smaller than 0.05, where the effect of the indenter elastic deformation on a P-h curve may be ignored for indentations with Berkovich-type indenter.

4. Conclusions

The effect of the geometrical changes due to the elastic deformation of a point-sharp indenter was examined by conducting a numerical analysis of P-h curves simulated with FEM. The effect appears as a decrease in the inclined face angle β. The key parameter Δhd/hmax, which can be utilized to derive the physically meaningful P-h curve and the decreased β, can be estimated with an equation derived by numerical analysis. The mechanical properties of indented materials, such as E*, Y* and HM, can be estimated by using the P-h curve and β characterized by k1, k2 and ξ estimated with the key parameter Δhd/hmax. The modification of a P-h curve and β with Δhd/hmax is most effective for the estimation of the accurate E* with respect to Y* and HM.

Acknowledgments

Financial support for this research was provided in the form of a Grant-In-Aid for Scientific Research (C) (No. 18560652), Encouragement of Scientists (No. 13750622) and the Nippon Sheet Glass Foundation for Materials Science and Engineering.

Author Contributions

Takashi Akatsu conceived of the ideas for this research, performed numerical analysis on the simulated nanoindentations and wrote the paper. Shingo Numata and Yutaka Shinoda simulated nanoindentation. Fumihiro Wakai advised on the numerical analysis and reviewed the manuscript of the paper.

Conflicts of Interest

The authors declare no conflict of interest.

Appendix A. Effect of the Tip Bluntness of a Point-Sharp Indenter on Nanoindentation Behavior

An indentation on a linearly elastic solid with a Young’s modulus E and Poisson’s ratio ν of 100 GPa and 0.499, respectively, was simulated using a rigid indenter with a truncated tip [8] in order to represent a tip in an extremely poor situation. The simulation was basically carried out in the same way described in the Section 2 of this paper. The inclined face angle β of the indenter was set to be 19.7°, which is the Vickers–Berkovich equivalent angle. The distance Δhtip between ideally sharp and truncated tips (see Figure A1) was set to be 716 or 1790 nm with respect to the maximum penetration depth of 10 μm.
Figure A1. Schematic illustration of a truncated conical indenter tip.
Materials 10 00270 g010
The P-h curves shown in Figure A2 were obtained by simulating an indentation on a perfectly elastic body with a Poisson’s ratio ν of 0.5 for a series of Δhtip. We only examined a perfectly elastic body because the effect of bluntness would be most severe in this case. As shown in Figure A3, the curve deviates from that for an ideally sharp indenter (Δhtip = 0) as Δhtip increases and the amount of the shift in the h direction almost coincides with Δhtip. The results in this figure indicate the effect of a blunt tip of a conical indenter on the P-h curve can be simply described as a change in the penetration depth with Δhtip, especially in the large P and h region. The error in Young’s modulus is evaluated as | E P h E inp | E inp (expressed as a percentage), where EP-h and Einp are Young’s modulus values obtained from the simulated P-h curve and inputted into an FEM model, respectively. Figure A4 plots this error as a function of penetration depth normalized by Δhtip. It indicates that a reliable Young’ modulus can be obtained with an error less than 10% from the P-h curve in the h region larger than 2Δhtip. In other words, P-h data for h-values shallower than 2Δhtip should be omitted in order to obtain reliable mechanical properties. It may be possible to get more reliable P-h data in the shallow h region for other geometries, but the P-h data are actually obscure and depend on the unknown geometry of the indenter tip. We simulated a truncated tip of a conical indenter because it represents the worst case of a blunt point-sharp indenter; consequently, the P-h data obtained in the h region larger than 2Δhtip guarantees accuracy in all cases. Figure A5, where h is plotted as a function of the square root of P, is an extrapolation of the linear relationship between h and P*** observed in the large P and h region to P = 0. It gives Δhtip as an absolute value on the h-axis and is a way to estimate Δhtip from the P-h curve. We have already reported an example of estimating Δhtip from an experimental P-h curve [13]; Δhtip is estimated to be about 50 nm for the Berkovich indenter that we actually used for the nanoindentation experiment.
Figure A2. Indentation load P vs. penetration depth h curves obtained with truncated conical indenters.
Materials 10 00270 g011
Figure A3. Indentation load P vs. modified penetration depth h + Δhtip curves obtained with truncated conical indenters.
Materials 10 00270 g012
Figure A4. Error in Young’s modulus evaluation with a truncated conical indenter as a function of normalized penetration depth (h + Δhtip)/Δhtip.
Materials 10 00270 g013
Figure A5. Penetration depth h vs. square root of indentation load P*** obtained with truncated indenters.
Materials 10 00270 g014

References

  1. Mann, A.B.; Cammarata, R.C.; Nastasi, M.A. Nanoindentation: From angstroms to microns—Introduction. J. Mater. Res. 1999, 14, 2195. [Google Scholar] [CrossRef]
  2. Sakai, M.; Shimizu, S.; Ishikawa, T. The indentation load-depth curve of ceramics. J. Mater. Res. 1999, 14, 1471–1484. [Google Scholar] [CrossRef]
  3. Shih, C.W.; Yang, M.; Li, J.C.M. Effect of tip radius on nanoindentation. J. Mater. Res. 1991, 6, 2623–2628. [Google Scholar] [CrossRef]
  4. Murakami, Y.; Tanaka, K.; Itokazu, M.; Shimamoto, A. Elastic analysis of triangular pyramidal indentation by the finite-element method and its application to nano-indentation measurement of glasses. Philos. Mag. A 1994, 69, 1131–1153. [Google Scholar] [CrossRef]
  5. Yu, N.; Polycarpon, A.A.; Conry, T.F. Tip-radius effect in finite element modeling of sub-50 nm shallow nanoindentation. Thin Solid Films 2004, 450, 295–303. [Google Scholar] [CrossRef]
  6. Oliver, W.C.; Pharr, G.M. An improved technique for determining hardness and elastic modulus using load and displacement sensing indentation experiments. J. Mater. Res. 1992, 7, 1564–1583. [Google Scholar] [CrossRef]
  7. Knapp, J.A.; Follsteadt, D.M.; Myers, S.M.; Barbour, J.C.; Friedmann, T.A. Finite-element modeling of nanoindentation. J. Appl. Phys. 1999, 85, 1460–1474. [Google Scholar] [CrossRef]
  8. Shimamoto, A.; Tanaka, K.; Akiyama, Y.; Yoshizaki, H. Nanoindentation of glass with a tip truncated Berkovich indenter. Philos. Mag. A 1996, 74, 1097–1105. [Google Scholar] [CrossRef]
  9. Akatsu, T.; Numata, S.; Demura, T.; Shinoda, Y.; Wakai, F. Representative indentation elastic modulus evaluated by unloading of nanoindentation made with a point sharp indenter. Mech. Mater. 2015, 83, 66–71. [Google Scholar] [CrossRef]
  10. Akatsu, T.; Numata, S.; Demura, T.; Shinoda, Y.; Wakai, F. Representative indentation yield stress evaluated by nanoindentation behavior made with a point sharp indenter. Mech. Mater. 2016, 92, 1–7. [Google Scholar] [CrossRef]
  11. Sakai, M. Energy principle of the indentation-induced inelastic surface deformation and hardness of brittle materials. Acta Metall. Mater 1993, 41, 1751–1758. [Google Scholar] [CrossRef]
  12. Sakai, M. The Meyer hardness: A measure for plasticity? J. Mater. Res. 1999, 14, 3630–3639. [Google Scholar] [CrossRef]
  13. Akatsu, T.; Numata, S.; Yoshida, M.; Shinoda, Y.; Wakai, F. Indentation size effect on the hardness of zirconia polycrystals. In Fracture Mechanics of Ceramics (Volume 14 Active Materials, Nanoscale Materials, Composites, Glass and Fundamentals); Springer Science + Business Media Inc.: New York, NY, USA, 2005; pp. 13–20. [Google Scholar]
Figure 1. Schematic illustration of the effect of indenter elastic deformation on a P-h curve.
Materials 10 00270 g001
Figure 2. Relative residual depth ξ estimated with Equation (4) and ξn nominally observed plotted against ξ evaluated with mechanical properties inputted into the FEM model.
Materials 10 00270 g002
Figure 3. Indentation unloading parameter k2 simulated and k2n nominally observed plotted against k2 evaluated with mechanical properties inputted into the FEM model.
Materials 10 00270 g003
Figure 4. Degree of elastic deformation of conical indenter Δhd/hmax estimated with Equation (6) plotted against Δhd/hmax evaluated with Equation (3’).
Materials 10 00270 g004
Figure 5. Degree of change in inclined face angle tanβd/tanβo estimated with Equation (7) plotted against tanβd/tanβo observed in simulated nanoindentation.
Materials 10 00270 g005
Figure 6. Representative indentation elastic modulus E* estimated with simulated P-h curves plotted against E* evaluated with mechanical properties inputted into the FEM model.
Materials 10 00270 g006
Figure 7. Representative indentation yield stress Y* estimated with simulated P-h curves plotted against Y* evaluated with mechanical properties inputted into the FEM model.
Materials 10 00270 g007
Figure 8. Indentation hardness HM estimated with simulated P-h curves plotted against HM evaluated with mechanical properties inputted into the FEM model and with simulated βd.
Materials 10 00270 g008
Figure 9. Flow chart of the procedure to evaluate mechanical properties.
Materials 10 00270 g009
Table 1. Effect of elastic deformation of diamond indenter on mechanical property evaluations.
MaterialsΔhd/hmaxβd/βo (deg.)k2/k2n (10 3 GPa)ξ/ξnE* (GPa)Y* (MPa)HM (GPa)
(Modified Value/Unmodified Value)
Brass0.02019.6/19.77.65/4.780.930/0.913102/81584/5971.26/1.29
Duralumin0.02019.6/19.74.37/3.030.909/0.89377/64605/6181.31/1.33
Beryllium copper alloy0.02719.6/19.79.49/5.440.925/0.904136/103841/8631.82/1.86
Fused silica0.06519.0/19.70.615/0.4770.550/0.52274/655.21 × 103/5.35 × 1038.56/8.40
Alumina0.15818.3/19.74.90/2.250.690/0.614340/22512.6 × 103/12.9 × 10324.3/22.8

