1. Introduction
Due to two destructive storms, tropical storm Irene and the October snowstorm in 2011, more than 800,000 customers in the state of Connecticut lost power for over a week, resulting in monetary and intangible economic losses [
1]. These major power outages point towards the vulnerability of the existing power system to extreme weather conditions. Moreover, the possibility of widespread outages may significantly increase due to abnormal changes in weather because distribution systems are not typically designed to withstand extreme weather events, such as hurricanes and ice storms. Thus power system hardening methods are of growing concern, placing pressure on electric utilities by state governments to harden the power system in order to cope with storms and bolster preparedness and response.
Three classifications of hardening options are undergrounding (UG), emergency generators (EGs), and microgrid systems. Frequent outages can be the fault of falling trees, wind, debris, or ice which can cause extensive damage to overhead lines. Typically, electricity transmission between generation and customers is through overhead power lines. Therefore, an underground system is a simple solution to this problem by merit of burying lines to prevent damage and disconnection [
2]. A second method, EG which is generally fueled by fossil fuels and located close to electricity demand with minimal losses as a standby power source, has been employed for a long time where outages are more prevalent so that the supply of electrical power to the critical loads is constant, even in the case of a power system failure [
3]. Finally, microgrid systems can harden the power system. A microgrid system is a small power system employing distributed generators, such as combined heat and power (CHP) or renewable power sources with reduced carbon emissions, in order to entirely supply a local load demand inside of the microgrid itself [
4].
The purpose of this paper is to find a suitable approach capable of comparing the life cycle cost (LCC) among several hardening options which must provide continuous and steady power to critical loads of the towns during a long term power outage by catastrophic storms. Therefore, one of the most important requirements from the utility company is that the hardening option candidates should be more reliable, utilizing generation resources among many distributed generation systems. For example, due to tropical storm Irene and the October snowstorm in 2011, power outages lasted more than two weeks. Considering this requirement, the battery energy storage system (BESS) is typically used with distributed generation to compensate an intermittence of renewable sources like short-term power balancing, rather than be used as the independent power supplier without a renewable source for a long-term islanding operation. For this reason, BESS was excluded as a hardening option candidate due to the lack of capability in supplying power continuously for a few weeks, irrespective of its cost and availability. Additionally, photovoltaics (PV) and wind turbines were not considered as hardening options since their generated power is highly dependent on intermittent factors, whereas the fuel cell (FC) and micro-turbine (MT) as hardening options are able to generate stable emergency power to critical loads, such as schools, police stations, nursing home, hospitals, etc., as long as the external natural gas can be provided. Ultimately, FC and MT are selected as hardening options in a microgrid because of their suitability for the long-term power outage preparation, as well as the potential for modular construction and the fact that they may be more easily sited in a downtown district due to better sound characteristics.
Direct monetary benefits should be evaluated above other factors when determining the most cost effective hardening methods for power systems. When estimating the direct monetary benefits, LCC is a useful tool to optimize the cost of acquiring, owning and operating physical assets over their lives by attempting to identify and quantify all of the significant costs involved in that life, using the present value technique [
5,
6]. In power system applications, LCC has been applied to long-term vs. short-term energy storage [
7], electric power generation [
8], and renewable energy sources [
9,
10,
11].
There are several prior studies on hardening power systems [
3,
12,
13,
14,
15]. Multiple utility services and EG sets were considered to ensure continuity of electrical power to essential loads [
3], but addressed some of the basic factors consisting of these emergency power systems rather than an economic consideration. Various tactics and strategies for hardening power systems based on Florida hurricane data in 2004 and 2005 were discussed in [
12], but focused more on identifying the characteristics of poles that are likely to fail during extreme weather. Collaborative research efforts related to hardening efforts by Florida utilities were addressed to improve preparations for future storms in [
13], but only UG was considered as a hardening option. Important considerations that should be evaluated when developing a flood mitigation strategy for electrical substations were proposed in [
14], but the hardening methods are limited in detecting floods and building future substations with environmental immunity. Several simulation tools and models for stand-alone electric generation hybrid systems, such as a PV generator and/or wind turbines and/or diesel generators with energy storage are reviewed and compared in [
15], but did not address the economic analysis approaches for calculating LCC. None of the papers used stochastic input data to compare LCC in hardening options of power systems, such as UG, EG, and microgrids, especially for storm preparedness.
In this paper, a comparative study of three hardening options for critical loads is performed through the use of LCC analysis [
16]. From the proposed LCC model, total costs experienced in annual time increments during the project with consideration for the time value of money can be estimated. In addition, by considering the variation of critical input data, better decisions for the direction of a project can be carried out. For such a reason, the Monte Carlo method is used for forecasting the range of possible outcomes in the stochastic model.
2. Methodology
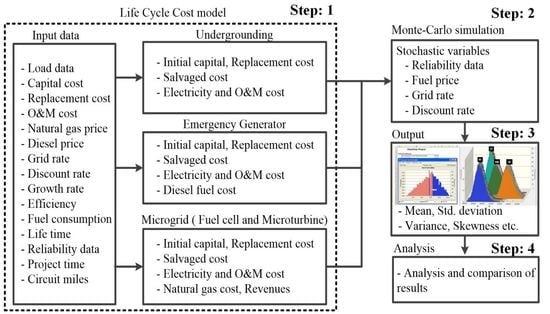
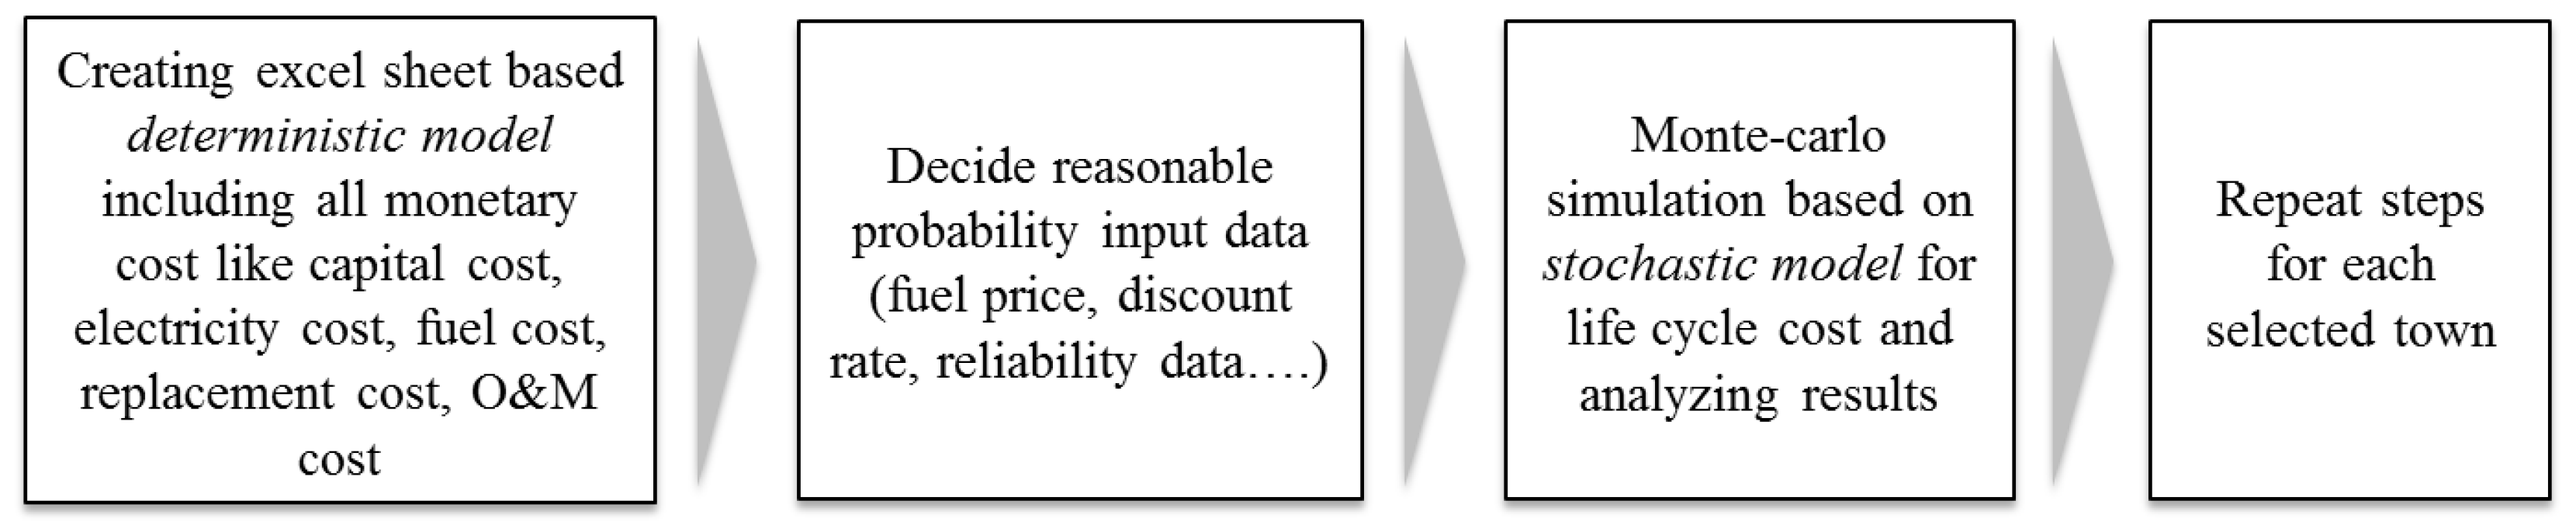
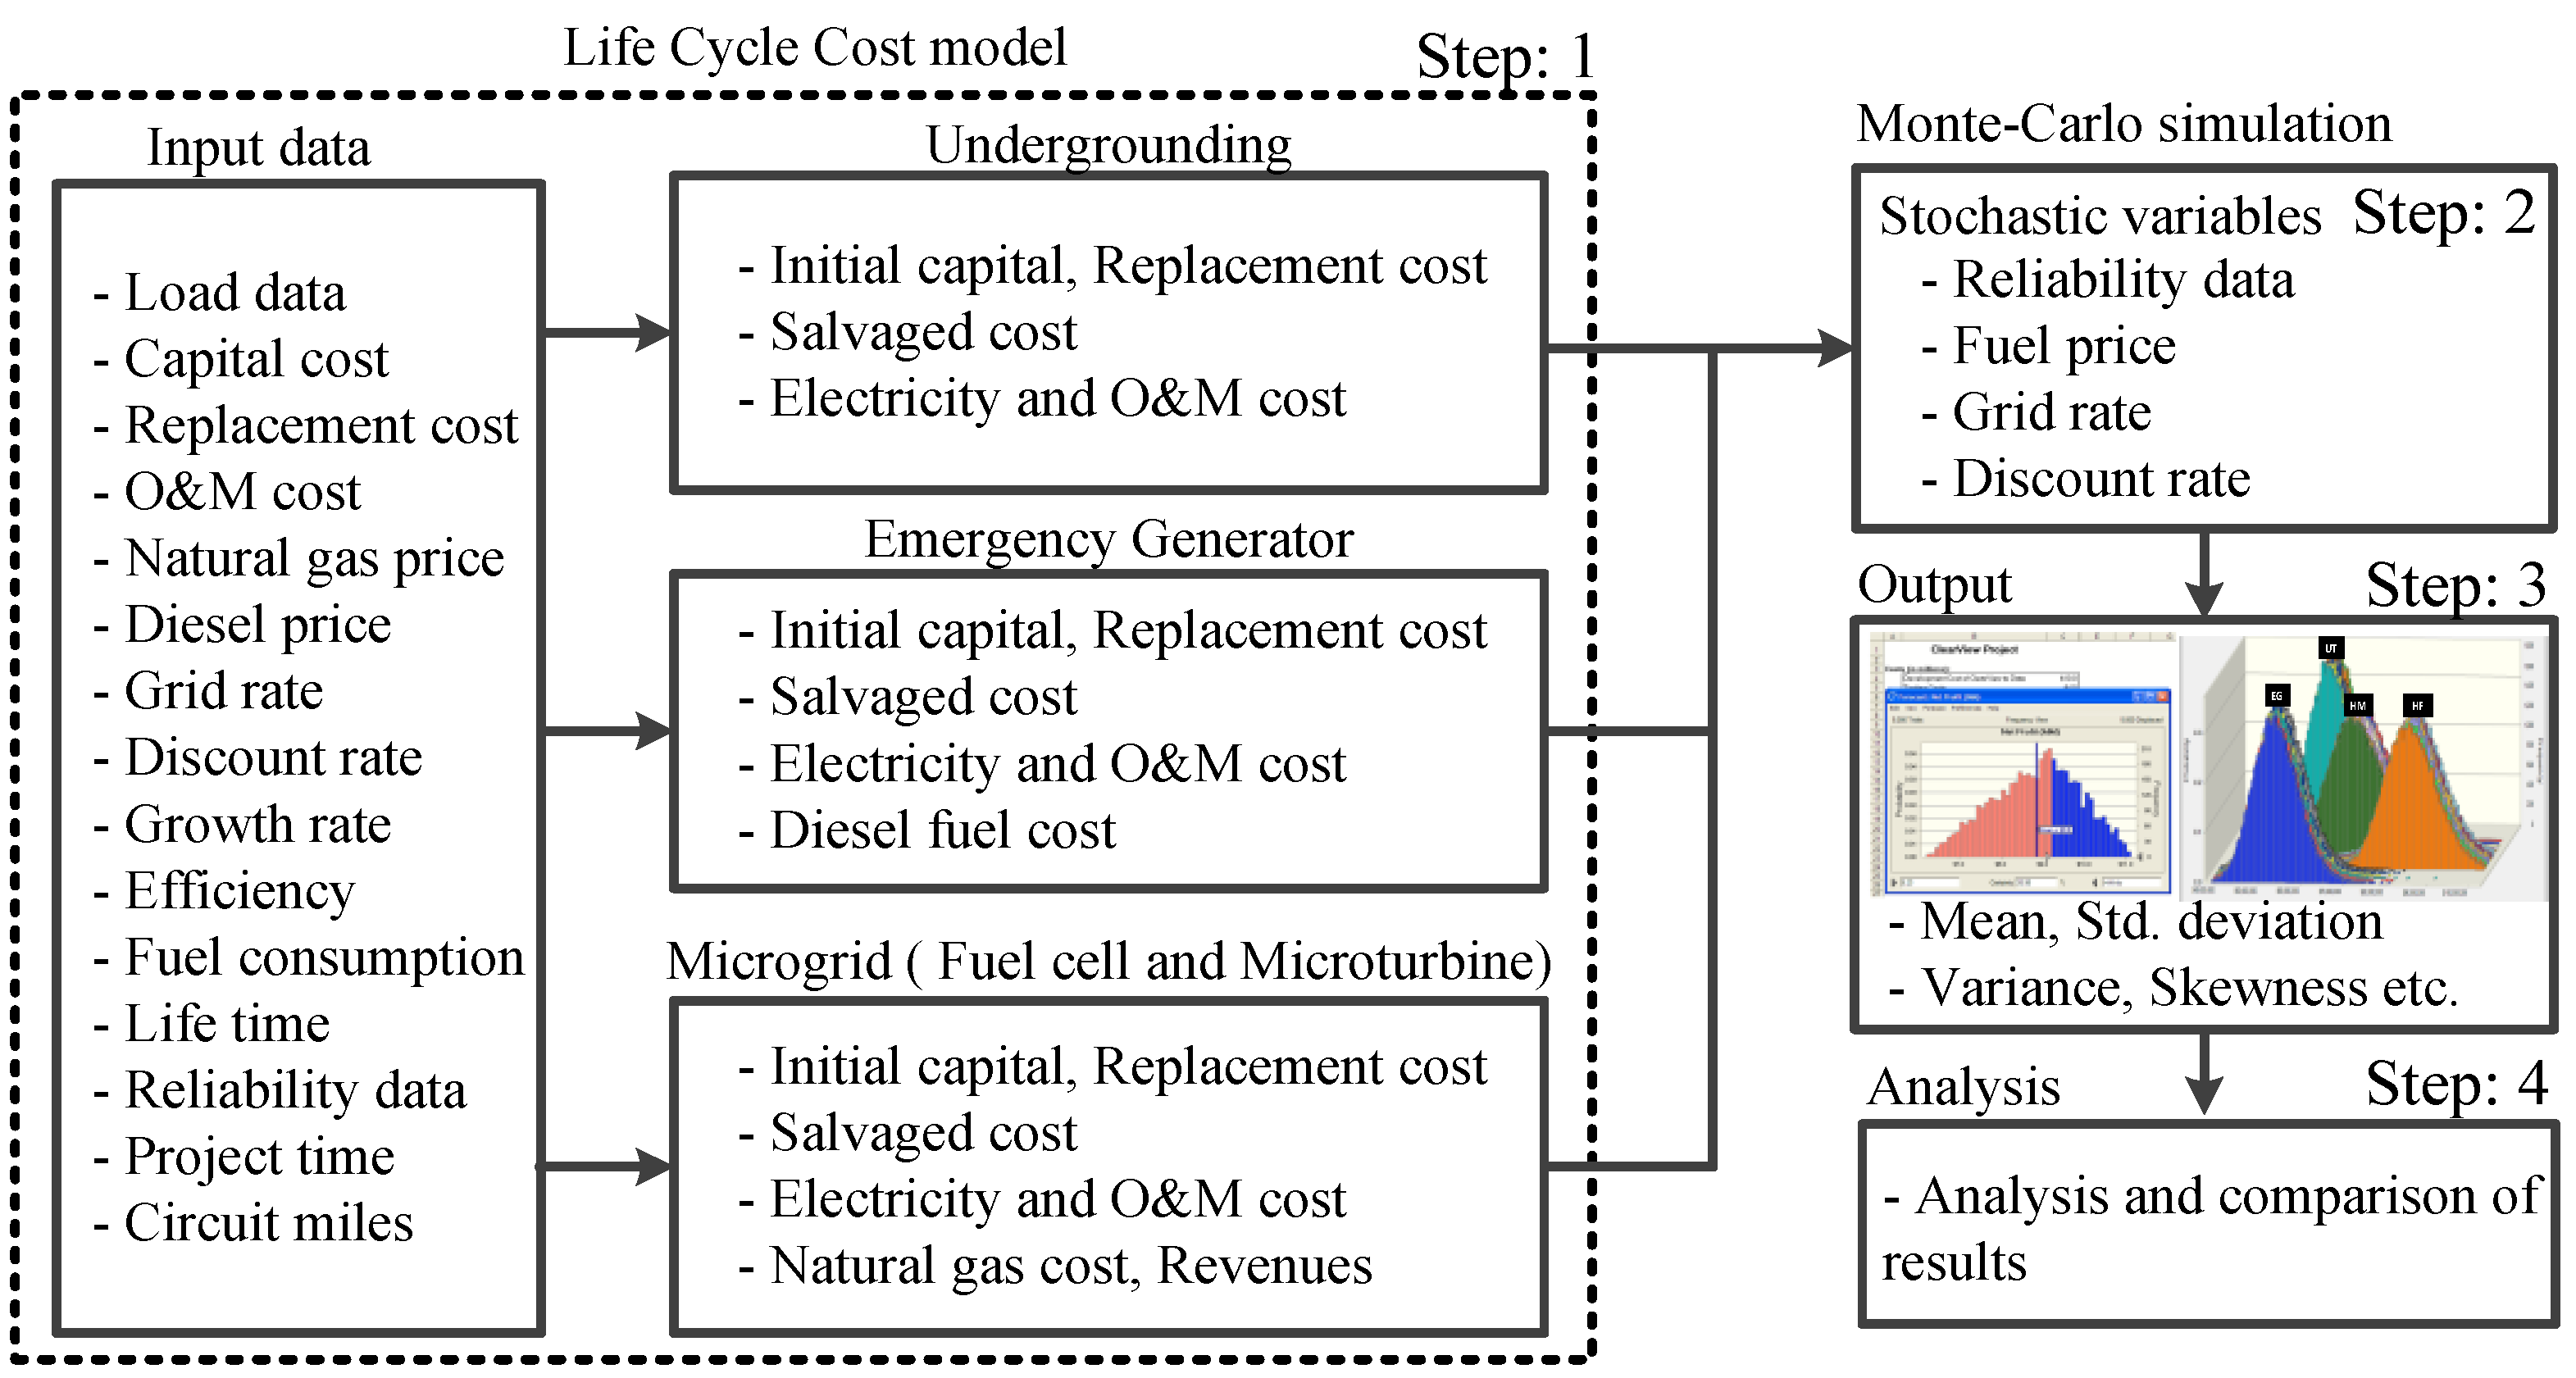
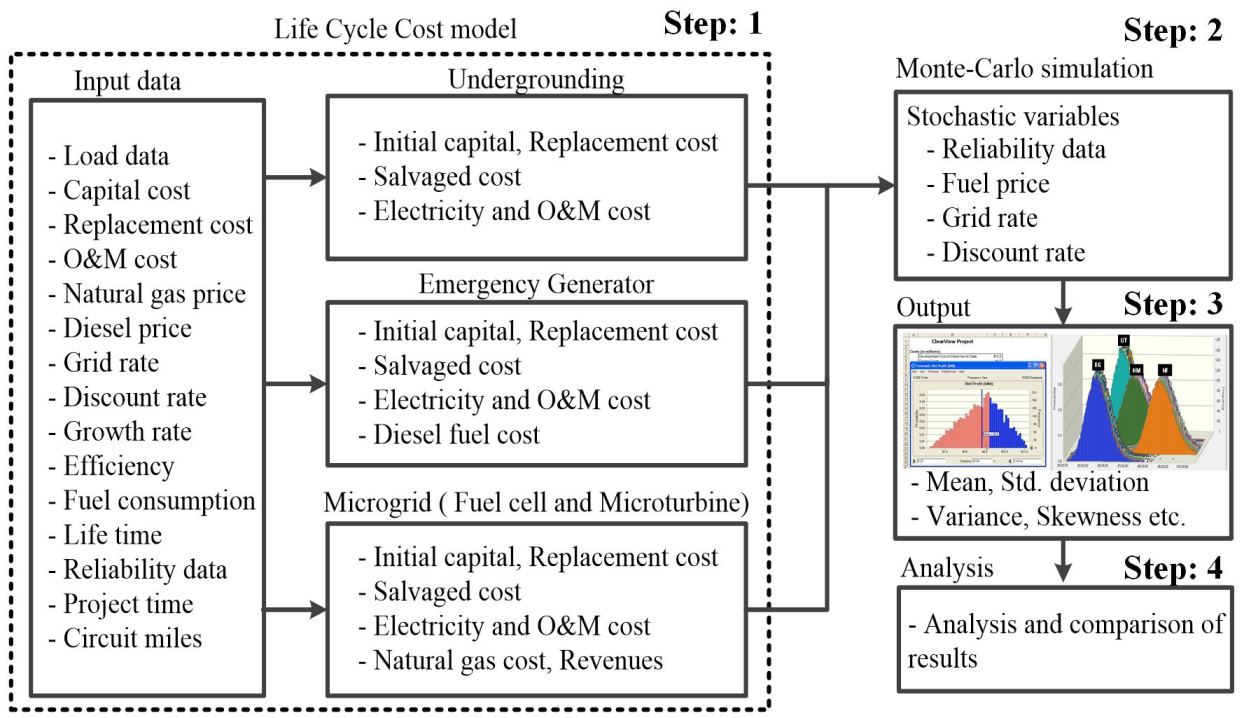
In order to provide a cost analysis of hardening options, the four steps shown in
Figure 1 and
Figure 2 in detail, were followed, along with three assumptions:
only electric loads are considered;
microgrid distributed generation sources are running all of the time; and
all generators are assumed to have a single interconnection point.
The main reason to assume the microgrid generators operate all of the time is to assess the benefit of selling electricity as excess power from the microgrid. If the total cost of electricity generation is cheaper than that of utility grid electricity, the economical values can be added. In the LCC analysis, if the peak load is changed to 50% load, then the operational cost will be reduced, but the initial capital cost will be the same. Since the portion of the capital cost is larger than the operating and maintenance (O&M) cost, the main results of LCC analysis will be similar to that of various load conditions.
In the first step, an excel spreadsheet based on the deterministic model is created through several formulas and assumptions for each operating system. In the second step, the deterministic model obtained in the previous step must be extended to a stochastic model. The input data, which includes the uncertainty of future values, such as fuel price, grid rate, and annual interest rate, needs to be defined in this step. In the third step, a Monte Carlo simulation is executed to get the range of possible outcomes from the input data’s minimum and maximum forecasted values and to analyze the critical factors affecting the total cost of power system hardening. Finally, Steps 1–4 are repeated for each selected town.
An assumption which is made is that reliability data concerning hardening options such as grid rate (buying and selling), natural gas price, diesel price, and annual net discount rate (discount rate − growth rate) are selected randomly from the predefined probability distributions. The probability density function of these inputs, with their mean and variance, can be defined as:
Since deriving exact probabilistic LCC formulas with multiple random variables may be complicated, a Monte Carlo simulation is applied to estimate the probabilistic LCC. As the number of trials approaches infinity, the simulation output approaches the probabilistic LCC formula.
4. Case Study
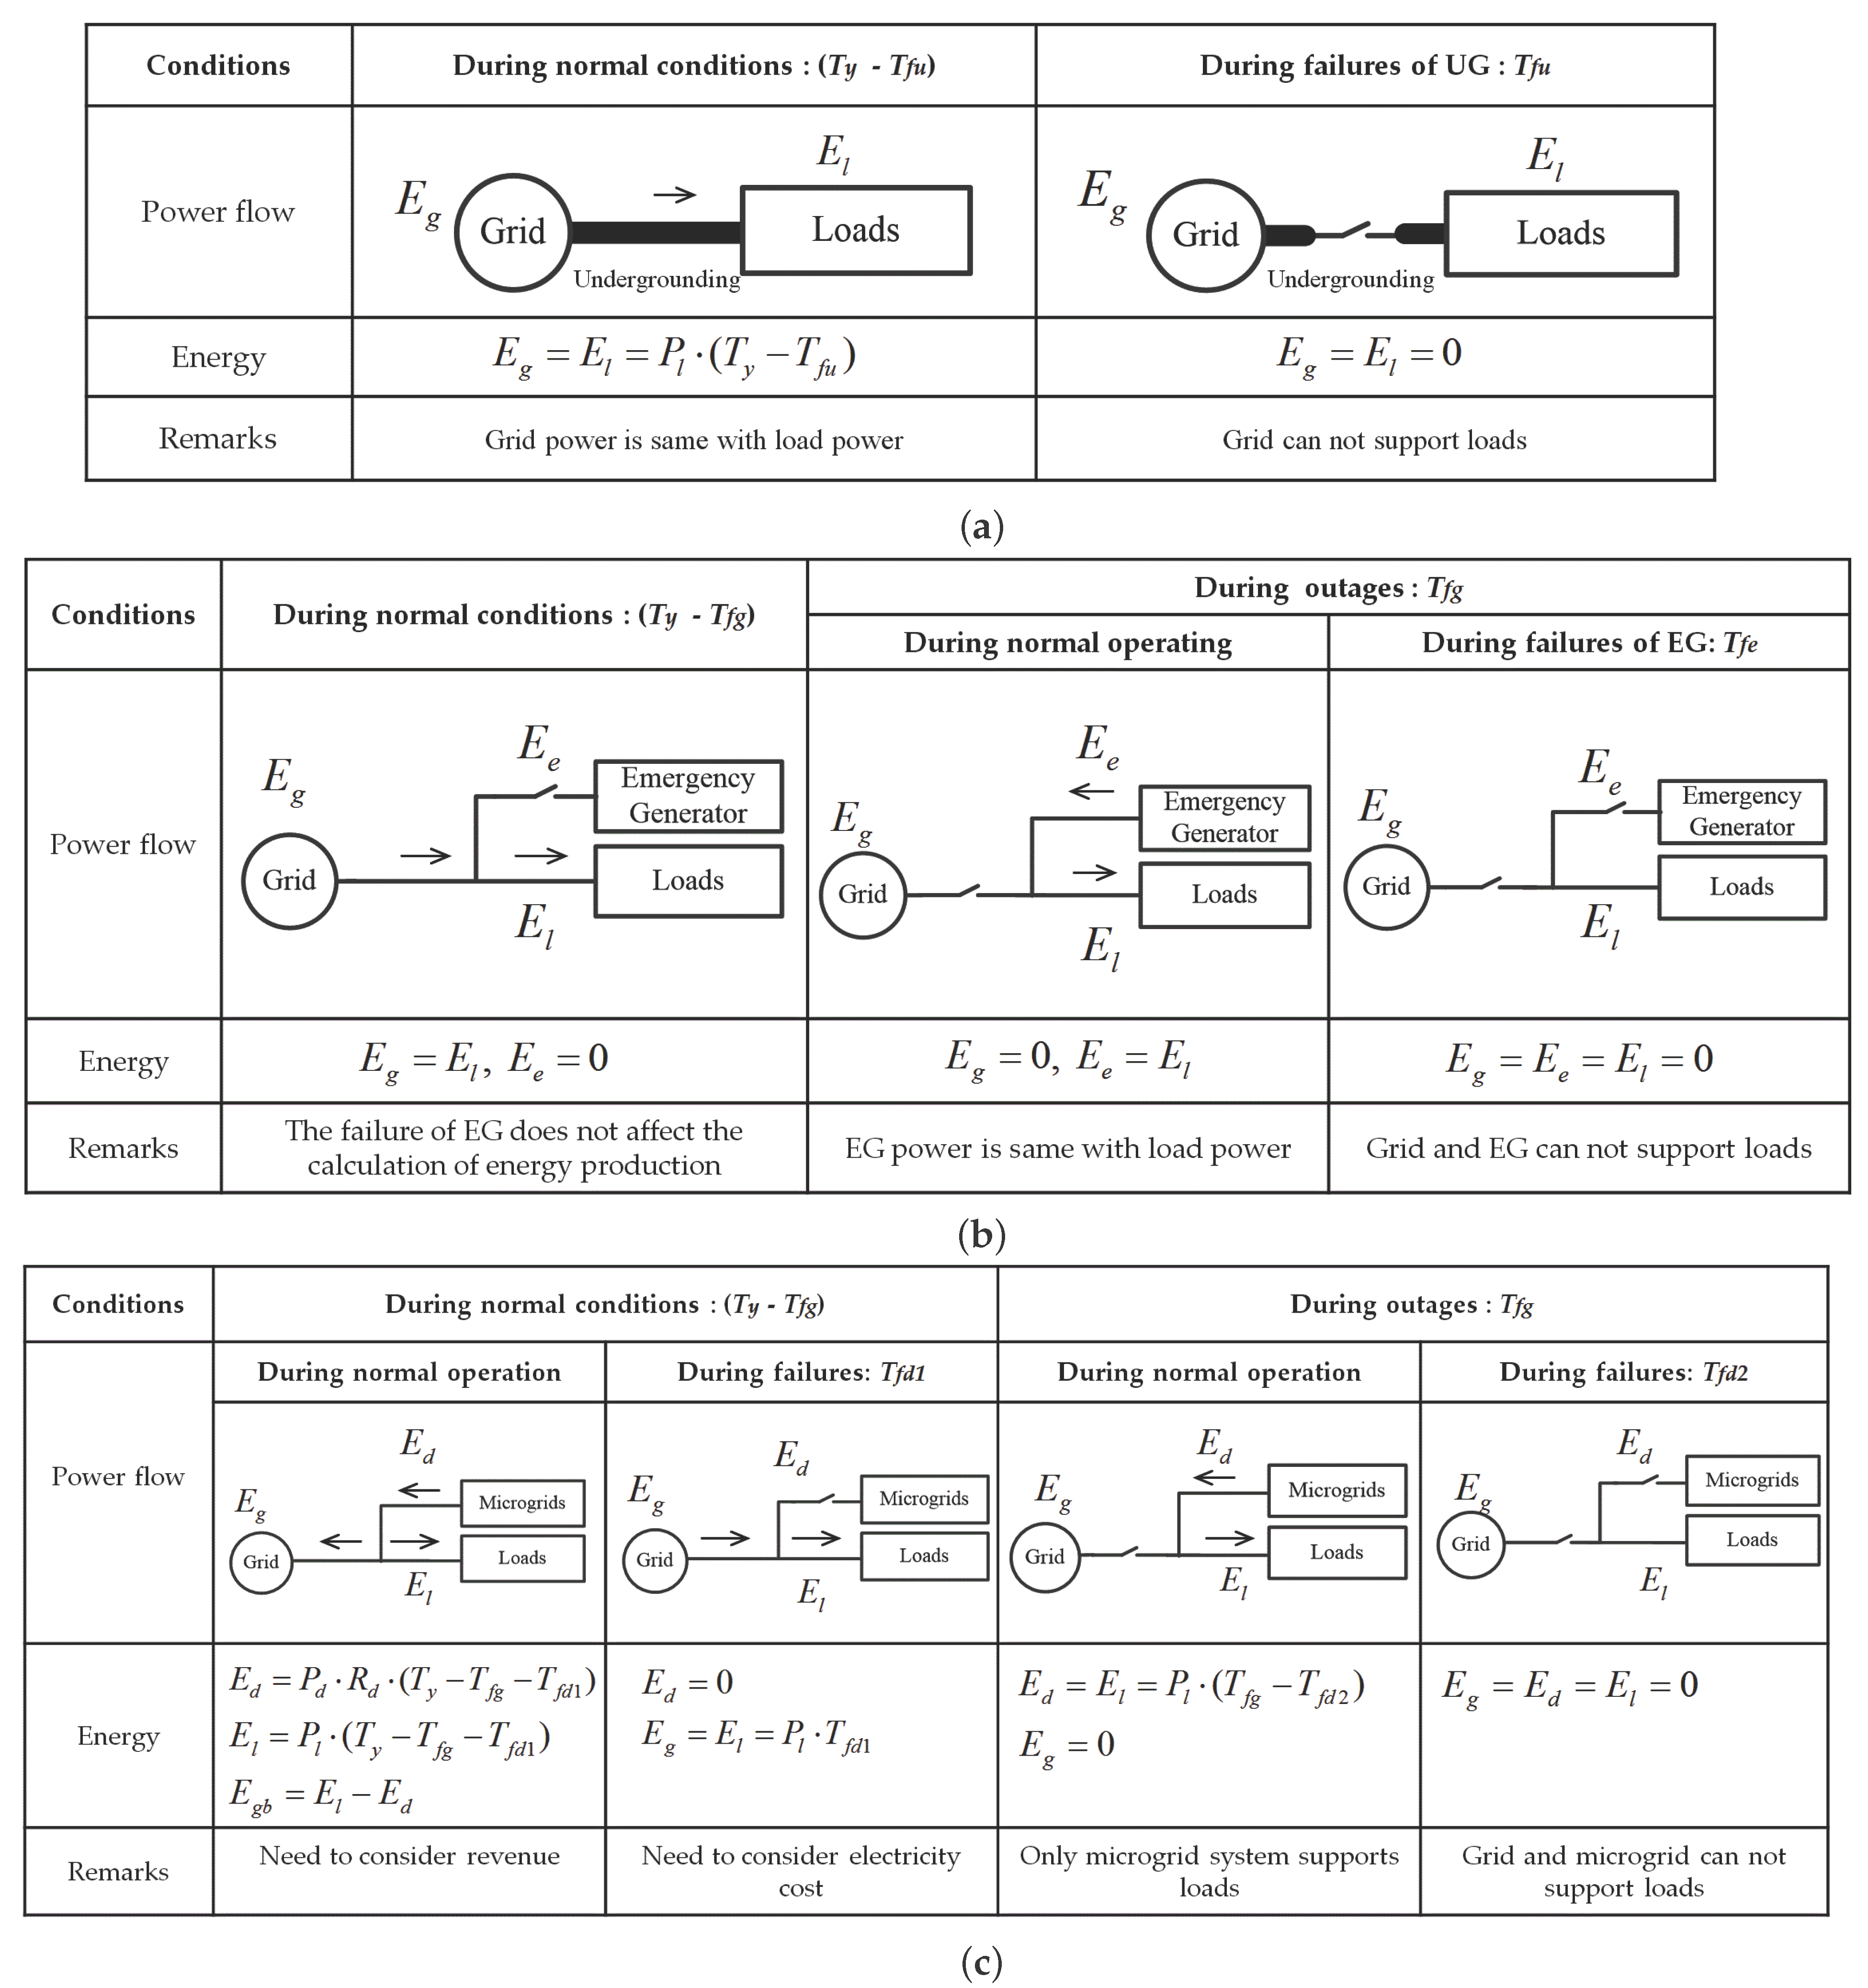
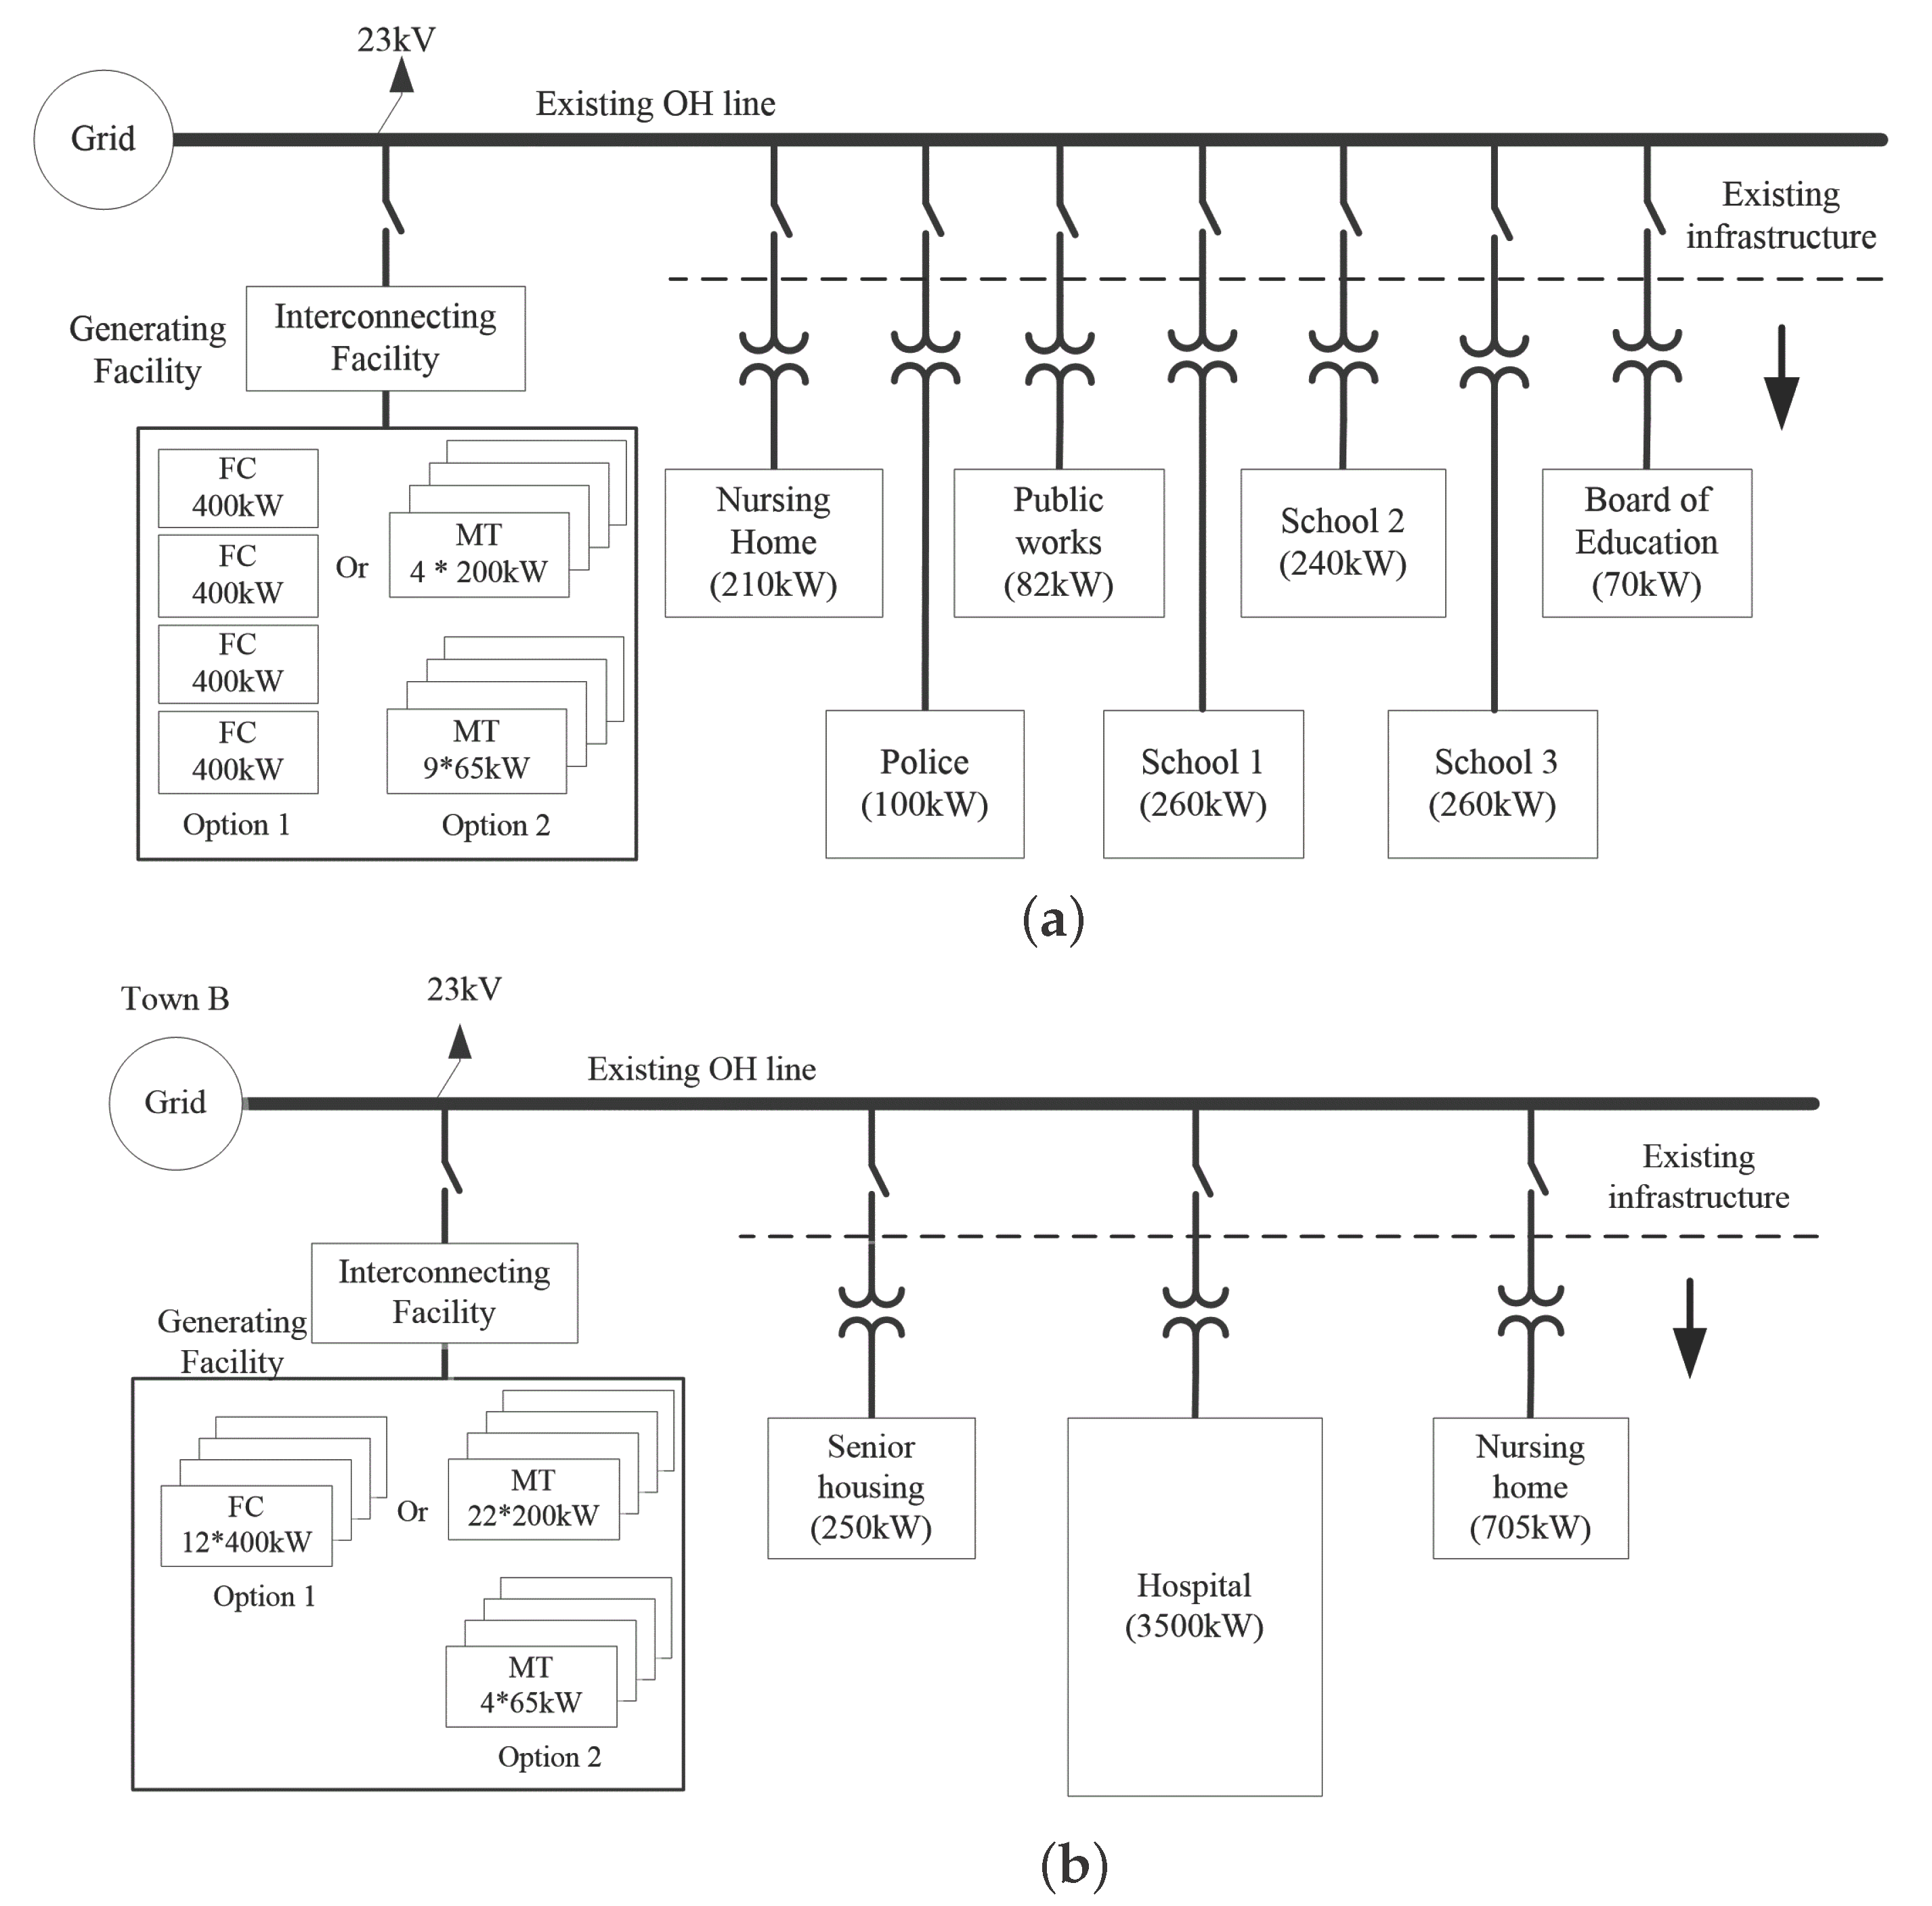
Three hardening options were evaluated using the proposed LCC model for selected two towns (A and B) with several critical facilities, such as hospitals, police stations, schools, nursing homes, and emergency shelters, where the microgrid configuration in
Figure 4 exists.
Critical facilities will depend on many factors, such as location, state of the distribution network, distance to substation, availability of gas, etc. We consider four hardening options for critical loads: FC, MT, UG, and EG systems. For microgrid options, FC and MT systems which are fueled by natural gas are considered. This is because the preferences of photovoltaic or wind power systems are highly dependent on intermittent factors, such as weather, location, and season.
For Town A, the total power of critical loads, which has FC systems consisting of four parallel 400 kW units, MT systems consisting of nine parallel 65 kW units, and four parallel 200 kW units, for a total of 1222, 1600, and 1385 kW, respectively. For UG systems, the distance between substations to the critical load is 8.8 miles, whereas Town B has critical loads of 4455 kW, FC systems consisting of 12 parallel 400 kW units, and MT systems consisting of four parallel 65 kW units and 22 parallel 200 kW units. For UG systems, the distance between substations to the critical load is 4.4 miles. Regarding to available power capacities of microgrid options, we selected the minimum number of commercial distributed generator (DG) units, even though the total power of FC and MT are higher than the actual load. Additionally, it is worthwhile to indicate that the overall power system capacity of critical facilities in Town B is much higher than that of Town A.
4.1. General Input Data
Table 1 shows the general input data used for estimating LCC of hardening options in this paper [
17,
18,
19,
20,
21,
22]. The initial capital costs of UG were quoted by the utility company.
The total costs of interconnecting facilities to connect the FCs or MTs with high-voltage lines (23 kV) in Town A and Town B are $5,701,584 and $3,957,640, respectively, and will be added with the initial capital cost of the generator unit.
4.2. Probabilistic Input Data
4.2.1. Reliability Data of Hardening Options
The reliability indices of hardening options under category-3 weather conditions shown in
Table 2 and
Table 3 are used for interruption hours by failures of hardening options.
These reliability indices were obtained by applying a distribution evaluation method, which combines Sequential Monte Carlo simulation with the wind storm classification based on the National Oceanic and Atmospheric Administration’s Atlantic basin hurricane database (HURDAT) [
23].
4.2.2. Discount Rate and Growth Rate
One estimate of the discount rate, the regulated cost of capital, is 7.68% [
24]. Another estimate is the social discount rate. A component, the real social discount rate, is 7% [
25]. The long-term inflation rate estimate ranges between 1.6% and 2%, with an average of 1.8%, yielding a range between 8.6% and 9% for the social discount rate. Thus, we assume a lognormal discount rate with a mean of 8.6% and a typical range of 9% − 7.68% = 1.32%. We conservatively assume that the typical range approximates 2 × σ [
26], resulting in a standard deviation of 0.66%. The growth rate is assumed to be equal to the long-term inflation rate. Its lognormal distribution has a mean of 1.8% and a standard deviation of 0.2%.
4.2.3. Grid Rate
For the years 2010, 2015, 2020, 2025, 2030, and 2035, the price forecasts are (in cents) 5.9, 6.0, 6.7, 7.7, 8.7, and 10.2 [
19]. Between the years, a growth rate of 2.2% is applied. Each price is used as the mean to a lognormal distribution for that year. The standard deviation estimate is 2.15 cents. We assume that selling and buying prices are the same.
4.2.4. Natural Gas Price
The natural gas prices (in $/m
3) are 0.121, 0.141, 0.152, 0.158, 0.165, 0.171, 0.179, and 0.188 for the years 2013–2020 [
27]. It is assumed to be log-normally distributed with a mean of 0.188 every year afterward and a standard deviation of 0.034.
4.2.5. Diesel Price
The diesel prices are (in $/L) are 0.7754, 0.7542, 0.7542, 0.7542, and 0.7542 for 2013–2017 [
28]. It is assumed to be log-normally distributed with a mean of 0.7542 every year afterward and a standard deviation of 0.0106.
4.3. Monte Carlo Simulation Results
Oracle crystal ball (Oralcle Corporation/Crystal Ball, Redwood, CA, USA) was used for Monte Carlo simulations.
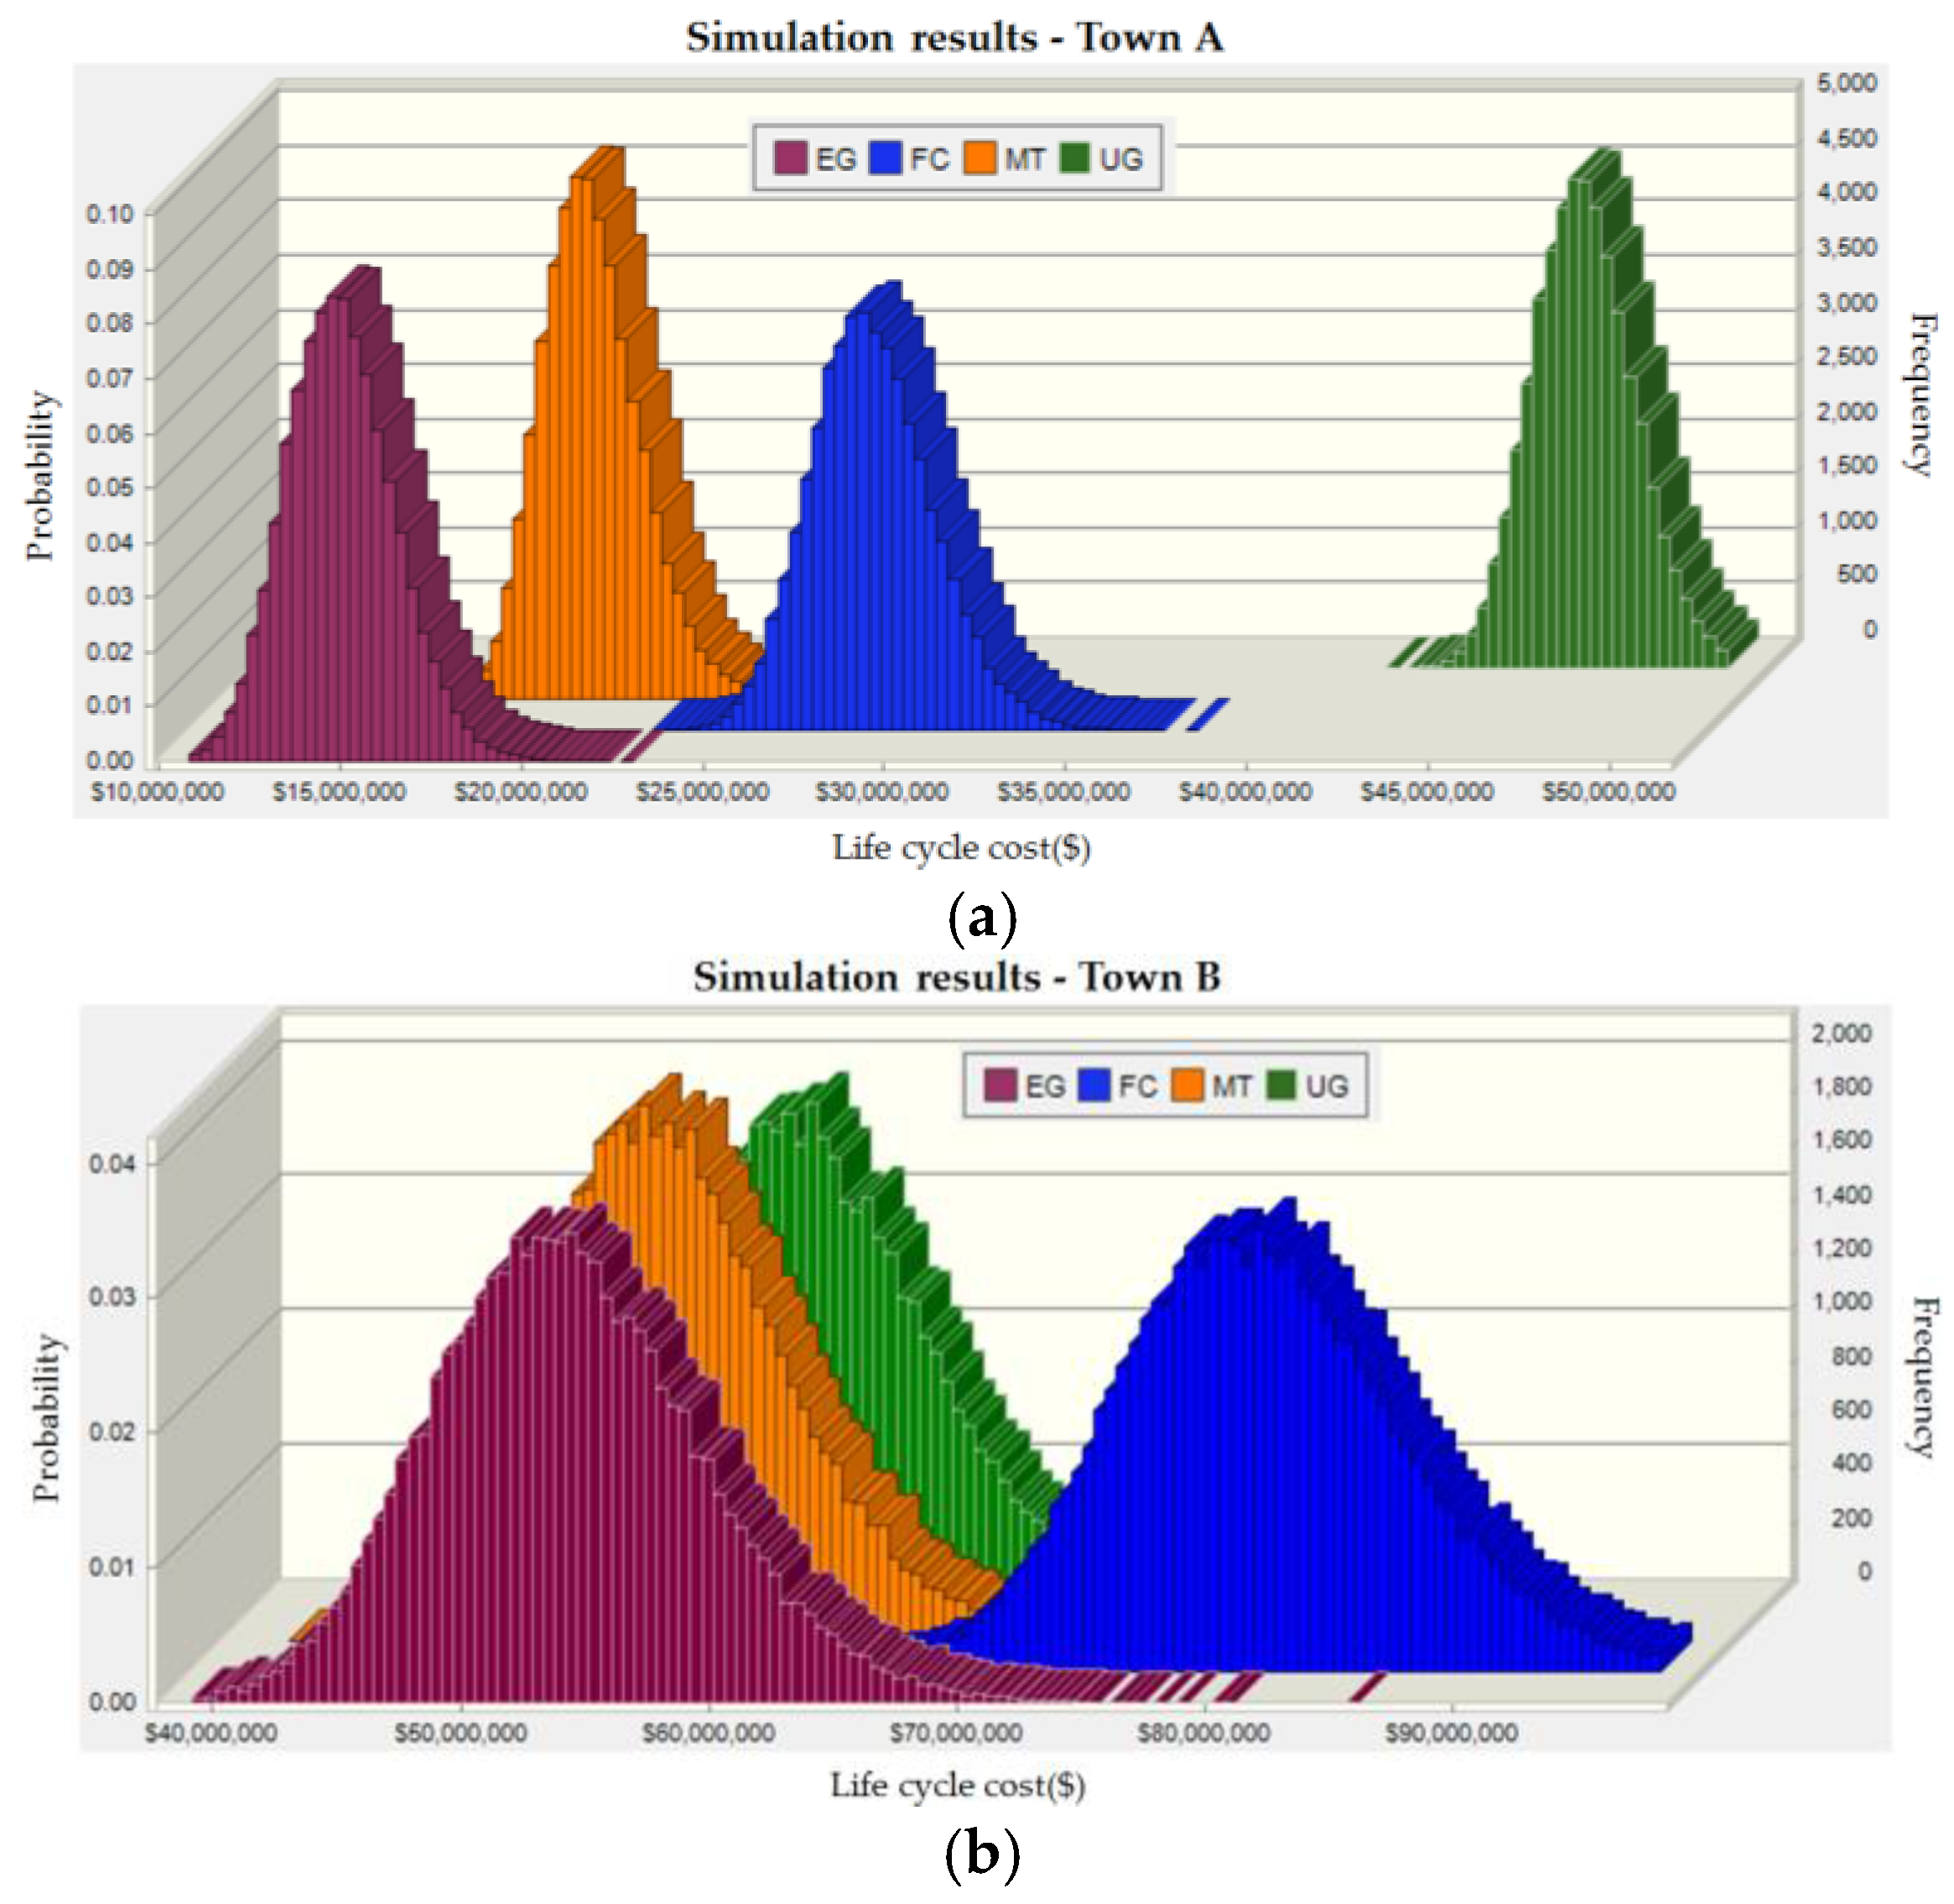
Figure 5 shows the overlaid graph of LCC of hardening options with probability density.
Table 4 and
Table 5 summarize simulation results of LCCs and the rankings of hardening options for the two selected towns.
For Town A in
Figure 5, EG has the lowest LCC to harden the critical power loads due to its low initial capital cost. However, the LCC of EG may significantly increase as the duration of the power outage increases because the operating cost by diesel fuel is higher than that of other hardening options. The UG has low O&M and electricity generation costs, but was less attractive due to its high initial capital cost. The MT can be a favorable alternative solution among other microgrid-distributed generation options because its capital and operating costs are competitive when compared to photovoltaic, wind turbine, and FC systems. The FC has a high initial and replacement cost, in spite of its high efficiency and being an environmentally friendly system. However, the benefits of the FC will be increased if its social or environmental benefits are considered.
For Town B in
Figure 5, the EG has the lowest LCC due to lower capital and annual operating costs like Town A, but its LCC is not significantly lower than that of other options. The MT is also an attractive hardening option owing to low generation cost of electricity for higher critical load power. The initial capital cost of UG is relatively lower than that of Town A due to a shorter circuit mile and lower construction cost, which will be highly dependent on geographic location of the town. As a result, the order of the low cost of hardening options is changed slightly and the distribution of the cost in Town B is much more overlapped than that of Town A.
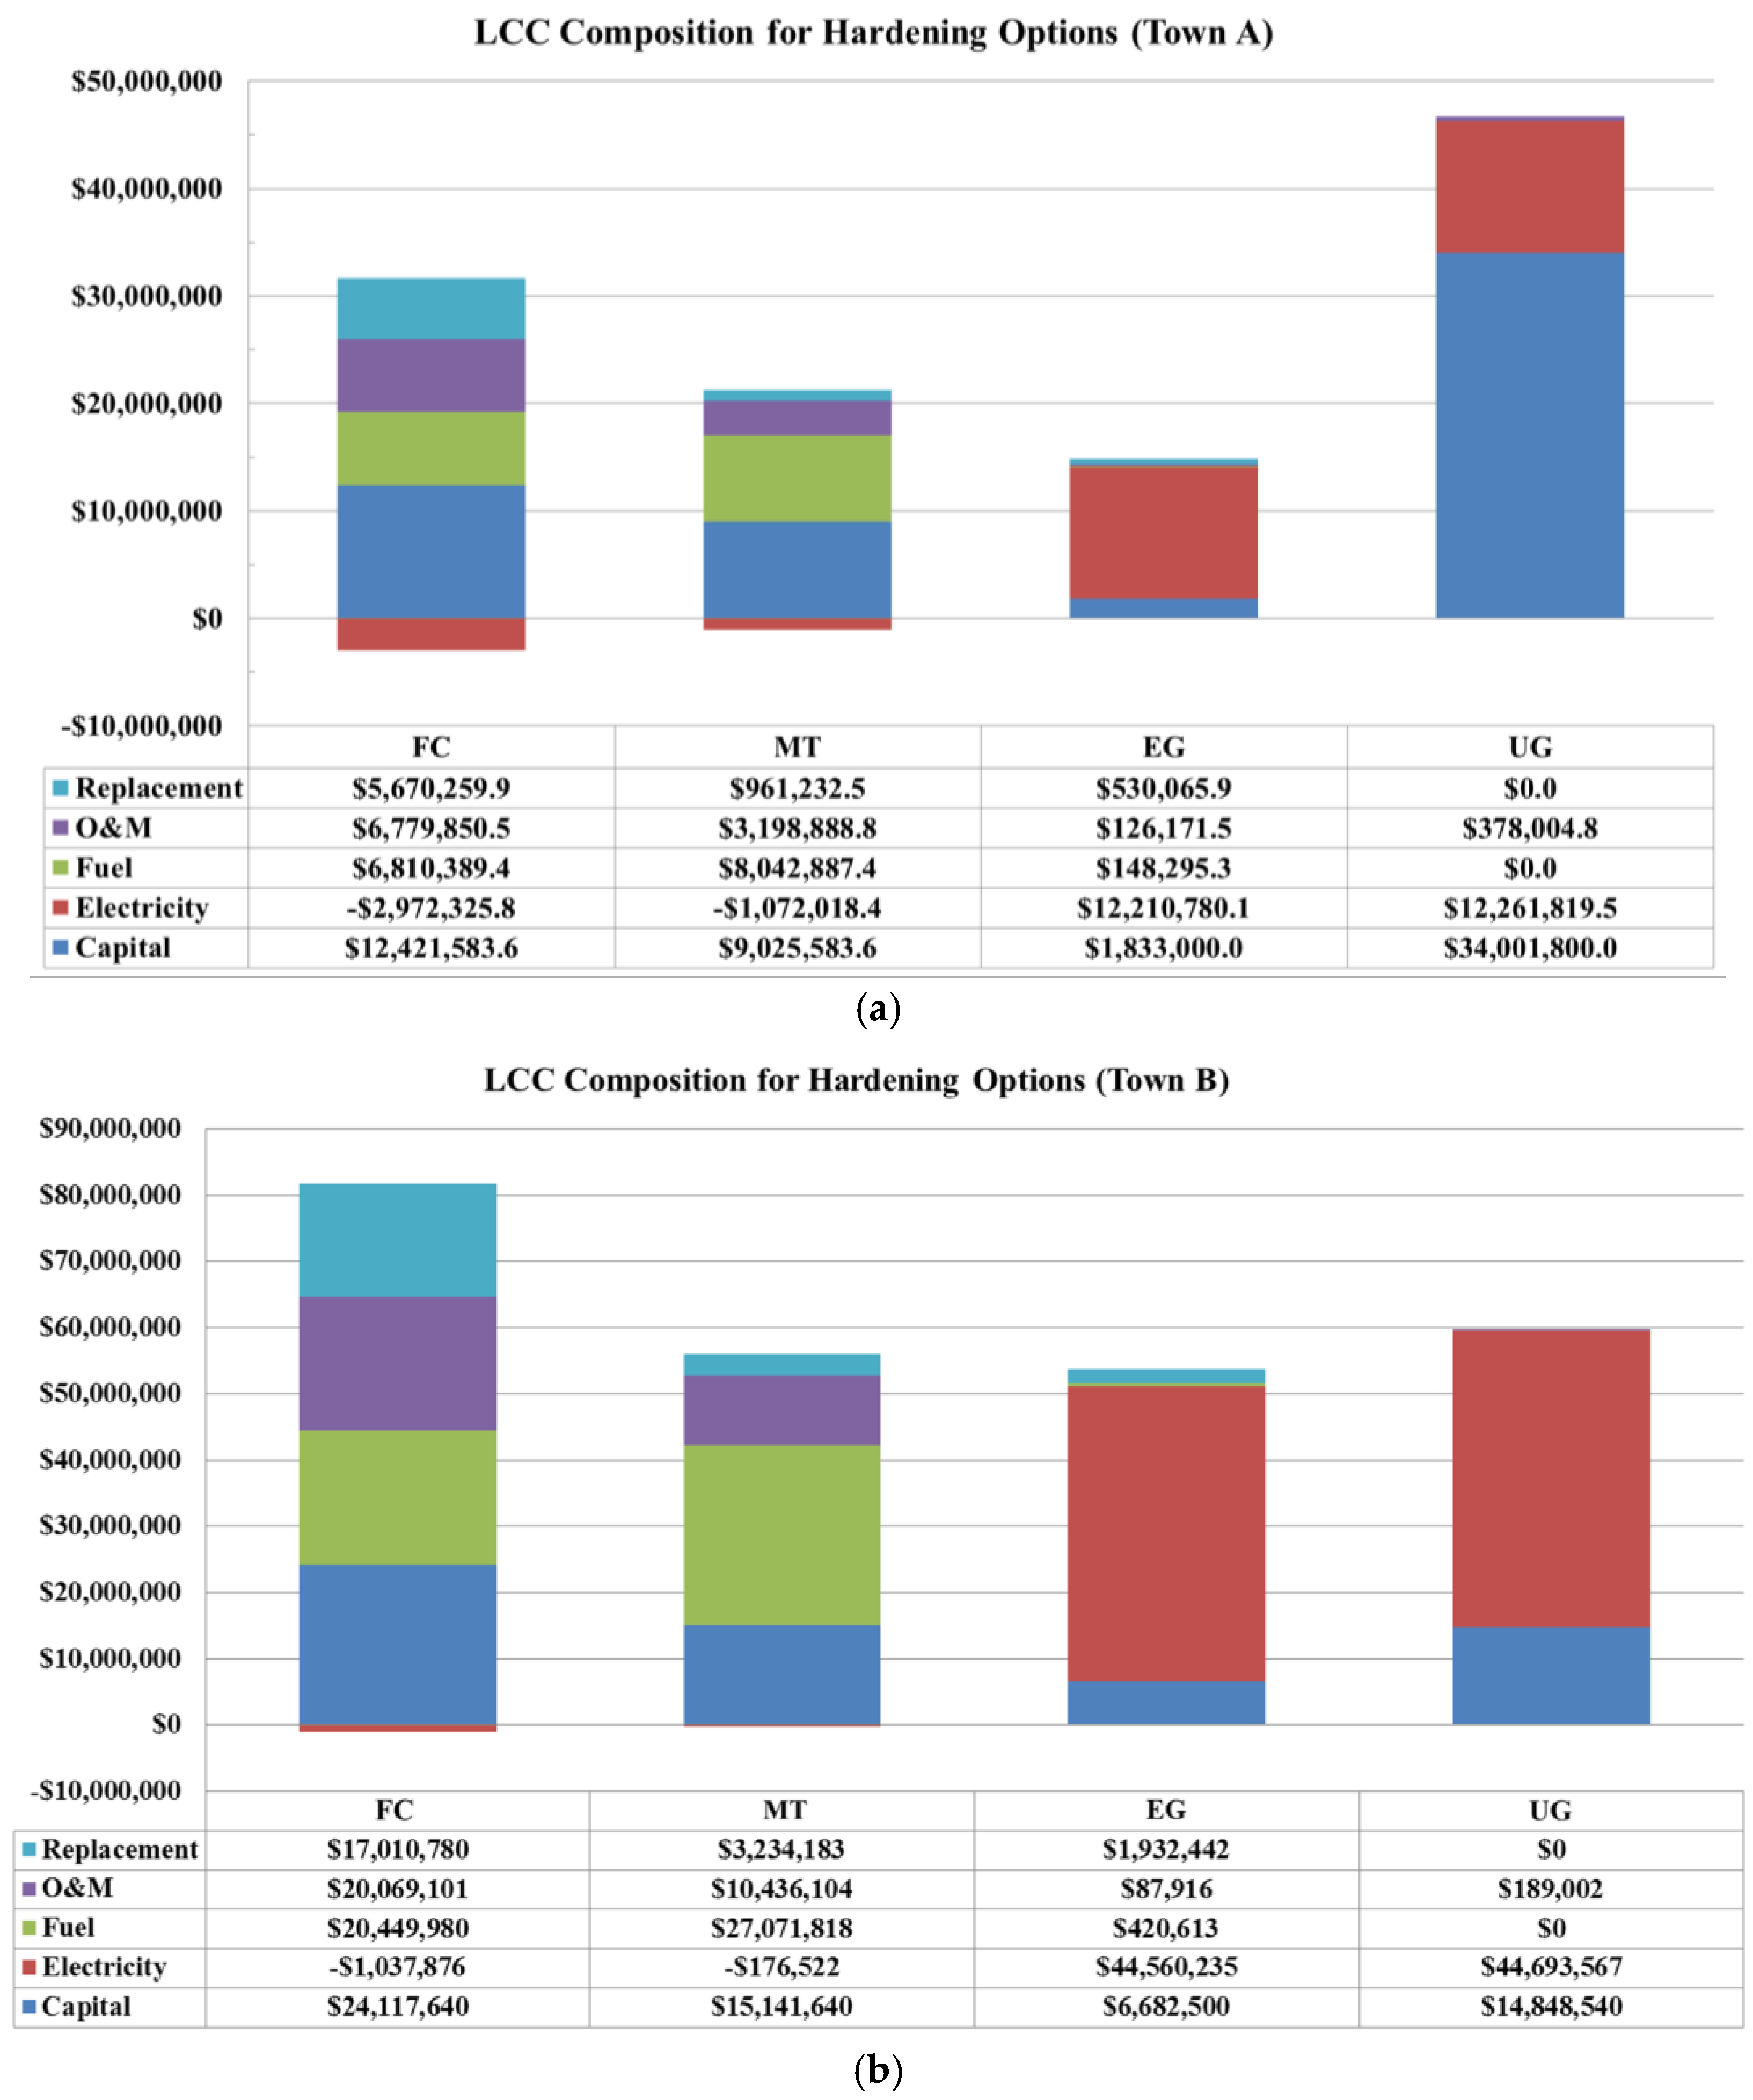
Figure 6 shows LCC compositions for hardening options. For Town A, the FC and MT options acquire revenue by selling power back to the grid due to their high power capacity, but the FC has high initial, operating, and replacement costs, whereas the MT has a high fuel cost due to its low efficiency. The UG has the highest initial capital cost, which increases its LCC. The initial capital cost of the EG is much less than that of the other options, resulting in the lowest LCC.
For Town B in
Figure 6, the revenue of microgrid options is low because the power capacity is close to the total load. The FC suffers from high initial, operating, and replacement costs due to higher power capacities of critical facilities, resulting in a high LCC. It is noticeable that the MT, EG, and UG have a similar LCC. The initial capital cost of the UG is lower than that of the microgrid options, resulting in a better rank than that of Town A.
It is worthwhile to mention that the results of the analysis may be different depending on whether the facilities of hardening options are utility-, publicly-, or privately-owned and whether they are self-financed. For the case of microgrid projects in Connecticut, USA, the ownership of FC, EG, and MT to critical loads typically comes from the towns or university while the state grants the interconnection and engineering costs. Considering the economic aspects only, the utility company would prefer EG to UG, but many towns may not want to possess a diesel generating facility located in their town center.
In this case study, the dispatch controller, which decides the optimal moment to purchase or sell energy to the grid in order to run the system at the lowest possible cost, is not considered for a simple cost model structure. However, the levelized cost of energy (LCOE, dollar/kWh), which is a measure of a power source to compare different methods of electricity generation, is calculated from the total annualized cost and the generated power both from microgrid and power grid. As a result, the LCOE of FC and MT at Town A are 0.151 and 0.121, respectively. For Town B, the LCOE of FC and MT are 0.141 and 0.099, respectively. These values can be employed for the economic dispatch by comparing the LCOE with variable grid rates.


 ,
, 


