1. Introduction
With the current increase of distributed renewable energies generators (such as rooftop photovoltaic power) in electrical grids, and more affordable energy storage systems (ESS), it is becoming much more viable to match individual demand for electricity with on-site photovoltaic (PV) production [
1,
2,
3]. In the case of residential installations, the use of ESS for short-term management of supply—i.e., allowing the shift of PV energy to higher consumption periods (such as the evening peak or at night)—could increase self-consumed electricity from 30% to 70% [
4,
5,
6].
To allow this increase, a battery must be integrated in the grid-connected PV system and an
ad-hoc energy management strategy (EMS) must be implemented in a control unit that correctly manages the electricity flow between the PV generator, the battery, and the grid. In recent years, several EMSs focused on the maximization of the self-consumption of on-site-produced PV electricity have been presented [
7,
8,
9,
10], in which they assert that this strategy is useful and economically viable, even without feed-in-tariffs.
This EMS requires a reliable and efficient battery technology with a low power/energy ratio, such as the Vanadium Redox Flow Batteries (VRFB). This promising technology has as main advantages the decoupling of power and capacity, a very long lifetime (reported as above 10000 cycles, or 25 years of operation), very low maintenance, and deep discharge capability (almost 100.0%) [
11]. Very few batteries of this kind exist in laboratories, especially at such a scale that allows real-life test conditions, so the investigation of these batteries is mostly done with simulations (and sometimes in small lab battery cells) [
12,
13]. In order to test the performance of this kind of EMS, a real-scale VRB demonstrator was built in the University of Évora, part of the FP7 PVCROPS European project [
14]. This demonstrator consists of a PV generator of 6.74 kWp, a PV inverter of 10 kW, a battery inverter of 7.4 kW, and a VRFB of 60 kWh. The main objective of this paper is to present the results of the validation tests of the self-consumption energy management strategy mentioned above and to show its suitability for building integrated PV applications. Useful conclusions for the future operation of these kinds of systems are also discussed.
2. Real-Scale VRFB Demonstrator
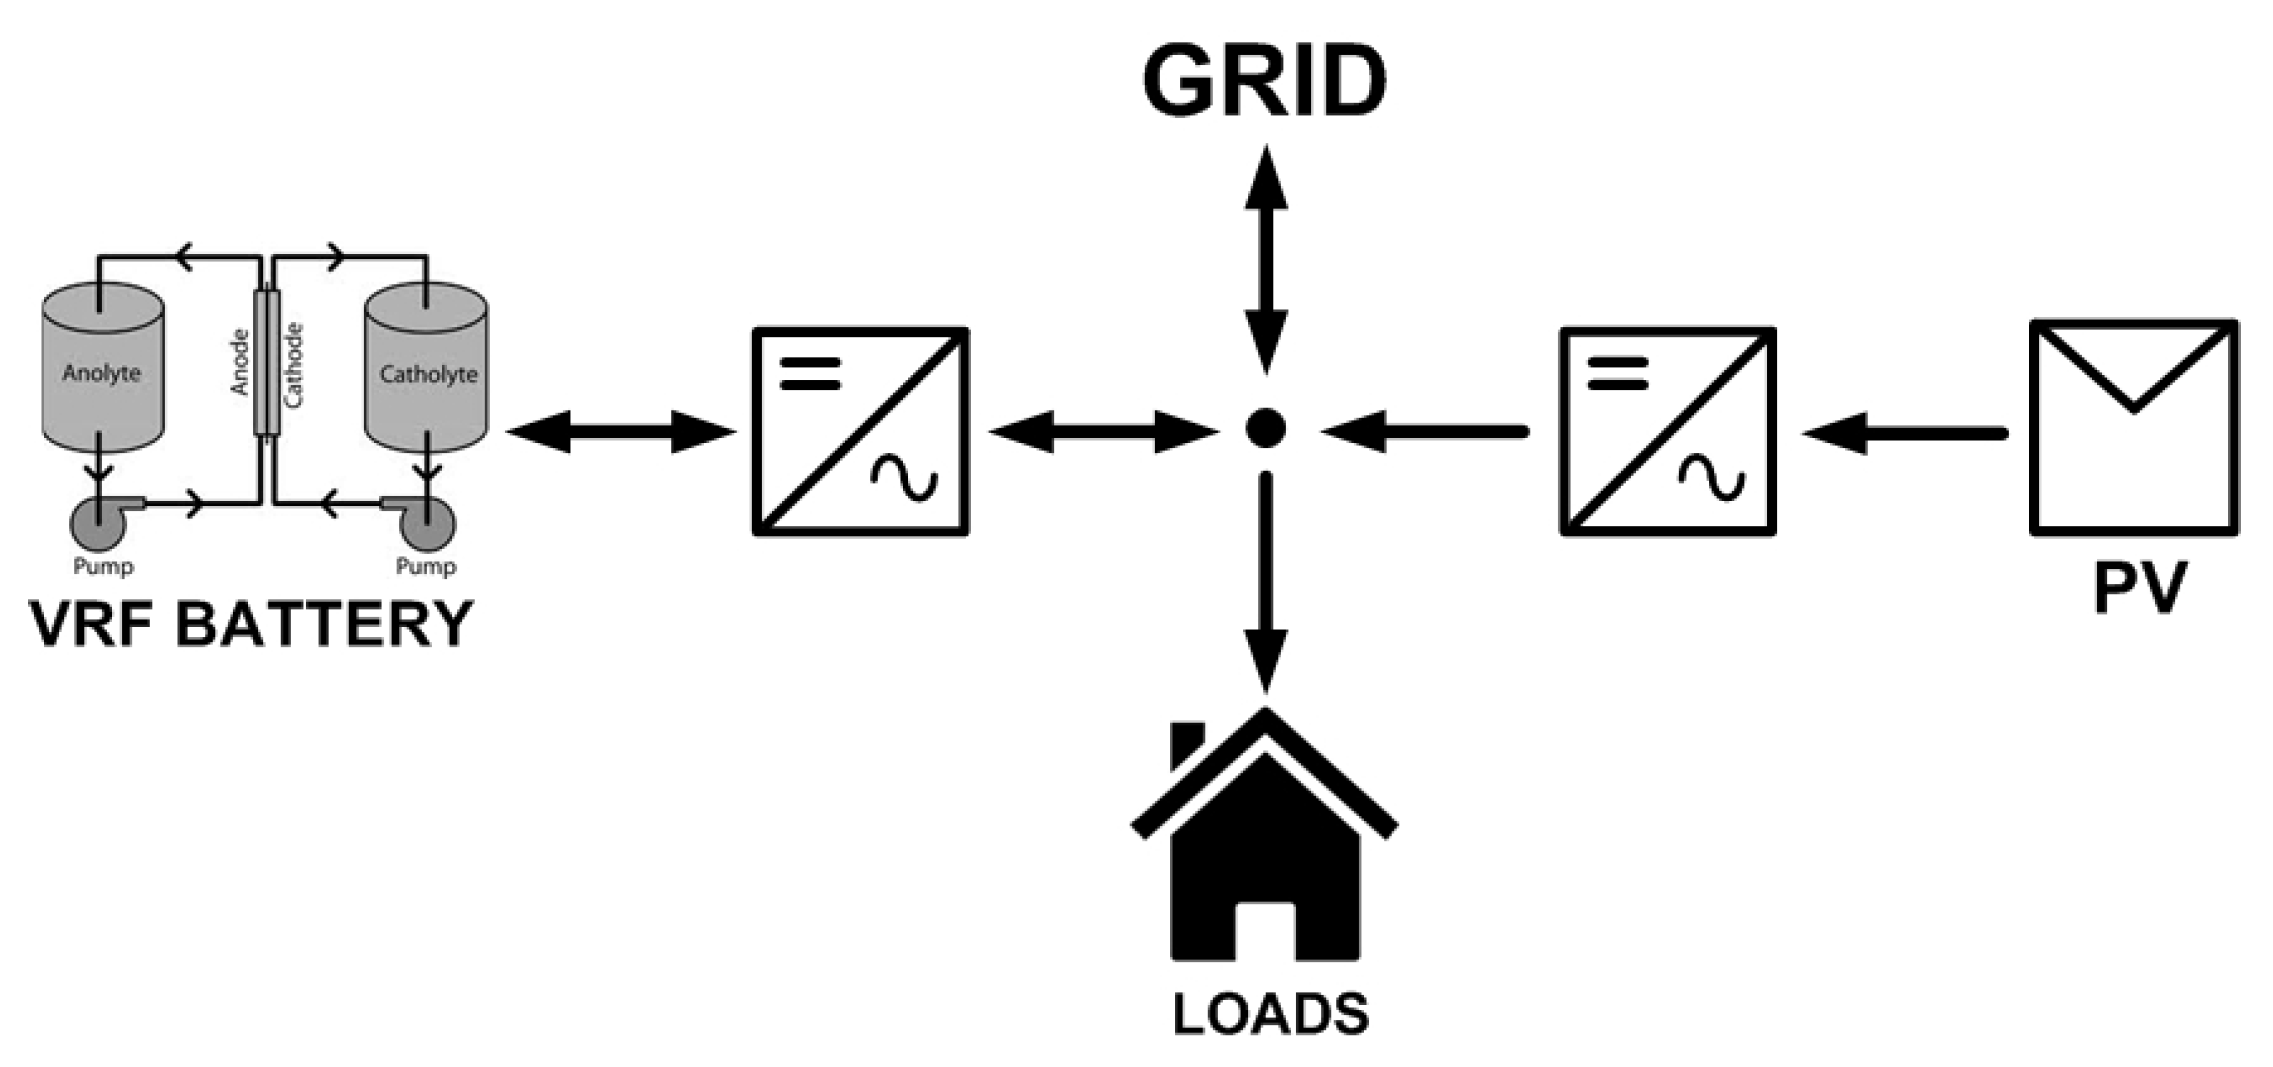
The methodology used in this paper is based on the implementation of a real-scale demonstrator, installed at the University of Évora (Portugal). It consists of a rooftop mounted PV system (BIPV) and an electrical storage system (Vanadium Redox Flow battery), both connected to a building, which in turn is connected to the public electric grid (see
Figure 1).
2.1. Equipment
The BIPV system is composed of two strings, a 3.24 kWp of monocrystalline PV panels and 3.5 kWp of polycrystalline cells, connected to a three-phase power inverter [
15] with two independent maximum power point tracking (MPPT), connected to the building AC power grid. The energy storage is provided by a Vanadium Redox Flow Battery with 5 kW nominal power and 12 h storage [
11], providing a total capacity of 60 kWh. The battery is also connected to the triphasic AC grid by three synchronized inverters (one per phase) [
15].
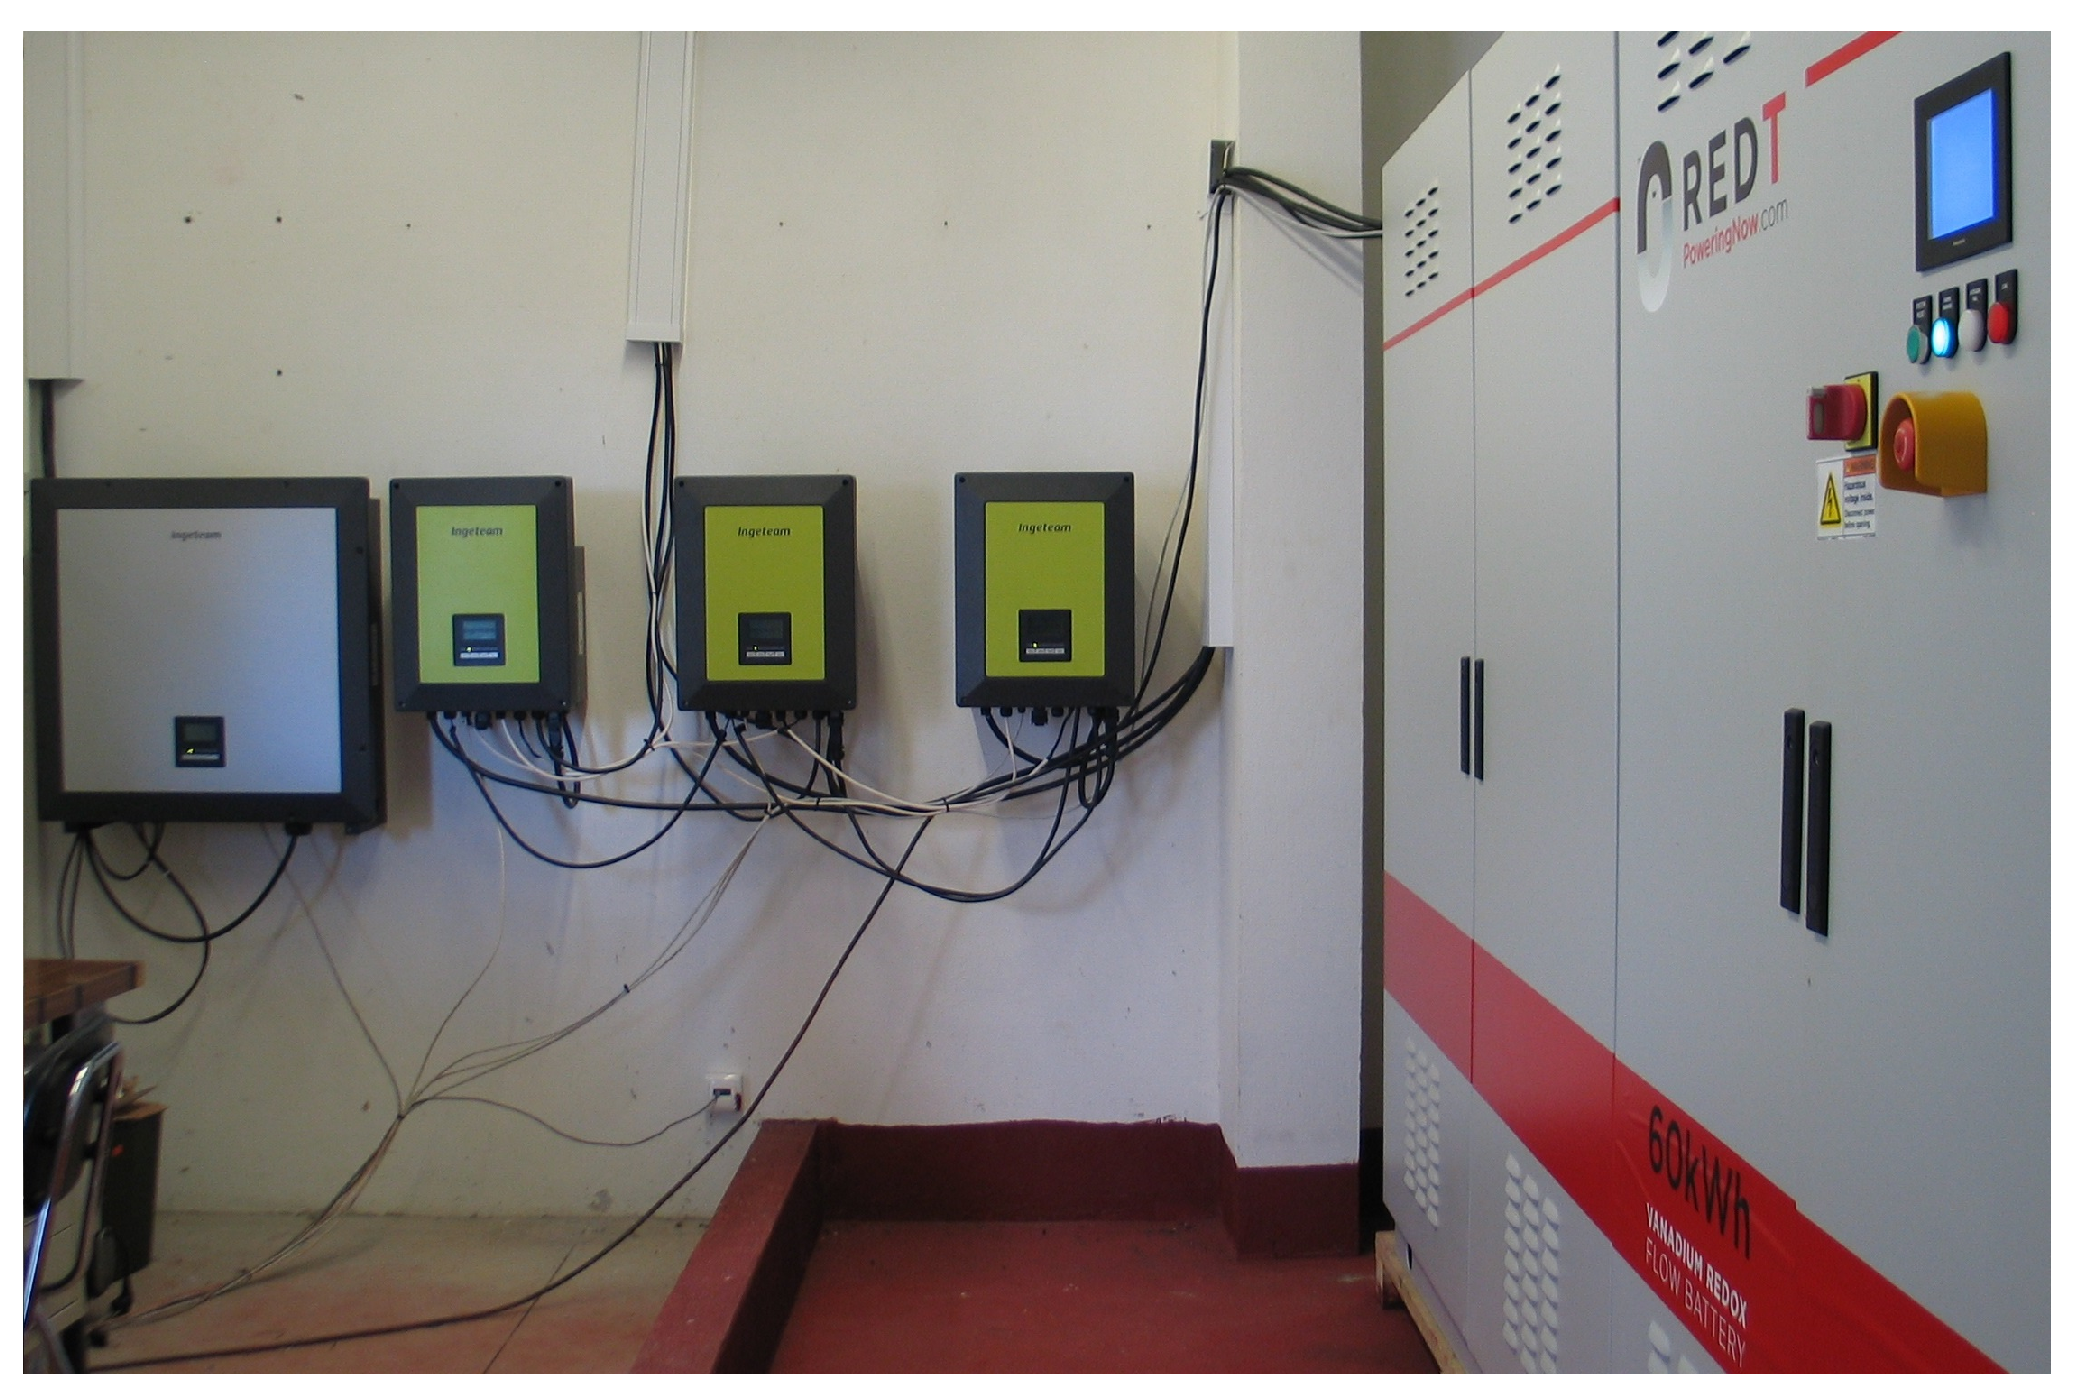
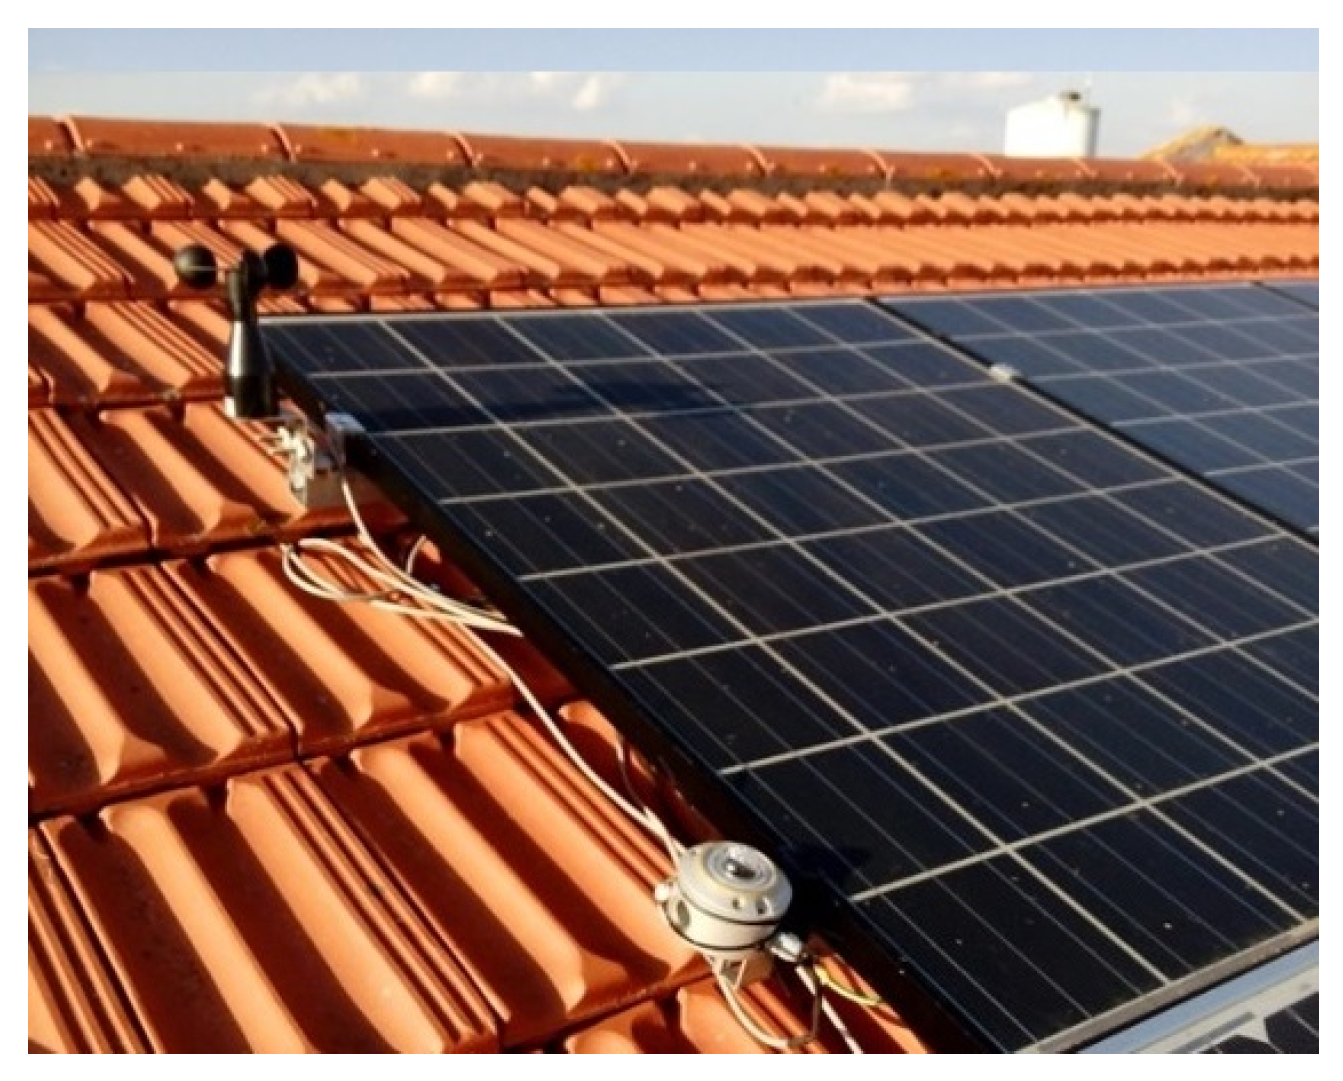
Figure 2 shows the rooftop mounted PV system while
Figure 3 shows the battery and four inverters (PV inverter in gray and the three battery inverters in green).
To operate the demonstrator, a control system was implemented using a PC with Labview software to send and receive commands, and for overall system communication. This PC also acts as data logger to receive and store data. This PC receives data with parameter values from all the equipment (inverters, battery, and other sensors), runs the Labview software with the EMS, and continuously ensures the operation safety. In addition, each equipment has its own safety measures and surveillance implemented.
The main innovative feature of this demonstrator is the usage of a real-scale Vanadium Redox Flow Battery.
Table 1 shows the main technical specifications of the VRFB installed in the demonstrator.
Table 2 shows the three battery inverters specifications, and
Table 3 shows the photovoltaic inverter manufacturer specifications.
In this battery, the electrolyte is stored in two tanks (for positive and negative species). The electrolyte is then pumped through the piping system to a stack of cells where the reduction–oxidation reaction occurs. The electron exchange takes place in cells (connected in series to constitute the stack) where a special ion membrane separates the two electrolytes and only permits H and V to pass.
The use of two tanks and a stack allows the decoupling of the battery power density (determined by the active area of the cells in the stack) from its energy density—i.e., the total energy that it can store (given by tank capacity and specific electrolyte energy density). This energy–power decoupling allows a battery to be tailored for many special cases, such as low power and large capacity (residential BIPV) or large power and lower capacity to mitigate power fluctuations (wind farms or PV plants). Another important feature of this battery technology is the absence of self-discharge, as there is no reaction outside the stack.
Another distinct characteristic of this battery is the usage of vanadium as the main electrolyte element. The VRFB exploits the ability of vanadium to exist in four different oxidation states: from V through V, dissolved in sulfuric acid (). It is used as the positive electrolyte (V/V) and as the negative electrolyte (V/V). The usage of only one element allows the restoration of the electrolyte by simply mixing both electrolytes (positive and negative) and then separating them again by recharging the battery. This process (electrochemical reversibility) makes the electrolyte virtually infinite and non-degradable. The only source of electrolyte degradation is the occurrence of a side reaction with elements in air. To avoid this unwanted reaction, the empty space in the electrolyte tanks is filled with a high purity inert gas (Argon).
As these batteries are mostly composed of plastic piping and tanks and as the electrolyte is isolated from air, its lifetime is longer than other technologies, reported as 10,000 cycles [
11]). In addition, as previously referred to in the introduction, another important feature of this technology is that it allows very deep discharges (close to 100%), so the whole battery capacity can be used.
2.1.1. Determination of the State of Charge
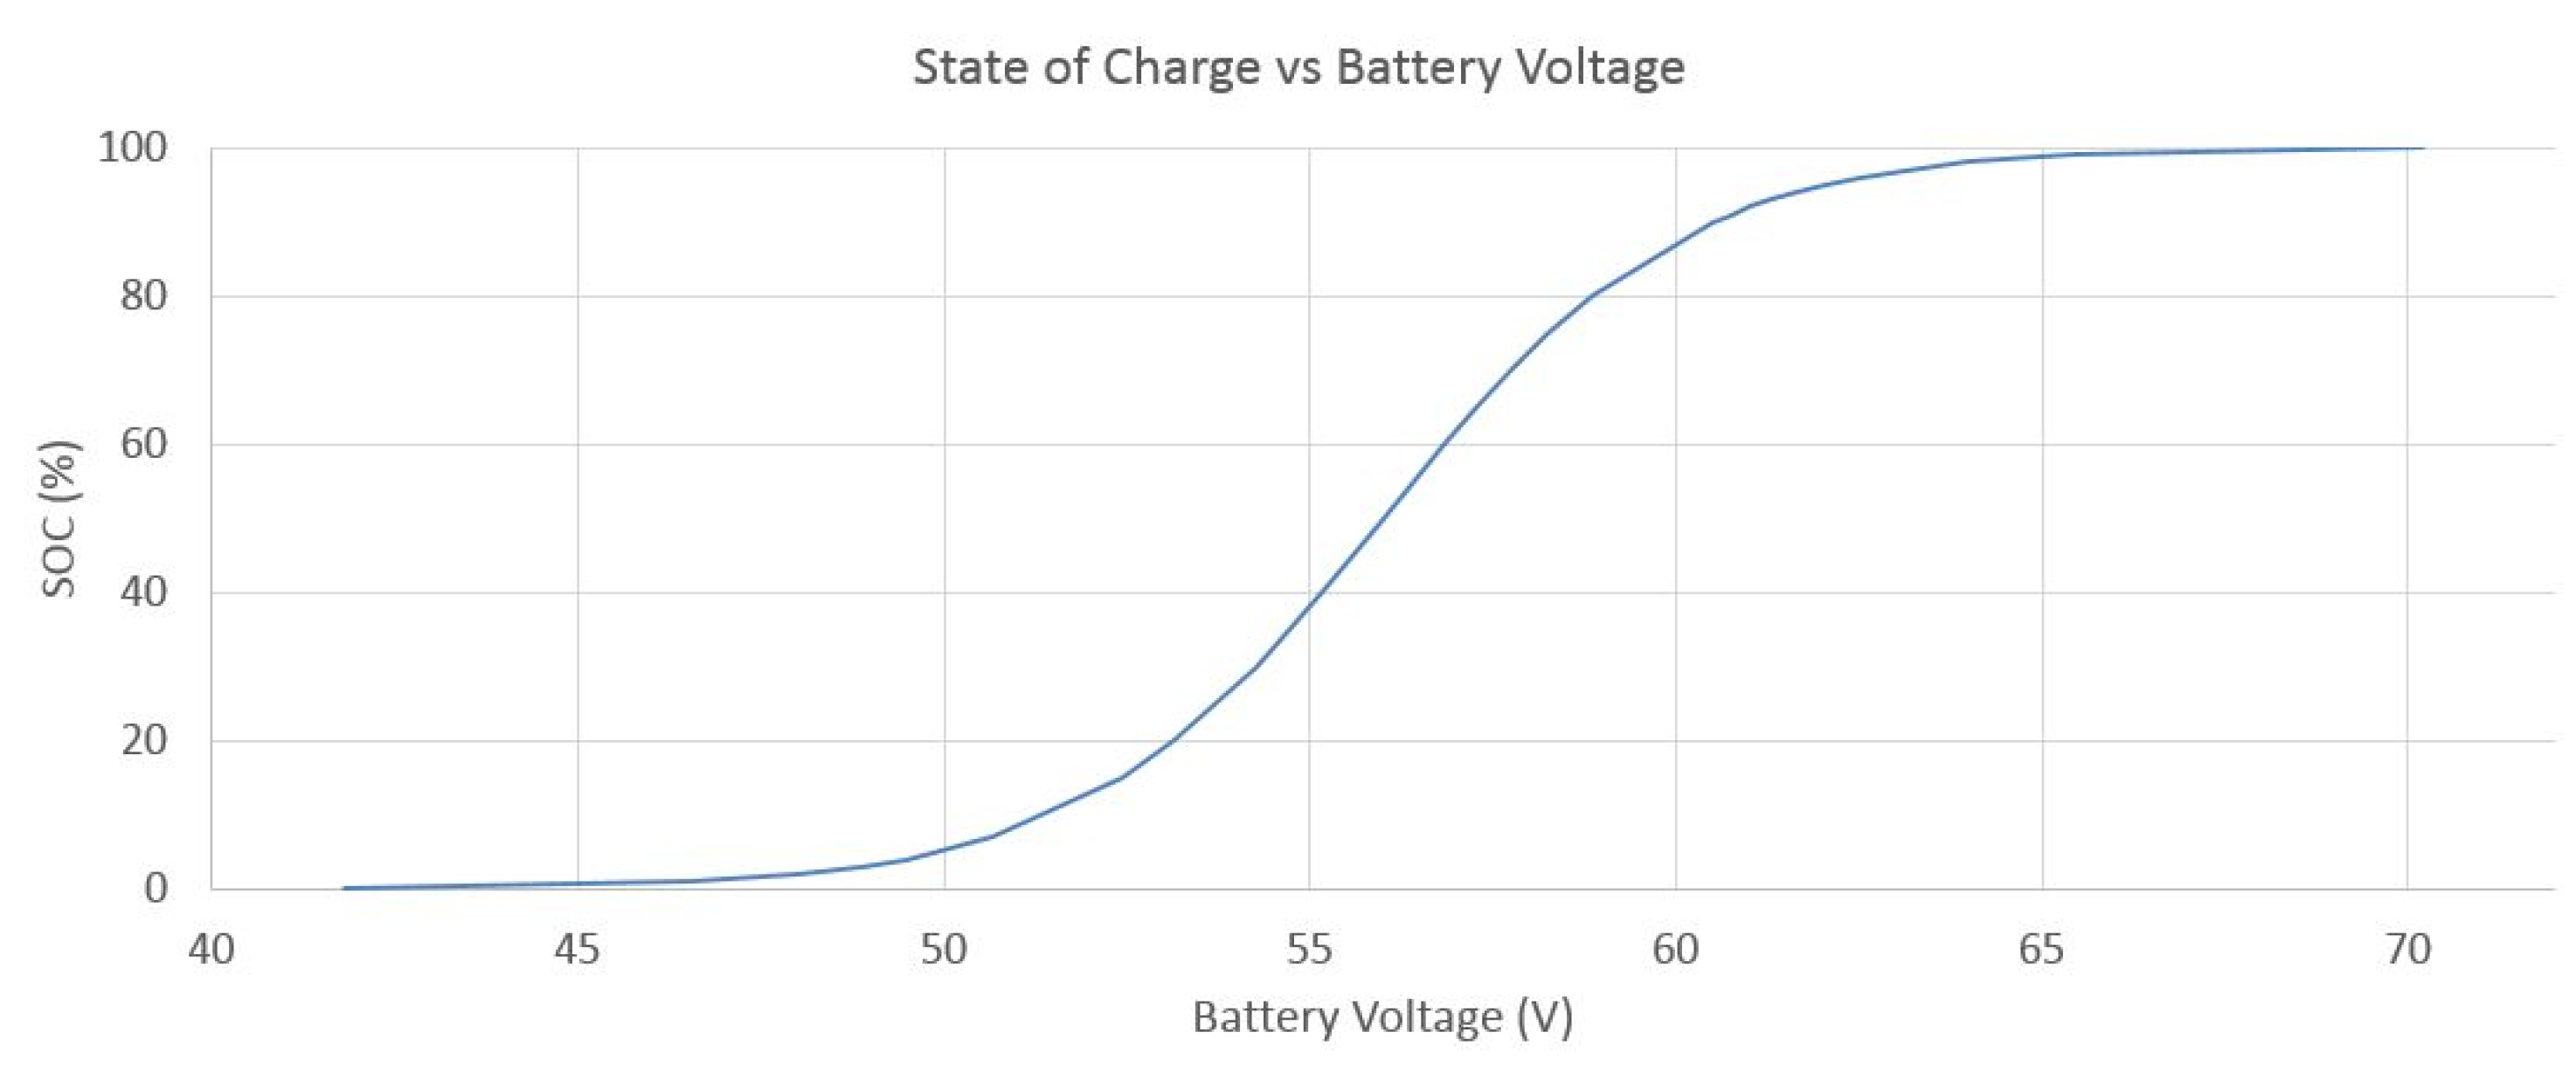
The VRF battery installed in this demonstrator is equipped with a parallel electrolyte circuit that carries a small part of the electrolyte flow to just one external cell (called the reference cell) that is neither subjected to charge nor discharge. As this cell voltage is only affected by the real electrolyte state, this cell voltage is the actual battery voltage in a rested state (not influenced by charge or discharge). In addition, the state of charge (SOC) is proportional to this voltage, so by knowing the reference cell voltage, one can obtain the real SOC.
The function relating SOC with reference cell voltage was obtained experimentally by the battery manufacturer.
Figure 4 shows the SOC variation with the battery voltage (determined by the reference cell voltage multiplied by 40, as the stack is formed by 40 cells in series). In order to obtain the SOC value during the battery operation, this graphic was fit to Equation (
1) so the SOC is computed using the reference cell voltage measurement. Equation (
1) was defined as a piecewise function, computed as a numerical fit of the data within the operating ranges (from 41.8 V to 65.4 V), as no single function could be fitted properly. Each function was chosen as the one that yielded the best numerical fit for their respective ranges (R-Squared ≥ 0.99).
2.2. Instrumentation and Data Acquisition
In order to properly implement an EMS, several parameters are measured, allowing the computation of useful variables that enable smooth system operation. Furthermore, to allow a more complete study of each piece of equipment, several additional measurements (other than critical variables already provided by the equipment) are necessary.
Table 4 summarizes the monitored variables. For example, regarding the PV system, it is only necessary to know the AC Power given by the inverter. However, to evaluate the efficiency of the PV system or detect problems, more data is necessary (global radiation in the plane of the BIPV system, PV cells temperature, and wind speed). These measurements are made using a weather station on the roof consisting of a pyranometer, a temperature sensor, and an anemometer, as shown in
Figure 5. These sensors are read and processed by a control electronics (arduino Leonardo board), which in turn sends the data via a wireless zigbee network to another arduino connected to the main PC.
The logged variables regarding the battery and inverters system are: DC power, AC power, battery voltage, current, and state of charge (SOC). Other useful variables are also read to ensure that the installation is healthy and operating within safe conditions (for example battery temperature, piping flow and pressure, electric grid parameters, and safe battery voltage range). The data is transmitted with Modbus protocol over TCP, via Ethernet. In order to obtain a more precise SOC value—it being a crucial parameter—an independent digital bench voltmeter was installed to the reference cell. This independent measurement allows a precision improvement from 0.7% (battery control measurement) to 0.1% (multimeter measurement) of the reference cell voltage. Furthermore, a three phase wattmeter (power analyzer) was installed to measure the power exchanged from the BIPV system and battery to the electric grid. In addition, three wattmeters were installed to obtain AC power measurements for each phase/ battery inverter.
2.3. Electrical Loads
The loads used for the tests were simulated using the building to which the demonstrator is connected, as the consumption of all building loads is much larger than the power and capacity of the battery and PV system. The loads were simulated as being equally distributed by the three-phase electric grid. In this way, whenever a load is to be supplied, the power is sent to the building grid and that same power value is subtracted from the wattmeter measurement. This operation yields the power that would be exchanged with the grid if the loads were real and directly connected to the demonstrator. The load profile used is based on real 15 minute interval measurements made during a year of a real domestic installation [
16]. This profile was then scaled according to the demonstrator specifications in order to provide a load profile level balanced to the system scale in what concerns battery usage and installed PV power. This method allows the loads to be of a suitable size relative to the real system specifications.
3. Self-Consumption Maximization Strategy
The strategy tested in the demonstrator was the self-consumption maximization strategy. The main objective of this EMS is to maximize the consumption of PV energy produced locally in the building, hence avoiding injecting energy to the electrical grid. This is achieved by giving priority to PV power and either storing the residual load (energy produced by PV system minus the energy consumed by loads) in an ESS or by taking energy stored previously. Thus, the only exceptional case in which there is an exchange of energy with the grid is when the battery can no longer absorb more energy or when the PV + battery system cannot provide enough energy to the required loads.
According to the regulation of certain countries (such as Spain, Germany, Portugal, South Africa, Puerto Rico, etc.), the feeding of PV power into the electrical grid is either forbidden or highly restricted, so it is necessary to take measures to avoid this situation [
17,
18,
19,
20,
21]. Either the excess power should be curtailed—i.e., PV production is limited to a sub-optimal value to avoid producing more power than what is being consumed at the moment—or, ideally, the excess power would be either stored or used by some deferrable loads (for example, a water heater, washing machine, etc.) [
16].
In countries where a feed-in tariff (FIT) is paid for renewable electrical energy, the use of a battery could help to maximize profit. It could ensure that no PV power is lost due to regulatory restrictions or technical problems (for example, a sudden power outage) and even delay the sale of energy to a time when it might be purchased at a higher value (such as during peak hours). In a stand-alone system or in one where no PV power is allowed to be sold to the electrical grid (or if the selling price is too low), the user can store the energy for later usage, lowering the necessity to buy electricity from the grid.
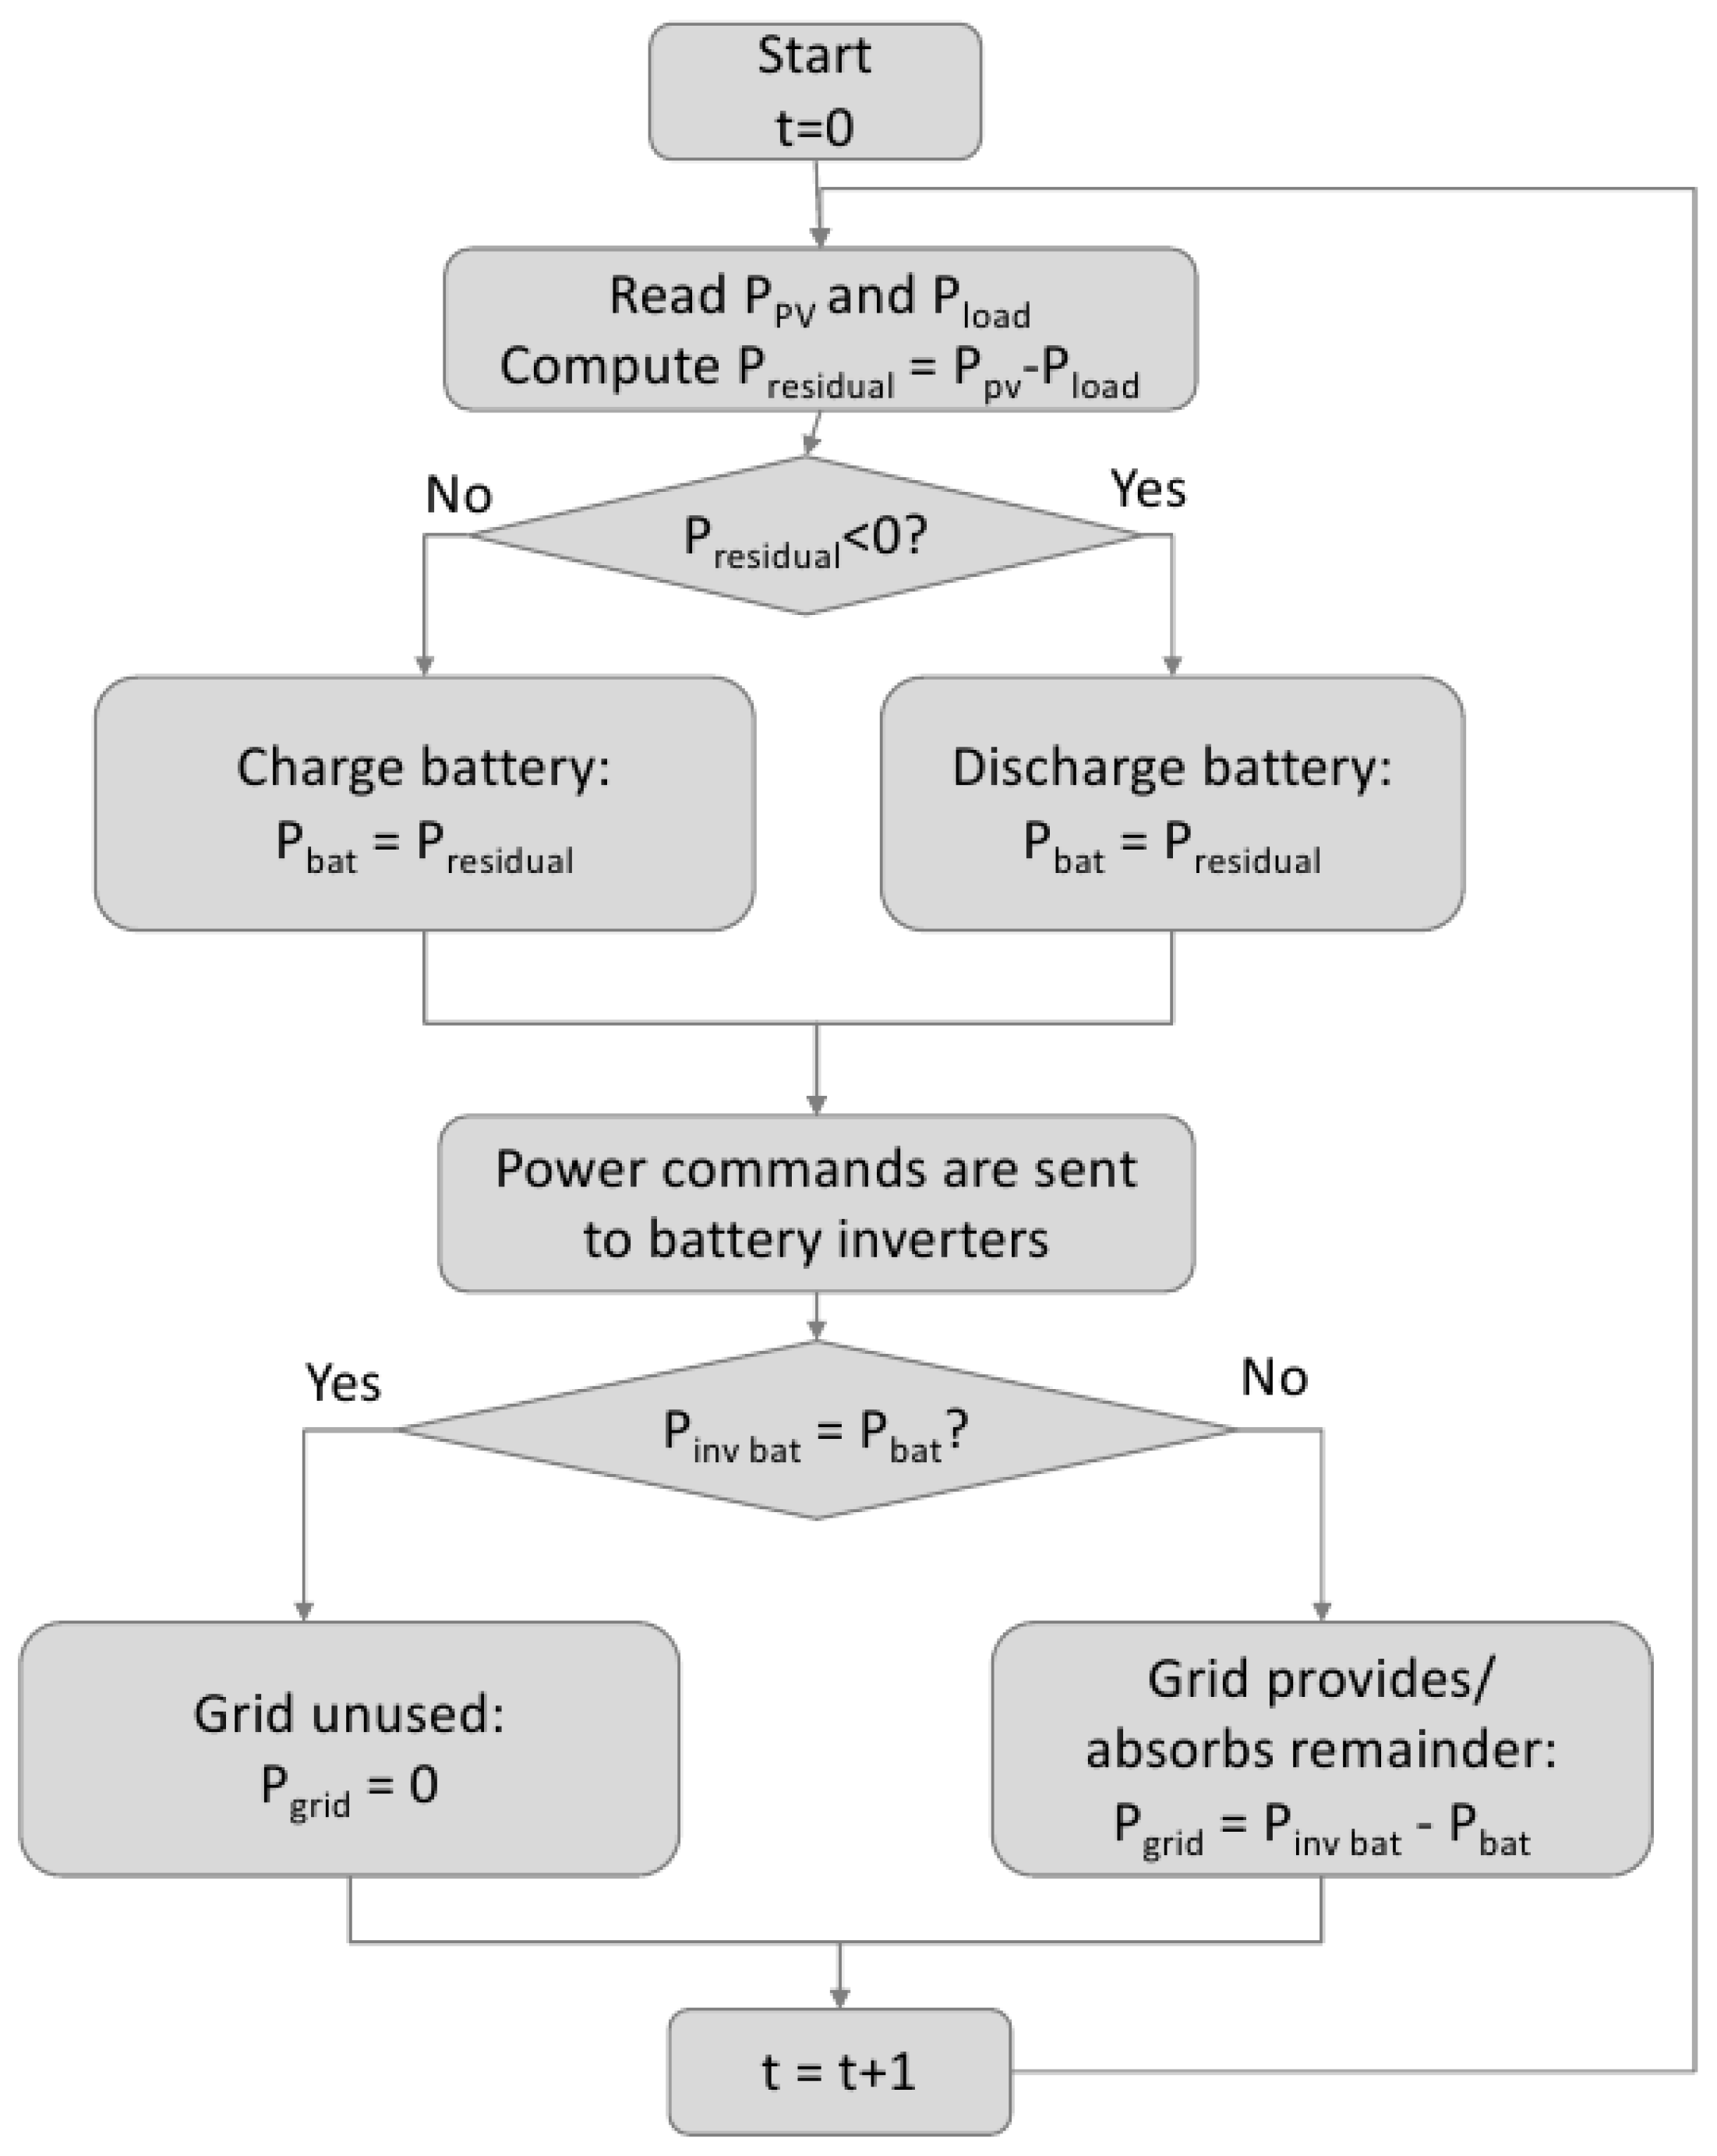
A flowchart of the self-consumption maximization strategy is presented in
Figure 6. In the first step, the control system acquires data from PV production, loads consumption, and the battery state of charge (SOC). Then, it computes the difference between the loads consumption and PV production, referred to as residual load (
). If the differential is positive, it means that current PV power is not enough to supply the loads. Hence,
is provided by the battery (if it has enough accumulated energy). If the battery cannot provide the total necessary power (due to a low SOC), the remainder has to be provided by the electric grid. The reverse happens when there is more PV power being generated than consumed in a given moment. In this case, the remainder should be stored in the battery. If the battery cannot absorb all of the excess power (for instance, near maximum SOC), the remaining power must be fed to the grid (considering the case with no active loads management).
This cycle should run at least every second to provide a quick response to any changes in PV production, consumption, or other situations (for example a blackout or a sudden problem in a piece of equipment). In this way, the grid is not largely affected by large fluctuations in PV production that could otherwise be fed to the electric grid with poor quality (high power variations in a short time).
With the proper implementation of this EMS, the benefits obtained should be: lower energy exchange with the public grid, higher self-consumed PV power, and a higher load supply with PV power (either directly or by the battery). In order to validate this EMS—tested in the real size VRFB demonstrator—the following merit factors were defined to quantify the obtained improvements: self-consumption ratio, maximum positive (from the grid), and negative (into the grid) peak grid power, respectively given by Equations (
2) to (
4).
and
is the average value for each 15 minute time interval, given by:
where t is time in seconds.
4. Validation of the Self-Consumption Maximization Strategy in the VRFB Demonstrator
4.1. Testing Campaign
A testing campaign was carried out in the time frame of one week. It was considered a sensible duration for the EMS validation, representing a balance between a short-time test (one day) and a longer period—for instance, one month.
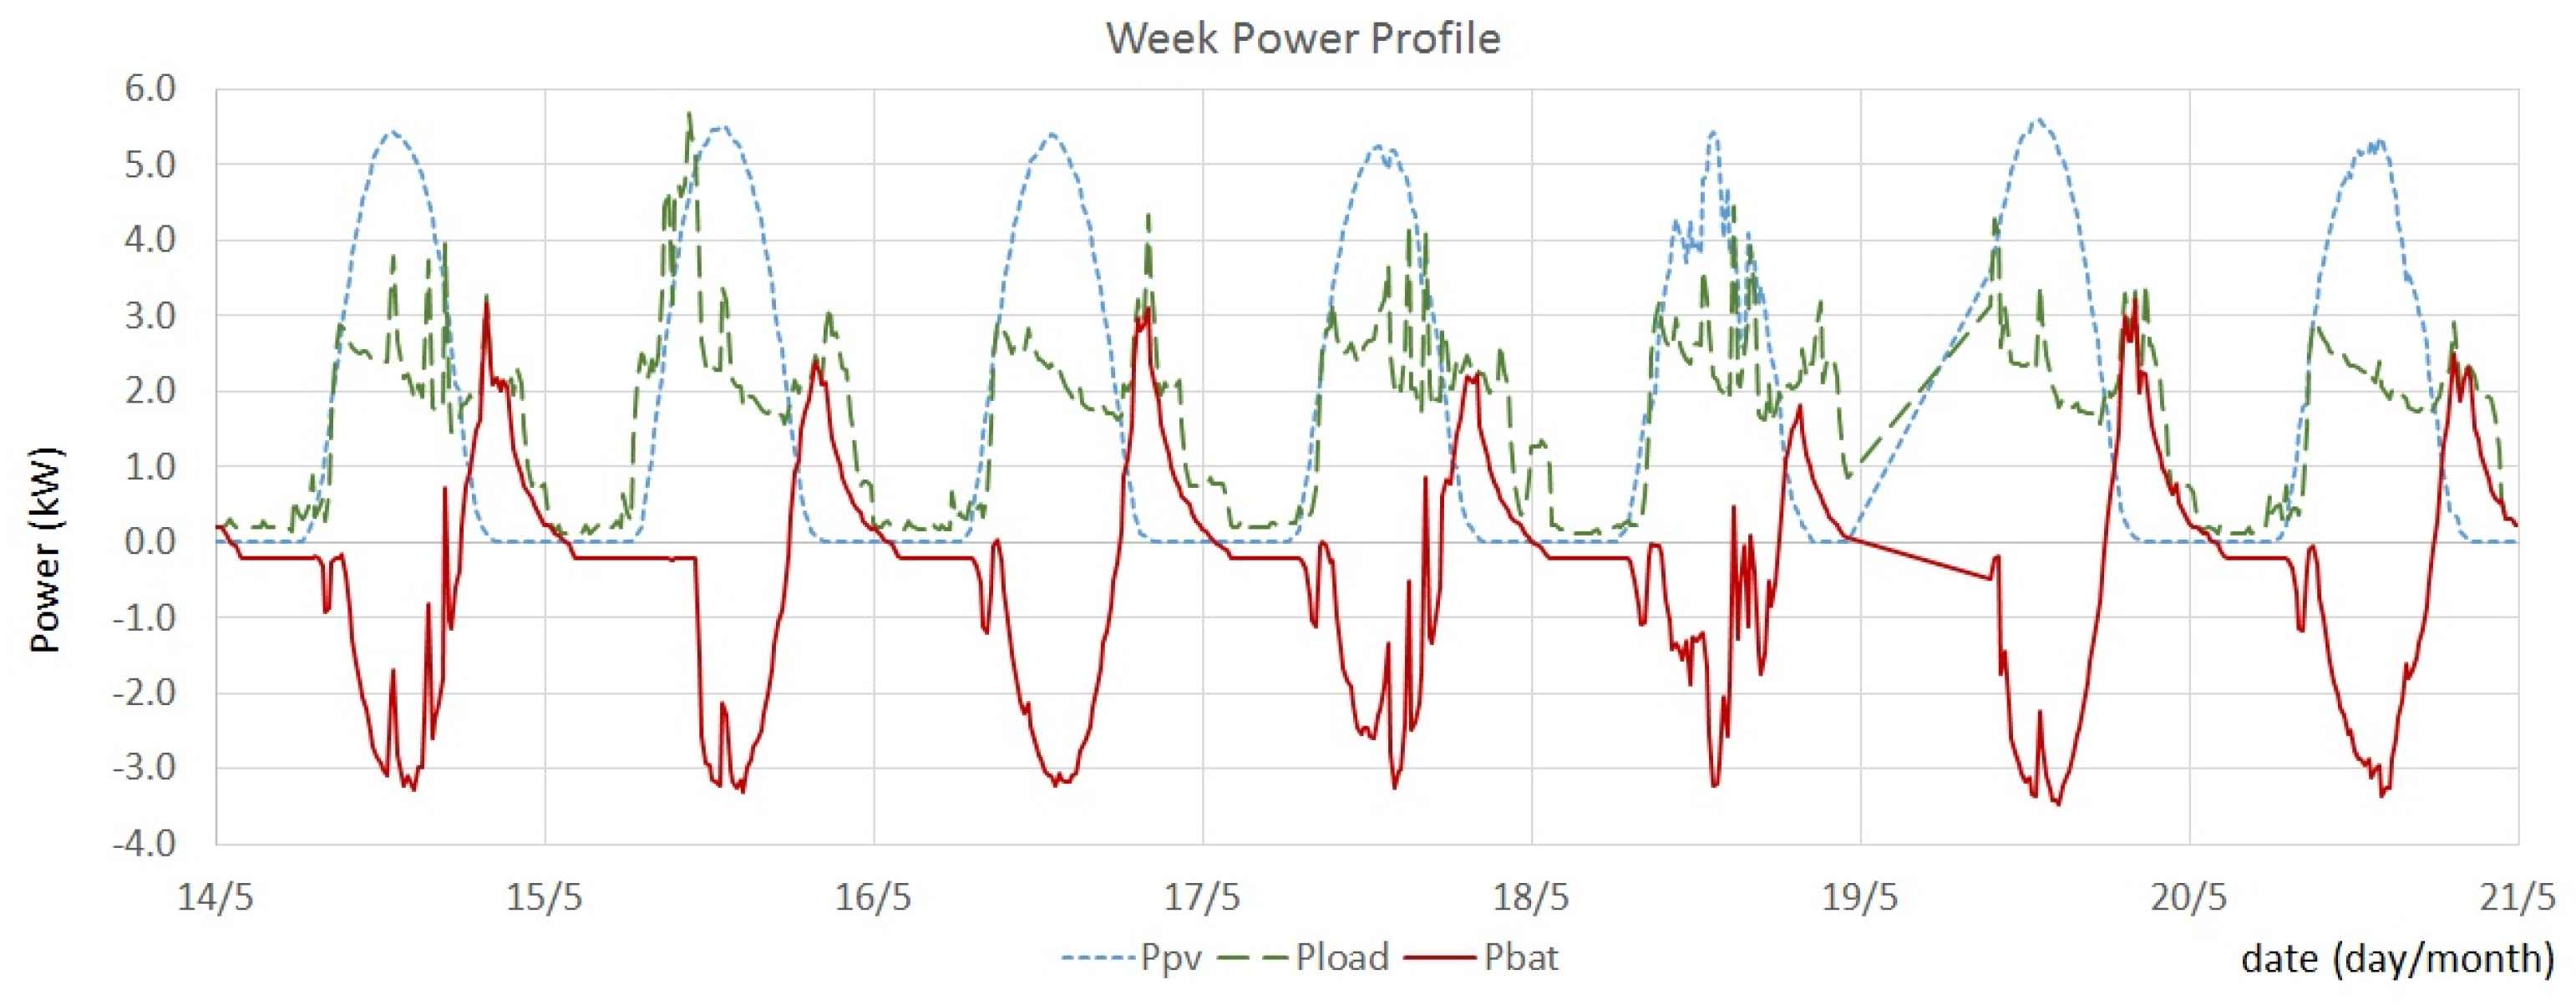
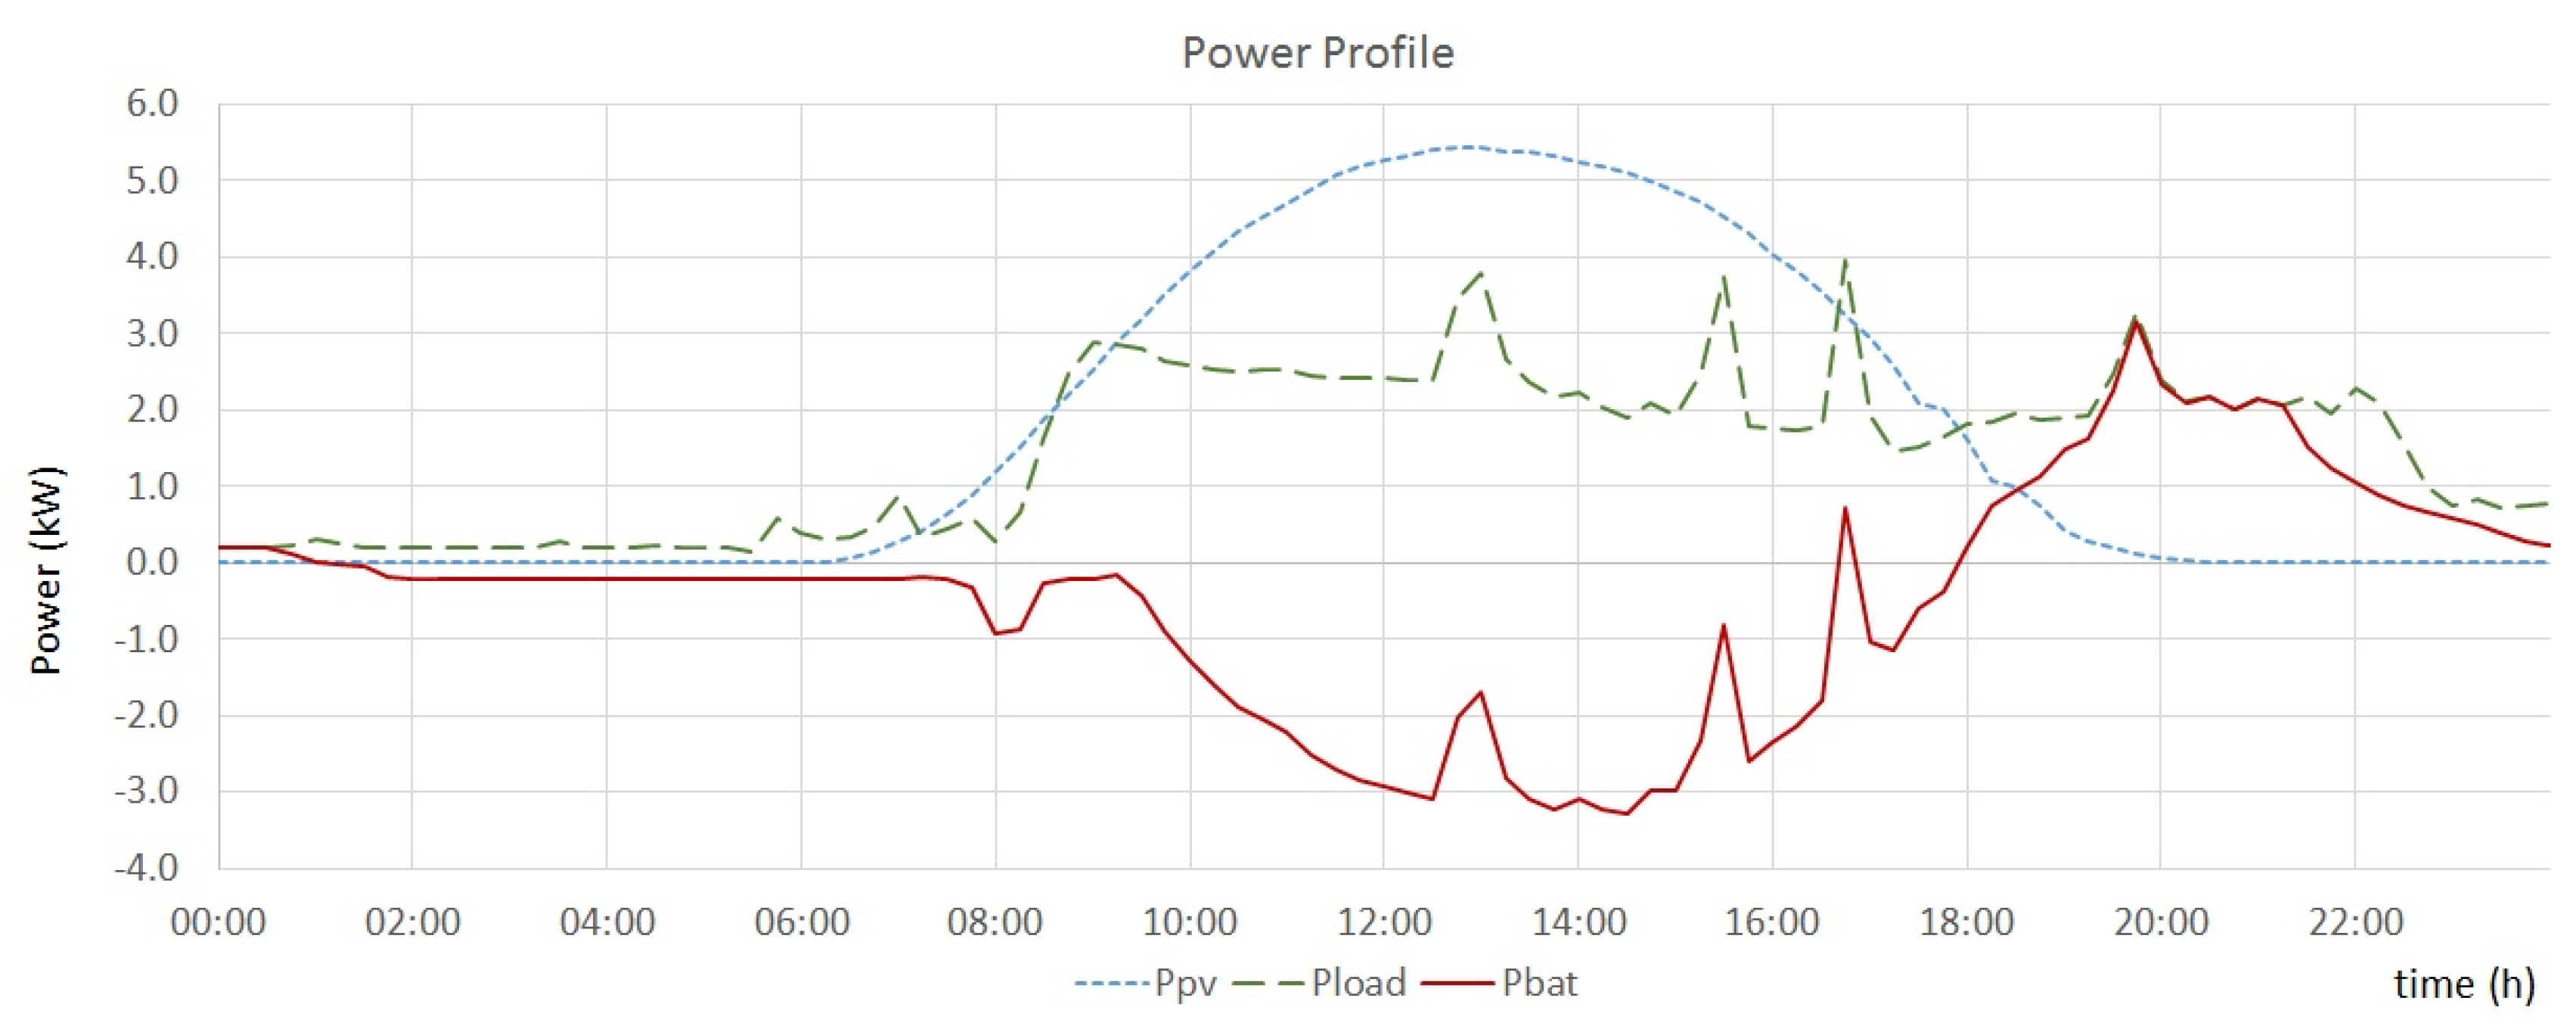
Figure 7 shows fifteen minute averages of the main parameters (PV power, loads consumption, and power exchanged with the battery) recorded during the testing of the Self-Consumption Maximization strategy.
Figure 8 shows the power exchanged with the battery and the power exchanged with the grid in the same time period.
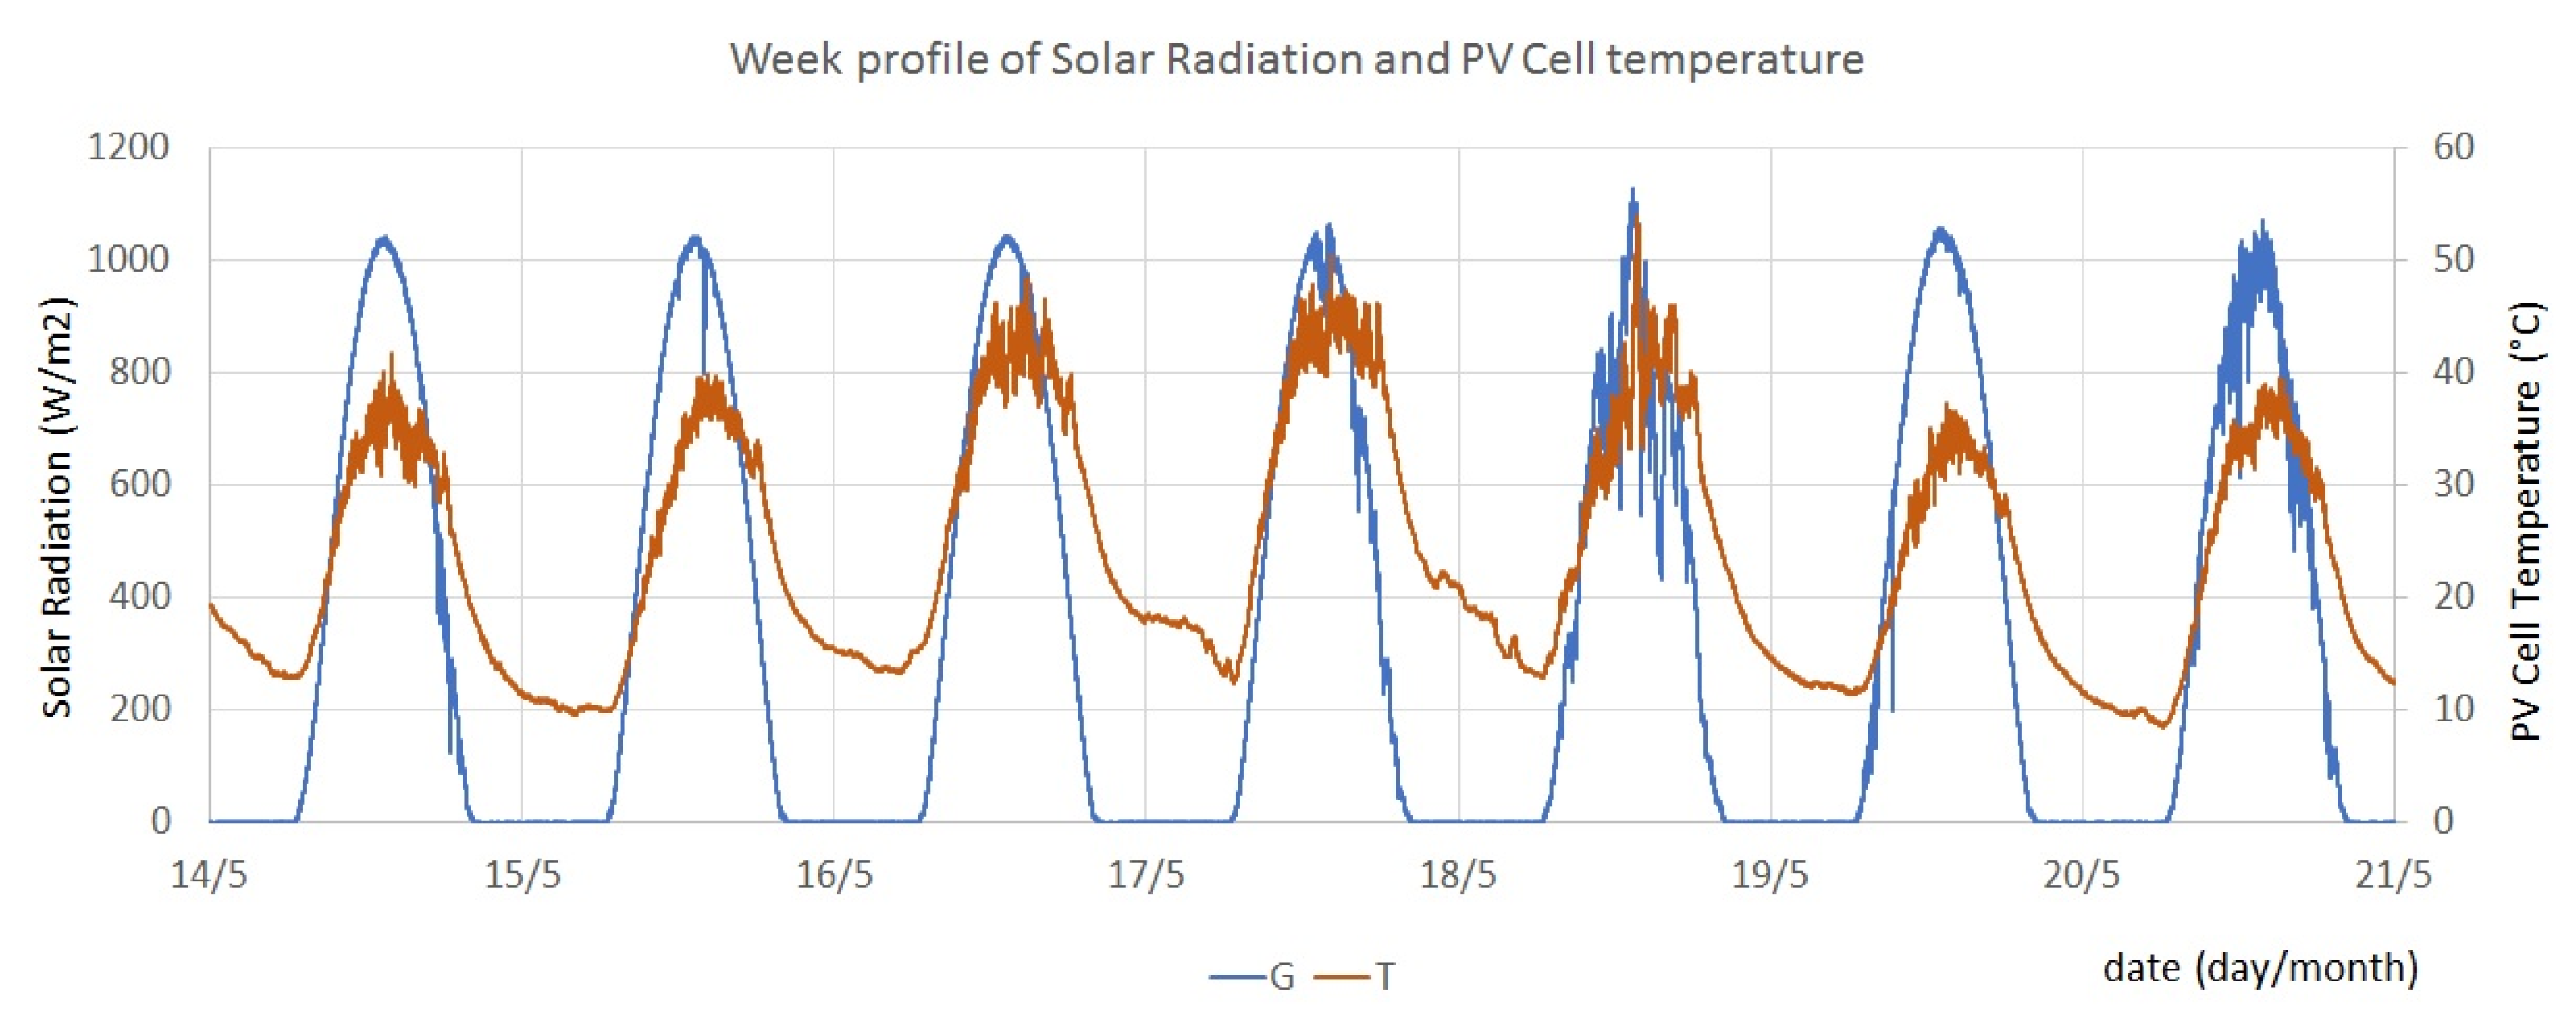
Figure 9 shows the solar radiation on the PV plane (pyranometer) and PV cell temperature in the same time period.
From the graphics shown in
Figure 7 and
Figure 9, the PV generation (blue dotted line in
Figure 7) was mostly regular, with a clean radiation profile with only one day with significant variation (seen in
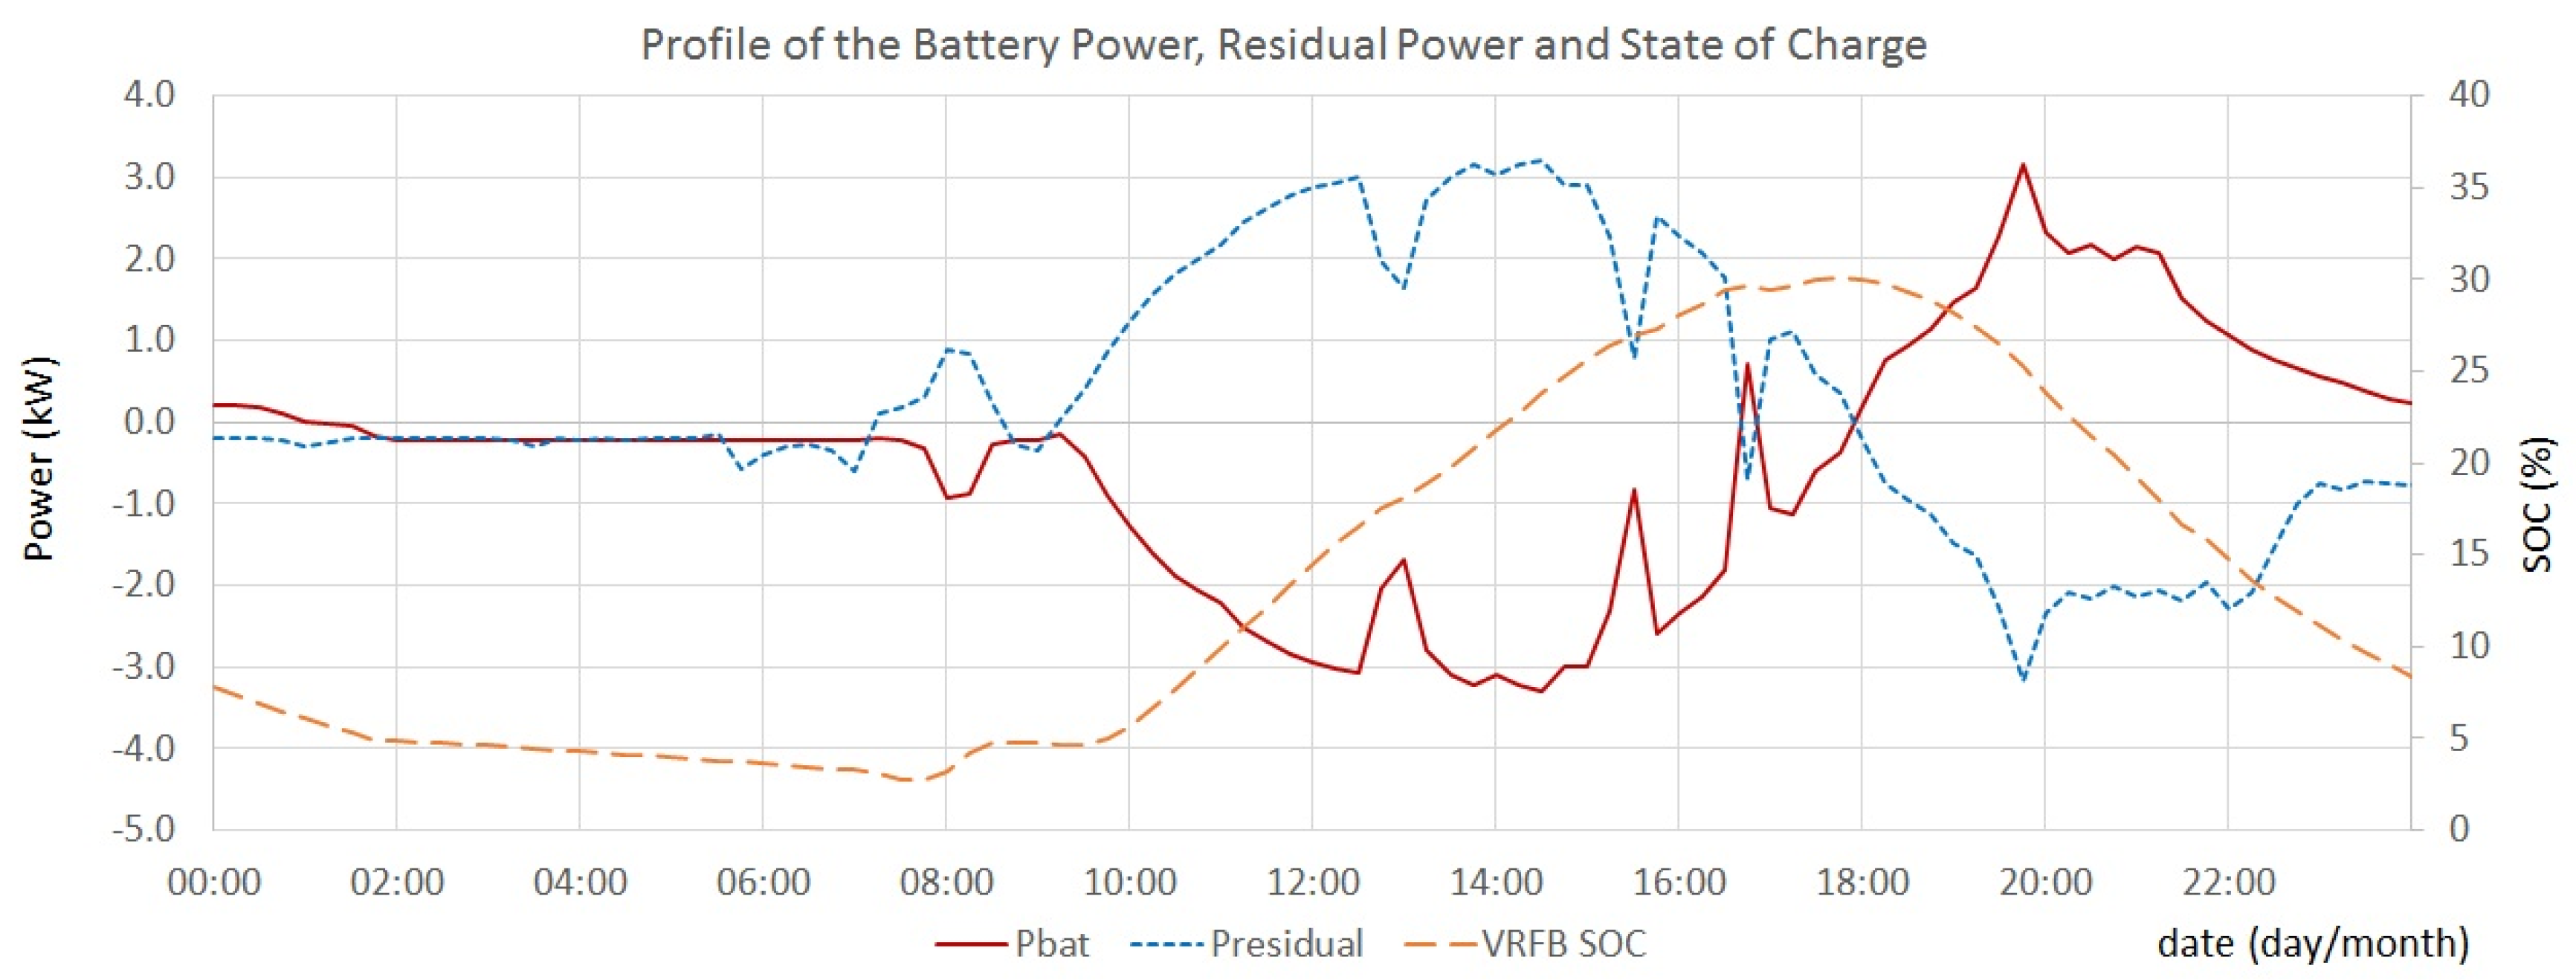
Figure 9 on 18 May 2015). When the PV power is higher than the consumption, the remaining power (residual load positive) is stored in the battery (battery power is negative when charging). Usually, later in the day, when PV power is decreasing, the residual load (negative) is supplied by the battery.
However, when comparing
Figure 7 with
Figure 8, it can be seen that despite the energy stored in the battery being enough to supply the loads, the power that the battery could deliver was not enough. This is due to the ratio of power versus SOC not being constant throughout the major range of SOC. When the battery is partially discharged (lower SOC), the discharge power that it can provide is lower than the nominal power. The reverse situation occurs with the charge power when the battery is almost at full capacity (higher SOC), as shown in
Figure 10 .
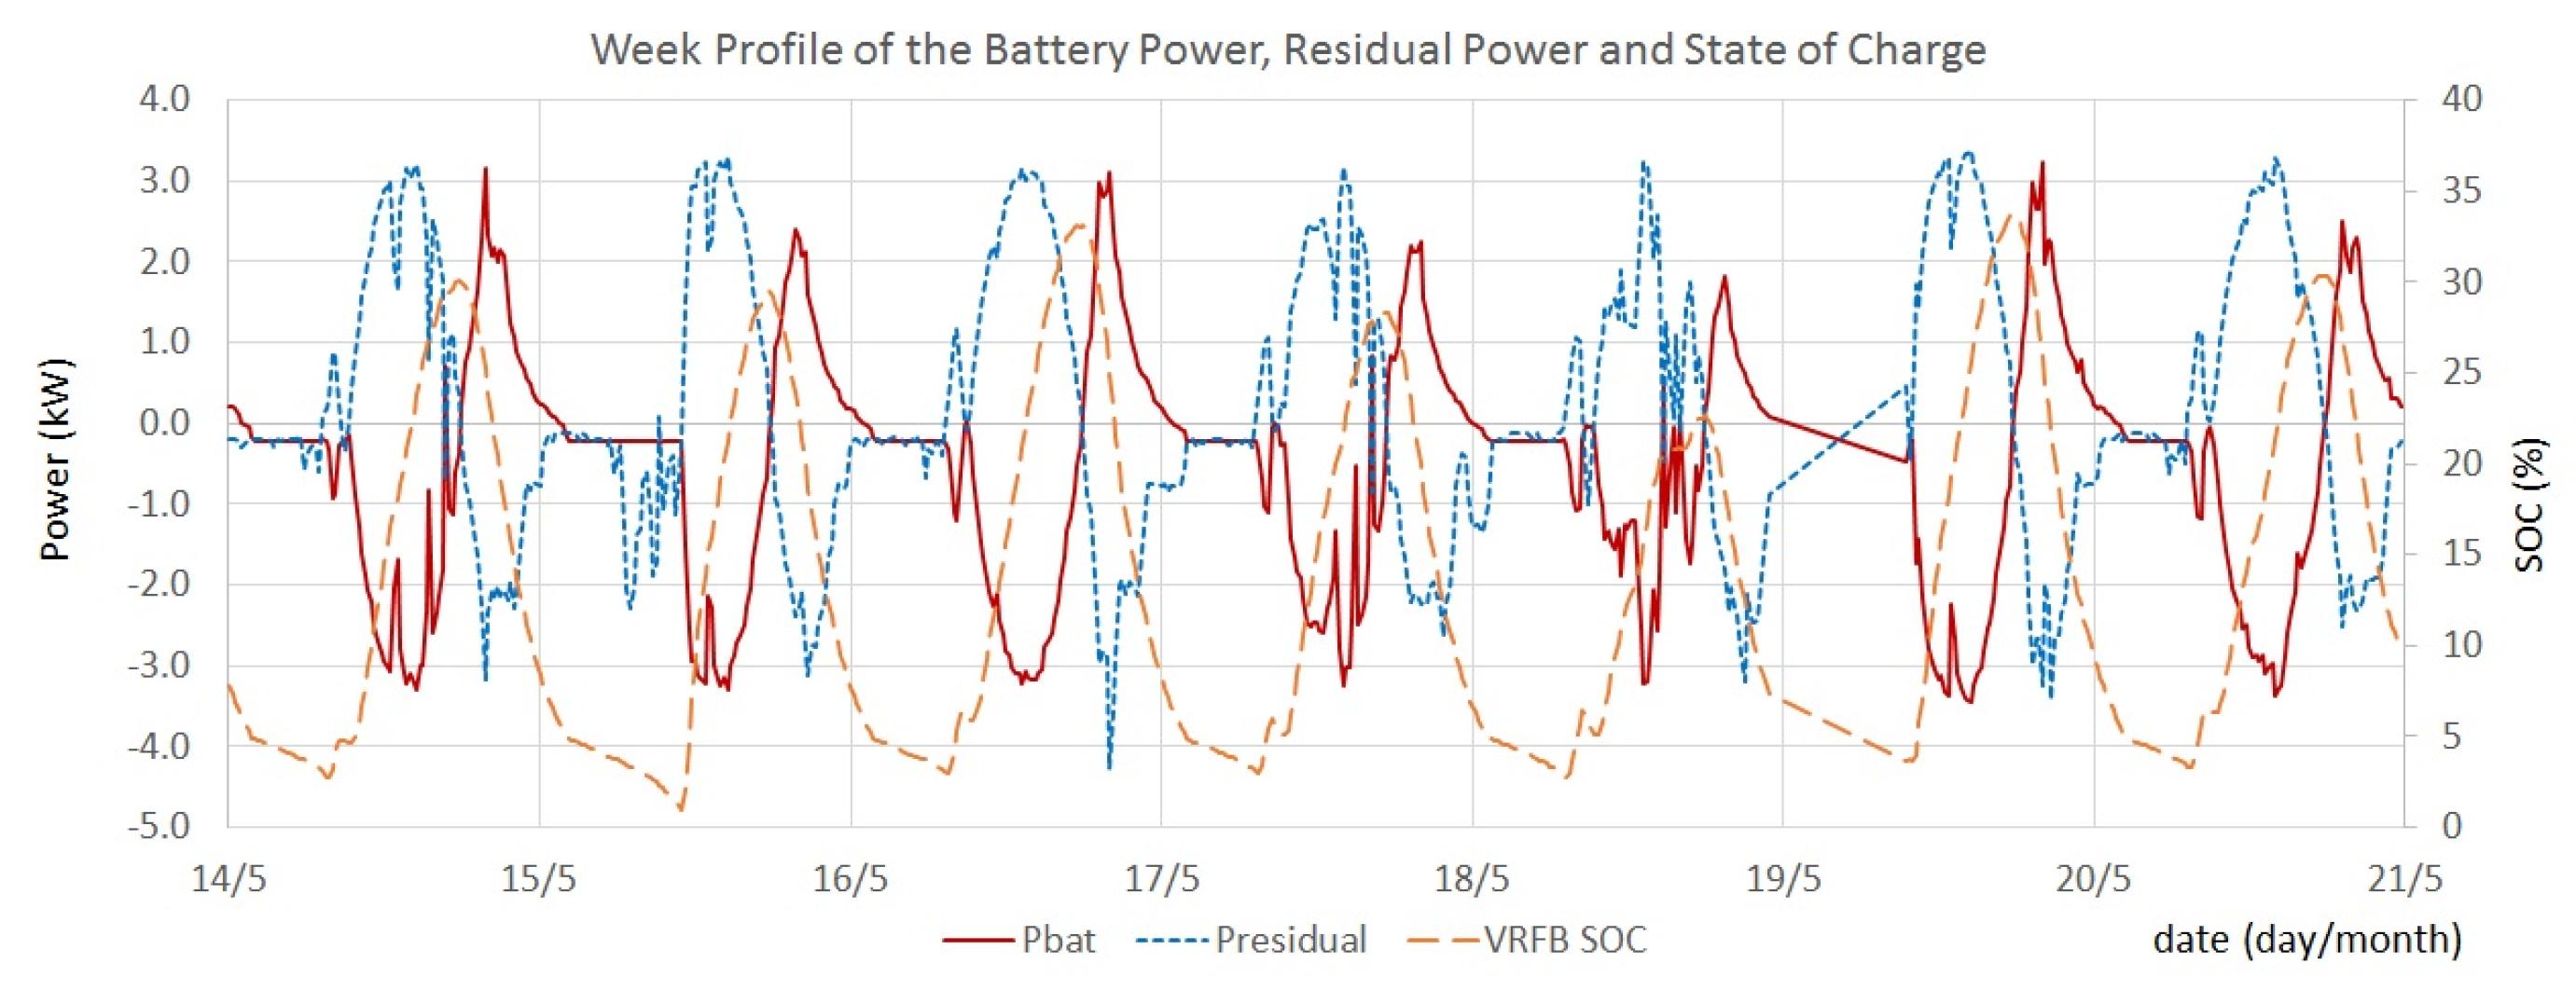
Figure 11 and
Figure 12 show that, at the beginning, the residual load (blue line) began to be entirely supplied by the battery (red line). When the battery got below 5% of SOC (purple line), the loads had to be supplied by the grid, as below this value, the battery voltage gets close to the inverter minimum voltage range. To avoid this situation, a safety measure was implemented. In
Figure 11, one can see that despite this safety measure, the battery SOC continued to fall, suggesting that the value used to charge the battery is not enough to overcome the consumption of the inverters and the battery internal losses.
When the PV power began to increase, the residual load also began to increase (positively), so the available power was used to charge the battery. At the end of the day, when PV power decreased, the previously stored energy was used to supply the loads. At the end of the day (after 21 h), some power had to come from the grid, as the battery could not entirely provide the necessary power to the evening load peak.
5. Results
To properly assess the validation and to quantify the self-consumption maximization performance, several merit factors were computed and compared with the case in which the demonstrator did not have an ESS.
Table 5 shows the comparison summary of the merit factors for the demonstrator with and without storage, evaluating the overall EMS performance for the testing period.
Table 6 shows the merit factors computed for each day of the testing period.
In terms of total energy, the installation was able to self-consume 100.0% of the PV generation, and it was able to supply 75.6% of the total consumption. Hence, it was necessary to get 24.4% of the energy from the grid. The maximum peak power from the grid was 2.5 kW, without energy injection into the grid. Considering the demonstrator without storage, only 65.2% of the total energy generated by the PV system was self-consumed, and the peak power injected to the grid was 3.3 kW, while the peak power taken from the grid reached 4.2 kW.
To decrease the grid contribution, it is possible to increase the installed PV power or decrease the loads power consumption. In order to have a flexible demonstrator system, allowing the testing of different EMS that can require larger storage capacity, the total installed battery capacity ended up not being completely used in this test.
This occurrence hints at the opportunity to develop and implement strategies that can provide more benefits than an exclusively short-term or long-term EMS. The remaining unused battery capacity can be used as reserve power in case of an unforeseen blackout, to take advantage of electricity price fluctuations, to provide power to neighbor installations, or even to charge electric vehicles. Additionally, a higher available PV power could be stored in the battery for later use, decreasing the grid necessity. The extra capacity relative to the PV system size also raises the important question of how to optimize the battery capacity regarding PV generation and loads consumption.
This test yielded several useful results for the future operation of this technology demonstrators:
The Vanadium Redox Flow technology has the ability to decouple power and capacity but the available power at extreme SOC varies.
Figure 10 shows the variation of discharge (blue) and charge (red) power with the SOC. This fact also reveals the importance of analyzing these systems as power sources/sinks and not only in terms of global energy.
The system formed by the VFRB and inverters has achieved an overall average efficiency of 57.7% during the testing period. The efficiency is penalized by the battery operating voltage range being bellow the ideal voltage range of the inverters. The used inverters have a working voltage ranging from 48 V to 300 V, although their efficiency is higher at the top end of this range [
15].
The inverters consumption and battery internal losses are not entirely supplied during the safety procedure. Although the VRF battery is not damaged by an over-discharge, a voltage below the working range can turn the battery inverters off (the battery inverters are powered by the battery and require a minimum of 45 V), hence disturbing the normal operation of the installation.
6. Conclusions
The test results of the use of a VRFB as the storage system for the testing of a self-consumption maximization strategy, implemented in a real-size demonstrator, were presented. The results show that the VRFB is a suitable technology to be combined with BIPV systems.
Regarding the EMS testing, the strategy successfully maximized the consumption of locally-produced PV energy. Using the battery to store excess PV power (positive residual load), it was possible to completely avoid the injection of energy into the public electric grid—i.e., 100.0% self-consumption ratio. In addition, the total energy consumed by the loads was 75.6%, supplied by PV generation. A closer analysis of the system operation shows that an increase in PV power could further decrease the necessity of the electrical grid, as a large part of the battery capacity (approximately 65.0%) was unused.
The correct performance of the EMS is also shown by the reduction of power exchanged with the grid. The peak power from the grid was reduced in 59.0% in comparison with the case without energy storage. This means that the prosumer—apart from benefiting the whole electrical system—not only reduces their electric bill due to the reduction of grid energy consumption, but also due to the reduction of the utility contracted power tariff.
This work also showed the relevance of the equipment operational limits (in this case, the battery inverters DC voltage range) to the EMS, and the non-negligible variation of available charge/discharge power with the battery SOC. In future developments of energy management strategies, all these operational limitations should be taken into account to ensure the proper and safe working mode of the whole system as planned.


