1. Introduction
Functionally graded electrodes (FGEs) have been applied to solid oxide fuel cells (SOFCs) in recent years, aiming to improve the cell performance by optimizing the microstructures in the electrodes. The advantages of FGEs include expanding the electrochemical reaction area, optimizing the electrical/ionic conductivity, improving the gas transport, and reducing operating temperatures. Efforts have been made by examining the advantages of applying FGEs to SOFCs from a mathematical perspective [
1,
2,
3,
4]. Ni
et al. [
5] developed a mathematical model to compare the uniform composite electrodes with two types of FGEs (particle size grading and porosity grading). Both particle size and porosity were linearly varied from the flow channel to the electrolyte surface. The results show that FGEs reduced the mass transport resistance and increased the active surface area near the triple phase boundary (TPB) region, thus improving cell performance. Greene
et al. [
6] developed computational model to explore mass transport and ohmic loss in graded SOFC electrodes from a micro-scale level. A porosity graded electrode is applied to demonstrate the reduction of overpotential. Wang
et al. [
7] implemented a mathematical model to predict SOFCs performance by inserting one interlayer in electrodes. It was found that the insertion of an interlayer have the potential to improve the SOFC operation, but the cell performance strongly depends on the thickness of the interlayer.
Conventionally, people classify FGEs into three types, porosity grading, particle size grading, and composition grading. As far as the author is concerned, previous studies tend to treat micro-structural parameters, such as porosity and particle size, separately during the investigation of FGEs. For example, when performing the porosity grading analysis, people are likely to make particle size a fixed value and it does not vary across the electrode. However, these microstructural factors are physically linked to each other in the real world, and have to be viewed as a unit other than two individuals. More specifically, if porosity changes, particle size will alter correspondingly, based on the microscopic correlation between these two factors. Therefore, in this work, a novel study of FGEs, will be introduced by adopting and customizing an existing numerical model that is capable of simulating the complex gas transport phenomena and electrochemical reactions, together with reliable microstructural correlations, i.e., porosity-tortuosity, and porosity-particle size ratio in order to explore a real-world functionally grading SOFC performance.
2. Numerical Model
In order to investigate SOFCs numerically, efforts have been put into development of models including mass transportation and electrochemical reactions [
6,
8,
9,
10]. Wang’s model [
9] was selected to be the basis of the study. First of all, the model takes into consideration of all the micro structural factors that are critical to simulate gas transport phenomena in electrodes and electrochemical reactions at TPB region. Second, the binary random packing sphere model created by Costamagna
et al. [
11] and Bouvard and Lange [
12] were applied to mimic the packing of particles in the electrodes. Last, three experimental data sets from the literature, aiming to investigate the SOFC from different perspectives, were selected to facilitate the validation of the numerical model, it turns out that the numerical simulation results have a very good agreement with the experimental data for those well-structured SOFCs with less than 5% deviation. In this work, the well-structured fuel cell indicates microstructural parameters satisfying percolation threshold throughout the electrodes. After that, this model was demonstrated to have the capability of predicting the real-world well-structured SOFC performance by involving two microstructural parameter correlations. The mathematical model chosen for this work was developed by the same author and this current study can be considered as an extension of his previous work.
The detailed numerical model construction, solving procedure, and model validation have been introduced by Wang [
9] in his previous work.
3. Functionally Graded Anodes
In order to test if FGEs can provide better performance for SOFCs, a detailed analysis of FGEs will be conducted, including varying the microstructural grading parameters and comparing FGEs with conventional non-graded SOFC electrodes. Jiang’s experimental data [
13] were selected as the basis and the input parameters for the numerical simulation are listed in
Table 1. In
Table 1, the tortuosity and the particle size of Ni are computed, based on the two sub-model correlations and the rest of the parameters, were measured and provided by the literature [
13]. In addition, the testing cell is a well-structured anode-half cell so the influences from cathode can be neglected.
Table 2 lists how the particle size ratio and active surface area changes with porosity. By applying porosity and particle size ratio correlation, it can be found out that, as porosity increases, particle size ratio (small particle size over large particle size) also appears to rise. The larger particle size ratio, representing the size difference between two types of conductors, is smaller. In addition, according to coordination number model, active surface area starts to drop with increase of porosity. The numerical results shown in
Table 2 are also reasonable physically. First of all, if a significant particle size difference is observed for two types of conductors, smaller particles will fall in between the space of the larger particles and, hence, generates denser packing and reduces porosity. Otherwise, comparable particle sizes will result in relatively more vacant space and leads to higher porosity. Secondly, smaller porosity near the TPB region also indicates a denser particle packing, which will enhance electrochemical reactions by providing more active reaction sites and, hence, reduce activation overpotential.
Based on the porosity and tortuosity correlation, tortuosity is inversely proportional to porosity. Therefore, increasing porosity will make tortuosity decrease. From the micro-scale point of view, smaller tortuosity means that it takes gas fuel molecules shorter distance traveling from one end of the electrode to the other. Physically, relatively large porosity will also be favorable for the diffusion process because it will facilitate the mass transfer by generating more channels for gas fuel transportation and hence reduce the concentration overpotential. As a result, for uniform composite non-graded SOFCs, how to choose the value of porosity is a trade-off because larger porosity will be beneficial for diffusion but unfavorable for electrochemical reaction, and vice versa. However, if FGEs can be employed for SOFC, the performance can be improved by applying coarser porosity near the fuel channel and a denser one near the electrode electrolyte (EE) surface. In that case, both diffusion processes and the speed of the electrochemical reaction can be enhanced. In this study, we will explore the effects of porosity grading, which, due to the two of the correlations we adopted, will result in changes to the porosity, particle size, and tortuosity. Another parameter which can be explored is grading the electrode composition, i.e., the ratio of ionic conducting material with electronic conducting material, but we do not elaborate that here.
3.1. Thin Anode Thickness
For a thin anode thickness like in the case of Jiang’s experimentation setup, a series of tests of porosity value is conducted. As shown in
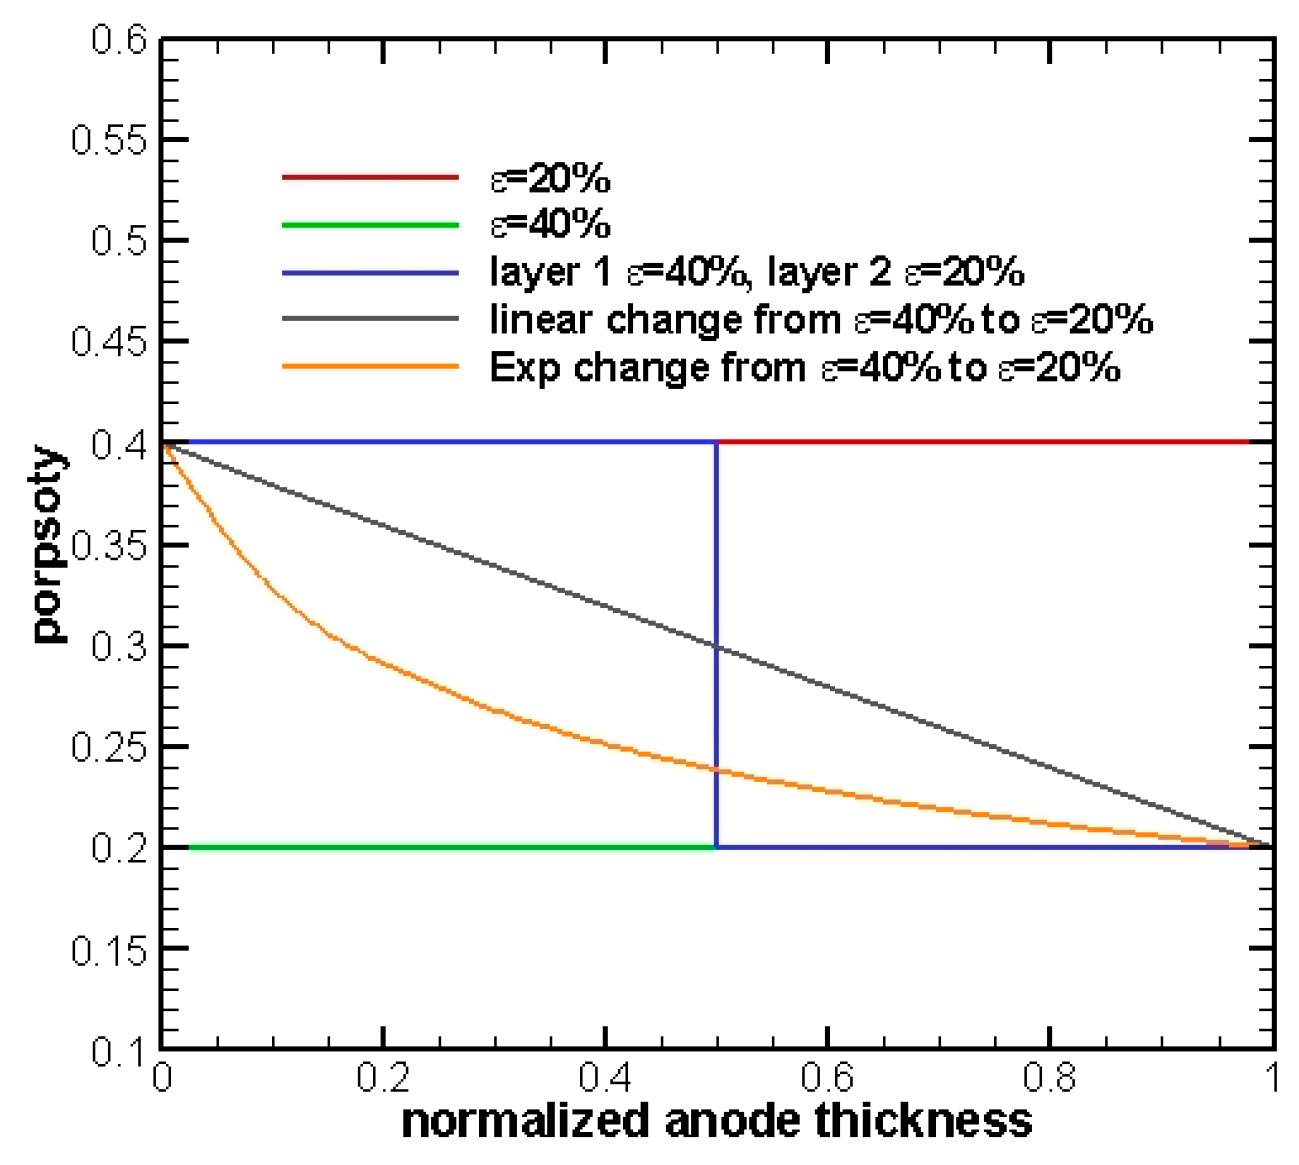
Figure 1, five cases with different types of porosity distributions are selected and will be tested and compared for an anode half-cell with a thickness equal to 30 μm:
- Case 1
The porosity of the whole electrode is set to equal 40% in order to test the influence of coarser porosity to FGEs. Please note that uniform porosity for entire anode represents the conventional non-graded electrodes.
- Case 2
A finer porosity of the whole electrode is selected to be equal to 20%.
- Case 3
A two-layer porosity electrode is tested. The anode is averagely divided into two sections. Porosity is set to 40% for the section near the fuel channel, aiming to aid the diffusion process, whereas it was 20% for the section near the EE interface to assist electrochemical reactions.
- Case 4
A linear change of porosity varies from 40% in the fuel channel to 20% at the EE interface.
- Case 5
Other than linearity, it is necessary to test a different curvature shape of porosity variation in the electrode. Hence, an exponential change from 40% at the fuel channel to 20% at the EE surface is selected. Due to the nature of an exponential function, the porosity value will gradually increase from 20% at the EE interface and then abruptly to 40% at the fuel channel.
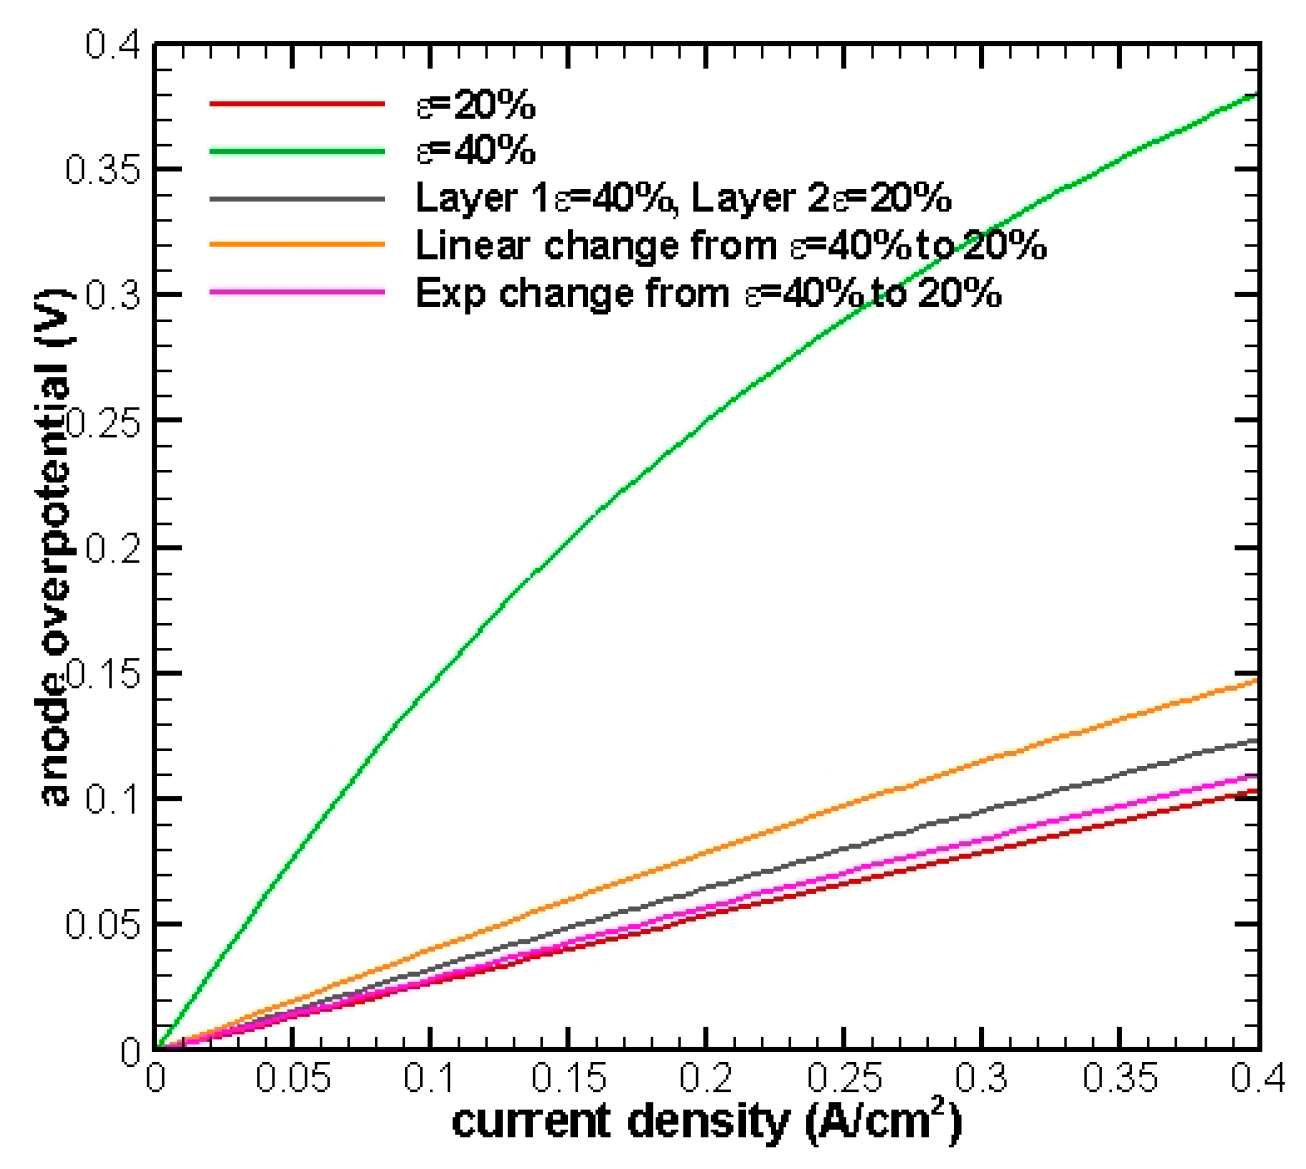
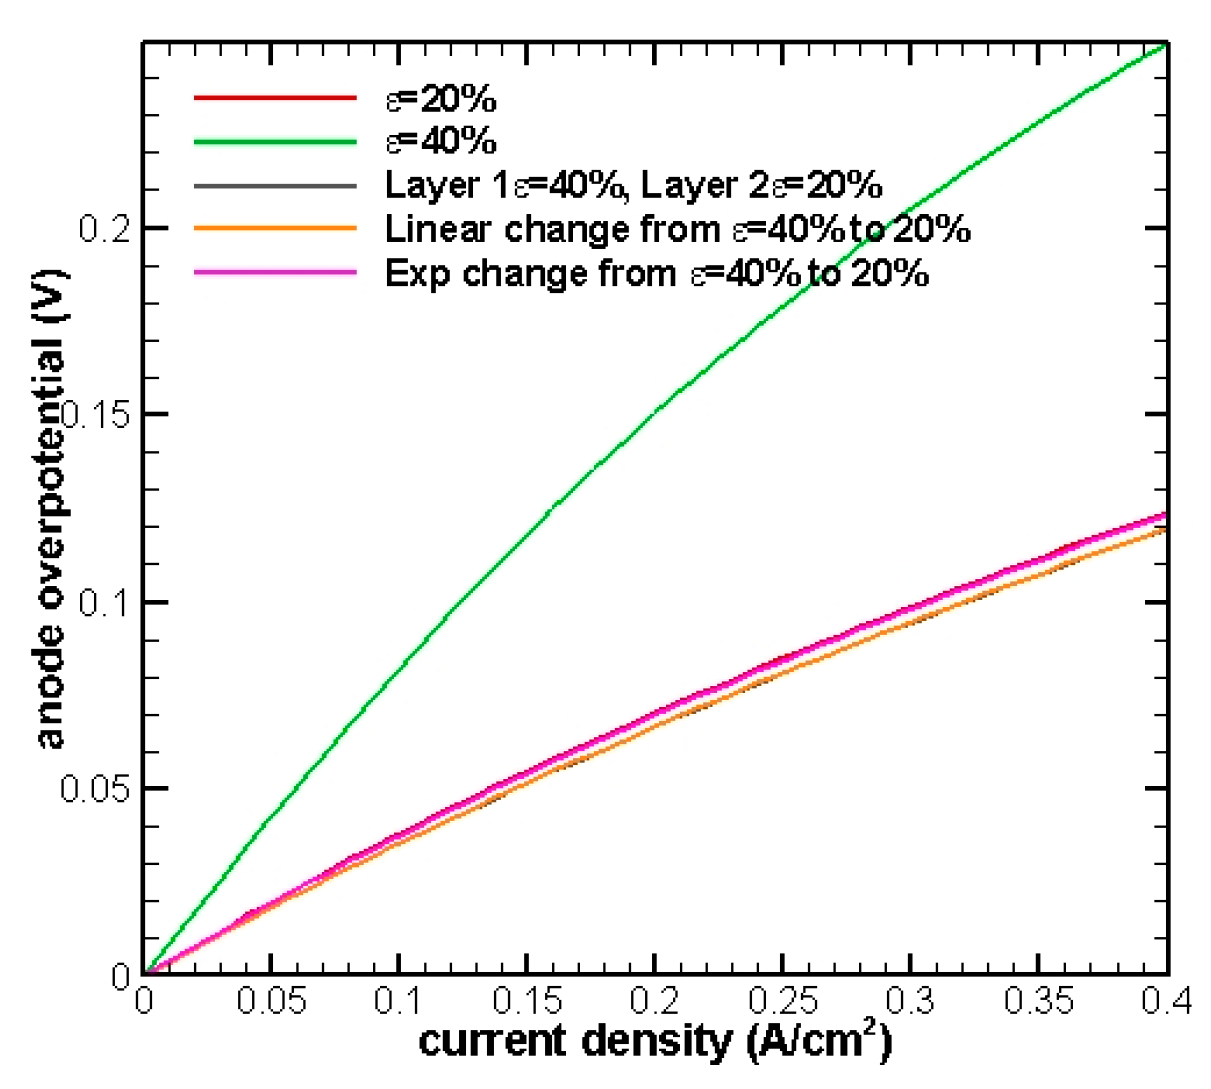
The simulation results are shown in
Figure 2 and it can be observed that a smaller porosity will result in better cell performance by reducing the overpotential.
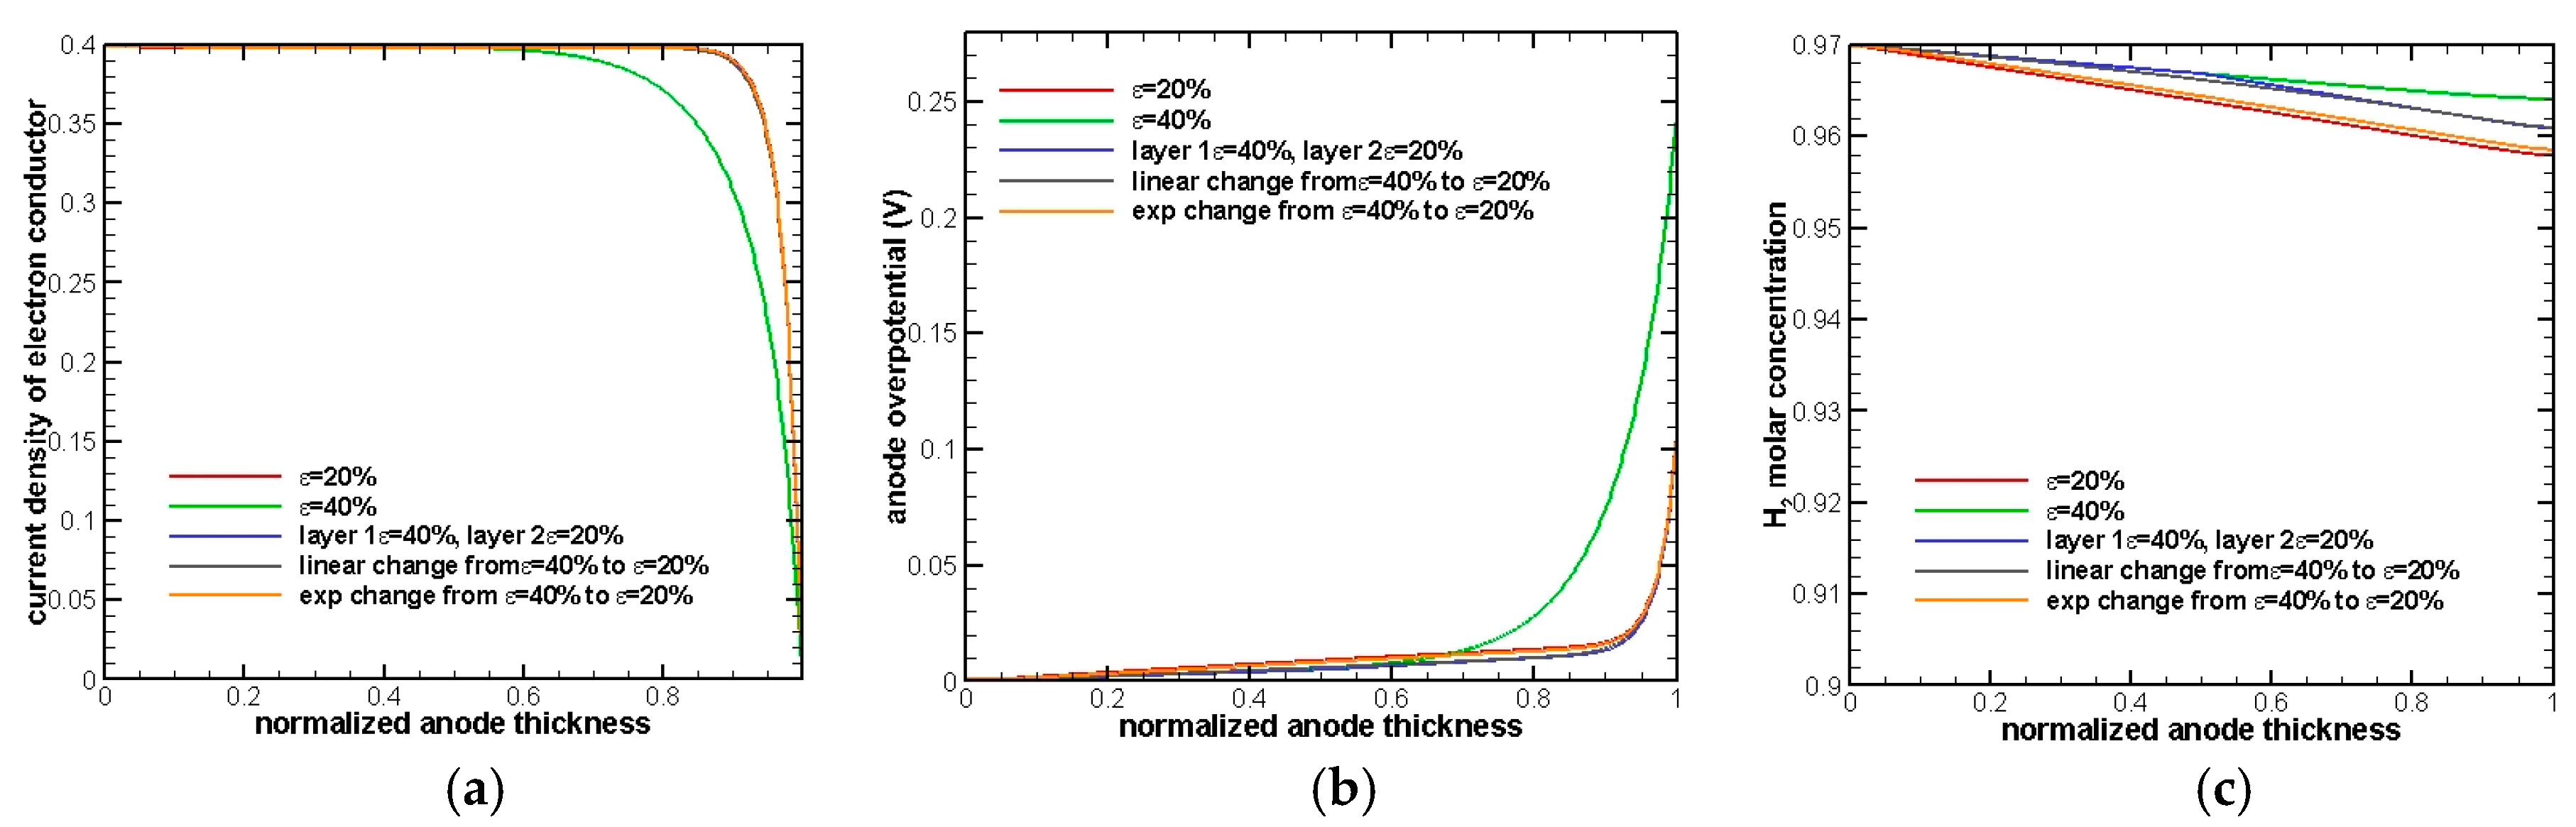
This result is reasonable and can be interpreted from a detailed analysis, in
Figure 3, at current density equals to 0.4 A/cm
2.
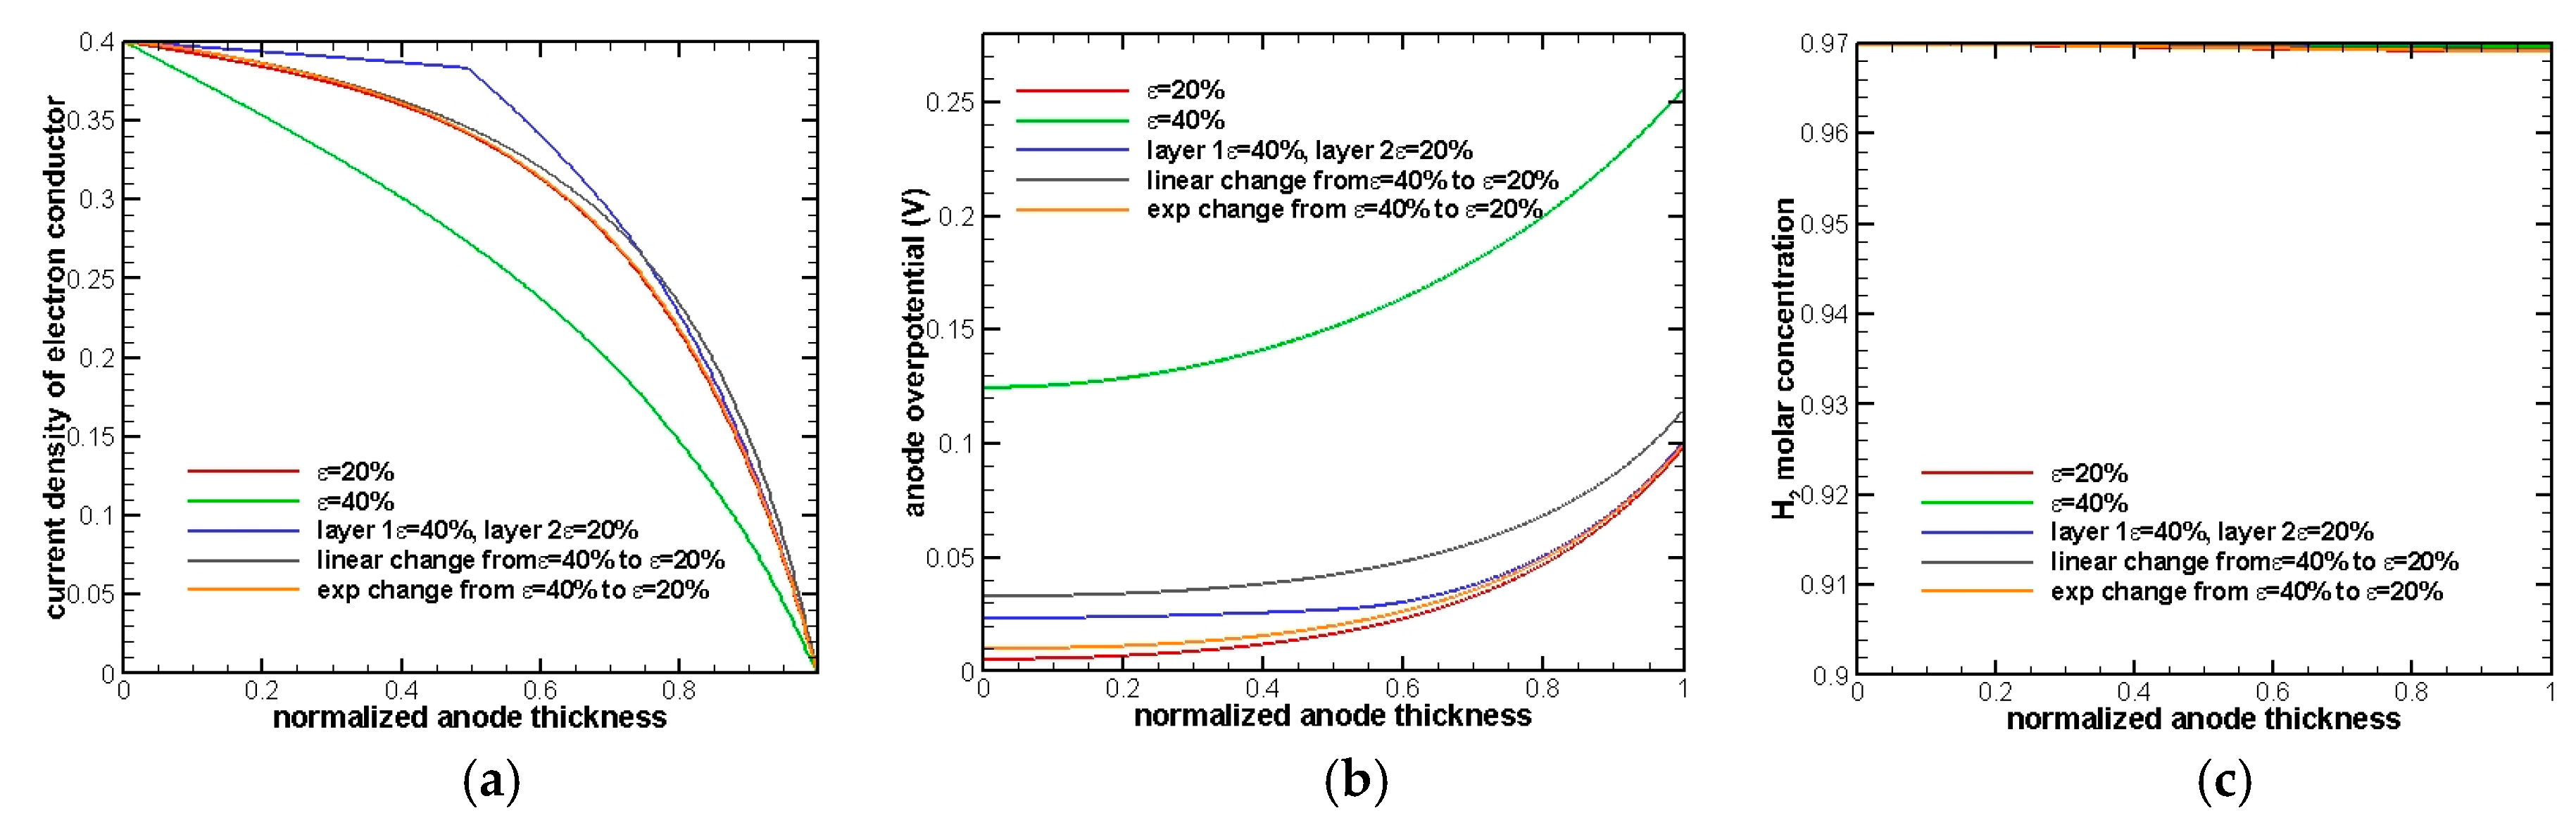
The change of current density in the electron conductor is an indicator of the occurrence of an electrochemistry reaction and its rate. If a steep drop on the current density is observed, it means that the electrochemical reaction starts to occur, and the gradient of the curve represents the rate of the electrochemical reaction. As a result, it can be seen in
Figure 3a that the electrochemical reaction occurs throughout the whole anode and that makes activation overpotential dominate the whole overpotential.
Figure 3b shows that the electrode with 20% porosity has the minimum overpotential while 40% has the maximum overpotential. The results are exactly as we anticipated because a smaller porosity will provide a larger active surface area and, hence, reduce activation overpotential. Exponential change of porosity has the second minimum overpotential, because most of the porosity value in the anode is close to 20%. In addition, it can be seen that the two-layer electrode turns out to show a better performance after comparing with a linear change porosity electrode.
Figure 3c shows the distribution of H
2 in the normalized anode. Since the anode thickness is extremely thin (30 µm), there is almost no diffusion resistance in the whole electrode and that makes concentration of H
2 at the EE surface remain almost the same as the inlet condition.
3.2. Intermediate Anode Thickness
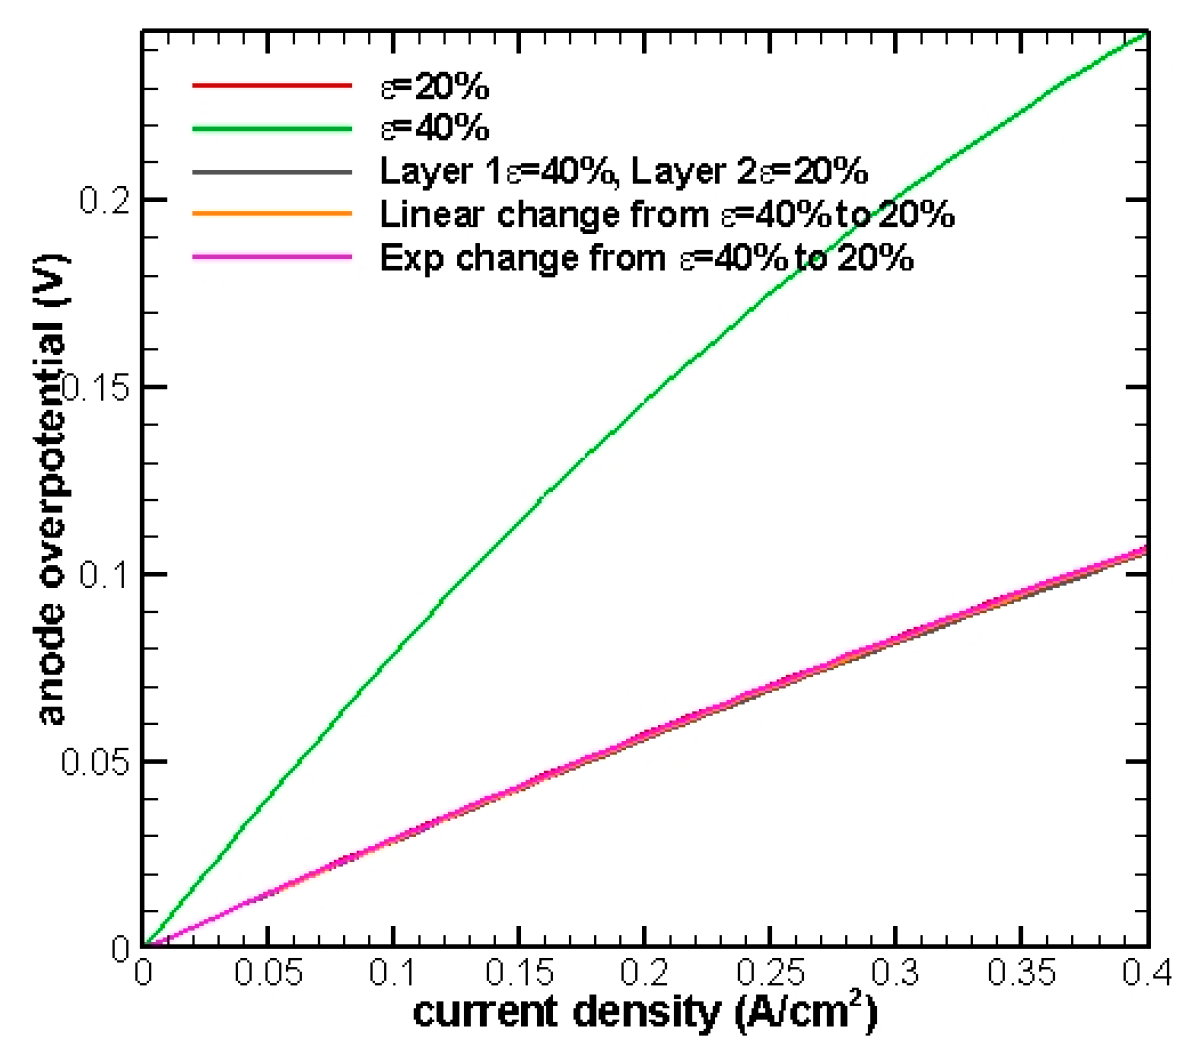
In the previous test, diffusion does not play an important role due to an extremely thin anode thickness. Next, we would like to take this factor into consideration and explore the FGEs performance for a thicker anode. The same test cases will be run again but this time the anode thickness is intentionally increased from 30 μm to 300 μm.
Figure 4 shows that all of the curves are clustered together and almost overlap with each other except in the 40% porosity case. This indicates that the effects of diffusion start coming into play. Smaller porosity will not always provide the best performance, since the completeness of mass transfer is more favorable to a larger porosity.
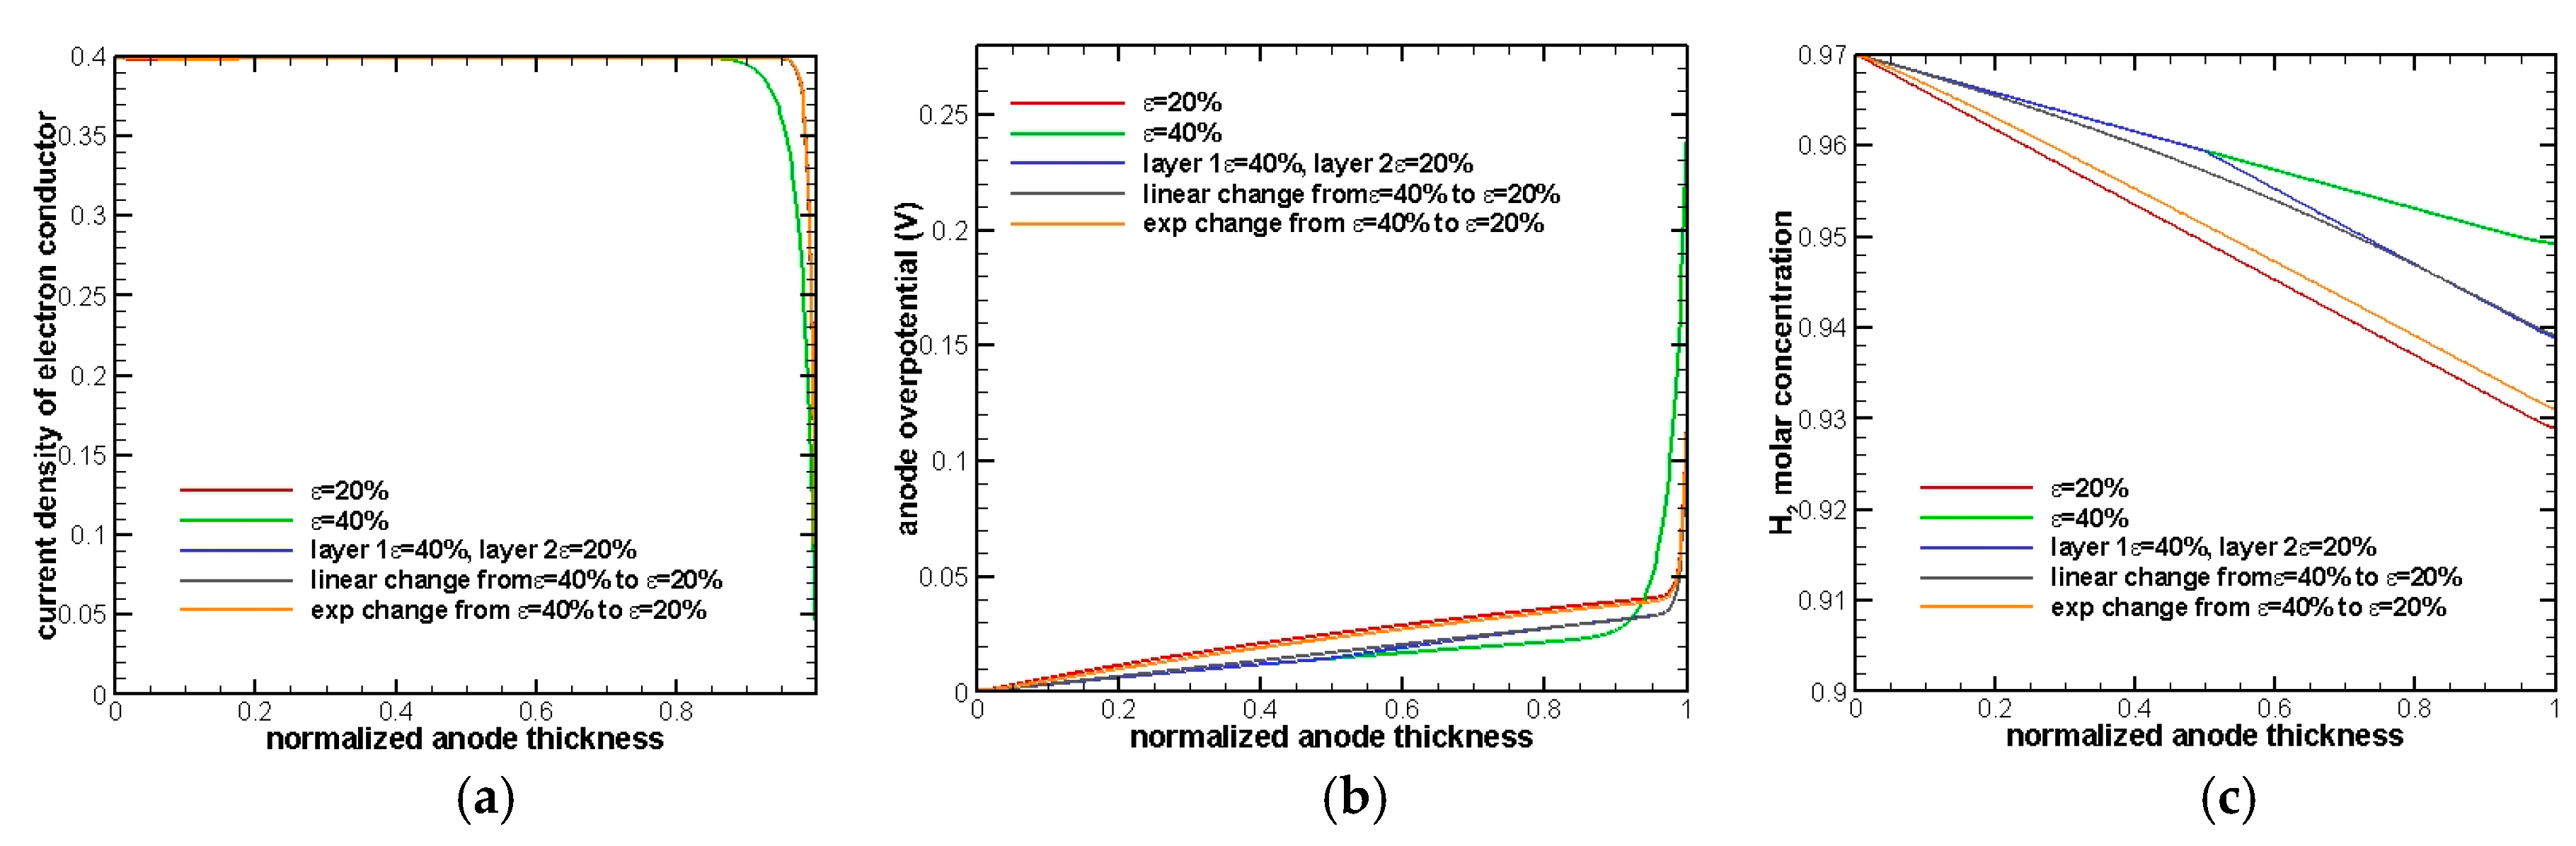
A similar conclusion can also be drawn from the detailed plots in
Figure 5.
Figure 5a shows current density in electron conductor variation throughout the anode. The gradient of this quantity represents the rate of electrochemical reactions. For most of the anode, the gradient is almost zero, indicating that there is no electrochemical reaction that occurs. When approaching the TPB region, the slope drops sharply, representing that an electrochemical reaction starts to take place.
Figure 5b also illustrates that the diffusion process dominates about 80% of the whole anode and then takes over by electrochemical reactions. Moreover, H
2 molar concentration at the EE interface drops to a lower value in
Figure 5c compared to
Figure 3c. This demonstrates that the concentration overpotential caused by the fuel mass transfer starts to play a more important role in affecting the cell performance as the thickness of an electrode increases.
3.3. Thick Anode Thickness
In the end, a typical anode-supported cell is tested as well. The anode thickness is chosen to be equal to 1000 μm. As shown in
Figure 6, the results of the linear change and two-layer porosity are comparable and they both provide better performance than the uniform 20%, 40%, and exponential distribution of porosity.
The results are anticipated, and the explanations are as follows. Concentration overpotential will contribute more to the overall overpotential as the anode thickness gets thicker.
Figure 7a shows that an electrochemical reaction only takes place within about 10% of the whole anode region near the EE interface, elsewhere, it is dominated by mass transfer. Larger porosity will benefit diffusion and thus reduce concentration overpotential. As indicated in
Figure 7c, the electrode with a 40% porosity has the minimum concentration overpotential, since this porosity value will best facilitate mass transfer and make molar concentration H
2 to be highest at the EE interface. The same conclusion can also be found in
Figure 7b, which is the overpotential distribution in the normalized anode. For almost 90% of the anode, overall overpotential is governed by concentration overpotential and the anode with a 40% porosity has the minimum overall overpotential. As it approaches the EE surface, activation overpotential starts to climb dramatically. Anodes with smaller a porosity have a higher jumping slope, representing a faster reaction rate due to more available reaction sites. Since activation overpotential contributes a lot more to the overall overpotential compared with the concentration overpotential, as shown in
Figure 7b, 40% porosity will still provide the worst performance, even though this case has the minimum concentration overpotential. In contrast, the linear change and two-layer porosity case show the best performance because these porosity distributions will aid both mass transfer and electrochemical reaction, and hence demonstrate the potential to improve SOFC performance.
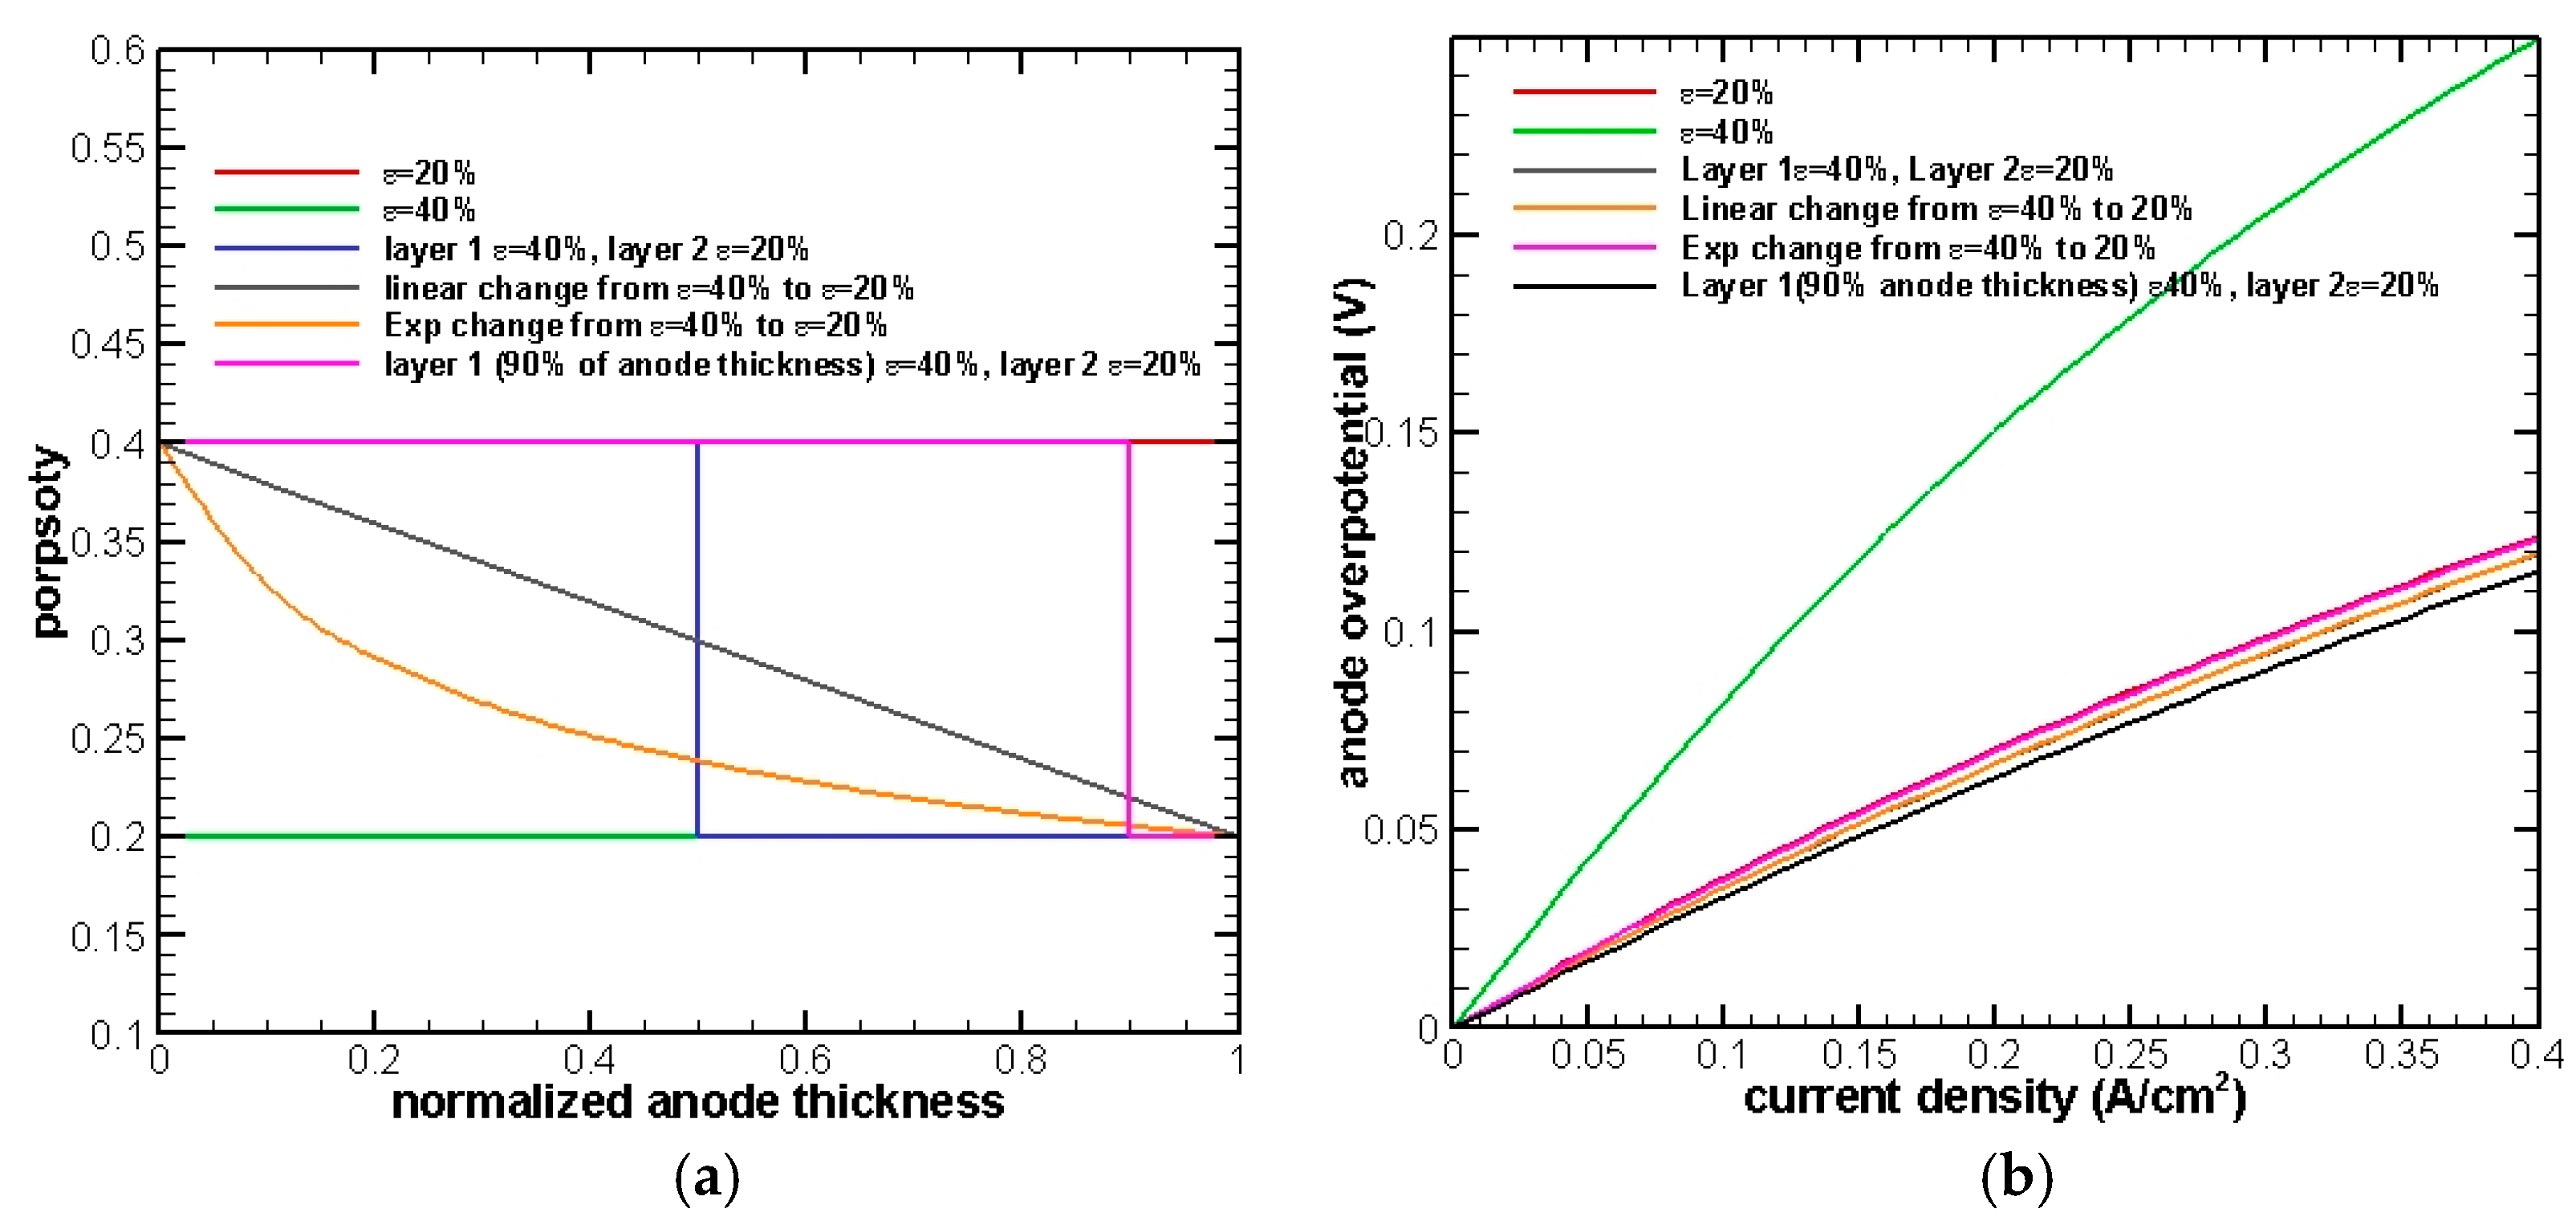
From the results shown in
Figure 7, it can be seen that almost 90% of the anode is governed by mass transfer, and the rest is dominated by electromechanical reactions. In order to further improve the cell performance, a two-layer porosity grading is proposed as follows. For 90% of the anode thickness near the EE interface, a 40% porosity will be applied to boost the mass transfer process, whereas a 20% porosity is employed to enhance electrochemical reactions for the remaining 10% of the anode near the fuel channel. The black curve in
Figure 8b shows the best performance compared with the previous tests, demonstrating a consistency of reasonable assumption and mathematical simulation.
3.4. Discussion
In summary, functional grading is not really necessary for a thin anode, as activation overpotential will be the only factor affecting cell operation. Therefore, a smaller porosity will provide more electrochemical reaction sites and, hence, provide a better performance. However, for an anode-supported cell, functional grading will improve cell performance by reducing both concentration overpotential and activation overpotential after comparison with conventionally non-graded electrodes. Better performance can be obtained by applying a coarser porosity near the fuel channel and a denser porosity near the EE interface.
4. Conclusions
A numerical model that can capture the correlations of microstructural parameters is implemented to study the advantages of FGEs in SOFCs. The understanding of impact of functionally-graded anodes on cell performance is investigated at a micro-scale level. It was demonstrated that applying FGEs to SOFCs will achieve a better cell efficiency for supporting anodes after comparing with uniform non-graded anodes, by boosting the electrochemical reaction rate and accelerating the mass transfer process. On the contrary, FGEs will play a trivial role in affecting thin anodes.


