Article

Performance Comparison on Repowering of a Steam Power Plant with Gas Turbines and Solid Oxide Fuel Cells

Department of Mechanical Engineering, Thermal Energy Section, Technical University of Denmark, Nils Koppels Allé, Copenhagen 2800, Denmark
Energies 2016, 9(6), 399; https://doi.org/10.3390/en9060399
Submission received: 22 March 2016 / Revised: 3 May 2016 / Accepted: 11 May 2016 / Published: 26 May 2016
(This article belongs to the Special Issue Solid Oxide Fuel Cells)

Abstract

:
Repowering is a process for transforming an old power plant for greater capacity and/or higher efficiency. As a consequence, the repowered plant is characterized by higher power output and less specific CO2 emissions. Usually, repowering is performed by adding one or more gas turbines into an existing steam cycle which was built decades ago. Thus, traditional repowering results in combined cycles (CC). High temperature fuel cells (such as solid oxide fuel cell (SOFC)) could also be used as a topping cycle, achieving even higher global plant efficiency and even lower specific CO2 emissions. Decreasing the operating temperature in a SOFC allows the use of less complex materials and construction methods, consequently reducing plant and the electricity costs. A lower working temperature makes it also suitable for topping an existing steam cycle, instead of gas turbines. This is also the target of this study, repowering of an existing power plant with SOFC as well as gas turbines. Different repowering strategies are studied here, repowering with one gas turbine with and without supplementary firing, repowering with two gas turbines with and without supplementary firing and finally repowering using SOFC. Plant performances and CO2 emissions are compared for the suggested repowered plants.

1. Introduction

Due to the ever-increasing demand for more power production and distribution, one of the main topics of research and development in the field of electricity generation are improving efficiency and reducing pollutant emissions. Transforming an old power plant for a greater capacity and/or higher efficiency is known as repowering. One way of repowering is by adding one or more gas turbines into a plant as a topping cycle, thus converting an existing steam power plant into a combined cycle (CC) system. It would be ideal for an old steam plant in which steam turbine(s) after many years of operation still have considerable service life expectancy, but for example the boiler is ready to be replaced (due to a shorter lifecycle). The boilers are normally replaced or supplemented with gas turbines and heat recovery steam generators (HRSG), see e.g., [1].
Due to the rapid growth of electricity consumption, there is an increased interest in converting old coal fired steam plants into CC plants to increase their power output and efficiency, and at the same time, decrease their emissions, see e.g., [2,3]. However, it shall also be noted that since the share of renewable energy systems in electricity generation is increasing in some regions (such as in Europe) then the CC operating mode in those countries may start to shift (or has already shifted) from base- and medium-load to part-load. This is seen in some European countries such as in Denmark where the share of wind energy is increasing every year, see e.g., [4].
Currently repowering of steam plants can be achieved in two ways: feed water repowering and boiler repowering, see e.g., [5,6]. The first option uses heat from the turbine exhaust to raise the feed water temperature instead of bleeding steam. This means that increased steam flow has to be managed by the low pressure section of the original steam turbine, requiring either extensive modification of the steam turbine or impairing the repowered plant performance. The other option, boiler repowering, entails major steam generator redesign or replacement. Gas turbine exhaust gas is used as the heat source for the existing steam cycle. This increases plant efficiency close to that of new combined cycle plants. Such repowering has been performed on various old steam plants, see e.g., [3,7,8]. The second option is widely used across developed countries in which many steam plants are relatively old and are coal fired. This option is also investigated in this study. Economic analysis of repowering by means of gas turbines has also been investigated widely such as in [9,10,11].
Steam turbine units in older power stations generally have relatively low steam data and can easily be adapted for use in combined cycles as the bottoming cycle for a gas turbine (gas turbines). Depending on the steam plant data such as live steam temperature, pressure and mass flow, one needs to screen available gas turbines in the market and choose the one which can easily be adapted for the basic steam plant without changing its original configurations. If one gas turbine cannot supply the required heat and temperature then one may complement the repowering with a supplementary firing or by using more gas turbines. Both options will be used in this study.
In the present study, it is also suggested to use a third option which is repowering with solid oxide fuel cell stacks (SOFCs). Solid oxide fuel cell (SOFC) stacks may soon enter the commercialization phase and therefore it would be interesting to integrate such technology into repowering of old steam plants. SOFCs are one of the most promising types of fuel cells, particularly regarding energy production. They are expected to produce clean electrical energy at high conventional rates with low noise and pollutant emissions [12]. The exhaust temperatures of SOFCs are high due to the high operating temperature of the cells. Additionally, because the fuel utilization in the fuel cell is less than 100 percent, the unreacted fuel needs to be combusted in a burner. This combustion in turn produces even hotter off-gases that are perfectly suited for use in a steam generator to produce steam for the bottoming steam cycle.
Numerous studies in the literature have investigated SOFC-based power systems and suggested high thermal efficiencies. However, the majority of these studies use gas turbines as the bottoming cycle, see e.g., [13,14,15]. A steam turbine has also been used as a bottoming cycle [16,17], resulting in high plant efficiency, but no study was found on repowering an old steam plant with SOFCs, which is the basis of this study. At present, using the Brayton and Rankine cycles as bottoming cycles for SOFCs seems to be the most practical because of the maturity of these technologies. Given that the development trends suggest that the operating temperature of the SOFC will decrease, using gas turbines as bottoming cycles will become less beneficial over time.
The present work is an analytical study that conducts a thermodynamic investigation of repowering of old steam plants with SOFCs that also functions as a topping cycle for a steam plant using the heat from the off-gasses exhausted from the topping cycle. The results will be compared with the traditional repowering strategies using gas turbines as the driving heat source. One gas turbine with supplementary firing, two gas turbines as well as two gas turbines with supplementary firing will also be studied. The comparison will be carried out in terms of plant efficiency and CO2 emission as the most important parameters. It should be noted that the SOFCs used in this study are based on a theoretical model with empirical coefficients calibrated from experimental data.
Despite numerous studies on SOFC-based power plants, no investigation on steam plant repowering with SOFCs has been found in the open literature, and therefore, the current investigation seems to be completely novel and might provide new ideas for designing more efficient and less pollutant energy systems for future applications. It should also be noted that the system presented here is studied thermodynamically and that the objective of this study is not to present the associated costs. However, a simple cost analysis is included to compare the additional cost of repowering with different techniques. The performances of the various plants are compared in terms of efficiency, CO2 emission, fuel consumption and other related parameters.

2. Original Plant Model

The principal components of the plant are the burner, steam generator, high pressure turbine (HP), two intermediate pressure turbines (IP), low pressure turbine (LP), condenser and deaerator. The coal burner provides the heat needed for generating steam in a single pressure level steam generator through economizer (Eco), evaporator (Eva) and super heater (SH). Three steam extractions from the steam turbines are used to preheat (PH) the sub-cooled water after the condenser. Coal is supplied at point 61 in Figure 1 while ash is removed from the burner at point 62 in Figure 1. The coal composition (mass based) is assumed to be 0.7818 C (solid form), 0.0489 H2, 0.0603 O2, 0.0171 N2, 0.0102 S (solid form) and 0.0817 water (liquid form). The net calorific and gross caloric values are 31,120 kJ/kg and 32,380 kJ/kg, respectively, with a mean mole mass of 10.34 kg.
The plant net output power is 264MW with an efficiency of 33% (LHV).Live steam temperature, pressure and mass flow (point 1 in Figure 1) is 500 °C, 80 bar and 280 kg/s, respectively. The power required to generate such steam is about 756.168 MW, which can be calculated from the enthalpy difference between the economizer inlet and super heater outlet (live steam) multiplied by the mass flow rate. This of course is lower than coal power input due to losses through air preheating and air compressor for the boiler. The main parameters for the turbines are summarized in Table 1.
Ambient conditions are assumed to be 25 °C and 1.01 bar, both for air (point 49 in Figure 1) and coal (point 61 in Figure 1). The isentropic efficiency of the turbines is calculated from the real data of the existing plant by means of the turbine constant defined here. The turbine constant is a parameter that depends on the turbine mass flow, the inlet temperature as well as inlet and outlet pressure defined as (see e.g., [18]):
C T = m ˙ T p i n 2 p o u t 2
As mentioned above, in the repowering studied here the current existing steam plant will not be changed and only the boiler will be replaced with a HRSG. Another important issue to be mentioned is that in the existing coal fired steam plant the steam temperature entering the boiler (point 14 in Figure 1) is rather high, 164 °C, and the reason is to decrease the heat demand from burning the coal. In the repowering technique used here (the existing plant balance of the steam cycle is not be changed at all), then such high a steam temperature in the boiler does not allow having high plant efficiency. The reason is that the off-gases temperature on the other side of the economizer must be higher and therefore off-gases will be exhausted at a temperature higher than 164 °C (economizer pinch temperature). However, in a new designed combined cycle the steam temperature entering the economizer will be kept as low as possible to recover as much off-gas energy as possible. In designing a new combined cycle the steam temperature to the HRSG shall be as low as possible and the reason is to recover the exhaust gas from the gas turbines as much as possible. Other important data are shown in Table 2.

3. Modelling

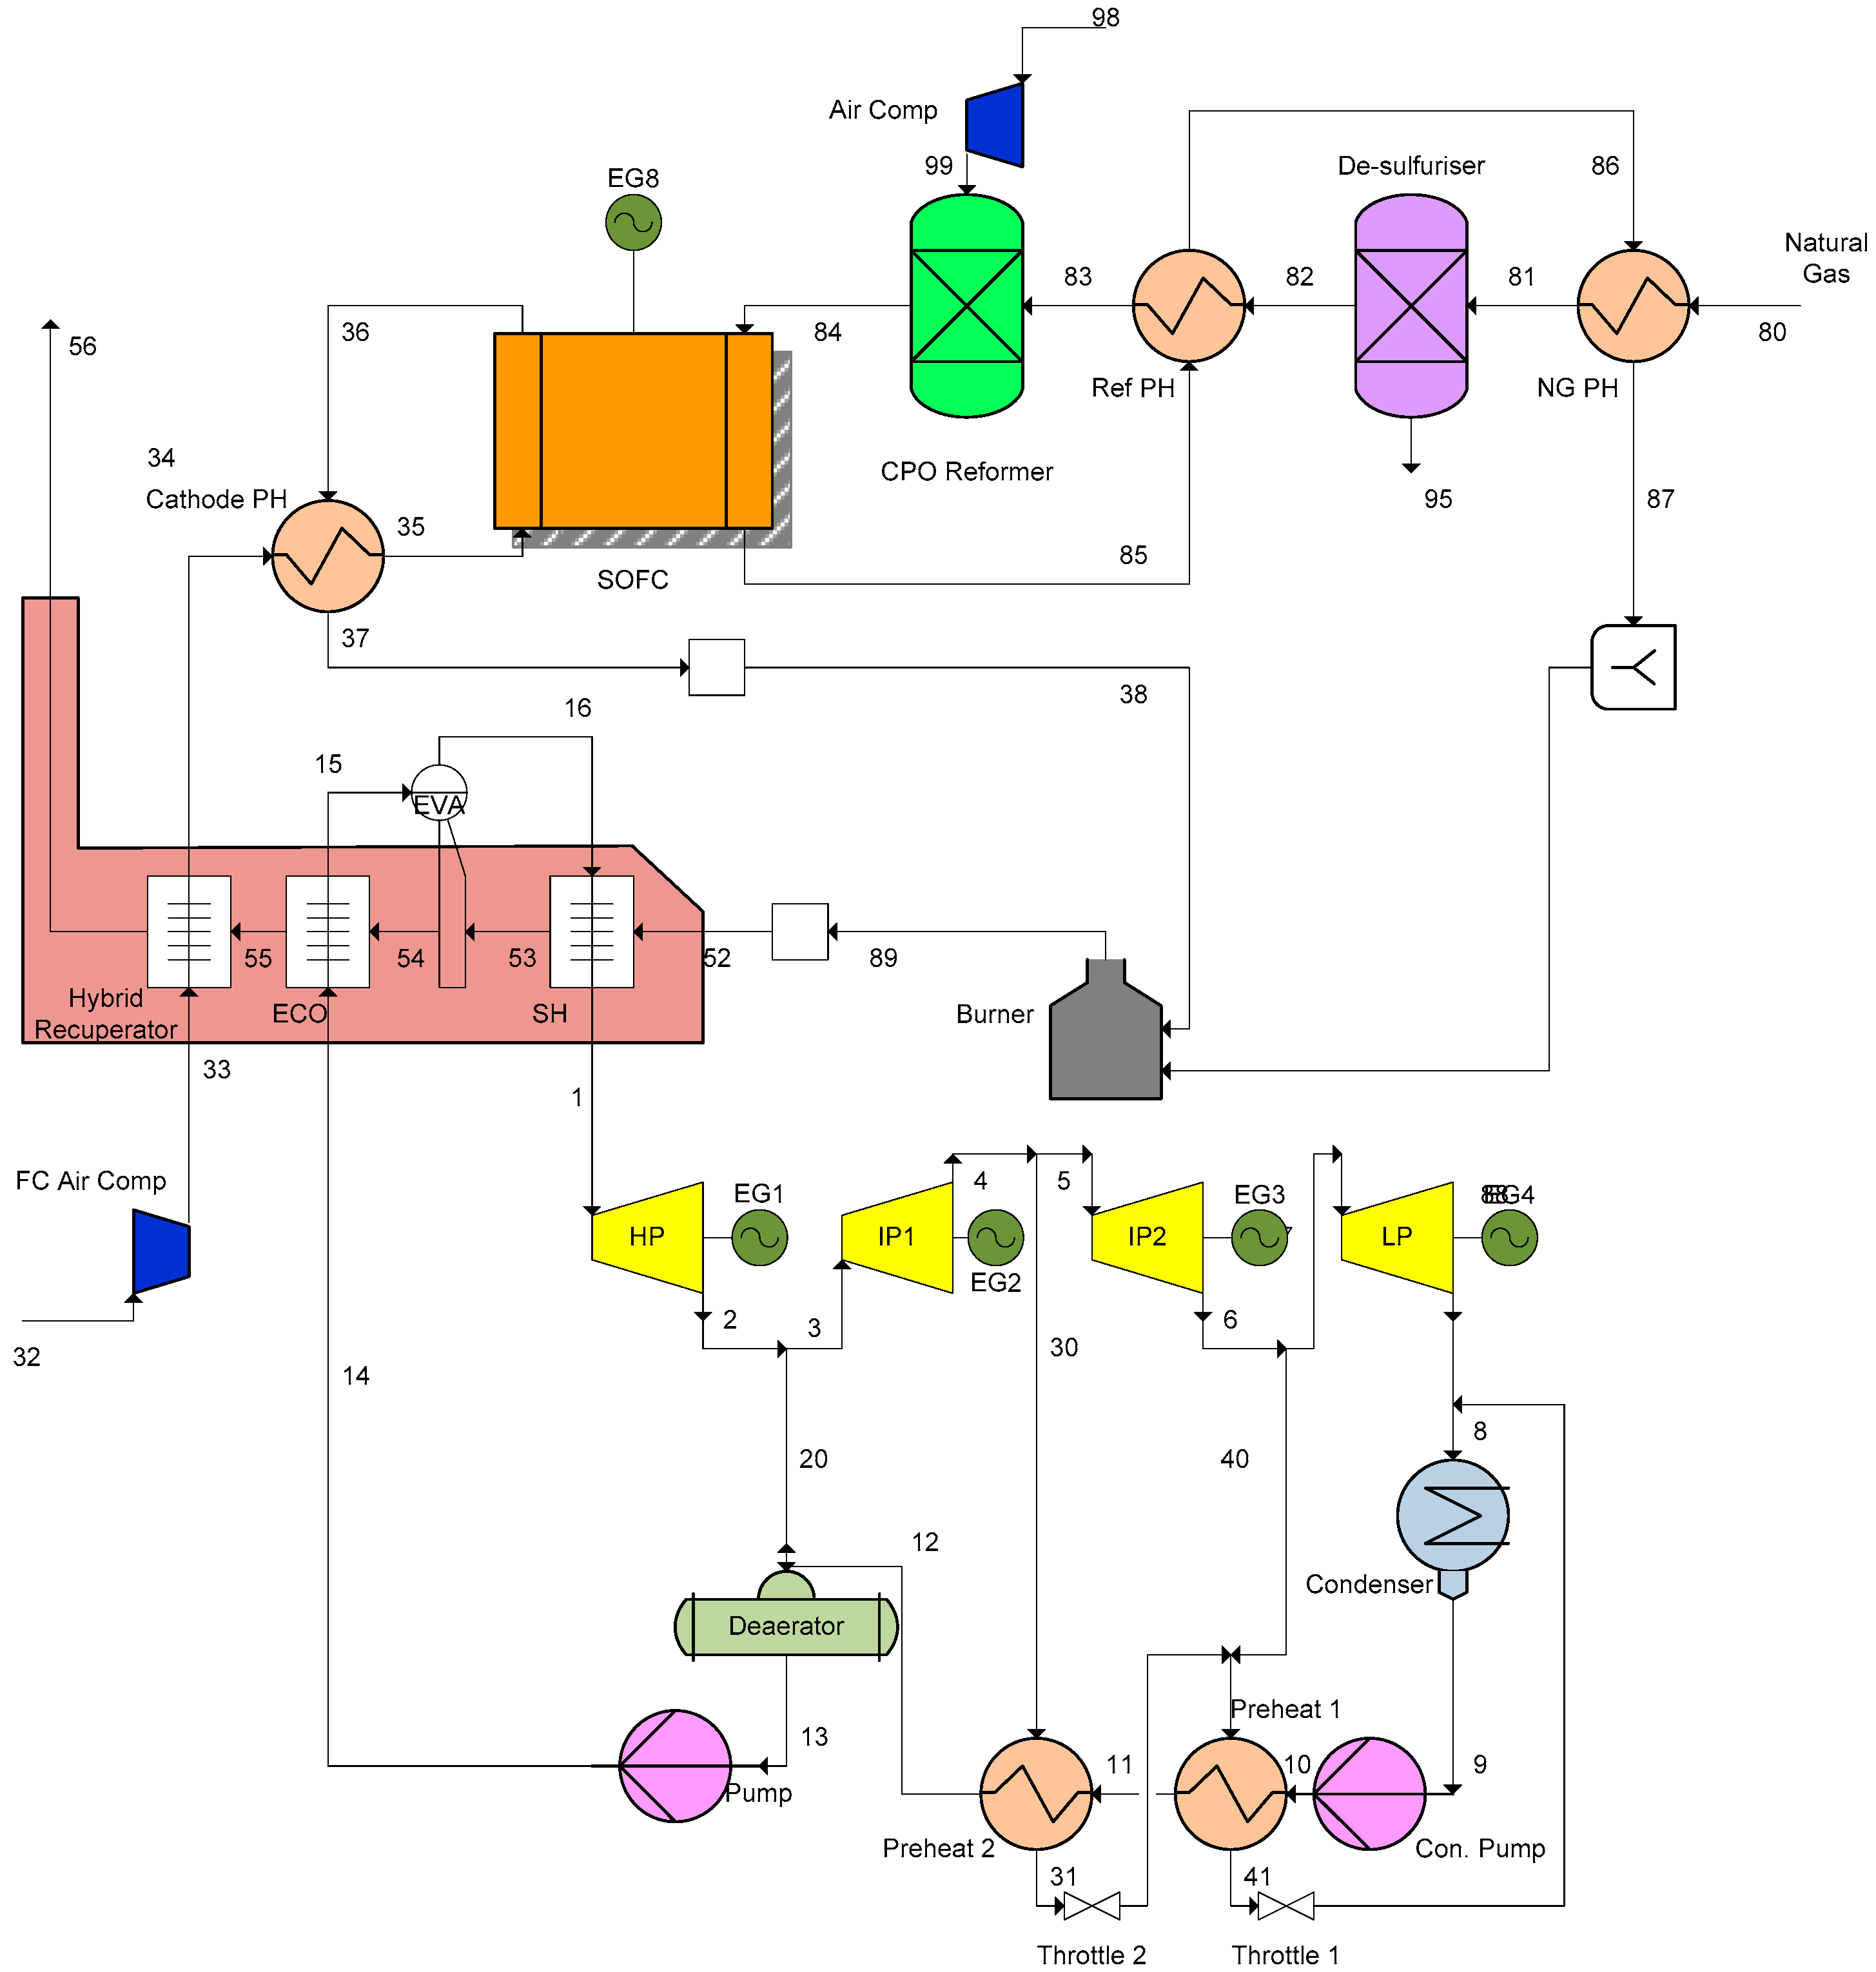
The modeling for SOFC and gas turbine will be briefly explained below while modeling of other components will be referred to previous publications.

3.1. SOFC Modeling

The SOFC model developed in [19] is used in this investigation, which is calibrated against experimental data for a planar SOFC type with a relative error of about ±3%. For the sake of clarity, it is briefly described here. In such modeling one must distinguish between electrochemical modeling, calculation of cell irreversibility (cell voltage efficiency) and the species compositions at outlet. For electrochemical modeling, the operational voltage (Ecell) was found to be:
E c e l l = E N e r n s t Δ E a c t Δ E o h m Δ E c o n c
where ENernst, ΔEact, ΔEohm and ΔEconc are the Nernst ideal reversible voltage, activation polarization, ohmic polarization and concentration polarization, respectively. Assuming that only hydrogen is electrochemically converted, then the Nernst equation can be written as:
E N e r n s t = Δ g f 0 n e F + R T n e F ln ( p H 2 , tot p O 2 p H 2 O )
p H 2 , tot = p H 2 + p CO + 4 p CH 4
where Δgf0 is the Gibbs free energy (for H2 reaction) at standard pressure. The water-gas shift reaction is very fast and therefore the assumption of hydrogen as only species to be electrochemically converted is justified, see [20,21]. In the above equations pH2 and pH2O are the partial pressures for H2 and H2O, respectively.
The activation polarization can be evaluated from the Butler-Volmer equation [22,23], which is isolated from other polarizations to determine the charge transfer coefficients and exchange current density from the experiment by the curve fitting technique. It follows that:
Δ E a c t = Δ E a c t , c + Δ E a c t , a = 2 R T F [ sinh 1 ( i + i n 2 i 0 , a ) + sinh 1 ( i + i n 2 i 0 , c ) ]
where R, T, F and i are the universal gas constant, operating temperature, Faraday constant and current density, respectively. in is an internal current density added to the actual current density in order to account for the mixed potential caused by fuel crossover and electrons passing through the electrolyte. This value was adjusted when calibrating the electrochemical model against experimental data, found to be 2 mA/cm2. The anodic [24] and cathodic [25] current densities are calculated from:
i 0 , a = γ a ( p ¯ H 2 , tot p ¯ a ) ( p ¯ H 2 O p ¯ a ) exp ( E a c t , a R T )
i 0 , c = γ c ( p ¯ O 2 p ¯ c ) 0.25 exp ( E a c t , c R T )
where Eact,a = Eact,c = 1.1 × 10⁵ J/mol. The constants γa and γc are calibrated against experimental data and found to be 2.13 × 10⁷ mA/cm2 and 1.49 × 10⁷ mA/cm2, respectively [19].
The ohmic polarization [26] depends on the electrical conductivity of the electrodes as well as the ionic conductivity of the electrolyte. This was also calibrated against experimental data for a cell with anode thickness, electrolyte thickness, cathode thickness and interconnect thickness of 750, 40, 50 and 100 μm respectively and can be described as:
Δ E o h m = i ( δ a σ a + δ c σ c + δ e σ e + δ i σ i )
σ j = σ o h m , j exp ( B o h m , j T )   , j = { a , c , e , i }
The constants σohn,a, σohn,c, σohn,e and σohn,i, are assumed to be 2.98 × 10⁻⁶ kΩ·cm, 8.11 × 10⁻⁶ kΩ·cm, 2.94 × 10⁻⁶ kΩ·cm and 0.1256 × 10⁻³ kΩ·cm respectively. The constants Bohn,a, bohn,c, Bohn,e and Bohn,i, are assumed to be −1392, 600, 10,350 and 4690 K, respectively [19].
The concentration polarization is dominant at high current densities for anode-supported SOFCs, wherein insufficient amounts of reactants are transported to the electrodes and the voltage is then reduced significantly. Again the concentration polarization was calibrated against experimental data by introducing the anode limiting current, [24], in which the anode porosity and tortuosity were also included among other parameters. Neglecting the cathode contribution (see e.g., [27,28]), it can be modeled as:
Δ E c o n c = R T n e F   ( ln ( 1 + p H 2 ( i + i n ) p H 2 O i a s ) ln ( 1 i + i n i a s ) )
where ne = 2, pH2 and pH2O are the partial pressures for H2 and H2O respectively. The anode limiting current ias was assumed to be 1000 mA/cm2 in the calibration.
It should be mentioned that the SOFC model developed here aims to represent the performance of the second generation SOFC stacks developed by from Topsoe Fuel Cell A/S (TOFC) and the Fuel Cells and Solid State Chemistry Division at Risø—DTU (Technical University of Denmark, Roskilde, Denmark). This SOFC type is anode supported and the anode consists of Ni/YSZ, the electrolyte of YSZ and the cathode of LSM/YSZ [29]. As mentioned above, to fit the model with the desired stack performances, the electrochemical model is calibrated against experimental data, as shown in [19].
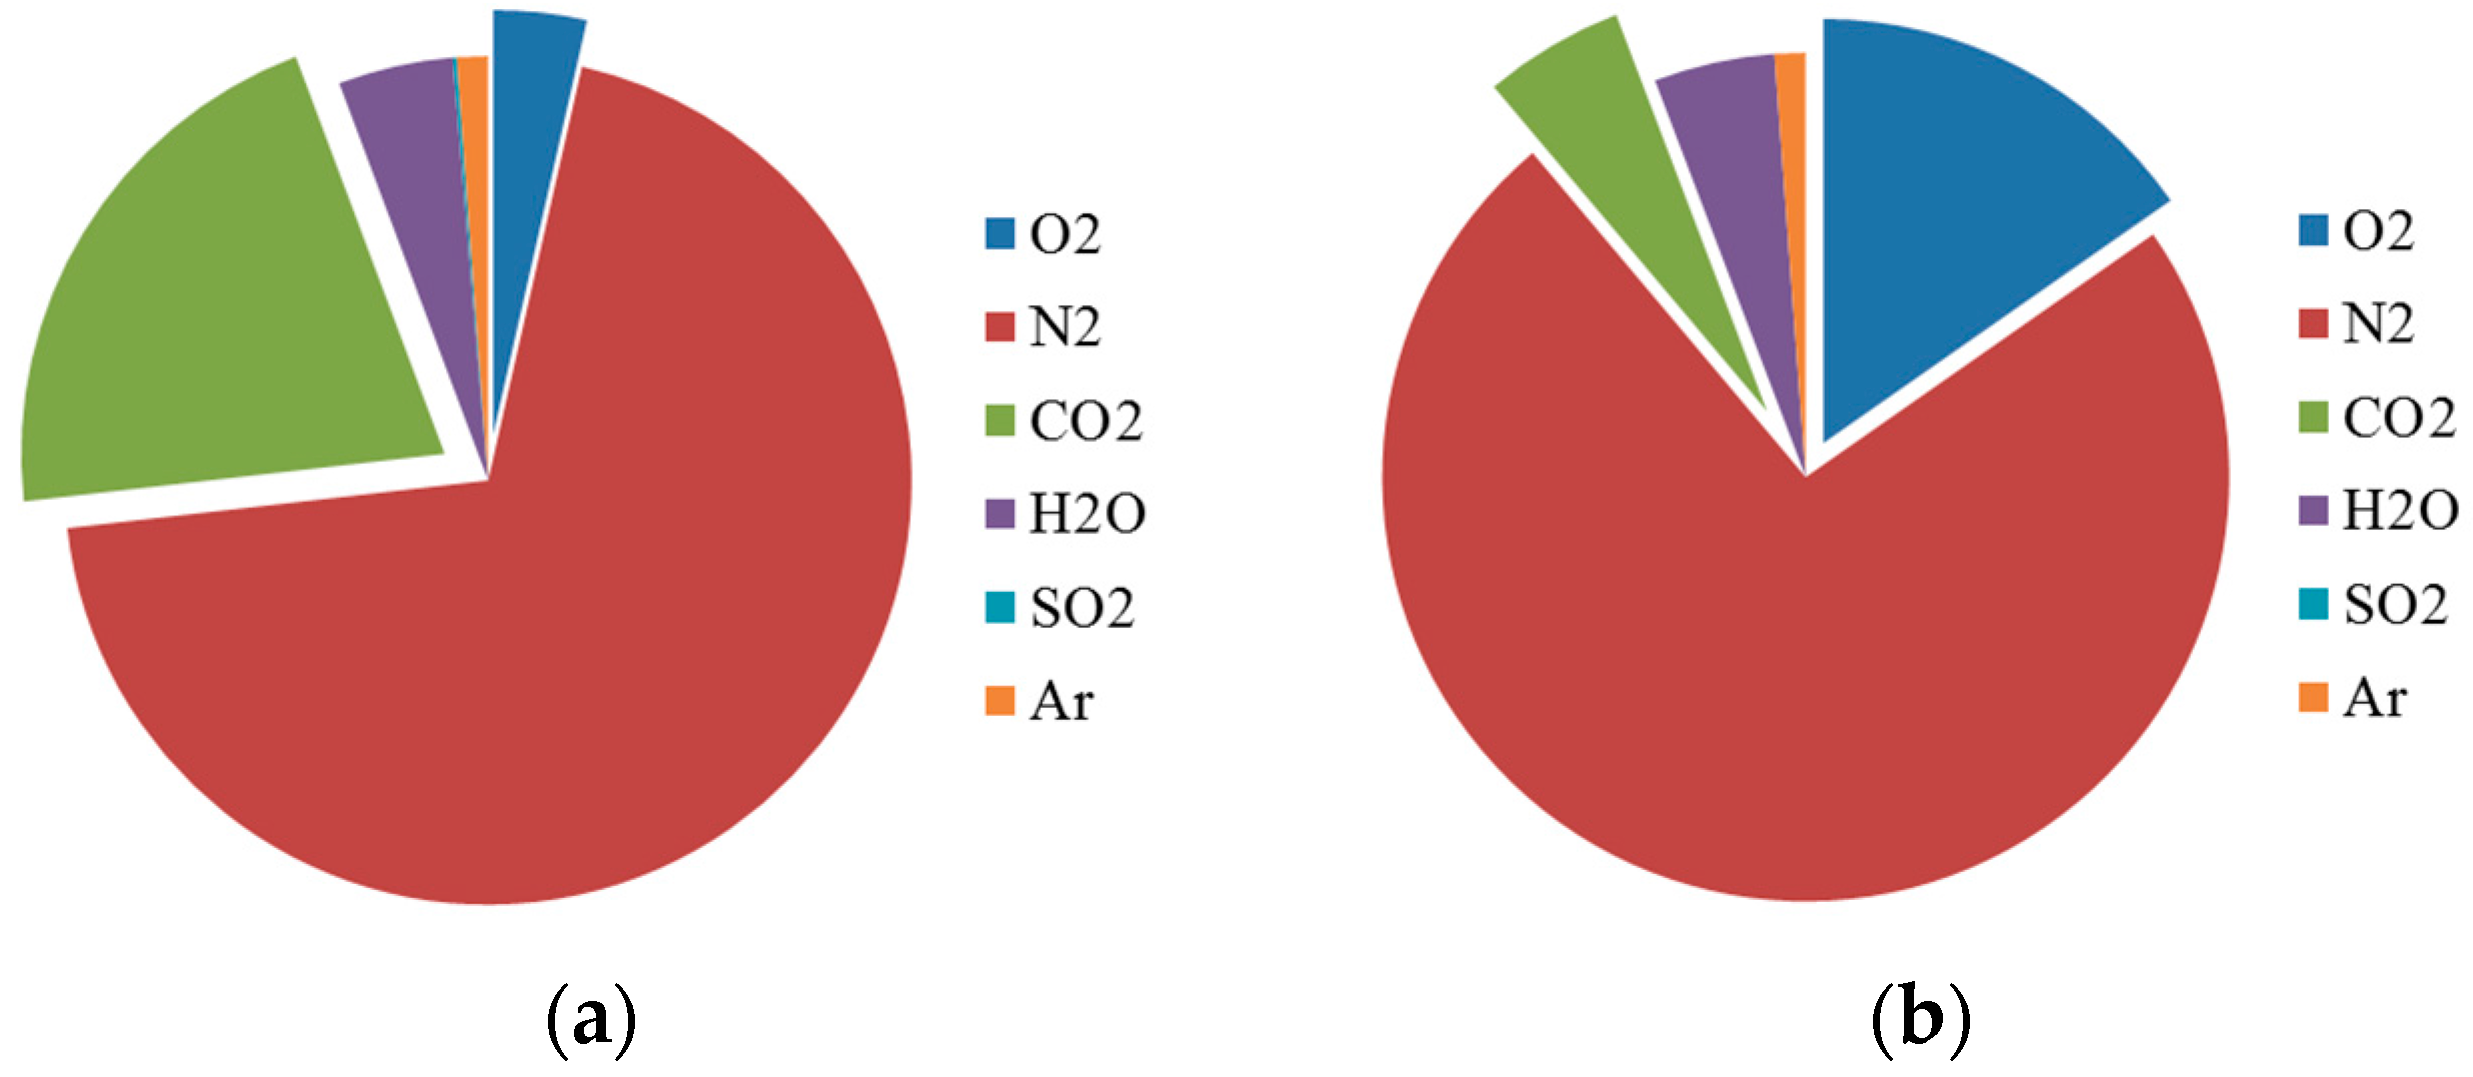
The fuel composition at anode outlet was calculated using the Gibbs minimization method as described in [30]. Equilibrium at the anode outlet temperature and pressure was assumed for the following species: H2, CO, CO2, H2O, CH4 and N2. Thus the Gibbs minimization method calculates the compositions of these species at outlet by minimizing their Gibbs energy. The equilibrium assumption is fair because the methane content in this study is very low.
To calculate the voltage efficiency of the SOFC cells, the power production from the SOFC (PSOFC) depends on the amount of chemical energy fed to the anode, the reversible efficiency (ηrev), the voltage efficiency (ηv) and the fuel utilization factor (UF). It is defined in mathematical form as:
P S O F C = ( LHV H 2 n ˙ H 2 , i n + LHV CO   n ˙ CO , i n + LHV CH 4   n ˙ CH 4 , i n )   η r e v   η v   U F
where UF was a set value and ηv was defined as:
η v = Δ E cell E N e r n s t
The reversible efficiency is the maximum possible efficiency defined as the relationship between the maximum electrical energy available (change in Gibbs free energy) and the fuels LHV (lower heating value) as follows, see e.g., [31]:
η r e v = ( Δ g ¯ f ) f u e l LHV f u e l
( Δ g ¯ f ) f u e l = [ ( g ¯ f ) H 2 O ( g ¯ f ) H 2 1 2 ( g ¯ f ) O 2 ]   y H 2 , i n   + [ ( g ¯ f ) CO 2 ( g ¯ f ) CO 1 2 ( g ¯ f ) O 2 ]   y CO , i n   + [ ( g ¯ f ) CO 2 + 2 ( g ¯ f ) H 2 O ( g ¯ f ) CH 4 2 ( g ¯ f ) O 2 ]   y CH 4 , i n
The partial pressures were assumed to be the average between the inlet and outlet as:
p ¯ j = ( y j , out + y j , in 2 ) p ¯ j = { H 2 , CO , CH 4 , CO 2 , H 2 O , N 2 } p ¯ O 2 = ( y O 2 , out + y O 2 , in 2 ) p ¯ c
Additionally, equations for conservation of mass (with molar flows), conservation of energy and conservation of momentum were also included into the model. Table 3 displays the main parameters for the SOFC stacks used in this study.

3.2. Modeling of Other Components

Modeling of other components such as desulfurization reactor, pre-refomer, etc. are adopted from the study of [32], by building a benchmark system consisting of SOFC, methanator, etc. and fed with different fuels such as natural gas, ethanol, methanol and di-methyl ether (DME). The obtained results agreed well with the corresponding data obtained by other researchers in the open literature for all fules and cases studied [32]. Standard modling for pumps, heat exchangers, tubines and compressor are used in this study, see e.g., [33,34].

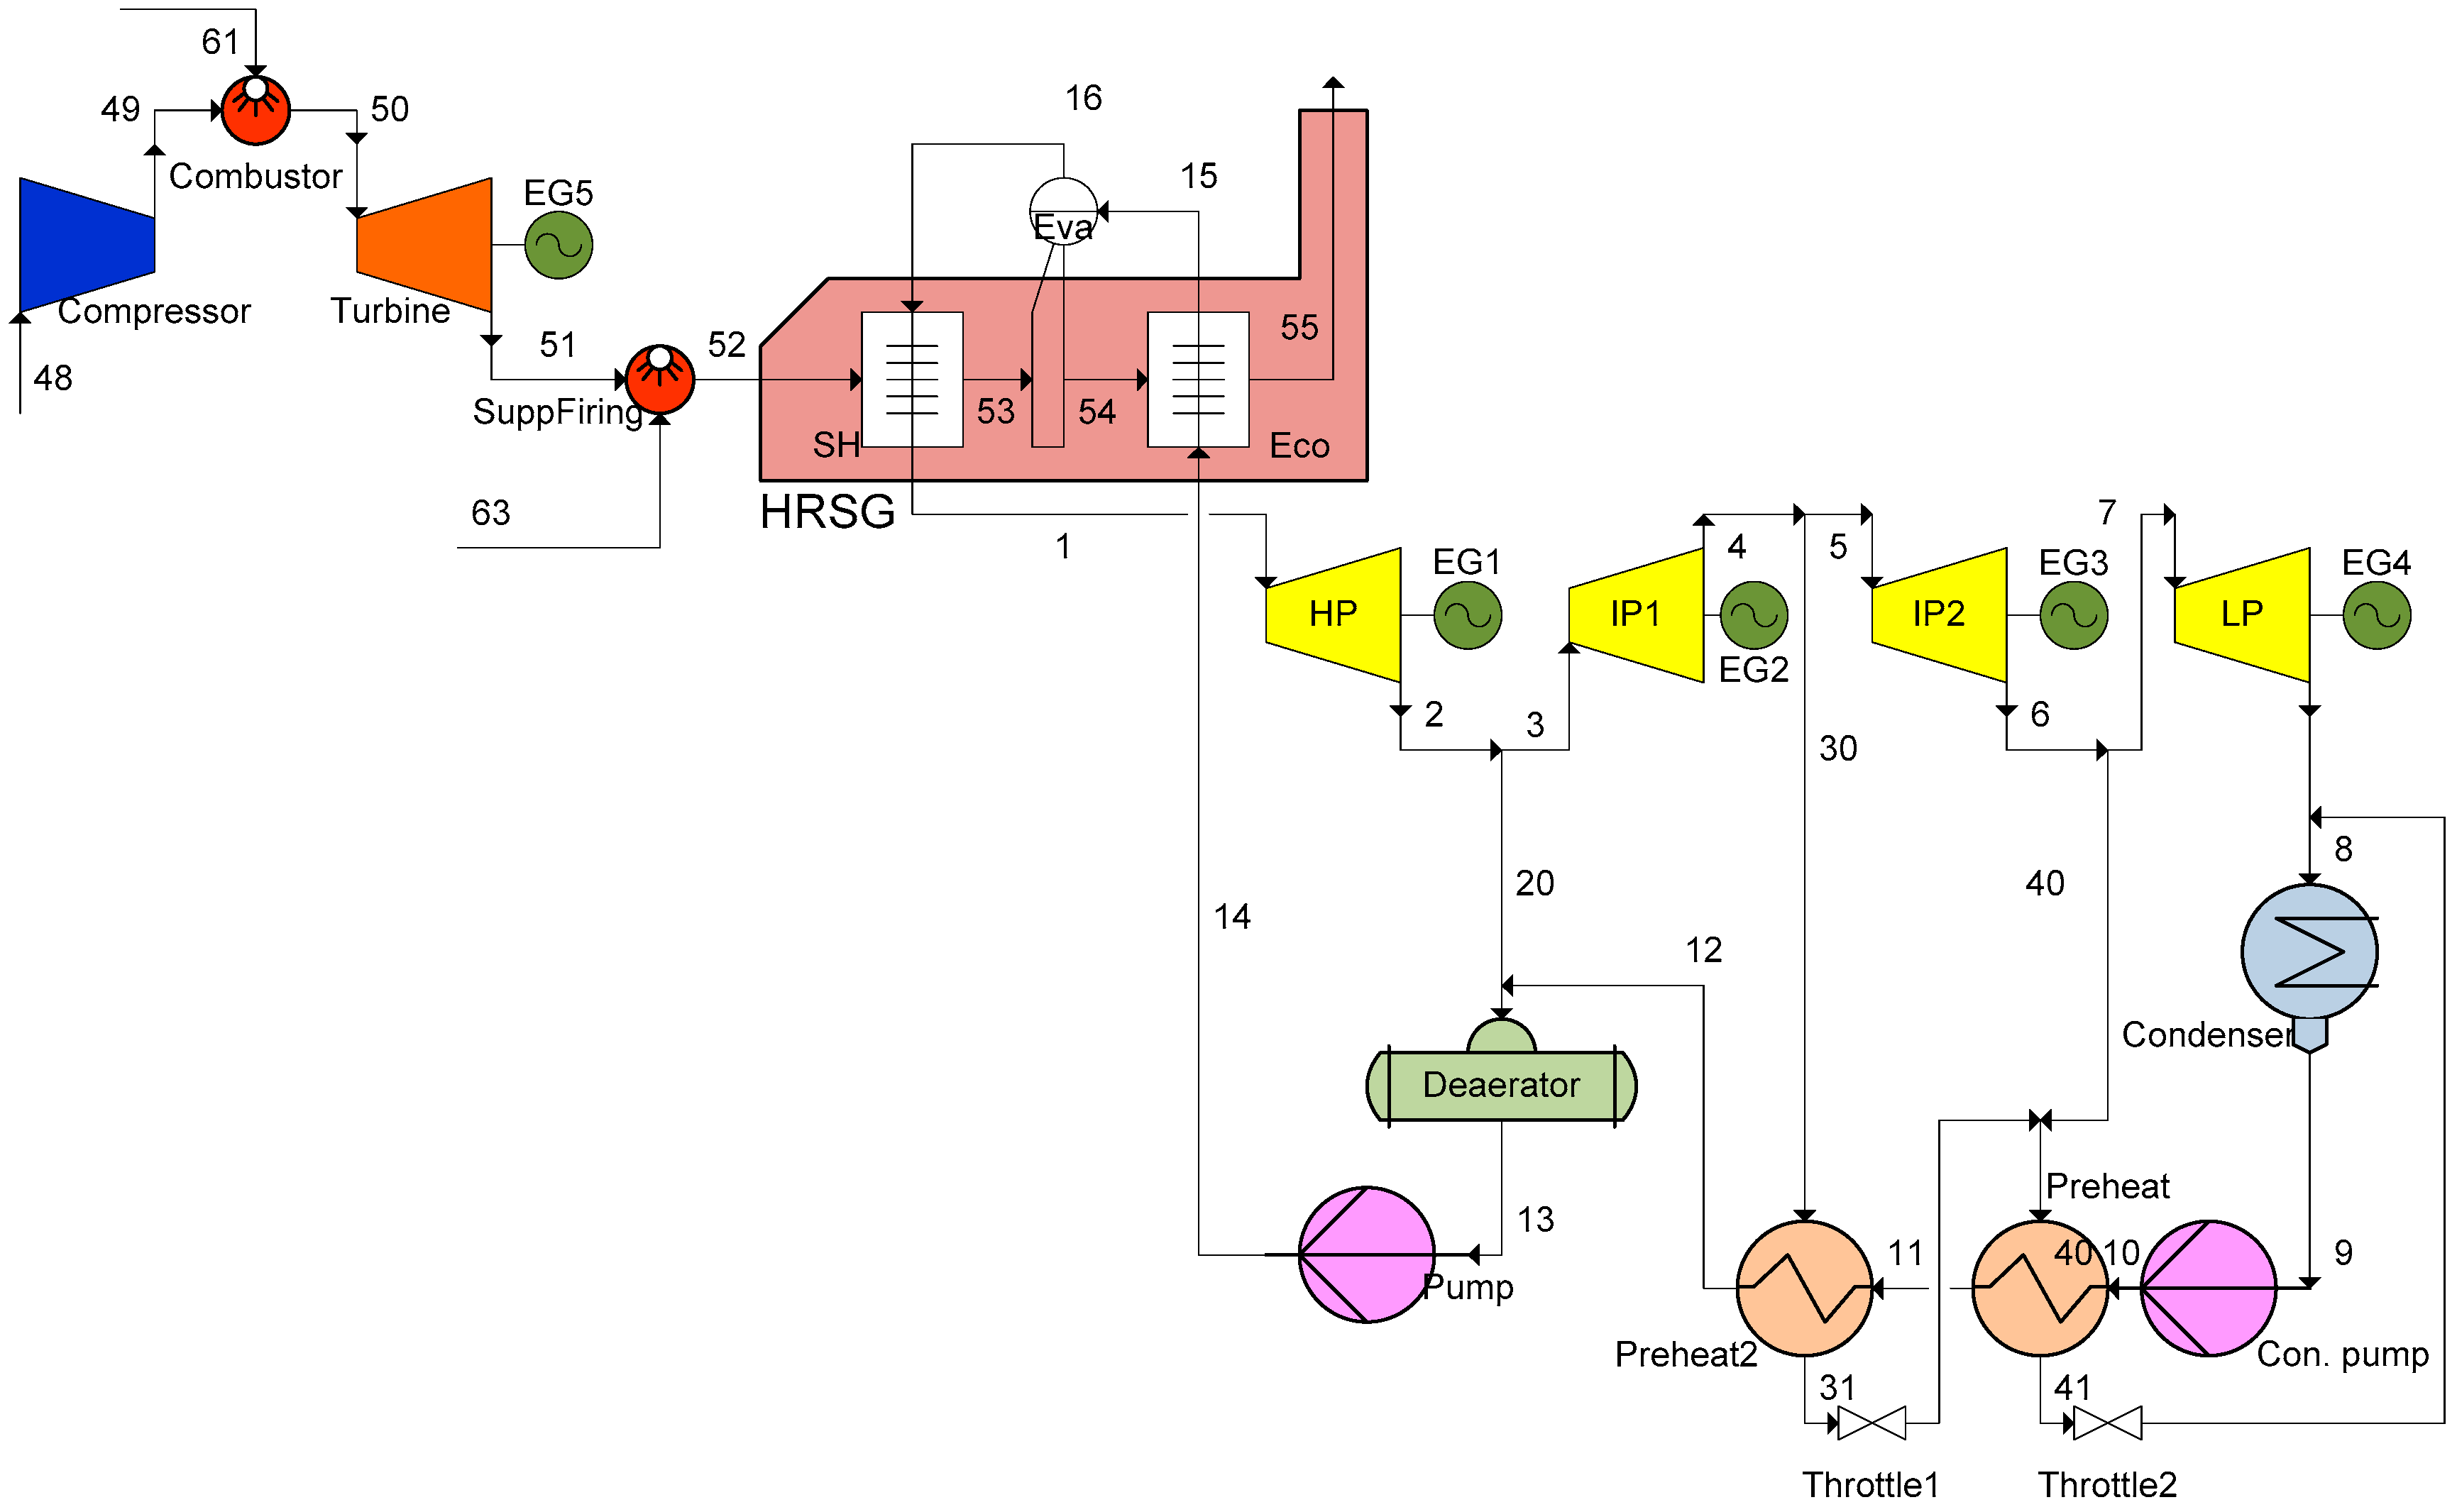
3.3. Modeling of Selected Gas Turbine

In [35] the specification of all gas turbines currently available in the market is specified. All gas turbines in the data sheet are screened and based on the required temperature as well as heat for the steam cycle, the gas turbine chosen here is the Siemens SGT5 4000F (Orlando, Florida, FL, USA). The specifications in [35] are slightly different from the ones on the Siemens website [36], which could depend on improvements. Therefore, an average data is chosen which is summarized in Table 4. A gas turbine model based on these data is then developed here to capture all important specifications such as power output, efficiency, etc.
As seen in the exhaust gas temperature if this gas turbine is well above live steam temperature of 500 °C, allowing for a large terminal temperature and consequently lower HRSG cost. In fact that the exhaust temperature of the gas turbine must be above 500 °C, eliminates the choice of many gas turbines listed in the screening process.
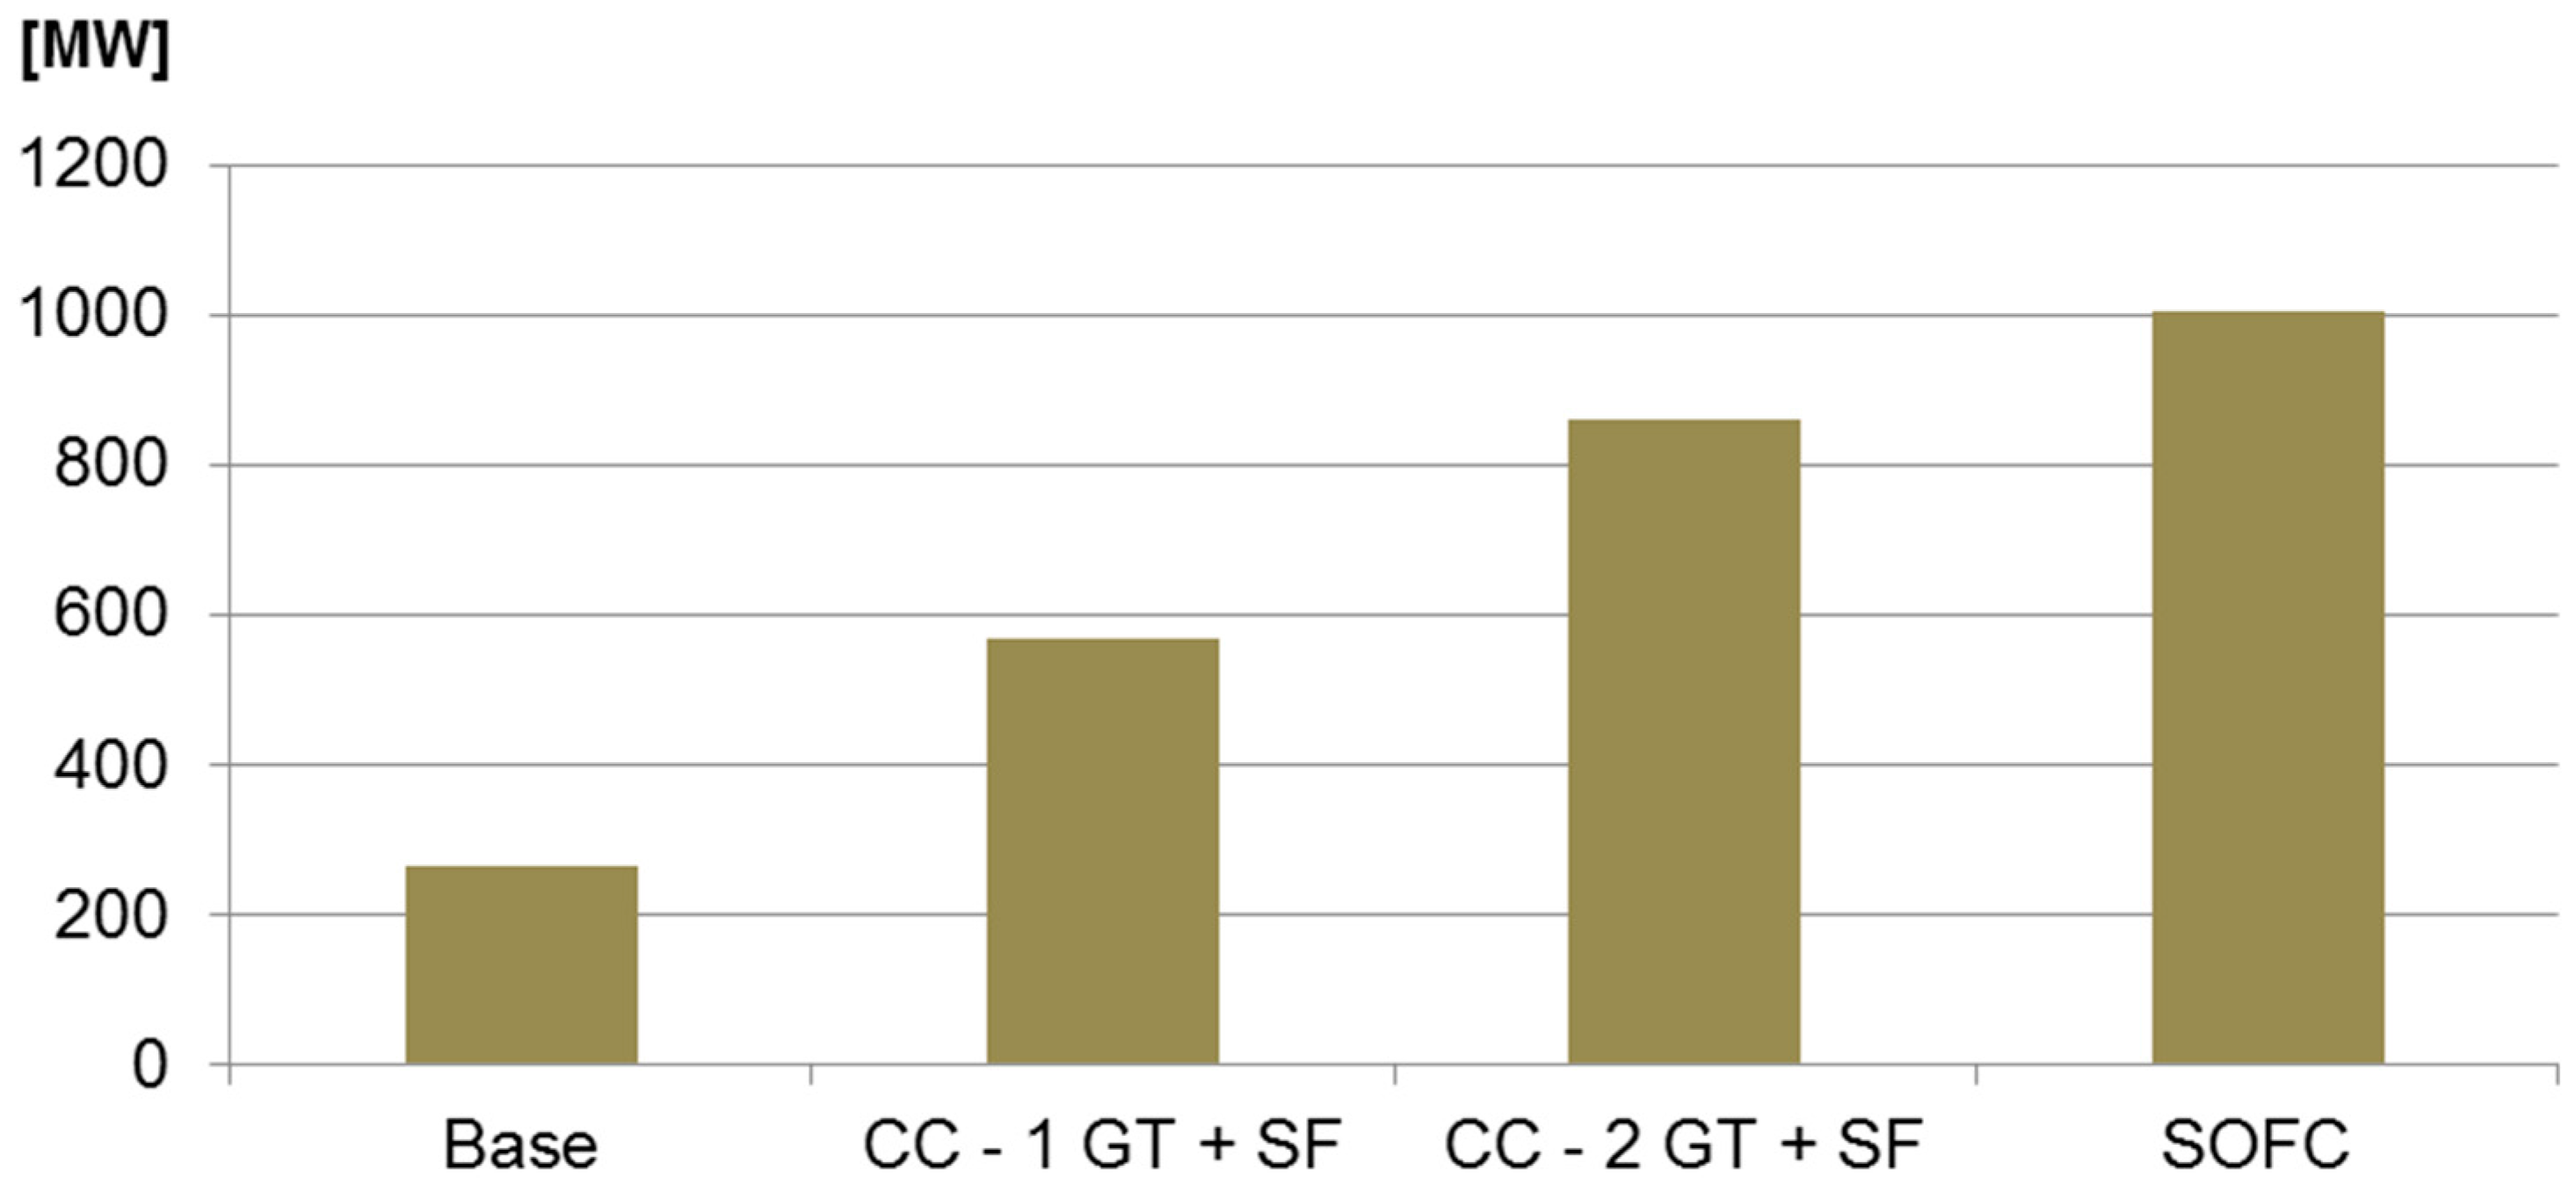
As mentioned above, the minimum power (heat) required for the steam plant is about 756 MW. From the gas turbine specifications one can calculate its exhaust power by:
Q e x h a u s t , G T = Q i n , G T P G T = P G T ( 1 η G T 1 )
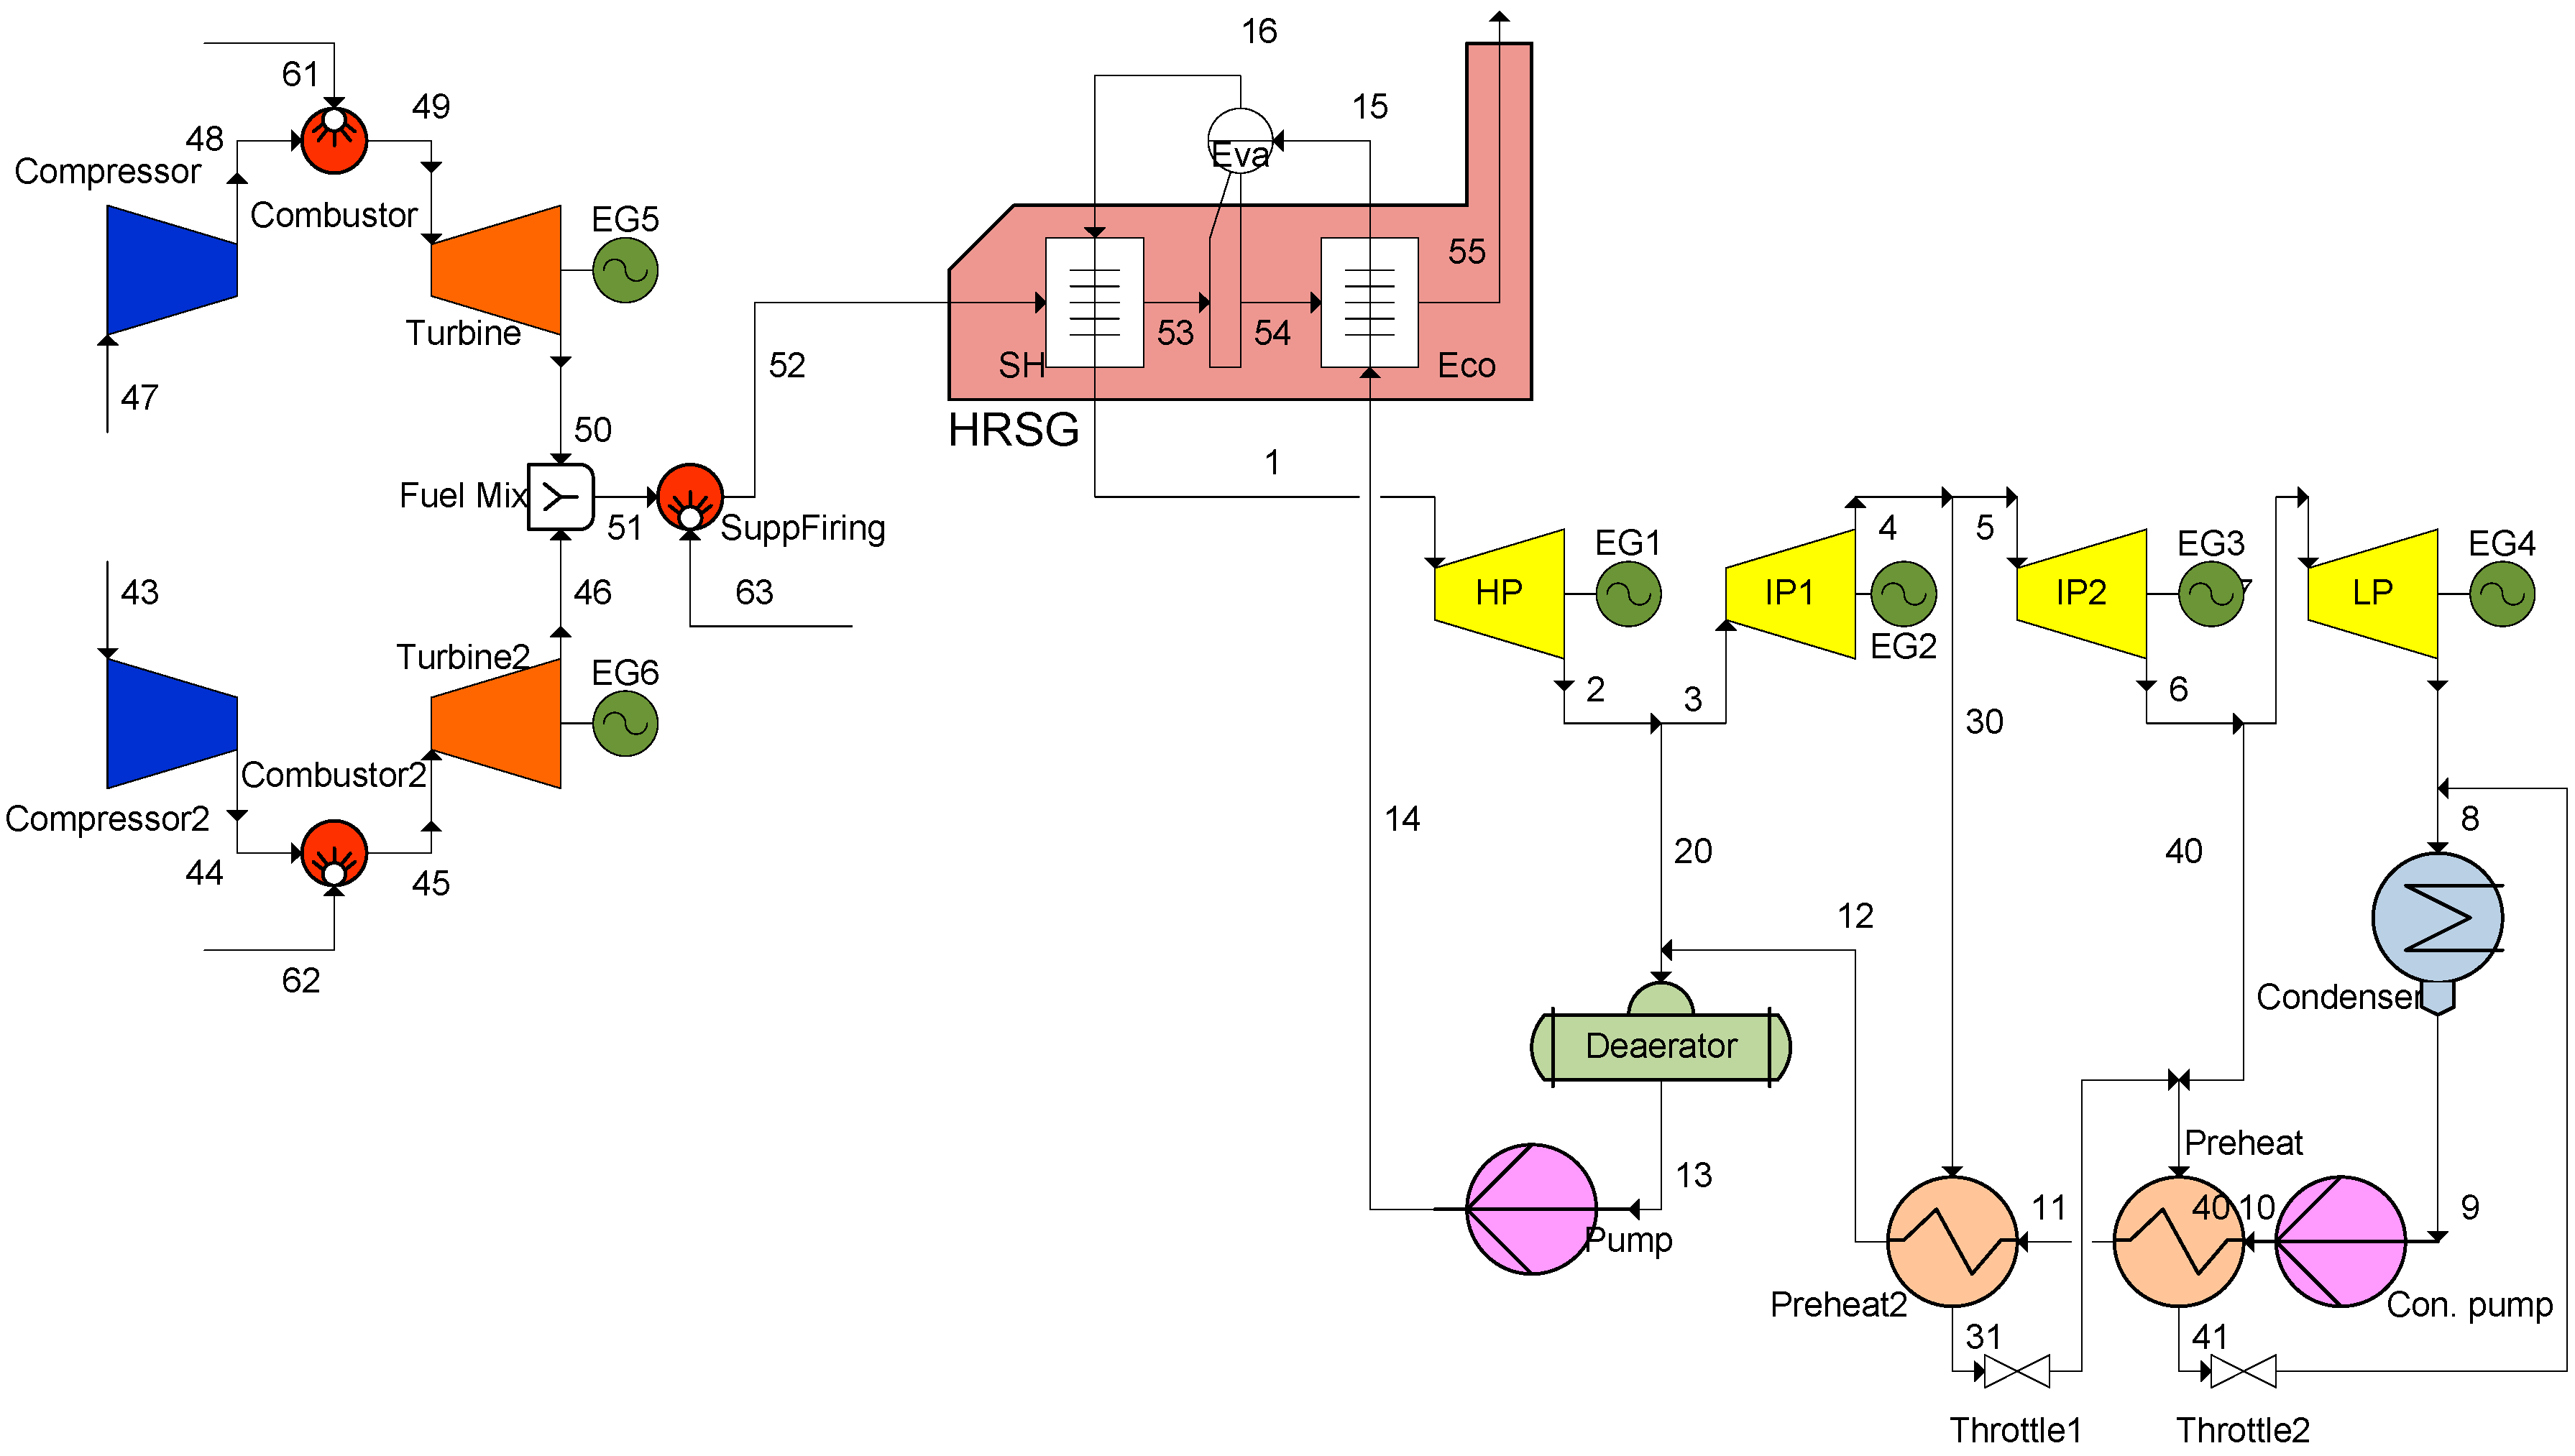
which gives about 441 MW. This in turn means that one gas turbine alone will not be enough to generate the required steam and supplementary firing will be necessary. Another option would be using two gas turbines with or without supplementary firing.
In modeling ambient temperature and pressure are assumed to be 25 °C and 1.01 bar, respectively. Generator efficiency is assumed to be 97% which is a typical value. The calculated fuel mass flow and fuel consumption (based on LHV) are 16.08 kg/s respective 736.7 MW. The LHV of the fuel (natural gas) is assumed to be 45,810 kJ/kg.
The turbine inlet temperature set in the model does not correspond to the inlet temperature of the real gas turbine. In reality, during the expansion both gases and air cooling are mixed and results in a lower average temperature. However, in modeling cooling air is neglected and therefore the inlet temperature would be higher than the reality. Thermodynamically, the most important parameters would be gas turbine exhaust temperature, exhaust mass flow, fuel consumption, power production and efficiency which all are calculated correctly.

4. Suggested Repowering Configurations

As mentioned above, the idea is to maintain the steam cycle as it was designed originally and replace the burner with a HRSG. Adding a gas turbine (or gas turbines) on the top of the steam and designing a CC is not new, but will be studied here for comparison with the new suggested plant. As seen in Figure 1, the existing steam plant is a simple plant without multi-pressure level steam generators and reheating and therefore the plant efficiency is also low (only about 33% for about 260 MW). Other newer steam plants could have much higher efficiencies (e.g., 45%) and higher power output (e.g., 500 MW), see e.g., [37]. In this study, the repowering is accomplished without changing the balance of the existing plant, meaning that when repowering the final plant efficiency will not be as high as that possible with a modern new designed combined cycle.

4.1. Repowering with Gas Turbine

The first option for the repowered plant is to use one GT with supplementary firing as shown in Figure 2. In the configuration, the HRSG is designed with one drum connected to the evaporator. The off-gases are sent out at point 55 in Figure 2. The component settings are not changed for the steam plant at all, allowing significantly less cost associated with repowering. Only the current burner is replaced with a heat recovery steam generator. Further, repowering of an existing plant without altering the existing steam cycle will have substantially lower plant efficiency compared to a new designed combined cycle, as discussed above.
As shown in Figure 2, the fuel (NG) shall be supplied to the gas turbine chamber at point 61 as well as supplementary firing at point 63. With the estimations shown above the minimum power required from the supplementary firing will be about 315 MW, which in turn requires a large size burner as supplementary firing. Another option is to have two gas turbines with supplementary firing as displayed in Figure 3.
Generally, including a supplementary firing has the pro of allowing shutting down one gas turbine to undergo servicing without shutting down the entire plant. In this configuration, fuel is only supplied to the gas turbines’ combustion chambers at points 61 and 62, if no supplementary firing is used. By including supplementary firing then fuel must be supplied to point 63 in addition to the gas turbines combustion chambers (points 61 and 62 in Figure 3). The HRSG design is similar to case with one gas turbine, allowing for fair thermodynamic comparison. It should be noted that in the case with two gas turbines the repowering cost is substantially higher than the corresponding case with one gas turbine.

4.2. New Hybrid Cycle

The new system suggested here for repowering is presented in Figure 4, which uses a natural gas fired SOFC system functioning as a topping cycle, while the steam cycle comprises the bottoming cycle. For the topping SOFC cycle, the ambient air at 25 °C is compressed to the working pressure of the SOFC (normal pressure) and then heated in the cathode air preheater (Cathode PH in Figure 4) to 600 °C before entering the cathode side of the SOFC stacks. For the anode side, the fuel was preheated in a heat exchanger (NG PH in Figure 4) before it was sent to a desulfurization unit to remove the sulfur content in the NG. This unit was assumed to be using a catalyst and operated at temperature of 200 °C. The heavier carbon contents in the desulfurized gas are cracked down in a Catalytic Partial Oxidation (CPO) type pre-reformer. Before that, the fuel must be preheated again to reach the operational temperature of the CPO catalyst, which is accomplished in the reformer preheater (Ref PH in Figure 4). The temperature of the pre-reformed gas is supposed to reach 650 °C which is high enough to be sent to the anode side of the SOFC.
The off-fuel (the anode remaining fuel out of the fuel cell) is used to preheat the fuel in its path. The operating temperature of the fuel cell is assumed to be 780 °C which is enough to preheat the incoming gas. The entering temperatures mentioned above are the minimum entering temperatures and are essential requirements for the proper functioning of SOFC stacks, not only to initiate the chemical reactions but also to avoid cell thermal fractures. The burner is implemented because all of the fuel will not be reacted in the fuel cell stacks due to SOFC fuel utilization factor.
The off-gases from the burner have a high heat quality, which can be used to generate steam in a HRSG through economizer, evaporator and super heater. As discussed in [16,38], the off-gases out of HRSG maintain a high quality heat, which can be used to preheat the air after the compressor in the SOFC cycle. In other words, heat is recycled back to the topping cycle, and therefore, this technique is called hybrid recuperation. Such hybrid recuperator (HR) is shown to be very efficient and can increase the plant efficiency significantly. It increases the energy supplied to the SOFC cycle which in turn decreases the duty of the cathode pre-heater. Therefore, the energy from the SOFC off-fuel will be higher, allowing for more heat to be available after the burner. Other parameters assumed for the SOFC plant are summarized in Table 5.

5. Results and Conclusions

Natural gas is assumed to be pressurized and have the following compositions (molar fraction based); CH4 = 0.87, C2H6 = 0.081, C3H8 = 0.01, C4H10-N = 0.006, CO2 = 0.02925, H2S = 0.00375 with LHV of 45,810 kJ/kg.
The calculations show that using two gas turbines without supplementary firing, the heat produced from the two gas turbines is not enough to satisfy the heat required by the steam cycle. The exhaust gases out of the gas turbines are mixed but the total heat provided in the exhausts is still not enough to satisfy the request from the steam cycle and small amount of supplementary firing is thus needed. Due to the high excess air in the gas turbines, the oxygen necessary for the supplementary firing is already bounded in the off gases. It is also noted that the two gas turbines are able to provide more than 90% of the heat needed by the steam cycle, and therefore the contribution from the supplementary firing will be small.
The performance comparison among repowering plants presented above is shown in Figure 5, in terms of plant net power output. Note that SF stands for supplementary firing in the figure. As can be seen, already with one gas turbine and supplementary firing (CC − 1 GT + SF in Figure 5) the net power can be increased by more than 210% compared to the base case (original steam plant). Adding two gas turbines and supplementary firing (CC − 2 GT − SF in Figure 5) increases the net power by about 325%. So far, all such repowering lies withing the CC plants category. The suggested repowering with SOFC without supplementary firing (SOFC in Figure 5) increases the net power more than 375% (almost four times larger). Thus the suggested hybrid SOFC-ST plant perfoms far better than the CC category plants.
Another interesting performance comparison could be plant thermal efficiency and CO2 emissions. These are displayed in Figure 6. As demonstrated in the figure, among CC categories, repowering with two gas turbines and supplementary firing has the best efficiency which is about 53%. This is of course lower than in a new designed CC plant which can reach about 59%. The reason is that the steam plant is not designed for the gas turbines but instead the gas turbines are fitted with an existing steam plant. The CC − 1 GT + SF (repowered plant with onegas turbine and supplementary firing) cannot achieve 50% plant efficiency. However, repowering with SOFC results in plant efficiency more than 60% and can compete with a new designed CC plant. Again, the efficiency of repowering with SOFC is well below a new designed SOFC-ST (cf. [16]).
Here, the specific CO2 emission is defined as:
e CO 2 = m ˙ CO 2 P e l ( kg CO 2 / kWh el )
which is the mass flow of CO2 per net power output (electricity). Note that the composition and mass flow of the off-fuel and off-air entering the catalytic burner are known. Thus the composition and mass flow of the off-gases (after the catalytic burner) are also known through chemical reactions and mass balance. Therefore the amount of CO2 emission can easily be calculated.
As seen in Figure 6, the specific emission of CO2 for the base case (coal fired steam plant) is about 1.01 kg/kWh. The results clearly demonstrate that the higher the efficiency is the lower CO2 emission will be. For the CC category, the combined cycle with two gas turbines and supplementary firing (CC − 2 GT + SF) has the lowest CO2 emissions of about 0.39 kg/kWh which is only about 40% of the original plant. This of course is much lower than the base case, however, all the decrease is not only due to plant efficiency but also because the fuel is changed from coal to natural gas. Therefore, another case is included in the figure which is the same steam plant but fired with natural gas instead of coal (NG SC in the figure). A natural gas fired steam plant has emissions that are about 60% of those of the coal fired plant. The suggested repowering with SOFC plant performs best with an emission of about 35% compared to the original plant, but also about 60% of the original plant fired when natural gas instead.
Other plant calculated data such as fuel consumption, total fuel rate, auxiliary power and supplementary fuel mass flow are shown in Table 6. As can be seen the auxiliary power consumption for the repowered plants (CC category plants) are much higher than the others, which is due to the compressor of the gas turbines. The auxiliary power consumption for the presented SOFC plant is relatively very low compared to the other repowered plants, which is due to the non-pressurized SOFC stacks. Supplementary fuel consumption for the repowered plant with two GT and supplementary firing is only 3.34 kg/s which is very low compared to the main fuel rate, explaining that the two gas turbines are able to generate about 90% of the heat required from steam plant.
In order to study the composition of the off-gases Figure 7 shows the comparison between the base case (coal fired) and suggested repowering with SOFC. The CO2 emission is significantly lowered (by about 2.9 times) but also oxygen flow rate is considerably increased (by about 5.8 times). Note that small amount of sulfur (SO2) exists in the chimney of the coal fired base plant while no sulfur exits in the repowered SOFC plant because the fuel was desulfurized.

5.1. T–Q Diagram

To study the reason why the presented repowering with SOFC (SOFC-ST hybrid) is superior when compared to the other repowered plants in terms of plant efficiency, one need to analyze the temperature–heat diagram for HRSG among others. Such diagram for repowering with SOFC is shown in Figure 8, in which the temperature and heat of each component in the HRSG is shown with the corresponding node number appearing in Figure 4.
For all heat exchangers, the pinch temperature (difference between nodes 54 and 15) is set to 10 °C. The terminal temperature difference (difference between node numbers 52 and 1) is about 93 °C and the gases leave the HRSG at temperature about 113 °C. Significant energy has been recovered by hybrid recuperation, from 218 °C to 113 °C, which corresponds to 20% of total energy recovered in the HRSG. Without hybrid recuperator, the majority of this energy would be lost to the ambient. Moreover, both the super heater (SH) and economizer (ECO) each uptake 20% of the total energy recovered by HRSG. About 40% of the total energy in the HRSG is allocated in the evaporator (EVA).
Similarly, the temperature–heat diagram is also shown for the combined cycle with two gas turbines and with supplementary firing, Figure 9. The reason that CC − 2 GT + SF is chosen is that this combined cycle performs best among all combined cycles studied here. The gases leave the HRSG at a temperature of about 189 °C which is significantly higher than the case with SOFC repowering. Thus lower energy has been recovered in HRSG for the CC case compared with SOFC case.
The terminal temperature difference is about 170 °C which is also higher in this case when compared with the previous case (ca. 93 °C). Here both the super heater and economizer each uptake about 25% of the energy in the HRSG, which is slightly higher than the SOFC case. The evaporator absorbs about 50% of the energy from HRSG, which is also higher when compared with SOFC repowering. All these together make the area between the off-gases temperature line (red line) and the water-steam temperature line (blue line) to be larger than the case with SOFC repowering. This in turn means that less exergy has been wasted in HRSG when SOFC repowering is used. In other word, for the case with SOFC repowering, the off-gases temperature line approaches the corresponding line for water-steam and therefore resulting in less exergy loss and higher effectiveness for HRSG. The effectiveness (also called as recovery efficiency) of HRSG can be defined as (see e.g., [38]):
ε H R S G = T g a s , i n T g a s , o u t T g a s , i n T a m b i e n t
then the HRSG effectiveness (recovery efficiency) can be calculated as 78.4% and 84.5% for the CC − GT + SF combined cycle respective SOFC-ST hybrid system.

5.2. Effect of SOFC Current Density and Utilization

Increasing SOFC current density decreases plant efficiency, while increasing SOFC operating temperature is in favor for plant efficiency, as shown in Figure 10. Generally, increasing SOFC current density decreases the power generated by SOFCs and thereby decreases plant efficiency as well. This is of course also true for SOFC powering, see Figure 10a. Decreasing the current density below 100 mA/cm2 will not be realistic since the cell voltage reaches to a very high value (0.9374 V) which is close to open circuit voltage. At this current density, plant efficiency reaches to 67.4% and 64.09% for UF = 0.8 respective UF = 0.7, which are significantly higher than the corresponding efficiency at 300 mA/cm2. The figure also demonstrates that the higher the current density is the lower the difference between two utilization factors will be.
Similarly, increasing the fuel cell utilization factor increases plant efficiency when current density is assumed to be unchanged, see Figure 10b. For example, increasing the utilization factor from 0.6 to 0.9, increases plant efficiency from 53.0% to 59.5%, respectively, when the current density is assumed to be 400 mA/cm2. Increasing the utilization factor beyond 90% is not beneficial for the cell, since the ionic concentration increases significantly inside the porous electrolyte and thereby blocks their pathway and consequently decreases cell voltage. However, for current density of 300 mA/cm2, plant efficiency will be 63.0% when utilization factor is anticipated to be 0.9, as displayed in Figure 10b.
In fact, there exists an optimum operating temperature at which the plant efficiency is maximum. This is in contrast with the study of [38]. Note that in the study of [38] the steam plant was designed and adapted to the SOFC topping cycle while here the topping SOFC cycle is adapted and designed to provide required heat for an existing steam plant. These are completely different situations which affect the plant efficiency dramatically in terms of plant efficiency and net power output. For a current density of 300 mA/cm2, this maximum efficiency is calculated to be about 62% at a temperature of 740 °C, as revealed in Figure 11a. Decreasing current density to 200 mA/cm2, then the maximum plant efficiency happens at an operating temperature of 730 °C, and the maximum point is also shifted towards lower temperature, see Figure 11b. Here the plant efficiency will be as high as 66.2% for UF = 0.8 while corresponding value for UF = 0.7 is 63.4%, although slightly lower when utilization factor is lowered. Both these temperatures are lower than the current temperature technology of 780 °C, which in turn means companies’ endeavor to decrease the SOFC operating temperature, is in agreement for such repowering system.

5.3. Effect of SOFC Operating Temperature

On the other hand, increased SOFC operating temperature is not always in favor for plant efficiency as established in Figure 11. In fact, there exists an optimum operating temperature at which the plant efficiency is maximum. This is in contrast with the study of [38]. Note that in the study of [38] the steam plant was designed and adapted to the SOFC topping cycle while here the topping SOFC cycle is adapted and designed to provide required heat for the existing steam plant. These are completely different situations which affect the plant efficiency dramatically in terms of plant efficiency and net power output. For current density of 300 mA/cm2, this maximum efficiency is calculated to be about 62% at a temperature of 740 °C, as revealed in Figure 11a. Decreasing current density to 200 mA/cm2, then maximum plant efficiency happened at operating temperature of 730 °C, also the maximum point is shifted towards lower temperature, see Figure 11b. Here the plant efficiency will be as high as 66.2% for UF = 0.8 while corresponding value for UF = 0.7 is 63.4%, although slightly lower when utilization factor is lowered. Both these temperatures are lower than the current temperature technology of 780 °C, which in turn means companies’ endeavors to decrease the SOFC operating temperature, are in agreement for such repowering systems.

5.4. Effect of Hybrid Recuperator on Plant Performances

As discussed in [38], introducing a hybrid recuperator into the plant (inserting a heat exchanger between the off-gases after the stack and air prior to the cathode preheater and utilizing off-gases energy) increases the energy supplied to the SOFC cycle which in turn decreases the duty of the cathode pre-heater and consequently the energy of the off-fuel out of SOFC will be higher and thus more heat will be available after the burner and bottoming cycle. Thus, plant efficiency increases significantly. The effect of hybrid recuperator is shown in Table 7.
Note that the SOFC utilization factor is decreased to 0.76 because the burner outlet temperature otherwise would not be high enough to generate steam at 500 °C in the super heater, see Figure 12. The terminal temperature difference (difference between HRSG inlet gas temperature and generated steam temperature) is allowed to be 30 °C, which is within the recommended value so that the size of HRSG is not too large (see e.g., [1]). As revealed, fuel consumption decreases by about 23% and similarly the auxiliary power is decreased by about 14%. The net power will decrease by about 307 MW which is mainly due to the lower electricity from SOFC cells (ca. 324 MW). Despite less net power, plant efficiency is increased by about 5 point percent.
Table 7 also shows that by bypassing the hybrid recuperator it would be possible to generate additional power of 384 MW which is about 40% larger than the case with hybrid recuperator (in expense of lower plant efficiency). Thus plant flexibility is increased dramatically and plant net power production can be altered without undergoing part-load conditions, e.g., under pick hours.
Figure 12 shows that by decreasing SOFC utilization factor burner temperature will be increased which is obvious because less fuel is consumed in the SOFCs and therefore more fuel will be burned in the combustor. Figure 12 also demonstrates that by removing hybrid recuperator the burner temperature drops significantly, for example for UF values above about 0.78 the burner temperature will not be sufficient to generate steam at 500 °C. Taking into account the terminal temperature of 30 °C then UF value shall be below 0.76 (see intersection between the blue line and limit line).

5.5. Effect of Fuel Mass Flow

Another parameter to be studied is the fuel mass flow (natural gas). As noted above the reformer inlet and outlet temperatures are fixed indicating that the fuel mass flow will be calculated to achieve such specified temperatures. Allowing fuel flow rate to be changed means that either the reformer inlet temperature or its outlet temperature should be variable. Such study is performed and the results are displayed in Figure 13. Increasing fuel mass flow increases cell voltage of the SOFC and therefore more power will be produced by the SOFC stacks. As result plant efficiency will also be increased, see Figure 13. As fuel mass flow is changed then CPO reformer air flow will also be varied to keep either its inlet or its outlet temperature at the specified value.
For the case with constant reformer outlet temperature, as more fuel is entering the CPO reformer then the reformer inlet temperature will be increased significantly, see Figure 13a. Reformer outlet temperature corresponds to SOFC anode inlet temperature which is specified at a value of 650 °C meaning that a temperature difference of 130 °C is applied. This is the maximum temperature difference over the anode, assumed in this study.
Too high temperature difference over the anode causes cell thermal stresses and thereby cell fatigue. Note that CPO inlet temperature and its air mass flow shall be read from the left side axis while plat efficiency and SOFC cell voltage shall be read from the right side axis. Reformer inlet temperature varies from 320 °C to about 640 °C as fuel mass flow is increased from 36 kg/s to 46 kg/s. Plant efficiency may reach over 70% at high fuel mass flows without compromising reformer inlet temperature. On the other hand if CPO reformer inlet temperature is kept constant (e.g., specified at 330 °C) then its outlet temperature will be decreased if the fuel mass flow is increased, see Figure 13b. Reformer outlet temperature varies from approximately 780 °C to 605 °C when fuel mass flow is changed from 30 kg/s to 40 kg/s. For fuel flows above 36 kg/s, reformer outlet temperature (same as anode inlet temperature) will be below the assumed value of 650 °C.

6. Simple Cost Analysis

A simple cost analysis is performed to estimate the additional cost required for the proposed repowering plants. The costs of each component such as compressor, gas turbine, generator, heat exchangers, pre-reformer, desulfurizer and inventor are taken from the previous studies [39,40,41]. The idea to calculate the additional cost associated with repowering of each plant with each other and therefore the common components are not included in the cost analyses. These common components are assumed to be the existing Rankine cycle (remains the same without any changes), HRSG (must be replaced anyway), and burner and supplementary firing which are usually integrated with the HRSG.
In this study techno-economy is used to investigate the price of different plants in terms of kW/$. First, the purchased cost of different components is estimated from the previous studies and thus the so called Purchased Equipment Cost (PEC) is obtained. Then, the additional costing such as direct and indirect cost is added to each equipment cost. Direct cost includes onsite and offsite costs. In onsite cost, installation, piping, instrumentation and electrical equipment costs are included, while in the offsite cost architectural work and service facilities are accounted for. Indirect costs include engineering, construction and contractors’ profit plus contingency. Finally, the cost of a plant is divided by the plant size to obtain plant cost in terms of kW/$. Detailed techno-economic cost analysis for this study can be found in [42]. Note that the cost of SOFC stacks is assumed to be valid for future serial production. The cost of each uninstalled SOFC stack is calculated to be about 188 $/kW for serial production in the future scenario which corresponds to installed valued of 778 $/kW (including installation costs). This agrees very well with the study of [43] which reported the installed cost of SOFC stack is about 770–850 $/kW.
The final cost of each plant is presented in Table 8. Again in these costs, existing steam plant (unchanged), HRSG (must be replaced and common in each plant) and supplementary firing (usually integrated with HRSG) is not included. In the table total cost corresponds to the installed cost (PEC plus installation costs). The interesting result is that the cost of repowering with SOFC is less than repowering with two gas turbines. Note that again the installed cost of each SOFC stack is assumed for a future serial production scenario (about 770 $/kW) while at the moment this cost is about four to five time larger, which means that the repowering plant with SOFCs would be about 470–600 $/kW which is much larger than that reported with one GT or two GTs.

7. Conclusions

Repowering of an existing coal fired power plant is studied and different repowering designs are analyzed. In addition, a new repowering with SOFCs plant is also suggested. CO2 emissions from different plant designs are calculated and compared with each other. The following conclusions can be drawn:
-
Repowering with SOFCs produces the highest power.
-
Repowering with SOFCs has the highest plant efficiency which is about 60% and competes with a new CC plant in terms of efficiency.
-
CO2 emissions from the SOFC-repowered plant are far less than those of the original coal fired plant, but also much lower than if the original plant was powered with natural gas instead of coal.
-
Among repowered plants, the repowering with two Siemens SGT5 4000F gas turbines with small supplementary firing has the best performance, with an efficiency of 53%, which is considerably lower than that of a newly designed CC plant.
-
There exists an optimum SOFC operating temperature at which plant efficiency is maximized. This temperature is calculated to be 740 °C for 300 mA/cm2.
-
It is possible to reach plant efficiencies above 65% if the current density is low enough.

Conflicts of Interest

The author declares no conflict of interest.

Nomenclature

cpSpecific heat, J/kg·°C
CTTurbine constant
EVoltage, V
FFaradays constant, C/mol
eEmissions, kg/kWh
g0Standard Gibbs free energy, J/mol
gfGibbs free energy, J/mol
m ˙ Mass flow, kg/s
n ˙ Molar reaction rate, mol/s
neNumber of electron
PPower, W
pPressure, bar
TOperating temperature, K
QHeat, J
RUniversal gas constant, J/mol·K
UFFuel utilization factor
yMolar faction

Greek Letters

ΔDifference
ηEfficiency

Subscripts

aAnode
actActivation
cCathode
concConcentration
eElectrolyte
iInterconnect
ohmOhmic
revReversible
vVoltage

Abbreviations

APAnode pre-heater
CCCombined cycle
CPOCatalytic partial oxidation
CPCathode air pre-heater
EGElectric generator
ECOEconomizer
EVAEvaporator
FCFuel cell
GTGas turbine
HHVHigher heating value
HPHigh pressure
HRHybrid recuperator
HRSGHeat recovery steam generator
IPIntermediate pressure
LHVLower heating value
LPLow pressure
NGNatural gas
PHPreheater
SHSuper heater
SFSupplementary Firing
SOFCSolid oxide fuel cell

References

  1. Kehlhofer, R.; Hannemann, F.; Stirnimann, F.; Rukes, B. Combined-Cycle Gas and Steam Turbine Power Plants, 3rd ed.; PennWell: Tulsa, OK, USA, 2009. [Google Scholar]
  2. Danish Energy Agency. Energy in Denmark, 2014. Available online: http://www.ens.dk/en/info/facts-figures/energy-statistics-indicators-energy-efficiency/annual-energy-statistics (accessed on 27 January 2016).
  3. Walters, A.B. Power plant topping cycle repowering. Energy Eng. 1995, 92, 49–71. [Google Scholar]
  4. Kovacik, J.M.; Stoll, H.G. Economics of repowering steam turbines. Natl. Eng. 1990, 95, 27–37. [Google Scholar]
  5. Carapellucci, R.; Milazzo, A. Repowering combined cycle power plants by a modified STIG configuration. Energy Convers. Manag. 2006, 48, 1590–1600. [Google Scholar] [CrossRef]
  6. Chellini, R. Repowering a steam power plant with a gas turbine. Diesel Gas Turbine Worldw. 1986, 18, 28–30. [Google Scholar]
  7. Donatelli, R.U.; Ondryas, I.S.; Fransson, T.H. Combustion Turbine Repowering at the Lauderdale Plant; ASME, International Gas Turbine Institute (Publication): New York, NY, USA, 1990; pp. IGTI 5:201–IGTI 5:206. [Google Scholar]
  8. Waller, H.; Scherer, V.; Scherer, D. The GT26 gas turbine in a combined gas-steam turbine power plant: Repowering the Rheinhafen Steam Turbine Power Plant of the Badenwerk AG. VGB PowerTech 1996, 76, 571–576. [Google Scholar]
  9. Brander, J.A.; Chase, D.L. Repowering application considerations. Eng. Gas Turbines Power 1992, 114, 643–652. [Google Scholar] [CrossRef]
  10. Liszka, M.; Szargut, J. Simulation analysis of a repowered double fuel CHP plant including a non-evaporative heat recovery boiler. Int. J. Energy Res. 2004, 28, 661–682. [Google Scholar] [CrossRef]
  11. Modesto, M.; Nebra, S.A. Analysis of a repowering proposal to the power generation system of a steel mill plant through the exergetic cost method. Energy 2006, 31, 3261–3277. [Google Scholar] [CrossRef]
  12. Calise, F.; d’Accadia, D. M.; Palombo, A.; Vanoli, L. Simulation and exergy analysis of a hybrid solid oxide fuel cell (SOFC)—Gas turbine system. Energy 2006, 31, 3278–3299. [Google Scholar] [CrossRef]
  13. EG & G and G Technical Services Inc. Fuel Cell Handbook, 7th ed.U.S. Department of Energy, Office of Fossil Energy, National Energy Technology Laboratory: Washington, DC, USA, 2004.
  14. Riensche, E.; Achenbach, E.; Froning, D.; Haines, M.R.; Heidug, W.K.; Lokurlu, A.; Adrian, S. Clean combined-cycle SOFC power plant-cell modeling and process analysis. Power Sources 2000, 86, 404–410. [Google Scholar] [CrossRef]
  15. Haseli, Y.; Dincer, I.; Natere, G.F. Thermodynamic modeling of a gas turbine cycle combined with a solid oxide fuel cell. Hydrog. Energy 2008, 33, 5811–5822. [Google Scholar] [CrossRef]
  16. Rokni, M. Thermodynamic analysis of an integrated solid oxide fuel cell cycle with a Rankine cycle. Energy Convers. Manag. 2010, 51, 2724–2732. [Google Scholar] [CrossRef]
  17. Rokni, M. Plant characteristics of an integrated solid oxide fuel cell and a steam cycle. Energy 2010, 35, 4691–4699. [Google Scholar] [CrossRef]
  18. Traupel, W. Thermische Turbomaschinen, 3rd ed.; Spinger: Berlin, Germany, 1982. [Google Scholar]
  19. Bang-Møller, C.; Rokni, M. Thermodynamic performance study on biomass gasification, solid oxide fuel cell and micro gas turbine hybrid systems. Energy Convers. Manag. 2010, 51, 2330–2339. [Google Scholar] [CrossRef]
  20. Holtappels, P.; DeHaart, L.G.J.; Stimming, U.; Vinke, I.C.; Mogensen, M. Reaction of CO/CO2 gas mixtures on Ni-YSZ cermet electrode. Appl. Electrochem. 1999, 29, 561–568. [Google Scholar] [CrossRef]
  21. Matsuzaki, Y.; Yasuda, I. Electrochemical oxidation of H2 and CO in a H2-H2O-CO-CO2 system at the interface of a Ni-YSZ cermet electrode and YSZ electrolyte. Electrochem. Soc. 2000, 147, 1630–1635. [Google Scholar] [CrossRef]
  22. Chan, S.; Khor, K.; Xia, Z. A complete polarization model of a solid oxide fuel cell and its sensitivity to the change of cell component thickness. Power Sources 2001, 93, 130–140. [Google Scholar] [CrossRef]
  23. Keegan, K.M.; Khaleel, M.; Chick, L.A.; Recknagle, K.; Simner, S.P.; Diebler, J. Analysis of a Planar Solid Oxide Fuel Cell Based Automotive Auxiliary Power Unit; SAE Technical Paper Series 2002, No. 2002-01-0413; SAE International: Warrendale, PA, USA, 2002. [Google Scholar]
  24. Costamagna, P.; Selimovic, A.; Del Borghi, M.; Agnew, G. Electrochemical model of the integrated planar solid oxide fuel cell (IP-SOFC). Chem. Eng. 2004, 102, 61–69. [Google Scholar] [CrossRef]
  25. Achenbach, E. Three-dimensional and time-dependent simulation of a planar solid oxide fuel cell stack. Power Sources 1994, 49, 333–348. [Google Scholar] [CrossRef]
  26. Zhu, H.; Kee, R.J. A general mathematical model for analyzing the performance of fuel-cell membrane-electrode assemblies. Power Sources 2003, 117, 61–74. [Google Scholar] [CrossRef]
  27. Kim, J.W.; Virkar, A.V. The effect of anode thickness on the performance of anode-supported solid oxide fuel cell. In Proceedings of the Sixth International Symposium on SOFCs, (SOFC-VI), PV99-19, Hawaii, HI, USA, 17–22 October 1999; Electrochemical Society: Pennington, NJ, USA, 1999; pp. 830–839. [Google Scholar]
  28. Prentice, G. Electrochemical Engineering Principles; Prentice Hall International: Houston, TX, USA, 1991. [Google Scholar]
  29. Christiansen, N.; Hansen, J.B.; Holm-Larsen, H.; Linderoth, S.; Larsen, P.H.; Hendriksen, P.V.; Hagen, A. Solid oxide fuel cell development at Topsoe fuel cell and Risø. Electrochem. Soc. 2007, 7, 31–38. [Google Scholar] [CrossRef]
  30. Smith, J.M.; Van Ness, H.C.; Abbott, M.M. Introduction to Chemical Engineering Thermodynamics, 7th ed.; McGraw-Hill: Boston, MA, USA, 2005. [Google Scholar]
  31. Winnick, J. Chemical Engineering Thermodynamics; John Wiley & Sons: New York, NY, USA, 1997. [Google Scholar]
  32. Rokni, M. Thermodynamic analysis of SOFC (solid oxide fuel cell)—Stirling hybrid plants using alternative fuels. Energy 2013, 61, 87–97. [Google Scholar] [CrossRef]
  33. Incropera, F.P.; DeWitt, D.P.; Bergman, T.L.; Lavine, A.S. Introduction to Heat Transfer, 5th ed.; Wiley: Danvers, MA, USA, 2006. [Google Scholar]
  34. Cengel, Y.A.; Boles, M. Thermodynamics: An Engineering Approach, 4th ed.; McGraw-Hill: New York, NY, USA, 2002. [Google Scholar]
  35. Gas Turbine World: 2007 Performance Specs, 24th ed.; Victor de Biasi: London, UK, 2007.
  36. Siemens. Siemens Energy. Available online: http://www.energy.siemens.com (accessed on 17 May 2016).
  37. Kishimoto, M.; Yoshihiro, M.; Takayanagi, K.; Umaya, M. Operating Experience of Large Ultra Super Critical Steam Turbine with Latest Technology; PWR-1994; American Society of Mechanical Engineers: New York, NY, USA; Volume 26, pp. 43–47.
  38. Rokni, M. Thermodynamic investigation of an integrated gasification plant with solid oxide fuel cell and steam cycles. Green 2012, 2, 71–86. [Google Scholar] [CrossRef]
  39. Bejan, A.; Tsatsaronis, G.; Moran, M. Thermal Design and Optimization; John wiley and Sons Inc.: New York, NY, USA, 1996. [Google Scholar]
  40. Braun, R.J. Techno-economic optimal design of solid oxide fuel cell systems for micro-combined heat and power applications in the U.S. J. ASME Fuel Cell Technol. 2010, 7. [Google Scholar] [CrossRef]
  41. Vialetto, G.; Rokni, M. Innovative household systems based on solid oxide fuel cells for a northern European climate. Renew. Energy 2015, 78, 146–156. [Google Scholar] [CrossRef] [Green Version]
  42. Rokni, M. Techno-economy of different solid oxide fuel cell based hybrid cycles. In Proceedings of the ASME 2014 International Mechanical Engineering Congress and Exposition, Montreal, QC, Canada, 14–20 November 2014. IMECE14:36858.
  43. Staffell, I.; Green, R. The cost of domestic fuel cell micro-CHP systems. Hydrog. Energy 2013, 38, 1088–1102. [Google Scholar] [CrossRef] [Green Version]
Figure 1. Kyndby original coal steam plant.
Energies 09 00399 g001
Figure 2. Natural gas fired CC plant with one GT and supplementary firing.
Energies 09 00399 g002
Figure 3. Natural gas fired CC plant with two gas turbines and with or without supplementary firing.
Energies 09 00399 g003
Figure 4. Natural gas fired SOFC—steam hybrid plant.
Energies 09 00399 g004
Figure 5. Comparison performance of the repowering plants in terms of power. SF = supplementary firing, CC = repowered combined cycles, GT = gas turbine, SOFC = solid oxide fuel cell.
Energies 09 00399 g005
Figure 6. Comparison performance of the repowering plants in terms of plant thermal efficiency and CO2 emission.
Energies 09 00399 g006
Figure 7. Specific off-gases emissions for (a) base case; and for (b) repowering with SOFC.
Energies 09 00399 g007
Figure 8. The heat-temperature diagram for HRSG of the SOFC-ST hybrid system. SH = Super Heater, EVA = Evaporator, ECO = Economizer.
Energies 09 00399 g008
Figure 9. The heat-temperature diagram for HRSG of the CC − 2G + SF combined cycle.
Energies 09 00399 g009
Figure 10. Effect of SOFC (a) current density and (b) utilization factor on plant efficiency of repowering with SOFC.
Energies 09 00399 g010
Figure 11. Effect of SOFC operating temperature on plant efficiency of repowering with SOFC, (a) For current density of 300 mA/cm2; (b) For current density of 200 mA/cm2.
Energies 09 00399 g011
Figure 12. Burner outlet temperature as function of SOFC utilization factor.
Energies 09 00399 g012
Figure 13. Effect of fuel mass flow on plant performance, (a) reformer outlet temperature is fixed and (b) reformer inlet temperature is fixed.
Energies 09 00399 g013
Table 1. Turbine parameters.
TurbineIsoentropic EfficiencyTurbine Constant
High pressure turbine0.88597.75
Intermediate pressure turbine 10.878766.3
Intermediate pressure turbine 20.8112467
Low pressure turbine0.756511,140
Table 2. The main plant parameters.
ParameterValueNode in Figure 1
Coal-61
Fuel consumption (mass flow), (kg/s)25.75-
Fuel consumption based on LHV, (MW)801.146-
Burner
Air fuel ration, λ1.2 times-
stoichiometric value-
Exhaust 56
Temperature (°C)140-
Pressure (bar)1.01-
Pressure conditions
Maximum pressure, (bar)10014
Minimum pressure, (bar)0.0819
Others
Air preheater effectiveness, (%)80-
Generators efficiency, (%)97-
Power output, (MW)263.932-
Plant efficiency based on LHV, (%)32.94-
Table 3. The main SOFC parameters used in this study.
ParameterValueUnit
Fuel utilization factor0.8-
Current density300mA/cm2
Cathode pressure drop ratio0.1bar
Anode pressure drop ratio0.05bar
Cathode inlet temperature600°C
Anode inlet temperature650°C
Outlet temperatures780°C
DC/AC converter efficiency0.97-
Table 4. Comparison between Siemens SGT5 4000F and the model developed here.
ParameterDatasheet ValueModelError (%)
ISO base rating, (MW)288290.951.0
Heat rate, (kJ/kWh)91149114.40.0
Efficiency LHV (%)39.539.50.0
Pressure ratio, (-)1818-
Exhaust mass flow rate, (kg/s)688688-
Turbine speed, (rpm)3000-
Exhaust temperature, (°C)580580.00.0
Table 5. System operating input parameters.
ParameterValueUnit
Air compressor isentropic efficiency0.8-
Air compressor mechanical efficiency0.95-
Heat exchangers air side pressure drops0.1bar
Hybrid recuperator gas side pressure drop0.08 bar
Hybrid recuperator effectiveness0.9-
Heat exchangers fuel side pressure drops0.05bar
Reformer compressor isentropic efficiency0.85-
Reformer compressor mechanical efficiency0.95-
Reformer inlet temperature330°C
Desulfurizer pressure drop0.05bar
Table 6. Plant performance for different configurations.
Parameter/ConfigurationBaseCC − 1 GT + SFCC − 2 GT + SFSOFC
Fuel consumption, (kW)801.151191.351626.381655.81
Total fuel flow rate, (kW)25.7526.0035.5036.14
Auxiliary power, (kW)17.639297.254590.993118.014
Supplementary fuel rate, (kg/s)-9.923.34-
Table 7. Effect of HR on plant efficiency and power.
Parameter/ConfigurationWith HRWithout HRWithout HR with SF
SOFC Utilization factor, (-)0.760.760.8
Current density, (mA/cm2)300300300
SOFC operating temperature, (°C)780780780
Fuel consumption, (MW)1727.372253.682332.90
Auxiliary power, (MW)102.568119.690194.150
Net power production, (MW)924.1461231.121308.20
Plant efficiency, (%)59.5754.6356.08
Electric power production, (MW)1026.711350.811502.35
SOFC cell voltage, (V)0.8280.8250.835
Table 8. Total cost of additional required components for repowering.
Plant ConfigurationPlant Net Power (MW)Total Cost ($)Cost
Repowered plant with 1 GT56954,131,34295 $/kW
Repowered plant with 2 GT860108,621,716126 $/kW
Repowered plant with SOFC and HR1003119,863,704120 $/kW

