Article

Vibration Durability Testing of Nickel Cobalt Aluminum Oxide (NCA) Lithium-Ion 18650 Battery Cells

by
James Michael Hooper
1,*,
James Marco
1,
Gael Henri Chouchelamane
2,
Christopher Lyness
2 and
James Taylor
1
1
Warwick Manufacturing Group (WMG), University of Warwick, Coventry CV4 7AL, UK
2
Jaguar Land Rover, Banbury Road, Warwick CV35 0XJ, UK
*
Author to whom correspondence should be addressed.
Energies 2016, 9(4), 281; https://doi.org/10.3390/en9040281
Submission received: 11 February 2016 / Revised: 2 April 2016 / Accepted: 5 April 2016 / Published: 12 April 2016

Abstract

:
This paper outlines a study undertaken to determine if the electrical performance of Nickel Cobalt Aluminum Oxide (NCA) 3.1 Ah 18650 battery cells can be degraded by road induced vibration typical of an electric vehicle (EV) application. This study investigates if a particular cell orientation within the battery assembly can result in different levels of cell degradation. The 18650 cells were evaluated in accordance with Society of Automotive Engineers (SAE) J2380 standard. This vibration test is synthesized to represent 100,000 miles of North American customer operation at the 90th percentile. This study identified that both the electrical performance and the mechanical properties of the NCA lithium-ion cells were relatively unaffected when exposed to vibration energy that is commensurate with a typical vehicle life. Minor changes observed in the cell’s electrical characteristics were deemed not to be statistically significant and more likely attributable to laboratory conditions during cell testing and storage. The same conclusion was found, irrespective of cell orientation during the test.

1. Introduction

Within the past decade, decarbonizing the tailpipe emissions of passenger vehicles has become an area of significant focus for automotive manufacturers and suppliers, due to emergent government legislation mandating the development of carbon dioxide (CO2) reducing technologies [1]. There has also been increased consumer pressure, due to growing environmental awareness within society, for manufacturers to provide products that reduce the reliance on fossil fuels.
Vehicle electrification is a technology pathway being adopted by some original equipment manufacturers (OEMs) to either reduce or eliminate tailpipe emissions [1,2]. However electric vehicles (EV’s) that employ a rechargeable energy storage system (RESS) still have some significant barriers within the marketplace when compared to the incumbent internal combustion engine (ICE) vehicle technology [3]. One of these barriers is ensuring that the RESS maintains customer satisfactory performance over a warranted life (such as 10 years or 100,000 miles of customer usage) [3].
Traditionally vehicle OEMs perform a variety of life representative mechanical durability tests during the design and prototype stages of their development process to ensure in-market reliability [4]. Not only do these tests ensure that new components are fit-for-purpose, they also allow for OEMs to obtain characterization data for simulations and computer aided engineering (CAE) activities [4]. These testing activities ensure that the product meets the necessary requirements for vehicle homologation [4]. Vibration durability is one of these tests. It is important to understand the degradation characteristics of a component or assembly when exposed to vibration loading representative of a vehicle life. Vibration can excite fatigue cracking or work hardening of materials [5,6,7] resulting in component failure or reduced system performance. It is necessary to ensure that potentially costly vibration induced warranty failures are avoided through the optimization of component to assembly integration.
Within the fabrication of complete RESS, many OEMs are employing 18650 cylindrical cells [8,9,10,11]. This is due to a number of advantages over there pouch and prismatic counterparts. Firstly, 18650 cells are a cell form currently in use in a number of consumer electronic products and as a result are already manufactured in very large quantities resulting in a lower “unit cost per cell” through economies of scale [11,12,13]. They also have the advantage of having built-in safety systems such as a current interrupt device (CID) that prevents the accumulation of excessive pressure within the cell, mitigating the risk of cell explosion [11,12,13]. They also have and a positive temperature coefficient (PTC) resistor that prevents high current surge [11,12,13].
A critical review of studies mechanically characterizing 18650 cylindrical cell is discussed within [4]. It was concluded that whilst a significant body of research exists that defines the mechanical behavior of cylindrical format cells through static and dynamic test techniques (such as mechanical strain and bending [14,15,16,17], force displacement [14,15,16,17,18], mechanical crush [14,18,19], penetration [16,20], mechanical shock [14,21], impact resistance [16,22], etc.) only a few studies exist that define the effects of degradation of cells through vibration excitation [4,21,22,23]. It was noted within [4] that these contemporary cell vibration studies had conflicting results and that no correlation existed between investigations with regard to the susceptibility of battery cells to vibration. However, these previous studies have applied vibration profiles that have a vehicle homologation focus (such as Economic Commissions for Europe (ECE) R100 and United Nations (UN) 38.3 [24,25]) which are designed to validate a battery system to abusive vibration conditions [3,26]. Subsequently the results presented in these studies are unrepresentative of vibration loading that is experienced by a chassis mounted component during normal customer operation over a certified distance (e.g., 100,000 miles of EV operation) [3,4]. Research in [4] noted that this area did not define the specific lithium-ion cell chemistry, nor did they define the electrical or mechanical characterization tests undertaken to determine cell degradation, thus making it difficult for engineers and researchers to identify specific vibration degradation phenomena relating to different cell attributes. Finally [4] identified that the majority of previous vibration studies had not investigated the effect of cell state of charge (SOC) or in-pack orientation on the degradation witnessed as a function of vibration excitation.
In response to this gap within the academic literature, Hooper et al. presents a study in which commercially available nickel manganese cobalt oxide (NMC) 2.2 Ah 18650 cylindrical cells were evaluated for electrical degradation when subject to vibration profiles representative of 100,000 miles of European and North American customer use [4]. Within [
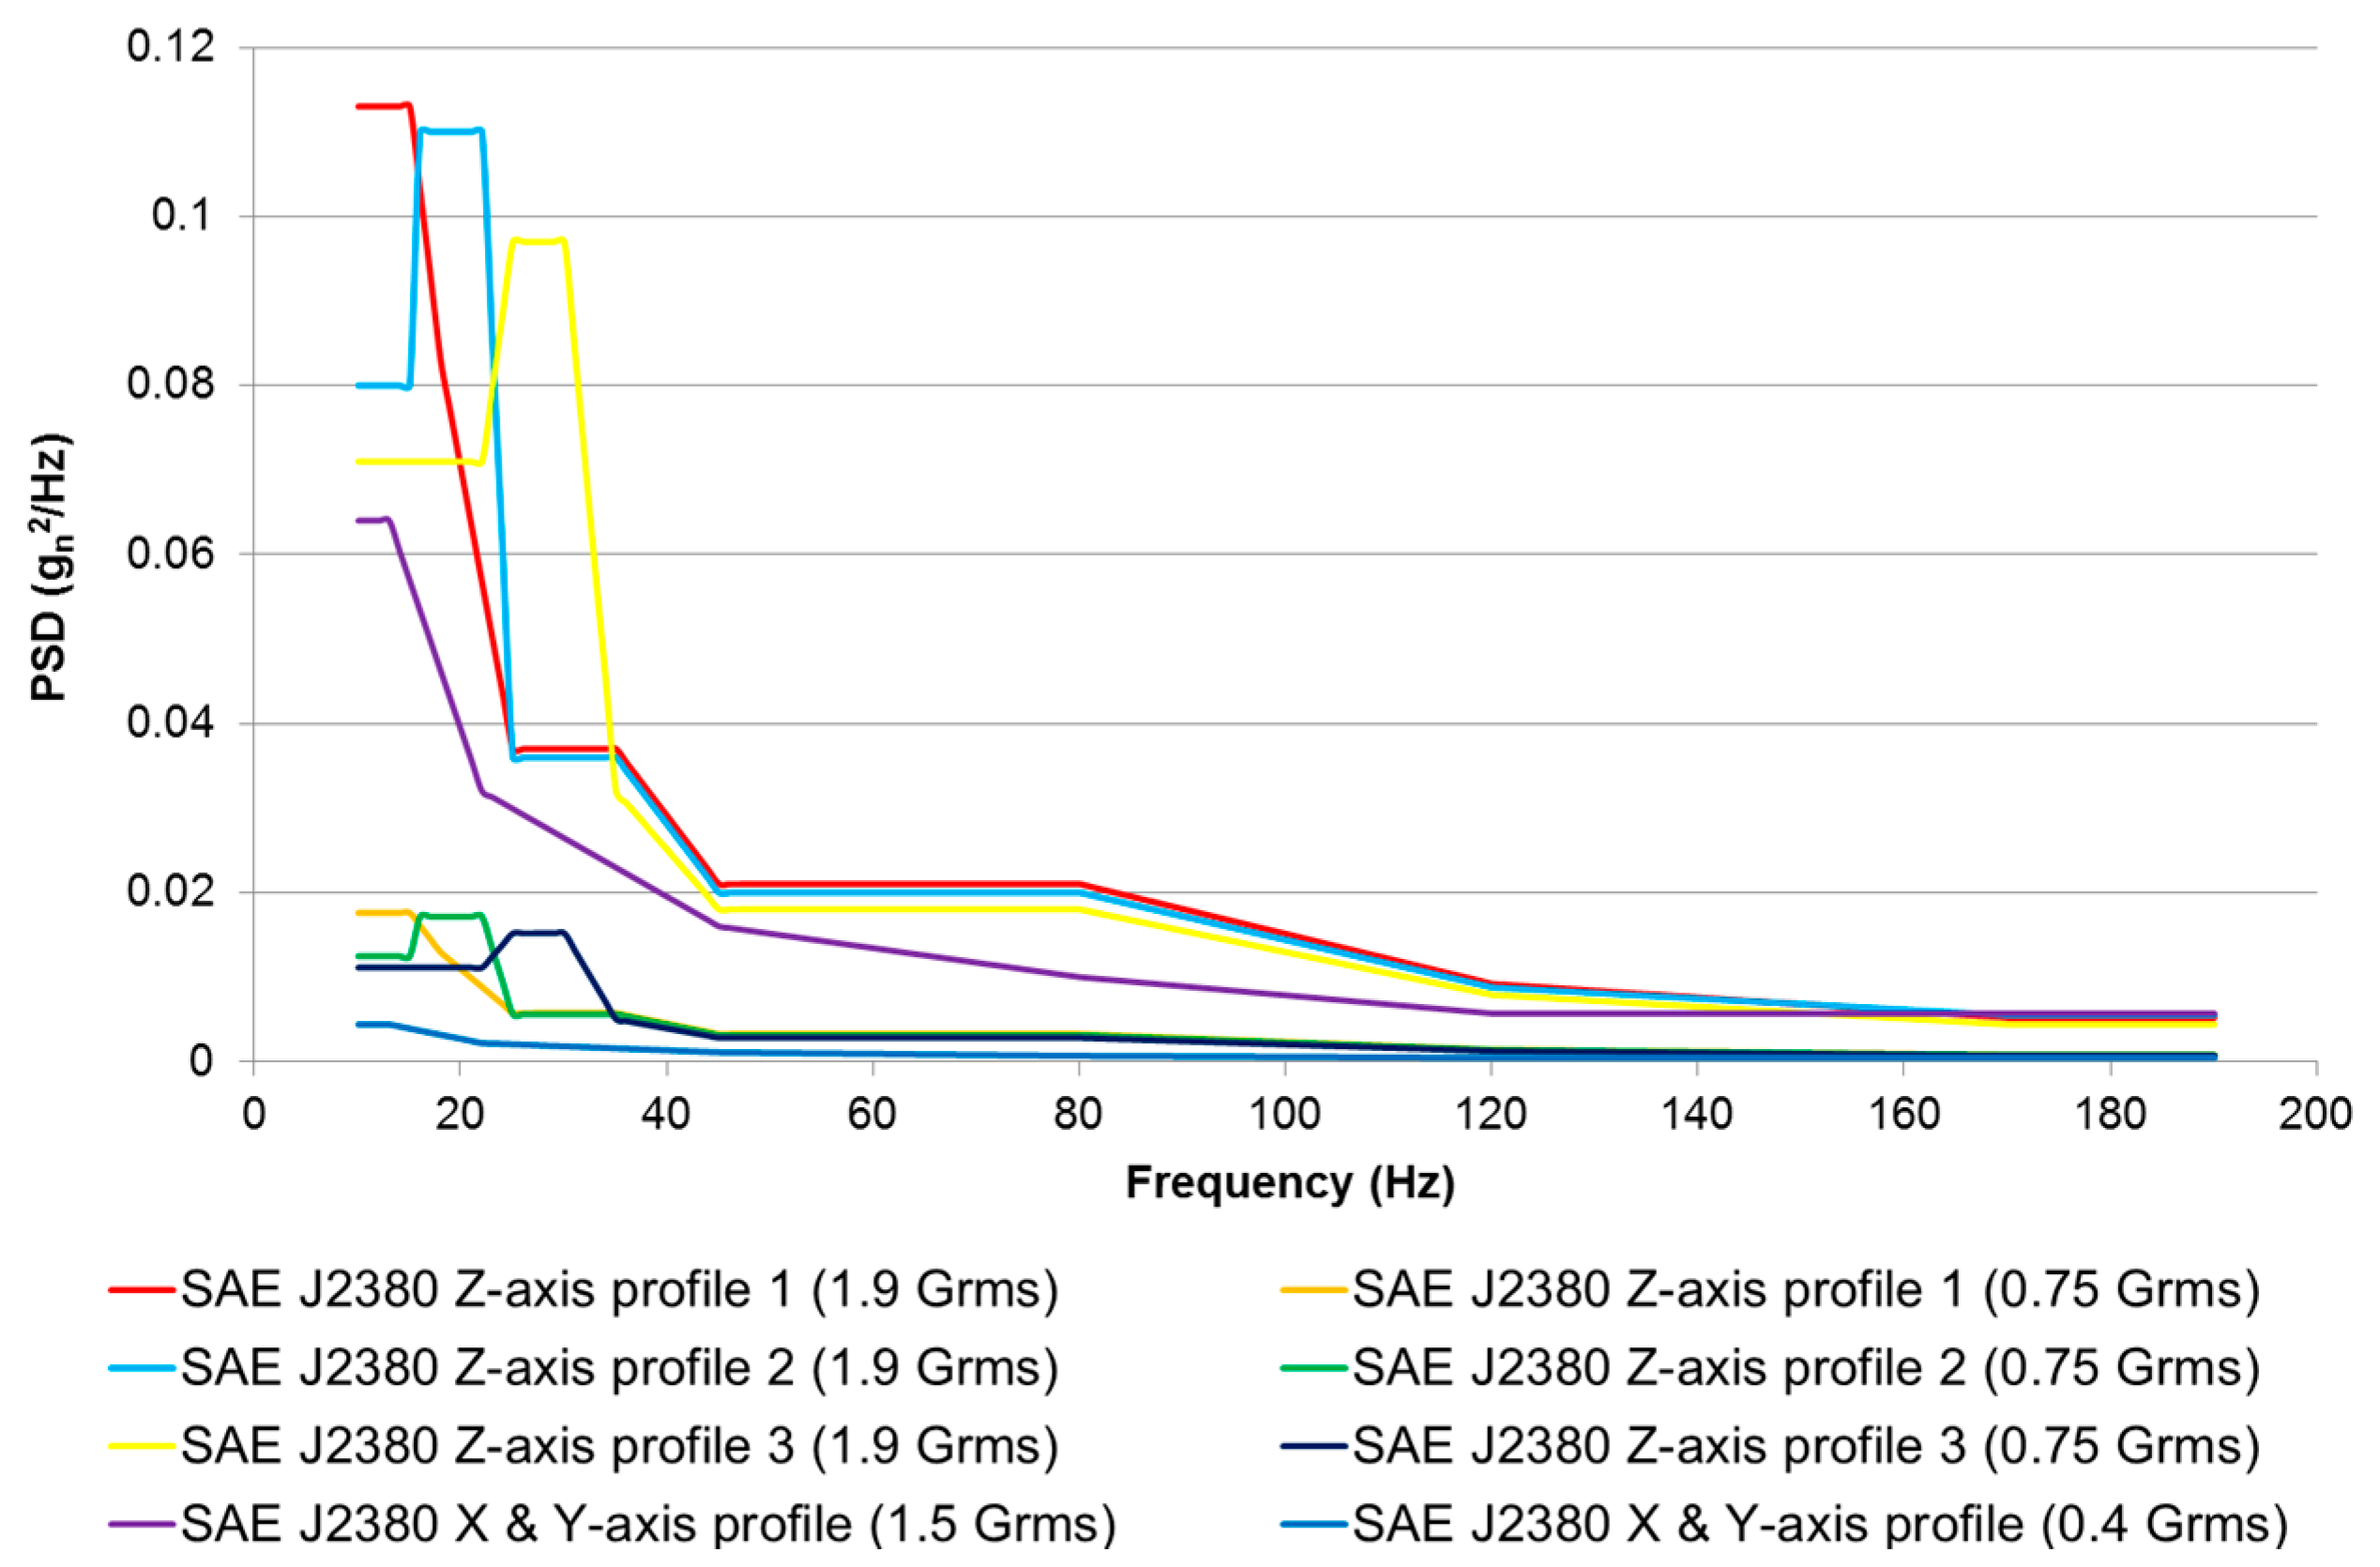
4] a third of the cells tested were evaluated using Society of Automotive Engineers (SAE) J2380 profiles [27]. The SAE J2380 profiles were developed to underpin durability evaluations and replicate a 100,000 miles of vehicle use within the North American market. It is reported within [4], that these NMC cells displayed a significant increase in ohmic resistance within the range of 25.82% to 38.09% post vibration testing. A reduction in the measured 1C energy capacity was observed in some samples, with 12.22% being the greatest reduction observed. The study in [
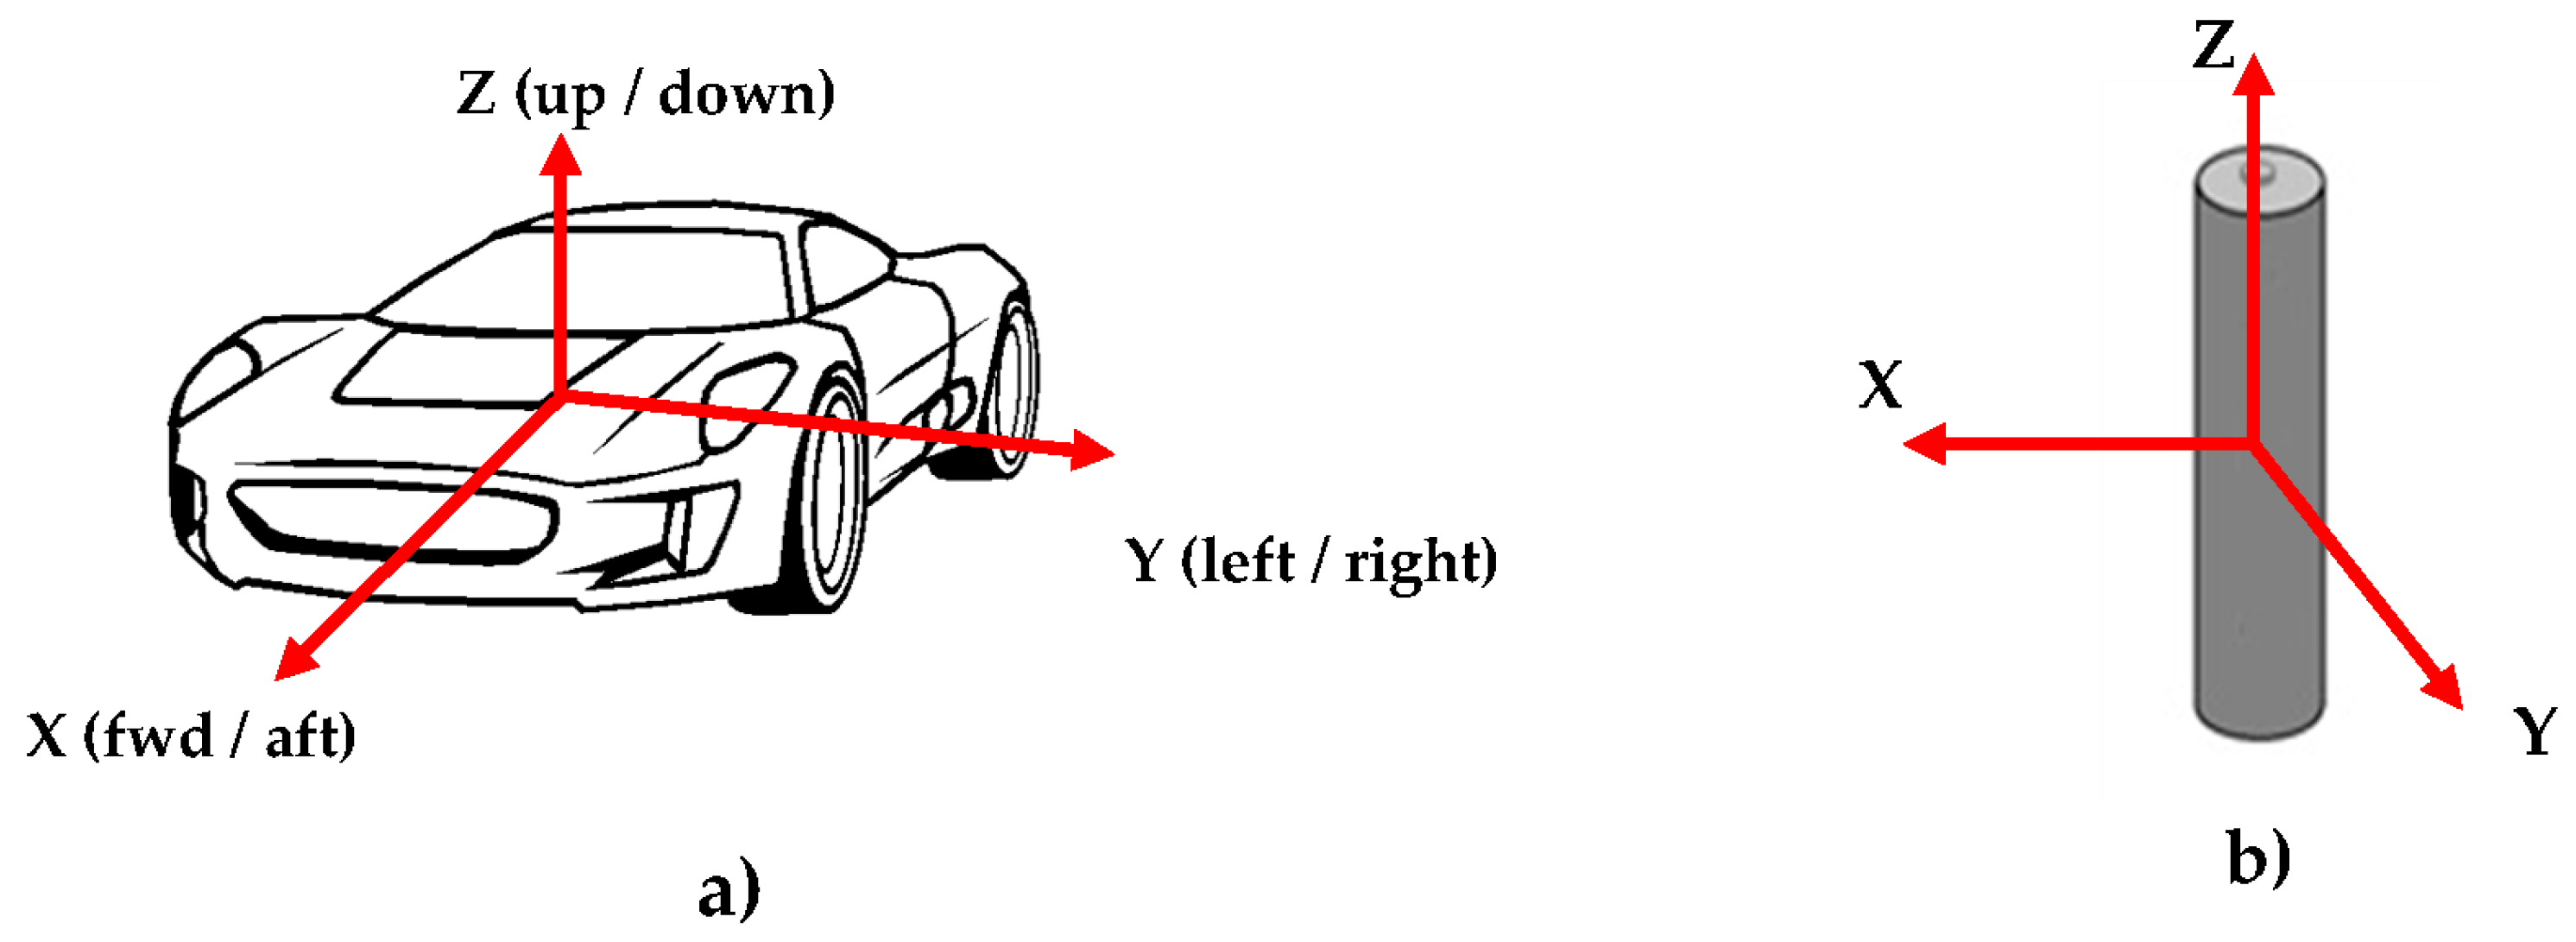
4] also investigated the impact of SOC and in-pack orientation on vibration induced degradation. It was identified that cells conditioned to 75% SOC and oriented in either of the cells horizontal planes (their X and Y axis) within the pack displayed a greater tendency for electrical degradation. However, it was acknowledged within [4] that the study’s conclusions are restricted due to the limited sample size employed, since each test condition was evaluated through a single cell.
This study represents a refinement and extension of the experiments discussed within [4] and investigates if similar vibration induced electrical aging results can be excited within an 18650 format cell of a different lithium-ion chemistry. It is hypothesized within [4,28] that different chemistries of lithium-ion cells could display different mechanical ageing characteristic due to the different properties of the materials used within the anode and cathodes of the cells construction. The aim of study is to determine the susceptibility of Nickel Cobalt Aluminum Oxide (NCA) 18650 battery cells to vibration that is representative of 100,000 miles of North American customer usage. The results of this study are compared to those previously reported in [4,21] as one means of assessing the transferability of cell degradation mechanisms, as function of vibration, between different cell chemistries and cell manufacturers. This study also investigates if cell orientation with the EV battery assembly can affect the severity of the observed degradation.
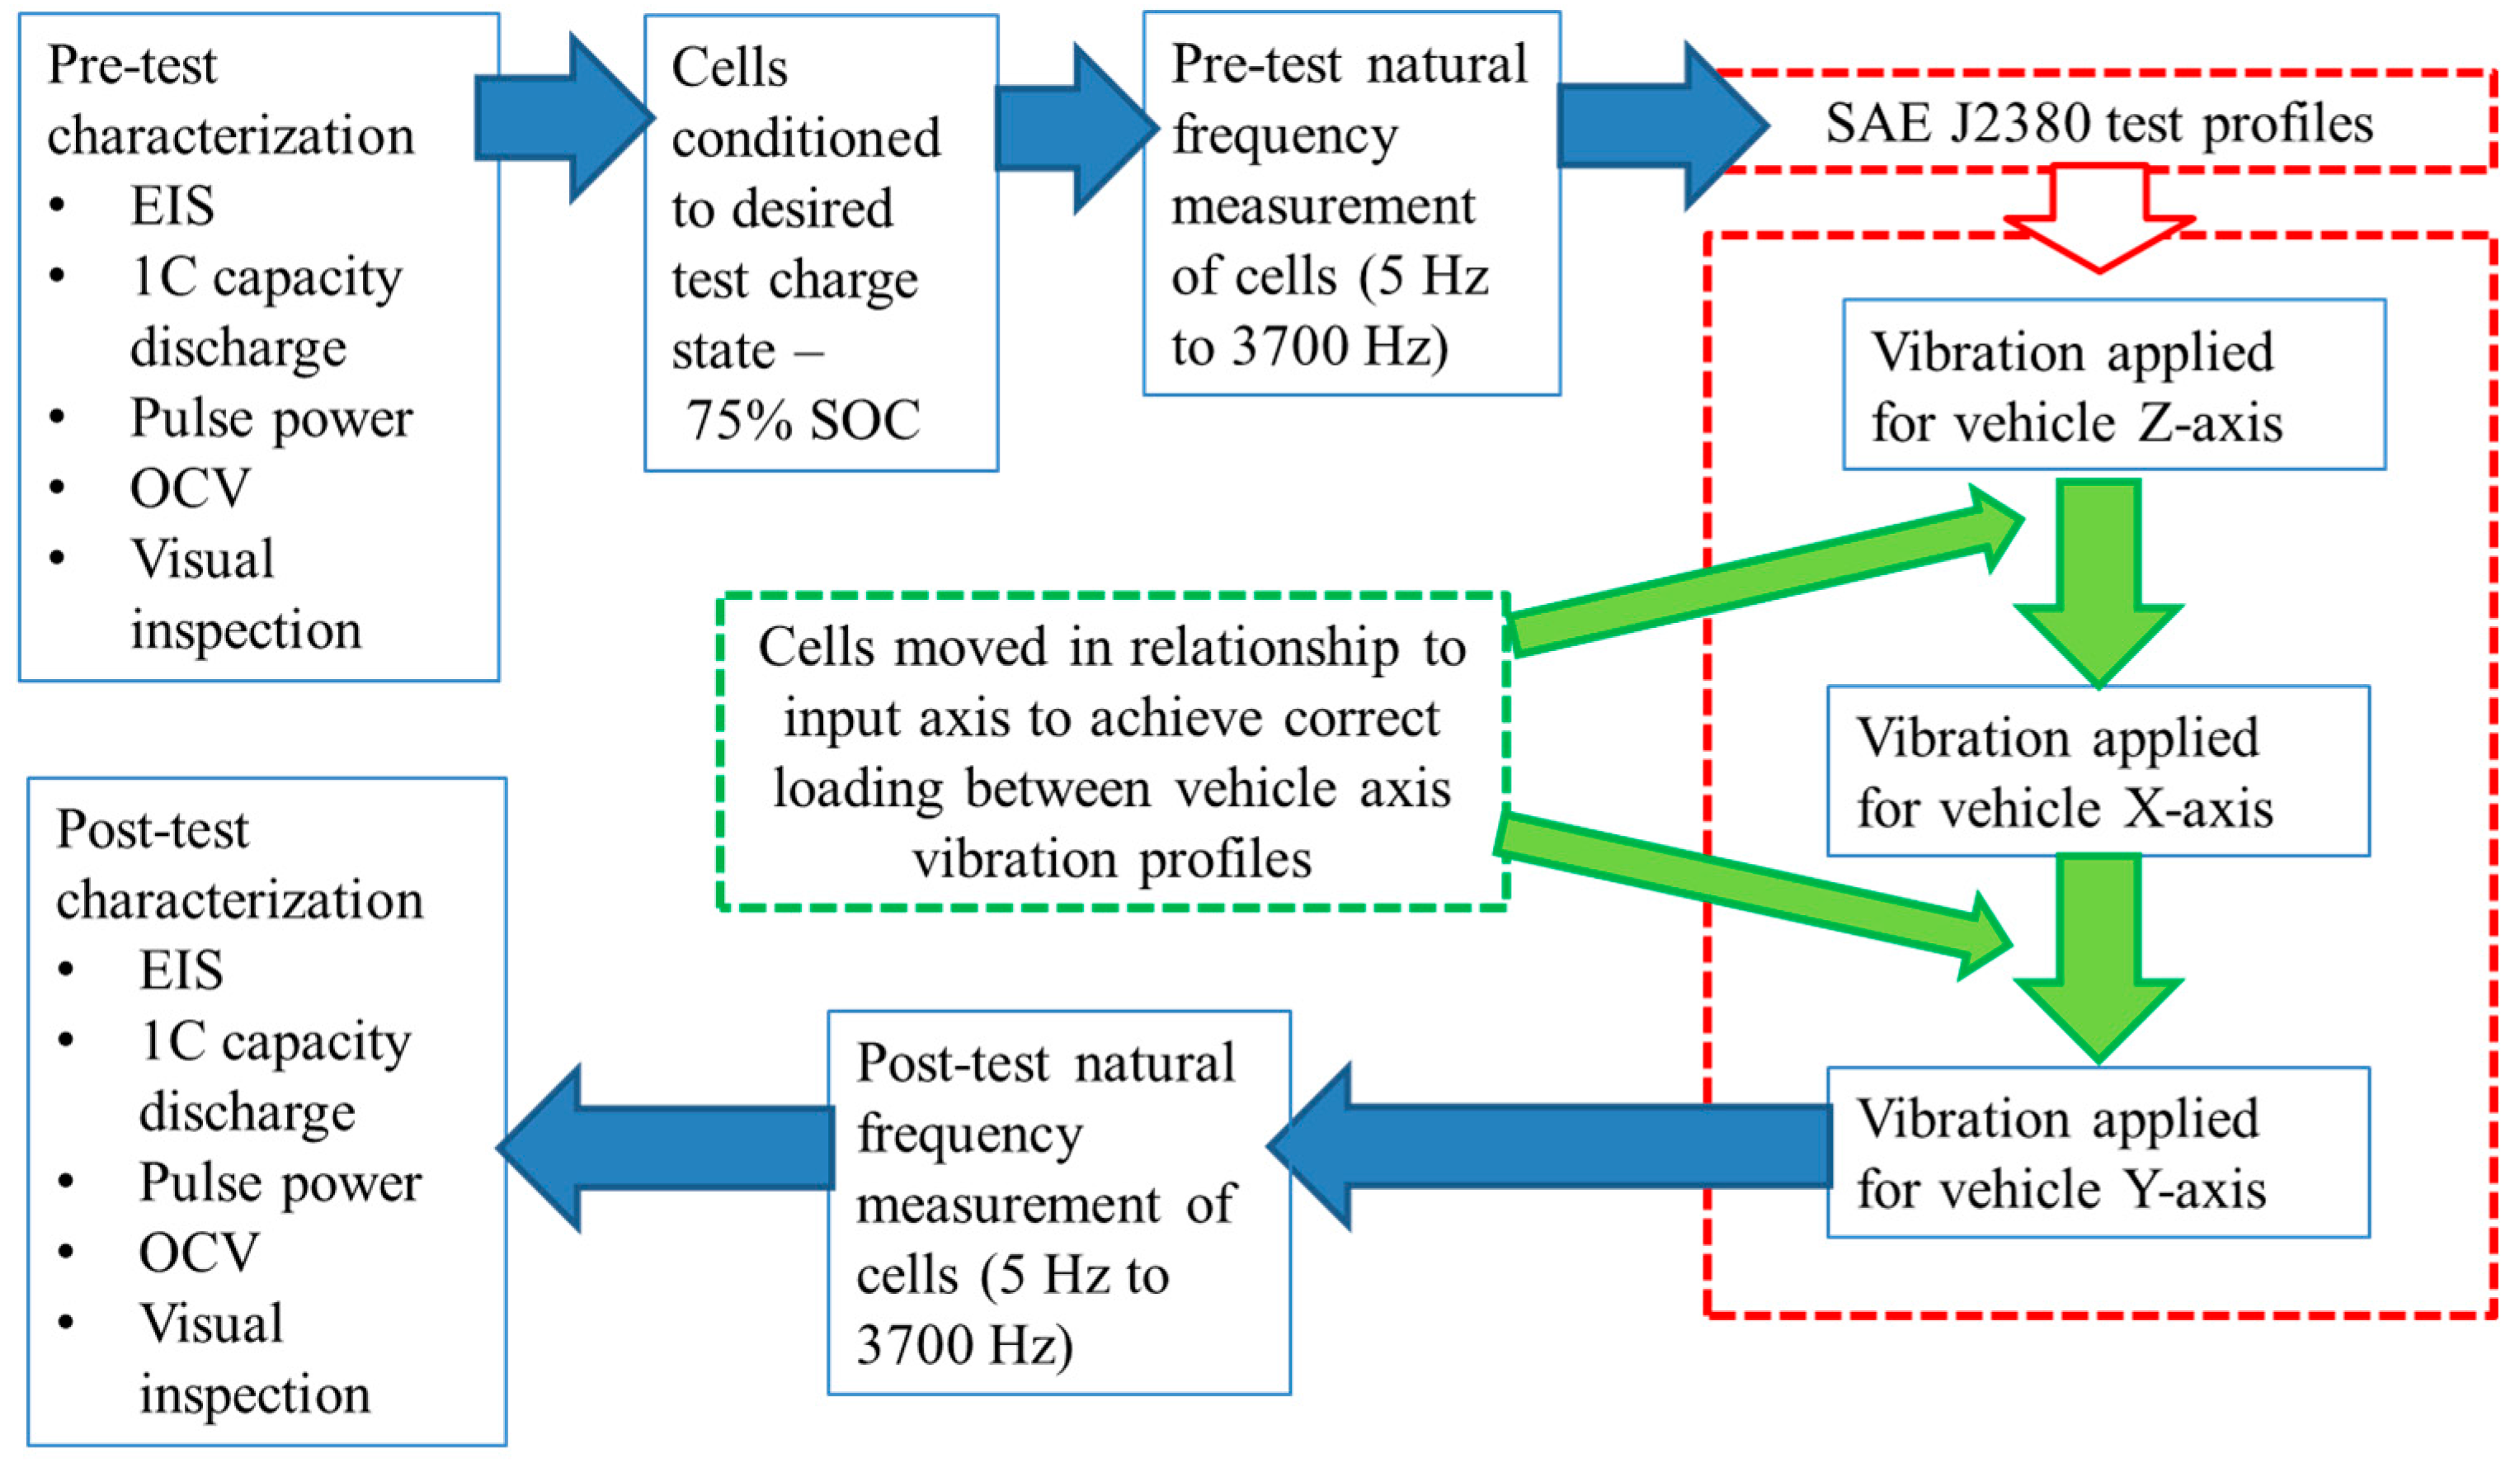
Within the context of this research, cell aging is defined as a reduction in cell capacity and/or an increase in the cell’s impedance. Mechanical cell degradation is defined through measuring a change in the cell’s natural frequency (within the range: 5 to 3700 Hz).
This paper is structured as follows; Section 2 provides a summary of the experimental procedure. Results are presented in Section 3. Discussion, further work and conclusions are presented in Section 4, Section 5 and Section 6, respectively.

2. Experimental Method

The following section outlines the experimental test procedure, including samples and there preparation, the vibration test profiles (defined within SAE J2380) and sample orientation. Further information on the test methodology is discussed within [4]. The complete experimental procedure followed during this test programme is summarised in Figure 1.

2.1. Test Samples

A total of 12 type 3.1 Ah 18650 format (NCA) were evaluated during this test program. Each cell was allocated a sample reference number, pre-conditioned to 75% SOC (discussed further in Section 2.3) and allocated a test orientation in relation to the vehicle axis (discussed further in Section 2.5). The details of sample preparation and cell orientation are summarized in Table 1.

2.2. Pre-Test Characterization

The 12 cells presented in Table 1 were characterized at both start of test (SOT) and end of test (EOT) (after vibration) using the assessment methods.
  • Visual inspection
  • 1C capacity
  • Pulse power
  • Open circuit voltage (OCV)
  • Electrochemical impedance spectroscopy (EIS)
Additional information on the specific laboratory equipment and characterization methodology is outlined in [4]. All electrical characterization tests were performed in a climate controlled chamber at 21 ± 0.5 °C. Following characterization, the cells were divided into two sample groups. One batch comprised of nine cells, was subject to the J2380 test profiles. The remaining three cells were categorized as control samples. The control samples were co-located within the same environmental conditions (within the manufacturer supplied shipping carton), but not subject to any vibration loading.

2.3. Cell Conditioning to 75% SOC

Post pre-test characterization, all samples were conditioned to 75% SOC. 75% SOC was selected during this investigation as there is evidence within [4] to suggest that a greater level of cell degradation occurred at this charge state. The desired cell SOC was achieved by fully charging the cells at a constant current (of 1.1 A (C/3) to 4.2 V). This was proceeded with a constant voltage phase at 4.2 V until the current fell to 0.05 A (C/65) [4]. Once the cells were fully charged they were allowed to stabilize during a rest period of 4 h [4]. Once the stabilization period was completed, they were discharged at 1C for 15 min, to achieve the cell SOC of 75%. The cells were once again allowed to stabilize for a minimum of 4 h before the application of any vibration.

2.4. Natural Frequency

The cells were mechanically characterized at the SOT via measuring their natural frequency. Typically changes in a test items natural frequency can indicate structural changes through a reduction in stiffness, such as through mechanisms as material deformation, fatigue induced cracking or redistribution of material. The methodology employed to measure the cells natural frequency is defined in [4]. The natural frequency measurement was conducted in the electromagnetic shaker (EMS) laboratory at 21 ± 5 °C.

2.5. SAE J2380 Vibration Profiles, Sample Orientation and Application of Vibration

Vibration test standards typically specify vibration profiles that are applied in the frequency domain. This is for reasons such as test standardization/repeatability ( vibration profiles in the time domain can be tailored for a wide range of shaker systems) and test time optimization (tests profiles synthesized for the frequency domain can be compressed allowing engineers the capability of replicating thousands of miles of customer operation in a matter of hours). For the assessment of wheeled ground vehicles, there are typically two types of frequency domain vibration profiles [29]. They are sinusoidal vibration and random vibration profiles.
Sinusoidal vibration profiles are currently specified by many vibration test standards for the evaluation of RESS and there subassemblies, however they do not represent accurately the in-service vibration witnessed by chassis mounted automotive components [7,30] and are better suited to the assessment of components mounted onto reciprocating machines such internal combustion engines (ICE). For a more realistic simulation of automotive chassis mounted components (which are excited by road induced vibration), broad band random vibration can be applied [7]. Random vibration is defined as “noise whose instantaneous amplitude is not specified at any instant of time” [31]. Because random vibration excites a defined band of frequencies, resonant frequencies within the item under evaluation are excited regularly and together, subsequently causing interactions which typically would not occur within a sine vibration test [7]. Random vibration profiles are defined by parameters that are representative of the operational environment of the item [29]. Random test profiles are represented as amplitude against frequency and will have an upper and lower frequency restriction (such as 10 Hz to 190 Hz in the example of SAE J2380 [27]). Because the acceleration of a random vibration profile is applied over a spectrum of many frequencies, the level is expressed as the quantity of gn rms2 in a 1 Hz bandwidth or gn rms2/Hz [31]. However, within test standards it is more commonly expressed as gn2/Hz. This unit of gn2/Hz describes the average power seen in a defined bandwidth, i.e., the power spectral density (PSD) [31]. The Grms can be calculated using Equation (1) where the bandwidth in Hz is defined by BW and the gn2/Hz value by the PSD.
G r m s = B W × P S D
SAE J2380 is currently the only internationally recognized vibration test standard that has been correlated to 100,000 miles of road vehicle durability (North American 90 percentile customer) and is the only specification that is defined as a durability test [3,4,26]. All other available vibration standards for RESS assemblies and component validation have been derived to assess the robustness of a given item to abusive load cases or severe operational environments [3,26].
SAE J2380 is applied within the frequency range of 10–190 Hz. Vibration is applied to vertical (Z) axis of the device under test (DUT) via three different PSD’s, each of which are applied at two different Grms levels and different durations. As a result; six separate load cases are performed to achieve a single evaluation of the Z axis. The longitudinal axis (X and Y axis) of the DUT are evaluated by a single spectra which like the vertical axis spectra, is conducted at two different Grms levels and durations. A full evaluation of all three axis of a RESS or sub component takes 92 h and 32 min (16 h and 12 min for Z axis profiles and 38 h and 10 min for both the X and Y axis each). Further information on the SAE J2380 profiles are defined in [27,32] It must be noted that SAE J2380 is the same as the random vibration “procedure 10” defined within [32]. The SAE J2380 random vibration profiles are presented in Figure 2.
Depending on the vehicle packaging constraints and application, 18650 cells are packaged in different orientations within different automotive battery packs [4]. Therefore, one of the objectives of this study is to evaluate the effect of the X, Y and Z “vehicle axis” vibration profiles, to the three possible X, Y and Z axis cell orientations [4]. The vehicle and cell axis conventions are defined in Figure 3.
The SAE J2380 vibration test comprises of vertical (Z-axis) profiles in addition to vibration profiles defined for the horizontal plane (X-axis and Y-axis). As part of the experimental procedure, the SAE J2380 profiles are sequentially applied to the cells to achieve the desired 100,000 miles of representative North American customer usage. For a complete execution of SAE J2380 standard the three different combinations of vibration loads with respect to cell orientation are defined below [4]:
  • Z:Z to X:X to Y:Y
  • Z:X to X:Y to Y:Z
  • Z:Y to X:Z to Y:X
Using the above notation, for each pair of letters, the first letter refers to the vehicle axis, whilst the second refers to cell orientation [4]. For simplicity this paper identifies the cell orientation in relationship to the vertical (Z axis) of the vehicle. For example a cell that was subjected to the vibration sequence of Z:Y to X:Z to Y:X, is identified within this paper as a sample which was evaluated in the Z:Y orientation [4].
All testing was conducted within the air-conditioned EMS laboratory at a temperature of 21 ± 5 °C. The test was controlled using an averaging control strategy, as defined within [33] which included ±3 dB alarm limits and ±6 dB abort limits [4]. Once the cells were installed to the durability fixture and mounted onto the EMS table, the Z-axis vibration profile of SAE J2380 was applied first in accordance with the schedule defined in Table 2.
On completion of the Z axis schedule, the cells were left to stabilize for 4 h [4]. The cells were then moved on the durability fixture to the corresponding vehicle X-axis and subjected to the X-axis vibration profile (Table 2) [4]. Finally, the cells were repositioned on the durability fixture to facilitate the application of the vehicle Y-axis vibration schedule (Table 2) [4]. At the end of the complete test programme, the cells were again allowed to stabilize for 4 h prior to visual inspection [4].

2.6. Post-Test Characterization

At EOT the cell natural frequency measurements (defined in Section 2.4) and the characterization measurements (defined in Section 2.2) were repeated.

3. Results

The following section identifies the trends in the observed measurements taken throughout the durability testing on the cells when subject to the SAE J2380 standard. It identifies trends that relate to the impact of vibration on cell performance. It also highlights the possible causality between vibration induced degradation and the in-pack orientation of the cell.

3.1. Post-Test External (Visual) Condition of Cells

At EOT, no significant mechanical damage or degradation (such as electrolyte leakage or external fatigue cracking) was observed on any of the test samples. A summary of the EOT visual condition of the cells is shown in Table 3.
The only consistent observation at EOT was the compression of the external insulation wrapped around the cell, at the point where the cells were clamped within the test fixture. The results showed no significant difference with respect to cell orientation.

3.2. Pulse Power Results

All samples displayed a reduction in the pulse power performance post vibration testing. Table 4 illustrates the change in DC resistance determined from the pulse power test results. Based on research conducted by [34] the standard error (the confidence in the sample mean resulting from the experiment due to past confidence with experiment/cells) is 0.62% [34]. The experimental error of the samples tested was calculated to be ±0.53% indicating a high confidence in the repeatability of the pulse power measurements undertaken.
It can be seen from Table 4, the worst performing cell was sample 4 (Z:X) which displayed a 5.34% increase in DC resistance. The cell with the least increase in DC resistance post vibration was sample 7 (vibrated in the Z:Y axis) that had a 3.70% increase. The percentage change in DC resistance of sample 7 and sample 3 are comparable to that of the control samples within this evaluation, supporting the hypothesis that it is not possible to isolate cell degradation (defined as an increase in cell ohmic resistance) due to vibration.
Within all samples subject to vibration, an increase in pulse power resistance was observed which may indicate a decrease in contact area between active material and current collector resulting from the delamination or cracking of internal surfaces [21]. However a mean increase in DC resistance of 3.08% was observed within the control samples (compared to a mean of 4.83%, 4.23% and 4.17% for the Z:X, Z:Y and Z:Z samples respectively) suggesting that the environmental conditions had a comparable impact on the DC resistance of the cells.
Analysis of variance (ANOVA) of the significance of the mean change in DC resistance of the tested cells in relation to the control samples was also performed. The results of this analysis are shown in Table 4. The ANOVA assessment indicates that only cells subject to vibration along the Z:X axis have a statistically significant increase in DC resistance as a result of the vibration when assessed at the 95% confidence level. The Z:Y and Z:Z orientations show no significant change when compared to the control samples.

3.3. EIS Results

Table 5 and Table 6 show the ohmic resistance (RO) and the charge transfer resistance (RCT) of the cells at SOT and EOT as measured through EIS. A complete interpretation of EIS results is beyond the scope of this study but is discussed within a number of research articles and academic texts, including [35,36].
Table 5 highlights that all cells (including the reference samples) exhibit an increase in Ro at EOT. For the cells that underwent vibration testing, sample 4 (Z:X) exhibited the greatest change in Ro—2.02 mΩ (8,73%). Moreover, sample 2 orientated along the Z:Z axis exhibited the least change in Ro—1.83 mΩ (5.12%). An increase in Ro typically originates from an increase in cell contact resistance or delamination of the material layers [35,36]. However the mean change in Ro resistance for the control samples is 1.42 mΩ (6.03%), compared to 1.72 mΩ (7.32%), 1.84 mΩ (7.90%) and 1.52 mΩ (6.55%) for the Z:X, Z:Y and Z:Z orientations respectively. An ANOVA analysis of the results was conducted to determine if there was significant change in Ro due to vibration. Table 5 shows, that there is no evidence of vibration increasing the value of Ro for the cells. Based on this statistical analysis, there is no significant change in Ro for any of the three cell orientations at the 95% confidence level.
The RCT results presented in Table 6 highlight significant variation in results between the items subjected to vibration and those designated as control samples. What is noticeable from these results is that the control samples all exhibit a significant increase in RCT (between 16.90% and 29.90% increase), whereas samples exposed to vibration have a wide variation of results, with the mean value of RCT actually decreasing in some orientations (e.g., Z:X and Z:Y) . Samples evaluated in the Z:Z orientation show a similar change in RCT as the control samples and have a significantly higher mean change of 18.55% than Z:X (1.08%) and Z:Y (−0.66%).
This difference between the Z:Z and the two horizontal orientations of Z:X and Z:Y is also confirmed within the ANOVA analysis for the mean value of RCT. Table 6 illustrates that there is a significant difference at the 95% confidence level for the horizontal cell orientations. A possible explanation for the significant increase in RCT in the Z:Z samples and the control items may be due to the electrolyte distribution caused by the orientation of the cells. This hypothesis is supported by a study undertaken by [37] which found evidence to indicate that cell orientation can impact the electrical cycling performance of the cell. It is therefore hypothesized that samples laying in either of the two horizontal planes and subjected to vibration result in greater electrolyte spread than samples mounted in the vertical axis where the electrolyte would be eventually pushed towards the base of the cell. This hypothesis may be further supported as the control samples were stored in the Z orientation within the manufacturers supplied shipping carton during testing. Further testing is required to fully explore and affirm the validity of this hypothesis.

3.4. OCV Measurement Results

Assessing the results shown in Table 7 it can be confirmed that no significant change in the OCV measurements were observed between SOT and EOT. The mean change in OCV is equal for all cell orientations. These results imply that there is no clear orientation that performs significantly worse or better than another. No ANOVA analysis was conducted due to the near negligible difference in OCV for both the test and control samples.

3.5. 1C Discharge Capacity Results

The results from the 1C discharge capacity test are shown in Table 8.
All samples (including control samples) show a reduction in capacity post vibration testing within the range of 0.30 to 0.39 Ah. However, it is evident that the reduction in capacity observed in the control samples is comparable to that observed within the tested samples. This indicates that the reduction in capacity is likely to be a function of laboratory environmental conditions as opposed to the effects of vibration. This hypothesis is also supported when the mean change in cell capacity of each cell orientation is compared to the mean of the control samples. It is also further supported by the ANOVA analysis (shown in Table 8) that clearly shows that the mean change in the control and tested samples are similar at the 95% confidence level, confirming that any change in capacity reduction cannot be uniquely attributed to the vibration durability of the cells. It is recognized that the observed reduction of 10% to 12% of the total cell capacity is significant given that the total age of the samples was only 9 months (samples were first delivered to WMG and placed in storage at 10 °C, 6 months prior to testing, whilst the total duration between pre and post-test characterization was 3 months). Therefore, the value is presented within this paper as a comparative measure as opposed to an absolute value of expected capacity reduction. It is also recommended that the cause of this capacity fade is investigated further and compared to the results obtained from a bespoke a cell storage test at the same environmental conditions.

3.6. Resonance Search via Swept Sine Results

The purpose of conducting this test was to determine if a mechanical change had occurred within a given cell which had resulted in a change in natural frequency between the SOT and EOT [4]. The change in frequency and amplitude of the first natural frequency observed within each cell between the SOT and EOT are shown in Table 9 and Table 10. Because the control samples were not evaluated for resonance behavior via an EMS frequency sweep to limit their exposure to mechanical excitation, it is not possible to conduct an ANOVA analysis with regard to the control samples.
From the results presented in Table 9, it is noticeable that the majority of cells show no significant change in natural frequency between the SOT and EOT. In the majority of the cells evaluated a change of frequency no greater than ±0.78% was observed. Changes in this range are within the error measurement range of the test method as the accelerometers were removed and reapplied between start and end of test resonance measurements.
Two cells evaluated in the Z:X orientation display a noticeable change in their first natural frequency. These are sample 4 (2.5% increase) and sample 6 (13.14% decrease). These changes potentially indicate a change in material properties of the cell.
With regard to the amplitude of the first resonant frequency (shown in Table 10), there is a significant change for the majority of cells.
As discussed within [4], one reason for this could be attributed to the amount of petro wax used between the accelerometer and the cell surface, between SOT and EOT resonance measurements. The greatest change in amplitude was observed within sample 4 (Z:X), which had an increase of 40.3%, highlighting a reduction in cell damping. However, a reduction of amplitude was also noted post testing in sample 3, 7 and 9 which indicates an increase in cell damping characteristics. One possible explanation for this could be due to a redistribution of electrolyte within the cells due to vibration. Further research to fully define the validity of this hypothesis and the potential causality between cell vibration and internal electrochemical changes within the cell are discussed in Section 5.

4. Discussion

4.1. Experimental Results

The primary conclusion from this study is that both the electrical performance and the mechanical properties of the NCA Lithium-ion cells are relatively unaffected when exposed to vibration energy that is commensurate with a typical vehicle life. A similar change in electrical performance was observed within the control samples post testing. This indicates that the measured degradation was likely to have been influenced by other laboratory environmental conditions as opposed to being a function of the applied vibration. ANOVA analysis of the mean results confirmed (with a 95% confidence) that the effects of vibration did not change the cells ohmic resistance and capacity. For the mechanical characterization of the cells, two thirds of the cells showed no significant change with regard to the shift in the natural frequency of their first resonance. This correlates with the electrical characterization results, indicating that vibration has had a minimal impact on the performance of these cells. Changes in RCT followed an unusual trend however. Samples vibrated within the Z:Z orientation degraded at a similar rate to the control samples, whilst cells tested in the horizontal conditions did not degrade. A similar level of degradation was also observed within the control samples which were continually stored in the Z axis within the manufacturers shipping carton.
Reviewing the results of each cell from the multiple characterization activities, samples 1, 4 and 8 demonstrate a small degree of correlation between RDC, RO, energy capacity and a change in resonance. However, overall there is a limited correlation between electrical cell characterization and changes in the cell’s natural frequency.

4.2. Experimental Method

As discussed within Section 3.6, there is some concern with regard to the effect on the amount of petro wax material employed between the accelerometer and the surface of the cell on the measured amplitude between SOT and EOT measurements. If the resonance search testing is to be repeated on future tests, it is recommended that the frequency sweep evaluations on the 18650 cells are conducted using light weight accelerometers that utilize a stud fastener and a machined cell surface-bonded collar. Despite a considerable amount of care being taken to ensure that the accelerometers were installed onto the same location of the cell at each frequency sweep measurement and levelled via an inclinometer, the use of petro wax is susceptible to user error. Ensuring the accelerometer is semi-permanently bonded to the radial surface of the cell; in a (perfectly true) vertical orientation can result in different quantities of petro wax being used for each accelerometer installation. The authors believe that this may introduce subtle changes in vibration transmissibility from the cell to the accelerometer. This hypothesis can be investigated further, as discussed in Section 5, in a future study assessing the modal response of 18650 cells.
Whilst the data set was increased within this study when compared to that discussed in [4], it is acknowledged that a larger data set is required to confirm the findings discussed within this paper and with [4].

4.3. Comparison of Results to Those Recorded for the NMC Cell

Table 11 compares the measured post-test difference of all samples from this study with NMC samples conditioned to 75% SOC from [4].
Reviewing the pulse power results from the NCA cells it is noticeable that the DC resistance measurement from the pulse power test has a far smaller spread than that observed within the 75% SOC samples from [4]. A similar observation with regard to the value of Ro for the NMC and NCA cells is also noticeable.
The RCT results from the two cell manufacturers show that the NCA cells do not illustrate the same level of degradation when oriented in any of the three test positons. In fact, the NMC cells from [4] illustrate a reduction in RCT post vibration testing. This trend is not witnessed within the NCA samples. However both the NCA reference cells and Z:Z oriented items shown similar changes in RCT as the NMC cells.
Both studies highlighted that the OCV is unaffected irrespective of orientation, cell chemistry or manufacturer. The voltage difference recorded is within the tolerance of the error of the equipment. This supports the results presented in [23,38] that also noted that OCV is not adversely affected by vibration loading.
With regard to capacity, it is noticeable that the measured amount of capacity fade within the NCA cells is typically greater than that noted within the NMC items. However unlike the NMC cells, the NCA 18650’s have a smaller spread of results. The reference samples for the NCA cells also illustrate the same level of capacity fade indicating that this reduction is a function of laboratory climatic conditions, as opposed to vibration excitation. In terms of absolute change between SOT and EOT, the worst performing NMC sample (sample 16) has a comparable capacity fade to that of the typical NCA item.
With respect to the mechanical characterization results, it must be noted that with the NCA samples, the first resonance was less than 2 gn (typically between 1.20 and 1.90 gn) pre and post testing. In comparison to the NMC cells results presented in [4], the NCA items display significantly less degradation in vibration response. Also no resonance at either pre or post testing was greater than twice the excitation force indicating that the NCA cells have both a greater damping coefficient and a stiffer construction than the NMC items. These characteristics may explain how the NCA cells have displayed less relative vibration aging than the NMC cells from the previous study.
With regard to visual condition, both types of 18650 cell showed no significant external degradation, other than marks from the clamp faces of the fixtures post testing.
Comparing the overall conclusions from [4] for samples evaluated to SAE J2380 and comparing them to the NCA cells from this study, there is a correlation between the two different cell chemistries. Both types of 18650 cells typically show the least degradation when oriented in the Z axis of the cell with respect to the Z axis of the vehicle (Z:Z condition) when assessed to the SAE standard.

4.4. Implications for Vehicle Design

The results presented within this paper suggest that as part of the technology selection process, OEM’s should study how susceptible the proposed cell technology is to vibration. It is also recommended that this is conducted during the concept phase of a vehicle program. The susceptibility of the cell to different packaging orientations within the battery assembly should also be considered at this stage of the vehicle development process to ensure that the orientation that results in the least degradation is chosen for the battery assembly.
Whilst typically the cells evaluated within this study are unaffected by a representative 100,000 mile road vibration excitation, there were some specific aging behavior (such as an observed increase in DC resistance (derived from pulse power testing) in Z:X oriented samples) identified. Any aging behavior as a function of vibration would have to be characterized to ensure effective battery management system (BMS) development and to maximize useful service life. As discussed within Section 4.3, there is evidence from both this study and that presented within [4] that 18650 cells installed in there Z orientation with respect to the Z orientation of the vehicle within a battery assembly are less likely to degrade when subjected to vibration representative of 100,000 miles of North American durability.

5. Further Work

One of the limitations of the experimental methodology employed within this study (and that within [4]) is that the change in electrical and mechanical performance was only assessed at SOT and EOT. As a result, no information with respect to the degradation rate over 100,000 miles of customer usage was determined. It is recommended that in future studies that the cells should be characterized at intermediate points during the test program, such as at 10,000 miles intervals. Not only would this facilitate further investigations into both the absolute value of degradation, but would also allow researchers to define the expected in-service rate of capacity and power fade over a defined vehicle mileage. To perform this activity via SAE J2380 vibration profiles, if a linear vibration profile is assumed, the test duration for each axis profile would have to be divided by 10 to achieve 10,000 mile test intervals. Another limitation is that whilst three cells of each orientation were evaluated, a greater sample size is necessary to increase confidence of the findings disclosed from this study. Therefore a further set of repeat tests should be conducted to increase the size of the data set.
The electromechanical condition and assembly of the cells after EOT characterization and those from [4] should be assessed using novel cell imaging and autopsy methods, as discussed within [21]. This is firstly to quantify the changes that occur within the material composition and structure of the cell post vibration and also to determine why the cells from this study displayed significantly less degradation than the cell technology evaluated within [4,21].
The research reported here and within [4] has highlighted that cells of the same type (18650 cylindrical cells) can have significantly different performance with regard to vibration durability. The data within this study and that defined in [4,21] indicates that OEM’s should conduct vibration durability testing as part of their cell selection activities. These results also demonstrate that the experimental programme should be broadened to include using cells from a wider cross-section of manufacturers and chemistries. This will further highlight the transferability of these results to other cell technologies.
Whilst there is evidence within this paper to suggest that NCA chemistry cells are more resilient to vibration than NMC, it would be undesirable to make this conclusion as this study does not consider the variability of different manufacturing and assembly processes employed by the two different cell suppliers (such as the binder, the film thickness etc.), which could impact the cell vibration performance. Therefore the authors propose a future study in which cells of the same chemistry are selected from different manufacturers and are assessed when subjected to the same vibration durability conditions. However it must be noted that it will be challenging within this proposed study to make any definitive conclusions, since cell manufacturers rarely fully disclose their manufacturing processes. Therefore it is also recommended that a further experiment is conducted using cells that have been specially manufactured by a specialist cell fabricator so that data on cells with a known construction provenance can be obtained.
Finally, different methods of mechanical accelerometer mounting should be investigated (such as the method outlined in Section 4). This is so the risk of user error in the natural frequency measurement of cells during the swept sine wave evaluations is reduced. The authors recommend that the potential error associated with the use of petro wax mounting, particularly when bonding accelerometers to the radial cell surface should be quantified through a measurement repeatability study.

6. Conclusions

Typically, both the electrical performance and the mechanical properties of the NCA 18650 Lithium-ion cells evaluated within this study were relatively unaffected when evaluated in accordance with SAE J2380 to vibration that is representative of 100,000 miles EV durability. No external damage or electrolyte leakage was observed in any of the test cells post vibration testing. No significant change in RO, or cell capacity was observed as a result of vibration at the 95% confidence level. OCV was not affected by vibration within this testing. Cell degradation as a function of vibration was observed within the pulse power DC resistance of the cells oriented in the Z:X axis. However no significant change in the pulse power DC resistance was noted at the 95% confidence level in either the Z:Y and Z:Z oriented samples. Samples tested in the horizontal orientations of Z:X or Z:Y did not illustrate an increase in charge transfer resistance, which was observed to increase within both the Z:Z and control samples. A similar reduction in energy capacity, increase in RO and increase in RDC was witnessed within the reference samples. These results indicate that the change in these electrical attributes is a function of other environmental conditions and the casualty between cell ageing and vibration cannot be fully quantified. When comparing the orientation results from this study to the previous assessment on 18650 type cells defined in [4,21] no significant correlation in performance was observed. At this stage, the underlying causality between the application of vibration energy and cell orientation is not fully understood. Defining these relationships is the focus of on-going research, using novel cell imaging and autopsy methods, to quantify changes in material composition and structure. Expanding the experimental programme to also include cells of different form-factor and chemistries will identify if the experimental results presented here are transferable to other cell technologies.

Acknowledgments

The research presented within this paper is supported by the Engineering and Physical Science Research Council (EPSRC-EP/I01585X/1) through the Engineering Doctoral Centre in High Value, Low Environmental Impact Manufacturing. The research was undertaken in collaboration with the WMG Centre High Value Manufacturing Catapult (funded by Innovate UK) and Jaguar Land Rover. The authors would like to express their gratitude to Millbrook Proving Ground Ltd. (Component Test Laboratory) for their support and advice throughout the test program.

Author Contributions

James Michael Hooper—Primary researcher and lead author. James Marco—Academic research supervision and co-author. Gael Henri Chouchelamane—Experimental researcher (electrical characterization) and co-author. Christopher Lyness—Industrial research support and peer-review. James Taylor—Statistical analysis.

Conflicts of Interest

The authors declare no conflict of interest.

References

  1. Parry-Jones, R. Driving Success—A Strategy for Growth and Sustainability in the UK Automotive Sector; Automotive Council: London, UK, 2013; pp. 1–87. [Google Scholar]
  2. Jackson, N. Technology road map, R + D agenda and UK capabilities. In Cenex Low Carbon Vehicle Show 2010; Automotive Council: Bedfordshire, UK, 2010; pp. 1–16. [Google Scholar]
  3. Hooper, J.; Marco, J. Characterising the in-vehicle vibration inputs to the high voltage battery of an electric vehicle. J. Power Sources 2014, 245, 510–519. [Google Scholar] [CrossRef]
  4. Hooper, J.; Marco, J.; Chouchelamane, G.; Lyness, C. Vibration durability testing of nickel manganese cobalt oxide (NMC) lithium-ion 18650 battery cells. Energies 2016, 9. [Google Scholar] [CrossRef]
  5. Halfpenny, A.; Hayes, D. Fatigue Analysis of Seam Welded Structures Using nCode DesignLife. In Proceedings of 2010 European HyperWorks Technology Conference, Versailles, France, 27–29 October 2010; pp. 1–21.
  6. Halfpenny, A. Methods for Accelerating Dynamic Durability Tests. In Proceedings of the 9th International Conference on Recent Advances in Structural Dynamics, Southamption, UK, 17–19 July 2006; pp. 1–19.
  7. Harrison, T. An Introduction to Vibration Testing; Bruel and Kjaer Sound and Vibration Measurement: Naerum, Denmark, 2014; p. 11. [Google Scholar]
  8. Day, J. Johnson Controls’ Lithium-Ion Batteries Power Jaguar Land Rover’s 2014 Hybrid Range Rover. Available online: http://johndayautomotivelectronics.com/johnson-controls-lithium-ion-batteries-power-2014-hybrid-range-rover/ (accessed on 17 February 2015).
  9. Rawlinson, P.D. Integration System for a Vehicle Battery Pack. U.S. Patent US 20,120,160,583 A1, 28 June 2012. [Google Scholar]
  10. Berdichevsky, G.; Kelty, K.; Straubel, J.; Toomre, E. The Tesla Roadster Battery System; Tesla Motors: Palo Alto, CA, USA, 2007; pp. 1–5. [Google Scholar]
  11. Kelty, K. Tesla—The Battery Technology behind the Wheel; Tesla Motors: Palo Alto, CA, USA, 2008; pp. 1–41. [Google Scholar]
  12. Paterson, A. Our Guide to Batteries; Axeon: Aberdeen, UK, 2012; pp. 1–22. [Google Scholar]
  13. Anderman, M. Tesla Motors: Battery Technology, Analysis of the Gigafactory, and the Automakers’ Perspectives; The Tesla Battery Report; Advanced Automotive Batteries: Oregon House, CA, USA, 2014; pp. 1–39. [Google Scholar]
  14. Avdeev, I.; Gilaki, M. Structural analysis and experimental characterization of cylindrical lithium-ion battery cells subject to lateral impact. J. Power Sources 2014, 271, 382–391. [Google Scholar] [CrossRef]
  15. Zhang, X.; Wierzbicki, T. Characterization of plasticity and fracture of shell casing of lithium-ion cylindrical battery. J. Power Sources 2015, 280, 47–56. [Google Scholar] [CrossRef]
  16. Choi, H.Y.; Lee, J.S.; Kim, Y.M.; Kim, H. A Study on Mechanical Characteristics of Lithium-Polymer Pouch Cell Battery for Electrci Vehicle; Paper Number 13-0115; Hongik University: Seoul, Korea, 2013; pp. 1–10. [Google Scholar]
  17. Berla, L.; Lee, S.W.; Cui, Y.; Nix, W. Mechanical behavior of electrochemically lithiated silicon. J. Power Sources 2015, 273, 41–51. [Google Scholar] [CrossRef]
  18. Greve, L.; Fehrenbach, C. Mechanical testing and macro-mechanical finite element simulation of the deformation, fracture, and short circuit initiation of cylindrical lithium ion battery cells. J. Power Sources 2012, 214, 377–385. [Google Scholar] [CrossRef]
  19. Sahraei, E.; Meiera, J.; Wierzbicki, T. Characterizing and modeling mechanical properties and onset of short circuit for three types of lithium-ion pouch cells. J. Power Sources 2014, 247, 503–516. [Google Scholar] [CrossRef]
  20. Feng, X.; Sun, J.; Ouyang, M.; Wang, F.; He, X.; Lu, L.; Peng, H. Characterization of penetration induced thermal runaway propagation process within a large format lithium ion battery module. J. Power Sources 2015, 275, 261–273. [Google Scholar] [CrossRef]
  21. Brand, M.; Schuster, S.; Bach, T.; Fleder, E.; Stelz, M.; Glaser, S.; Muller, J.; Sextl, G.; Jossen, A. Effects of vibrations and shocks on lithium-ion cells. J. Power Sources 2015, 288, 62–69. [Google Scholar] [CrossRef]
  22. Svens, P. Methods for Testing and Analyzing Lithium-Ion Battery Cells Intended for Heavy-Duty Hybrid Electric Vehicles; KTH Royal Institute of Technology: Stockholm, Sweden, 2014. [Google Scholar]
  23. Chapin, J.T.; Alvin, W.; Carl, W. Study of Aging Effects on Safety of 18650-Type Licoox Cells; Underwriters Laboratory Inc.: Northbrook, IL, USA, 2011. [Google Scholar]
  24. Nations, U. ECE R100—Battery Electric Vehicles with regard to Specific Requirements for the Construction, Functional Safety and Hydrogen. United Nations: New York, NY, USA, 2002. [Google Scholar]
  25. Proposal for the 02 Series of Amendments to Regulation No. 100 (Battery Electric Vehicle Safety); Economic and Social Council: Geneva, Switzerland, 2013; pp. 1–54.
  26. Kjell, G.; Lang, J.F. Comparing different vibration tests proposed for Li-ion batteries with vibration measurement in an electric vehicle. In Proceedings of the World Electric Vehicle Symposium and Exhibition (EVS27), Barcelona, Spain, 17–20 November 2013; pp. 1–11.
  27. SAE. Vibration Testing of Electric Vehicle Batteries; J2380; SAE International: Warrendale, PA, USA, 2013; pp. 1–7. [Google Scholar]
  28. Somerville, L. Submission 1: A Gentle Introduction Followed by a very Practical Approach to Ageing of Lithium-Ion Cells; University of Warwick: Warwich, UK, 2013; pp. 1–65. [Google Scholar]
  29. Hooper, J. Vibration Durability Testing and Aging of Lithium Nickel Manganese Cobalt Oxide (NMC) Lithium Ion 18650 Cylindrical Cells; University of Warwick: Coventry, Warwickshire, UK, 2015. [Google Scholar]
  30. Harrison, T. Sine Vibration Theory; Bruel and Kjaer Sound and Vibration Measurement: Naerum, Denmark, 2014; p. 27. [Google Scholar]
  31. Harrison, T. Random Vibration Theory; Bruel and Kjaer Sound and Vibration Measurement: Naerum Denmark, 2014. [Google Scholar]
  32. United States Advanced Battery Consortium (USABC). Electric Vehicle Battery Test Procedures Manual; USABC: Southfield, MI, USA, 1996; p. 129. [Google Scholar]
  33. Harrison, T. The Vibration System; Bruel and Kjaer Sound and Vibration Measurement: Naerum, Denmark, 2014; p. 15. [Google Scholar]
  34. Taylor, J. Uncertainty/Error Measurement of Electrical Characterisation Methods; Hooper, J., Ed.; University of Warwick: Coventry, UK, 2015; pp. 1–3. [Google Scholar]
  35. Barai, A.; Chouchelamane, G.H.; Guo, Y.; McGordon, A.; Jennings, P. A study on the impact of lithium-ion cell relaxation on electrochemical impedance spectroscopy. J. Power Sources 2015, 280, 74–80. [Google Scholar] [CrossRef]
  36. Birkl, C.; Howey, D. Model identification and parameter estimation for lifepo4 batteries. In Proceedings of the Hybrid and Electric Vehicles Conference 2013 (HEVC 2013), IET, London, UK, 6–7 November 2013; pp. 1–6.
  37. Ratnakumar, B.; Marshall, S.; Richard, E.; Larry, W.; Keith, C.; Subbarao, S. Lithium-ion rechargeable batteries on mars rovers. In Proceedings of the 2nd International Energy Conversion Engineering Conference, Providence, RI, USA, 16–19 August 2004; American Institute of Aeronautics and Astronautics: Reston, VA, USA.
  38. Wu, A. Study on Aging Effects on Safety of 18650 Type Licoox Cells; Product Safety Engineering Society: Austin, TX, USA, 2012. [Google Scholar]
Figure 1. Schematic of test process.
Energies 09 00281 g001
Figure 2. Society of Automotive Engineers (SAE) J2380 vibration power spectral density (PSD) profiles for Testing Samples 1 to 9 [27,32].
Energies 09 00281 g002
Figure 3. (a) Axis convention of vehicle vibration durability profiles; (b) Axis convention of cells [4].
Energies 09 00281 g003
Table 1. Test sample information (all cells conditioned to 75% SOC).
Sample NumberCell Orientation for Test (Vehicle Axis:Cell Axis)
1Z:Z
2Z:Z
3Z:Z
4Z:X
5Z:X
6Z:X
7Z:Y
8Z:Y
9Z:Y
10Control
11Control
12Control
Table 2. Test schedule [4,32].
Profile Description and GRMS LevelDuration (HH:MM)Test Cumulative Duration (HH:MM)
Z-axis schedule
Subject cells to 9 min of Z-axis profile 1 at 1.9 Grms in the Z axis orientation of the cells under assessment.00:0900:09
Subject cells to 5 h and 15 min of Z-axis profile 1 at 0.75 Grms in the Z axis orientation of the cells under assessment.05:1505:24
Subject cells to 9 min of Z-axis profile 2 at 1.9 Grms in the Z axis orientation of the cells under assessment.00:0905:33
Subject cells to 5 h and 15 min of Z-axis profile 2 at 0.75 Grms in the Z axis orientation of the cells under assessment.05:1510:48
Subject cells to 9 min of Z-axis profile 3 at 1.9 Grms in the Z axis orientation of the cells under assessment.00:0910:57
Subject cells to 5 h and 15 min of Z-axis profile 3 at 0.75 Grms in the Z axis orientation of the cells under assessment.05:1516:12
X-axis schedule
Subject cells to 5 min of X & Y-axis profile at 1.5 Grms in the X axis orientation of the cells under assessment.00:0516:17
Subject cells to 19 h of X & Y-axis profile at 0.4 Grms in the X axis orientation of the cells under assessment.19:0035:17
Subject cells to 5 min of X & Y-axis profile at 1.5 Grms in the X axis orientation of the cells under assessment.00:0535:22
Subject cells to 19 h of X & Y-axis profile at 0.4 Grms in the X axis orientation of the cells under assessment.19:0054:22
Y-axis schedule
Subject cells to 5 min of X & Y-axis profile at 1.5 Grms in the Y axis orientation of the cells under assessment.00:0554:27
Subject cells to 19 h of X & Y-axis profile at 0.4 Grms in the Y axis orientation of the cells under assessment.19:0073:27
Subject cells to 5 min of X & Y-axis profile at 1.5 Grms in the Y axis orientation of the cells under assessment.00:0573:32
Subject cells to 19 h of X & Y-axis profile at 0.4 Grms in the Y axis orientation of the cells under assessment.19:0092:32
Total-92:32
Table 3. Post-testing visual condition results.
Cell Sample NumberOrientationObservations/Comments
1Z:ZCompression of external insulation material at rig clamping face.
2Z:ZCompression of external insulation material at rig clamping face.
3Z:ZCompression of external insulation material at rig clamping face.
4Z:XCompression of external insulation material at rig clamping face.
5Z:XCompression of external insulation material at rig clamping face.
6Z:XCompression of external insulation material at rig clamping face.
7Z:YCompression of external insulation material at rig clamping face.
8Z:YCompression of external insulation material at rig clamping face.
9Z:YCompression of external insulation material at rig clamping face.
10ControlNone
11ControlNone
12ControlNone
Table 4. Change in pulse power performance—DC resistance.
Cell Sample NumberOrientationDC Resistance (SOT) (mΩ)DC Resistance (EOT) (mΩ)Change in DC Resistance (mΩ)Percentage Change in DC Resistance—Difference between SOT and EOT (%)
1Z:Z45.3247.311.994.39
2Z:Z45.2047.161.964.34
3Z:Z44.6546.341.693.78
4Z:X44.5946.972.385.34
5Z:X45.1447.162.024.47
6Z:X44.8546.952.104.68
7Z:Y44.8346.491.663.70
8Z:Y45.0047.192.194.87
9Z:Y44.5946.431.844.13
10Control44.8046.341.543.44
11Control45.4746.491.022.24
12Control44.7346.321.593.55
Mean Change
OrientationMean Change (mΩ)Mean Change (%)
Mean change in pulse power DC resistance (mΩ)—Z:X2.174.83
Mean change in pulse power DC resistance (mΩ)—Z:Y1.904.23
Mean change in pulse power DC resistance (mΩ)—Z:Z1.884.17
Mean change in pulse power DC resistance—Control1.383.08
ANOVA Analysis
OrientationANOVA p-value against control—Null hypothesis: Mean of vibrated cells and control cells are equal. Reject null hypothesis if p < 0.05
Z:X orientation0.024
Z:Y orientation0.099
Z:Z orientation0.077
Note: Number in bold text indicate a significant change due to the effect of vibration at the 95% confidence level.
Table 5. Start and end of test Ro measurements.
Cell Sample NumberOrientationSOT (mΩ)EOT (mΩ)Change from SOT and EOT (mΩ)Percentage Change (%)
1Z:Z23.6225.171.556.56
2Z:Z23.8225.041.225.12
3Z:Z23.0024.831.837.96
4Z:X23.1525.172.028.73
5Z:X23.6425.321.687.11
6Z:X23.6825.131.456.12
7Z:Y23.1824.781.606.90
8Z:Y23.4625.441.988.44
9Z:Y23.2325.171.948.35
10Control23.5125.151.646.98
11Control23.9224.981.064.43
12Control23.2024.751.556.68
Mean Change
OrientationMean Change (mΩ)Mean Change (%)
Mean change resistance—Z:X1.727.32
Mean change resistance—Z:Y1.847.90
Mean change resistance—Z:Z1.536.55
Mean change resistance—Control1.426.03
ANOVA Analysis
OrientationANOVA p-value against control—Null Hypothesis: Mean of vibrated cells and control cells are equal. Reject null hypothesis if p < 0.05
Z:X orientation0.309
Z:Y orientation0.120
Z:Z orientation0.676
Table 6. Start and end of test RCT measurements.
Cell Sample NumberOrientationSOT (mΩ)EOT (mΩ)Change from SOT and EOT (mΩ)Percentage Change (%)
1Z:Z5.807.051.2521.55
2Z:Z5.627.061.4425.62
3Z:Z5.786.270.498.48
4Z:X6.106.820.7211.80
5Z:X6.225.72−0.50−8.04
6Z:X5.895.86−0.03−0.51
7Z:Y6.376.380.010.16
8Z:Y6.046.050.010.17
9Z:Y6.075.93−0.14−2.31
10Control5.837.281.4524.87
11Control6.477.561.0916.85
12Control5.727.431.7129.90
Mean Change
OrientationMean Change (mΩ)Mean Change (%)
Mean change resistance—Z:X0.061.08
Mean change resistance—Z:Y−0.04−0.66
Mean change resistance—Z:Z1.0618.55
Mean change resistance—Control1.4223.87
ANOVA Analysis
OrientationANOVA p-value against Control—Null hypothesis: Mean of vibrated cells and control cells are equal. Reject null hypothesis if p < 0.05
Z:X orientation0.027
Z:Y orientation0.001
Z:Z orientation0.355
Note: Numbers in bold text indicate a significant change due to the effect of vibration at the 95% confidence level.
Table 7. Start and end of test open circuit voltage (OCV) measurements of all cells evaluated.
Cell Sample NumberOrientationVoltage (V)Percentage Change (%)
SOTEOTChange from SOT and EOT
1Z:Z3.8383.8390.0010.026
2Z:Z3.8393.838−0.001−0.026
3Z:Z3.8403.84000
4Z:X3.8383.83800
5Z:X3.8393.83900
6Z:X3.8403.84000
7Z:Y3.8403.84000
8Z:Y3.8403.84000
9Z:Y3.8383.83800
10Control3.8423.841−0.001−0.026
11Control3.8343.83400
12Control3.8393.83900
Mean Change
OrientationMean Change (Ah)Mean Change (%)
Mean change in OCV (V)—Z:X00
Mean change in OCV (V)—Z:Y00
Mean change in OCV (V)—Z:Z00
Mean change in OCV (V)—Control−0.00033−0.00867
Table 8. Change in capacity of test cells.
Cell Sample NumberOrientationSOT (Ah)EOT (Ah)Change from SOT and EOT (Ah)Percentage Change (%)
1Z:Z−3.04−2.72−0.32−10.53
2Z:Z−3.07−2.69−0.38−12.38
3Z:Z−3.08−2.73−0.35−11.36
4Z:X−3.06−2.70−0.36−11.76
5Z:X−3.05−2.73−0.32−10.49
6Z:X−3.06−2.69−0.37−12.09
7Z:Y−3.08−2.70−0.38−12.34
8Z:Y−3.07−2.71−0.36−11.73
9Z:Y−3.05−2.66−0.39−12.79
10Control−3.07−2.70−0.37−12.05
11Control−3.03−2.73−0.30−9.90
12Control−3.07−2.70−0.37−12.05
Mean change
OrientationMean Change (Ah)Mean Change (%)
Mean change capacity—Z:X−0.350−11.45
Mean change capacity—Z:Y−0.377−12.28
Mean change capacity—Z:Z−0.350−11.42
Mean change capacity—Control−0.347−11.34
ANOVA Analysis
OrientationANOVA p-value against control—Null hypothesis: Mean of vibrated cells and control cells are equal. Reject null hypothesis if p < 0.05
Z:X orientation0.911
Z:Y orientation0.295
Z:Z orientation0.914
Note: Numbers in bold text indicate a significant change due to the effect of vibration at the 95% confidence level.
Table 9. Summary of change in frequency of observed first cell resonance for samples.
First Resonant Frequency
Cell Sample NumberOrientationSOTEOTChange (Hz)Change (%)
1Z:Z3070307000.00
2Z:Z3700370000.00
3Z:Z35753557−180.50
4Z:X36043694902.50
5Z:X33273353260.78
6Z:X33632921−44213.14
7Z:Y30743070−40.13
8Z:Y30743070−40.13
9Z:Y35743594200.56
Mean Change
OrientationMean Change (Hz)Mean Change (%)
Mean change first Resonant frequency—Z:X186.005.47
Mean change first Resonant frequency—Z:Y9.330.27
Mean change first Resonant frequency—Z:Z6.000.17
Table 10. Summary of change in amplitude of observed first cell resonance.
Cell Sample NumberOrientationAmplitude at First ResonanceChange (%)
SOTEOTChange (gn)
1Z:Z1.351.350.000.00
2Z:Z1.231.270.043.25
3Z:Z1.301.22−0.086.15
4Z:X1.341.880.5440.30
5Z:X1.261.260.000.00
6Z:X1.491.610.128.05
7Z:Y1.311.11−0.2015.27
8Z:Y1.171.290.1210.26
9Z:Y1.281.24−0.043.13
Mean Change
OrientationMean Change (gn)Mean Change (%)
Mean change in amplitude in first resonance—Z:X186.0016.12
Mean change in amplitude in first resonance—Z:Y9.339.55
Mean change in amplitude in first resonance—Z:Z−0.01−3.14
Table 11. Comparison of change of nickel cobalt aluminum oxide (NCA) vs. change in nickel manganese cobalt oxide (NMC) 18650 cells from [4] evaluated at 75% SOC and in accordance to SAE J2380.
Cell Sample NumberOrientationElectrical Characterization—Pre and post-Test ChangeMechanical Characterization—Pre and post-Test Change
Pulse Power—Change in RDC (mΩ)EIS Change in Ro (mΩ)EIS Change in RCT (mΩ)OCV—Change in Voltage (V)Change in Capacity (Ah)Resonance Frequency—Change in HzResonance Amplitude—Change in gn
1Z:Z1.991.551.250.001−0.3200.00
2Z:Z1.961.221.44−0.001−0.3800.04
3Z:Z1.691.830.490.000−0.35−18−0.08
16 ϯZ:Z95.23**0.001−0.27−5660.2
4Z:X2.382.020.720.000−0.36900.54
5Z:X2.021.68−0.500.000−0.32260.00
6Z:X2.11.45−0.030.000−0.37−4420.12
17 ϯZ:X89.0996.90−7.000.001−0.02−124−0.07
7Z:Y1.661.600.010.000−0.38−4−0.20
8Z:Y2.191.980.010.000−0.36−40.12
9Z:Y1.841.94−0.140.000−0.3920−0.04
18 ϯZ:Y58.1894.70−8.400.002−0.152281.06
10Control1.591.551.710.000−0.37N/AN/A
11Control1.541.641.45−0.001−0.37N/AN/A
12Control1.021.061.090.000−0.30N/AN/A
8 ϯControl−0.680.00−8.900.000−0.10N/AN/A
Note: ϯ indicates that the sample was a NMC 18650 cell from study defined in [4]; * indicates that data could not be recorded from that cell due to the post-test degradation. Item in bold indicate a reduction in measured attribute.

