Article

Electrochemical Mechanism for FeS2/C Composite in Lithium Ion Batteries with Enhanced Reversible Capacity

1
Faculty of Material Science and Chemistry, China University of Geosciences, Wuhan 430074, China
2
ARC Centre of Excellence for Nanoscale BioPhotonics (CNBP), School of Chemistry and Physics, The University of Adelaide, Adelaide, SA 5005, Australia
*
Author to whom correspondence should be addressed.
Energies 2016, 9(4), 225; https://doi.org/10.3390/en9040225
Submission received: 7 January 2016 / Revised: 8 March 2016 / Accepted: 16 March 2016 / Published: 23 March 2016
(This article belongs to the Special Issue Reacting Transport Phenomena in Electrochemical Cells)

Abstract

:
Nanoscale FeS2 was synthesized via a simple hydrothermal method and was decorated by hydrothermal carbonization (FeS2@C). The structural properties of the synthesized materials detected by X-ray diffraction (XRD), together with the morphologies characterized by scanning electron microscopy (SEM) and transmission electron microscopy (TEM) indicated that the hydrothermal carbonization only had an impact on the morphology of pyrite. Additionally, the electrochemical performance of the coated pyrite in Li/FeS2 batteries was evaluated by galvanostatic discharge-charge tests and electrochemical impedance spectroscopy (EIS). The results showed that the initial capacity of FeS2@C was 799.2 mAh·g−1 (90% of theoretical capacity of FeS2) and that of uncoated FeS2 was only 574.6 mAh·g−1. XRD and ultraviolet (UV) visible spectroscopy results at different depths of discharge-charge for FeS2 were discussed to clarify the electrochemical mechanism, which play an important part in Li/FeS2 batteries.

1. Introduction

Lithium batteries play an important role in practical applications, especially for electric vehicle batteries. Li/FeS2 batteries are considered to be promising power battery candidates because of their high capacity density, safety and environmental friendliness [1]. However, they have the disadvantage of poor cyclability, which is a result of the poor conductivity of FeS2 (pyrite) as a cathode material [2].
Many methods have been applied to increase the conductivity of pyrite, such as a solid-state method with high temperature [3,4,5], conductive material coating [6,7] and elemental doping [8]. The solid-state method used sources of Fe and S which were blended with ball-milling yielding pyrite with small particles, high uniformity and high purity. In the conductive material coating process, FeS2 was mixed with conductive polymers or amorphous carbon, followed by a high-temperature process. Elemental doping employs a certain element as dopant, which was mixed with FeS2 particles before calcining to obtain modified pyrite. It is easy to see that the weaknesses of these methods are the high-temperature processes and complicated operation, rendering these methods unsuitable for industrialization because of their high cost.
In our experiments, the conductivity of pyrite was improved by hydrothermal carbonization, an easy, low cost operation method. The hydrothermal carbonization we used employed glucose as a carbon source for a carbonization reaction in an autoclave [9,10,11,12]. Firstly, with the C–C bonds broken, glucose was hydrolyzed into intermediates, which were transformed into small molecule acids. Then, these acids underwent hydration to form furfural and phenolics. Finally, carbon materials were obtained through a series of polymerizations [13,14].
In this paper, the synthesized pyrite had a nanoscale size and regular shape. Meanwhile, FeS2 was modified with hydrothermal carbonization to form a coated FeS2 species (denoted as FeS2@C). The initial specific capacity of the FeS2@C composite was 799.2 mAh·g−1, superior to the specific capacity (574.6 mAh·g−1) of the uncoated FeS2. We investigated the change of the cathode materials during the discharge-charge process by X-ray diffraction (XRD) and ultraviolet (UV) visible spectroscopy to illustrate the electrochemical mechanism of FeS2 electrodes.

2. Experiments

2.1. Preparation of FeS2 and Doped FeS2@C

A 0.6 g sample of polyvinylpyrrolidone (PVP) was dissolved in a mixed solution of 10 mL distilled water and 25 mL polyvinyl alcohol (PVA), and then 0.009 M FeCl2·7H2O was added under constant stirring to form a homogeneous solution. A 39 mL volume of 0.75 M sodium hydroxide was added dropwise into the solution, and 1.8 g sulfur powder (S) was then added under magnetic stirring for 30 min. Then, the mixed solution was transferred into a Teflon liner from a beaker before the Teflon liner was put into a stainless-steel autoclave (80% filled) and heated at 180 °C for 12 h. After the reaction, a black powder was obtained by centrifugation, washed with ethanol and water several times and then dried in a vacuum oven at 80 °C. The precipitate was ground into powder (denoted as FeS2) with an agate mortar. Next a 2 g FeS2 sample was added into 0.1 M NaOH. After ultrasonication for 10 min, the NaOH was washed with deionized water. The FeS2 particles were dispersed in 0.3 M glucose, and the material was sonicated for 30 min. This mixed solution was embedded in a Teflon-lined stainless-steel autoclave at 180 °C for 6 h. After washing with deionized water and ethanol for several times, the FeS2@C composite was obtained.

2.2. Materials Characterization and Electrochemical Evaluation

X-ray diffraction (XRD) patterns were obtained with a D8-FOCUS diffractometer (Bruker, Germany) using Cu Kα radiation (40 kV, 100 mA, λ = 1.54056 Å). Scanning electron microscopy (SEM) was performed with a Quanta 200 instrument (FEI, Eindhoven, The Netherlands) at 25 kV. The content of carbon in the FeS2@C was derived from thermogravimetric analysis (TGA), which was measured from 30 to 700 °C with a heating rate of 10 °C·min−1 under nitrogen flow, utilizing a STA449 F3 Jupiter thermogravimetric analyzer (Netzsch, Germany). The UV visible spectroscopy was performed on a UV2550 ultraviolet-visible spectrophotometer (Shimadzu, Japan).
Electrochemical experiments were performed via coin-type test cells assembled in an argon-filled glovebox with lithium metal as the counter and reference electrodes at room temperature. The cathode for the Li/FeS2 battery was prepared by mixing 65 wt% composite materials, 25 wt% carbon black and 15 wt% polyvinylidene difluoride (PVDF) in N-methyl-2-pyrrolidone (NMP) to form a slurry. The slurry was pasted onto aluminum foil. Celgard 2300 membrane was used as the separator. The electrolyte was 1 M LiClO4 dissolved in a mixture of ethylene carbonate (EC) and dimethyl carbonate (DMC) (1:1 by volume). For the cycling experiments, constant currents were applied, and the voltages were restricted to a window of 1–2.5 V. Electrochemical impedance spectroscopy (EIS) was performed on a VMP3 electrochemical workstation over a frequency range from 100 kHz to 10 mHz under AC stimulus with 5 mV of amplitude and no applied voltage bias.

3. Results and Discussion

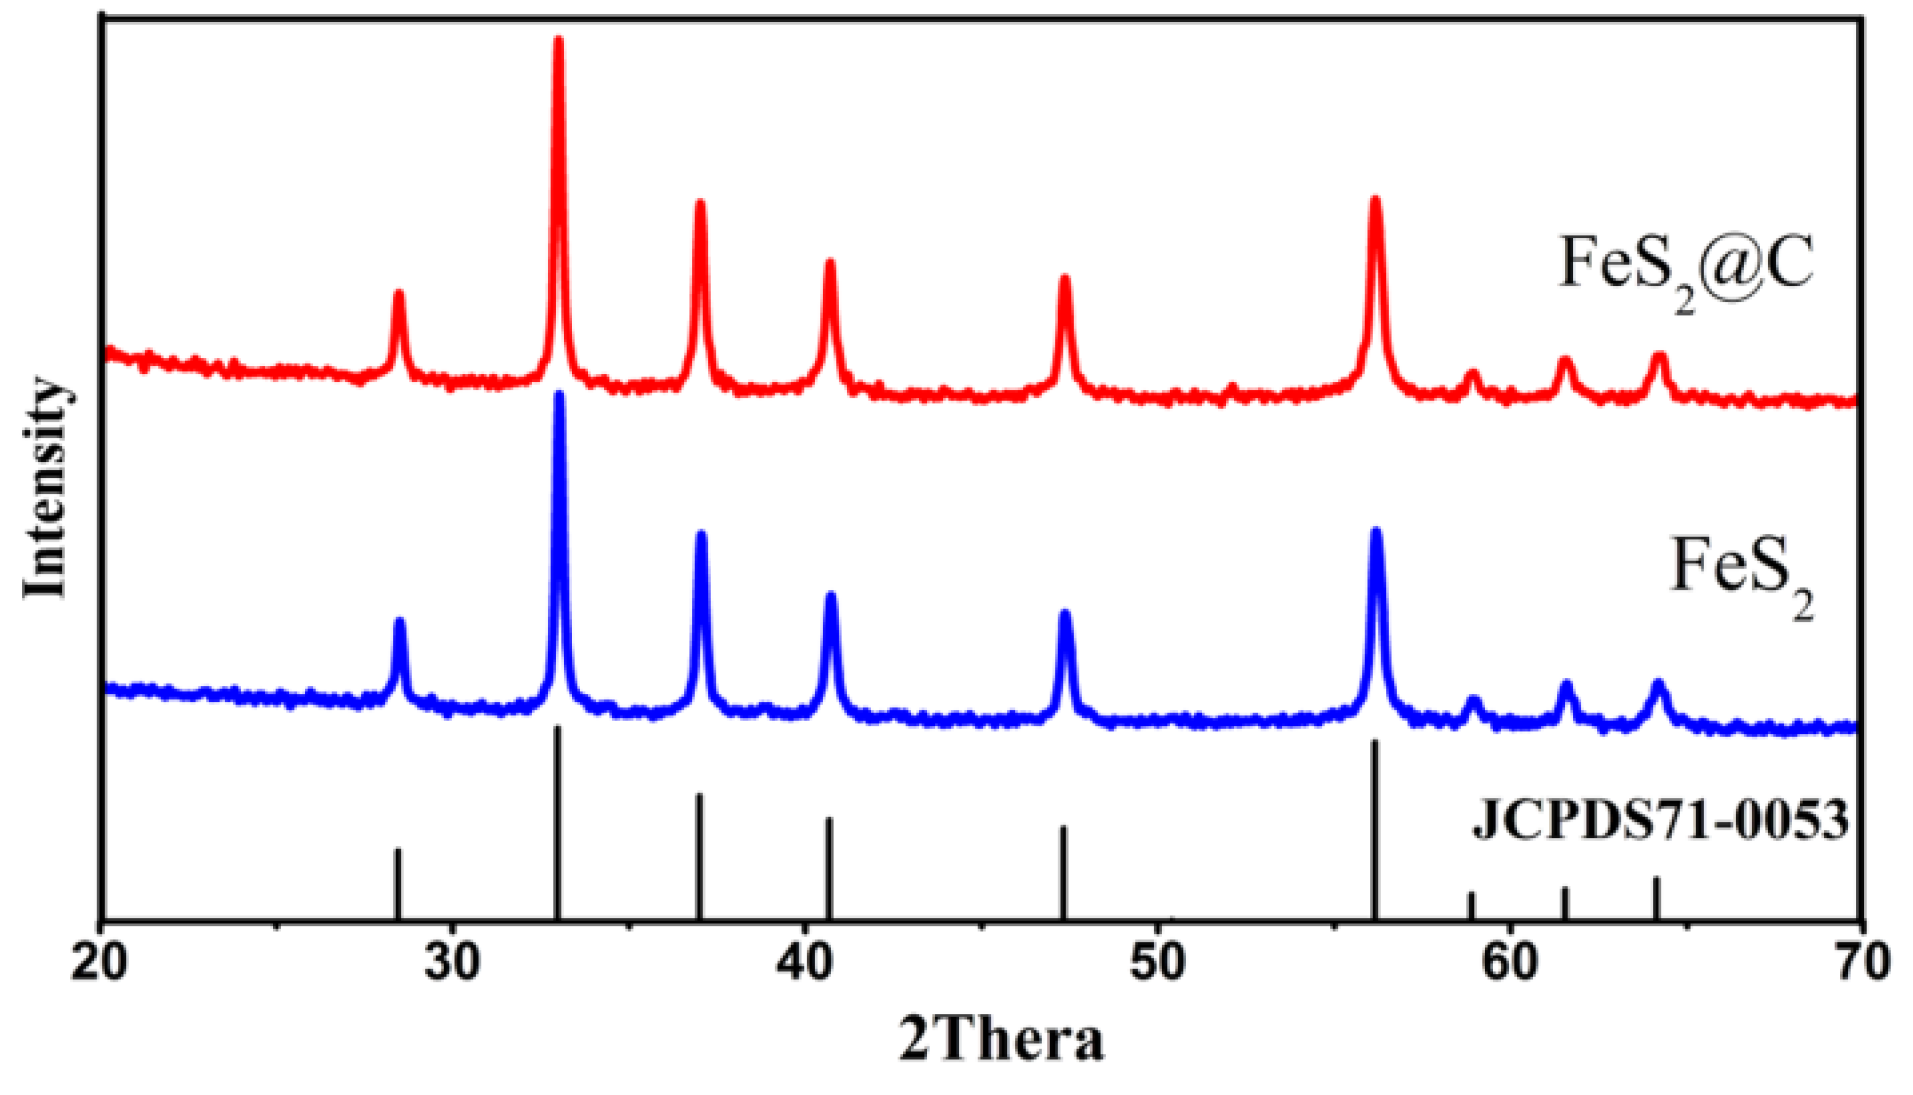
3.1. X-Ray Diffraction (XRD)

The XRD curves for the FeS2@C and FeS2 are shown in Figure 1. Both samples can be indexed to cubic pyrite FeS2 (JCPDS 71-0053) without detectable impurities. The lattice constant is calculated as a = 5.418 Å, which is in good agreement with the value given in the standard card (JCPDS#71-0053), indicating that the process of hydrothermal carbonization has no influence on the crystal structure.

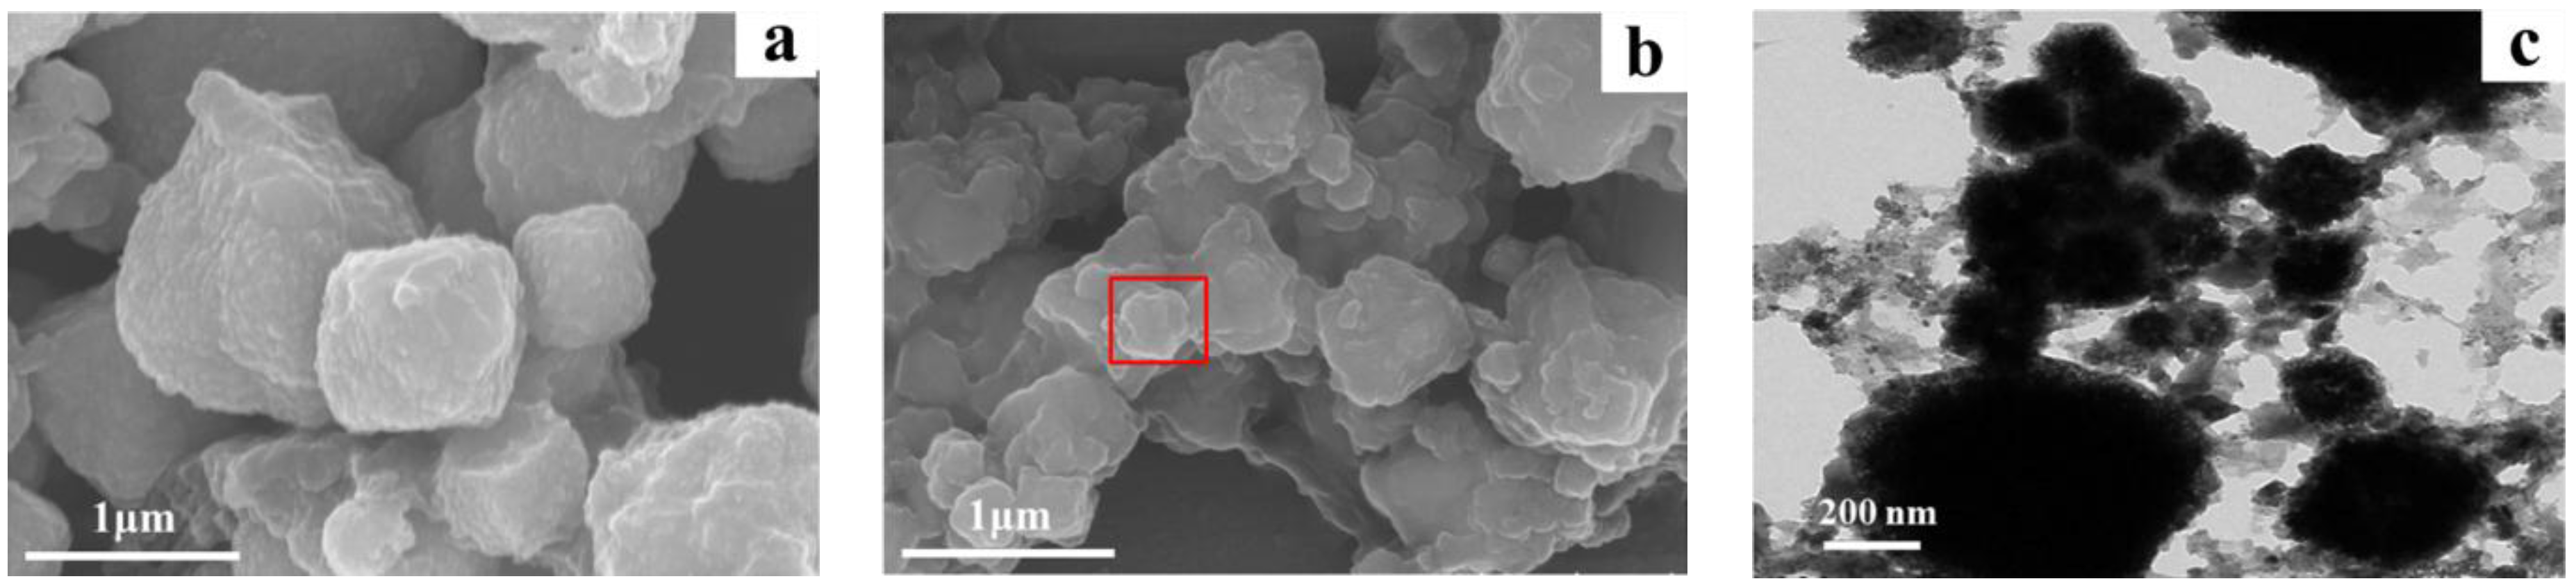
3.2. Scanning Electron Microscopy (SEM) and Transmission Electron Microscopy (TEM)

The morphologies of all samples by SEM and TEM are shown in Figure 2. The FeS2 particles have relatively regular shapes and a rough surface, as shown in Figure 2a. The image of FeS2@C is irregular and protuberant, as shown in Figure 2b, which is mainly because of the existence of carbon obtained from the hydrothermal carbonization. The TEM image is displayed in Figure 2c. The black particles are FeS2@C and the tiny particles are carbon. Namely, the pyrite particles are covered with carbon. In addition, there are dispersal plate-shaped carbon particles in the composites. The plate-like particles can link individual FeS2 particles to form a conductive bridge [4]. Therefore, the FeS2@C composite possess good conductivity.

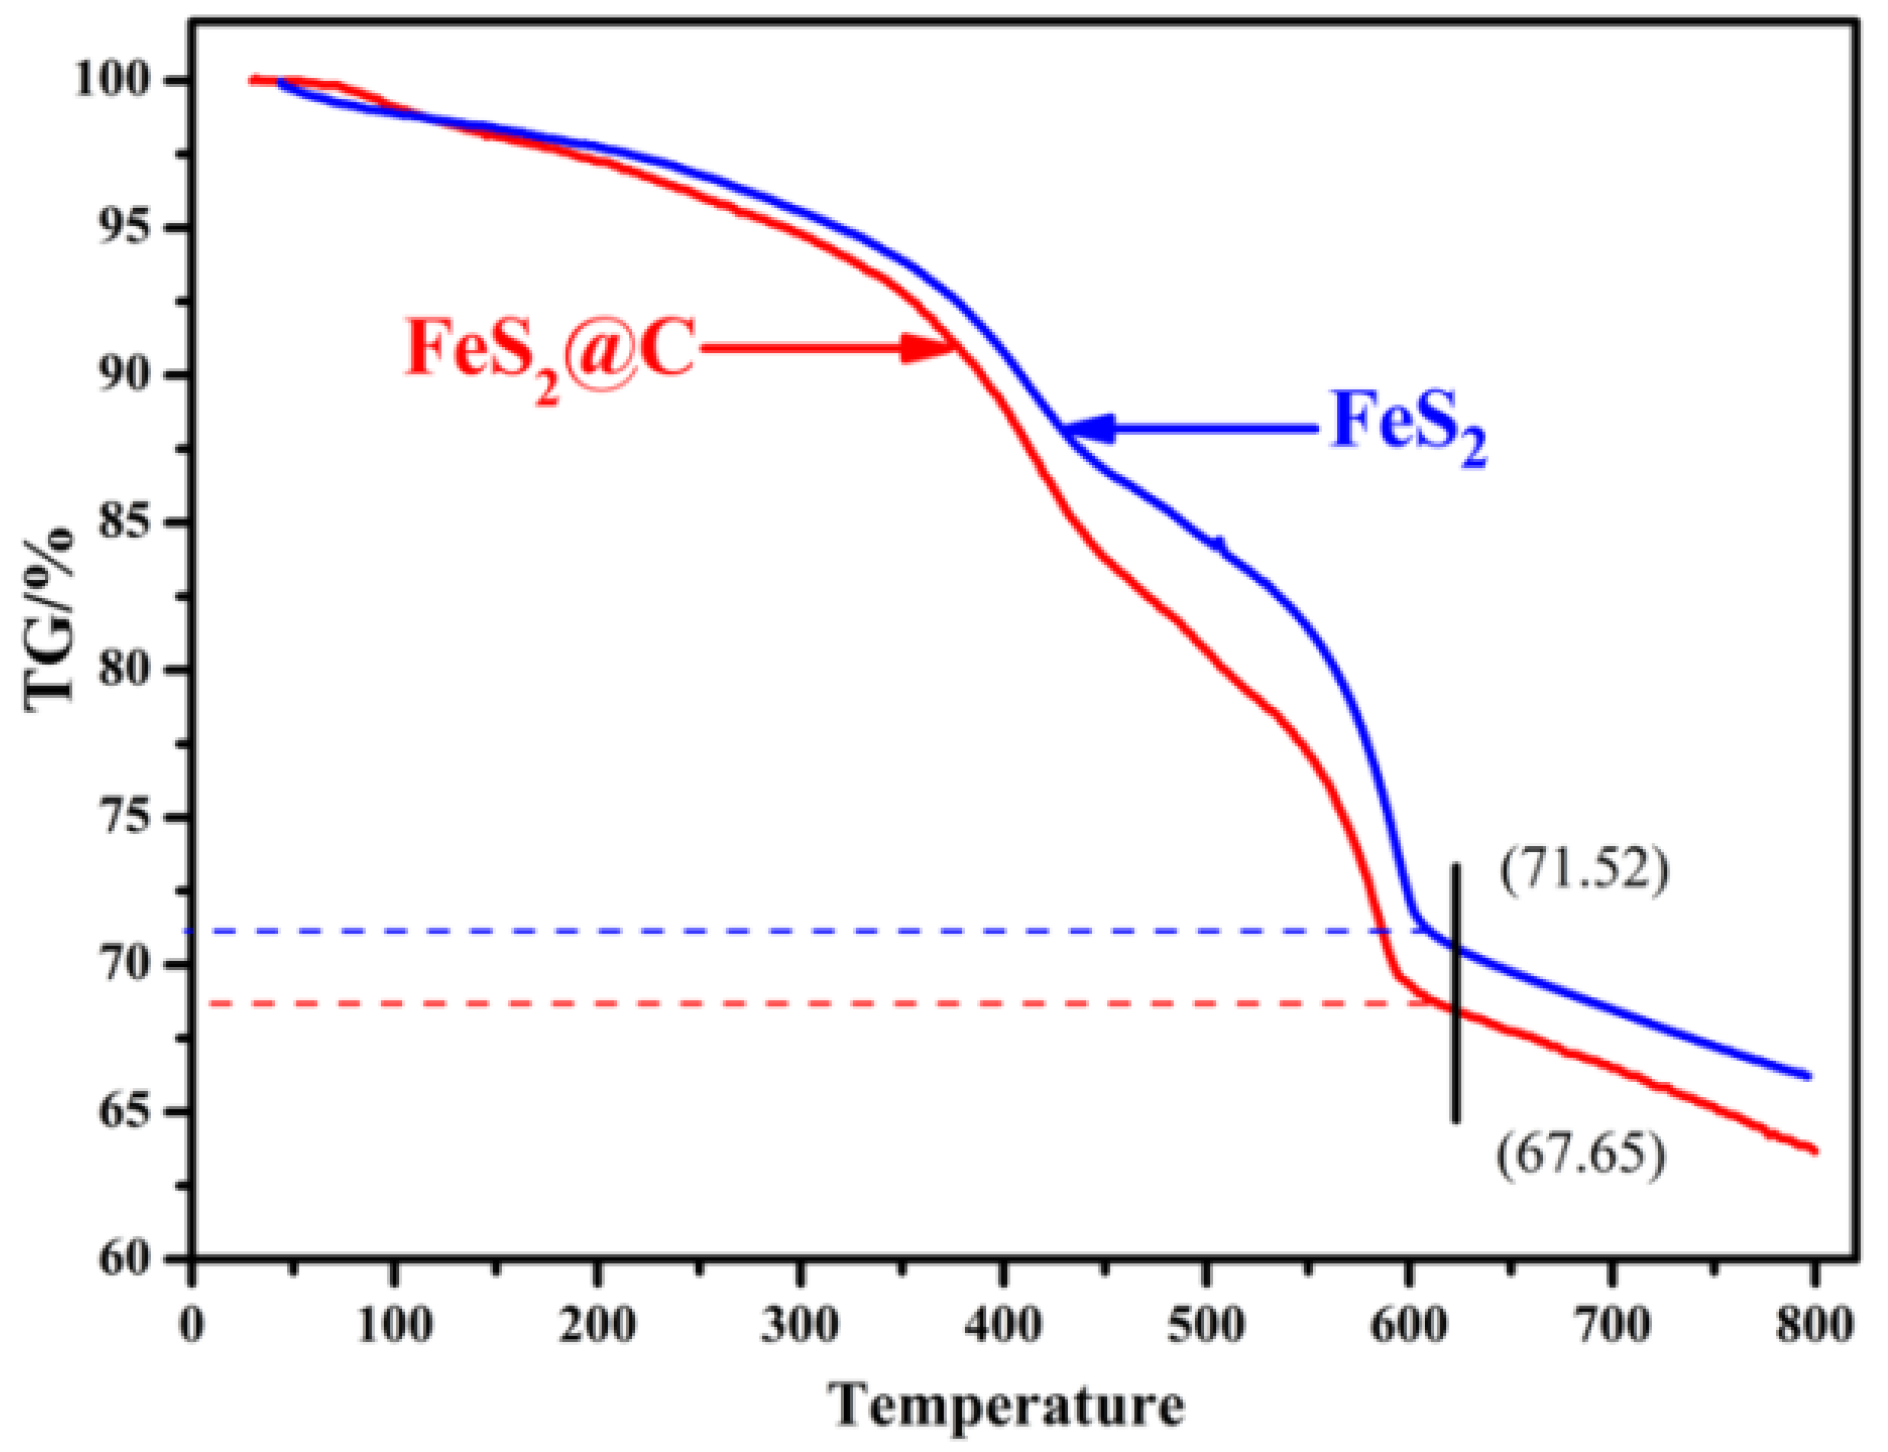
3.3. Thermogravimetric Analysis (TGA)

The carbon content of as-prepared FeS2@C composite is measured by TGA under N2 atmosphere, as shown in Figure 3. The variation tendency of the FeS2@C TGA curve is similar to that of FeS2 in the temperature below 120 °C, which is assigned to the loss of absorption moisture [6].
The weight loss of FeS2@C was more than that of FeS2 between 200 °C and 400 °C. This phenomenon was caused by incomplete carbonized organics absorbed on the surface. The organics formed during hydrothermal carbonization are decomposed in this temperature range [11]. The greater weight loss of FeS2@C from 400 °C to 600 °C is related to the decomposition of pyrite rather than carbon. The two curves become parallel to each other when the composites are heated over 600 °C, indicating that the weight loss brought by the decomposition of carbon is over, so we can calculate the carbon content at this point (marked in Figure 3), which is calculated to be 3.87% (71.52%–67.65%).

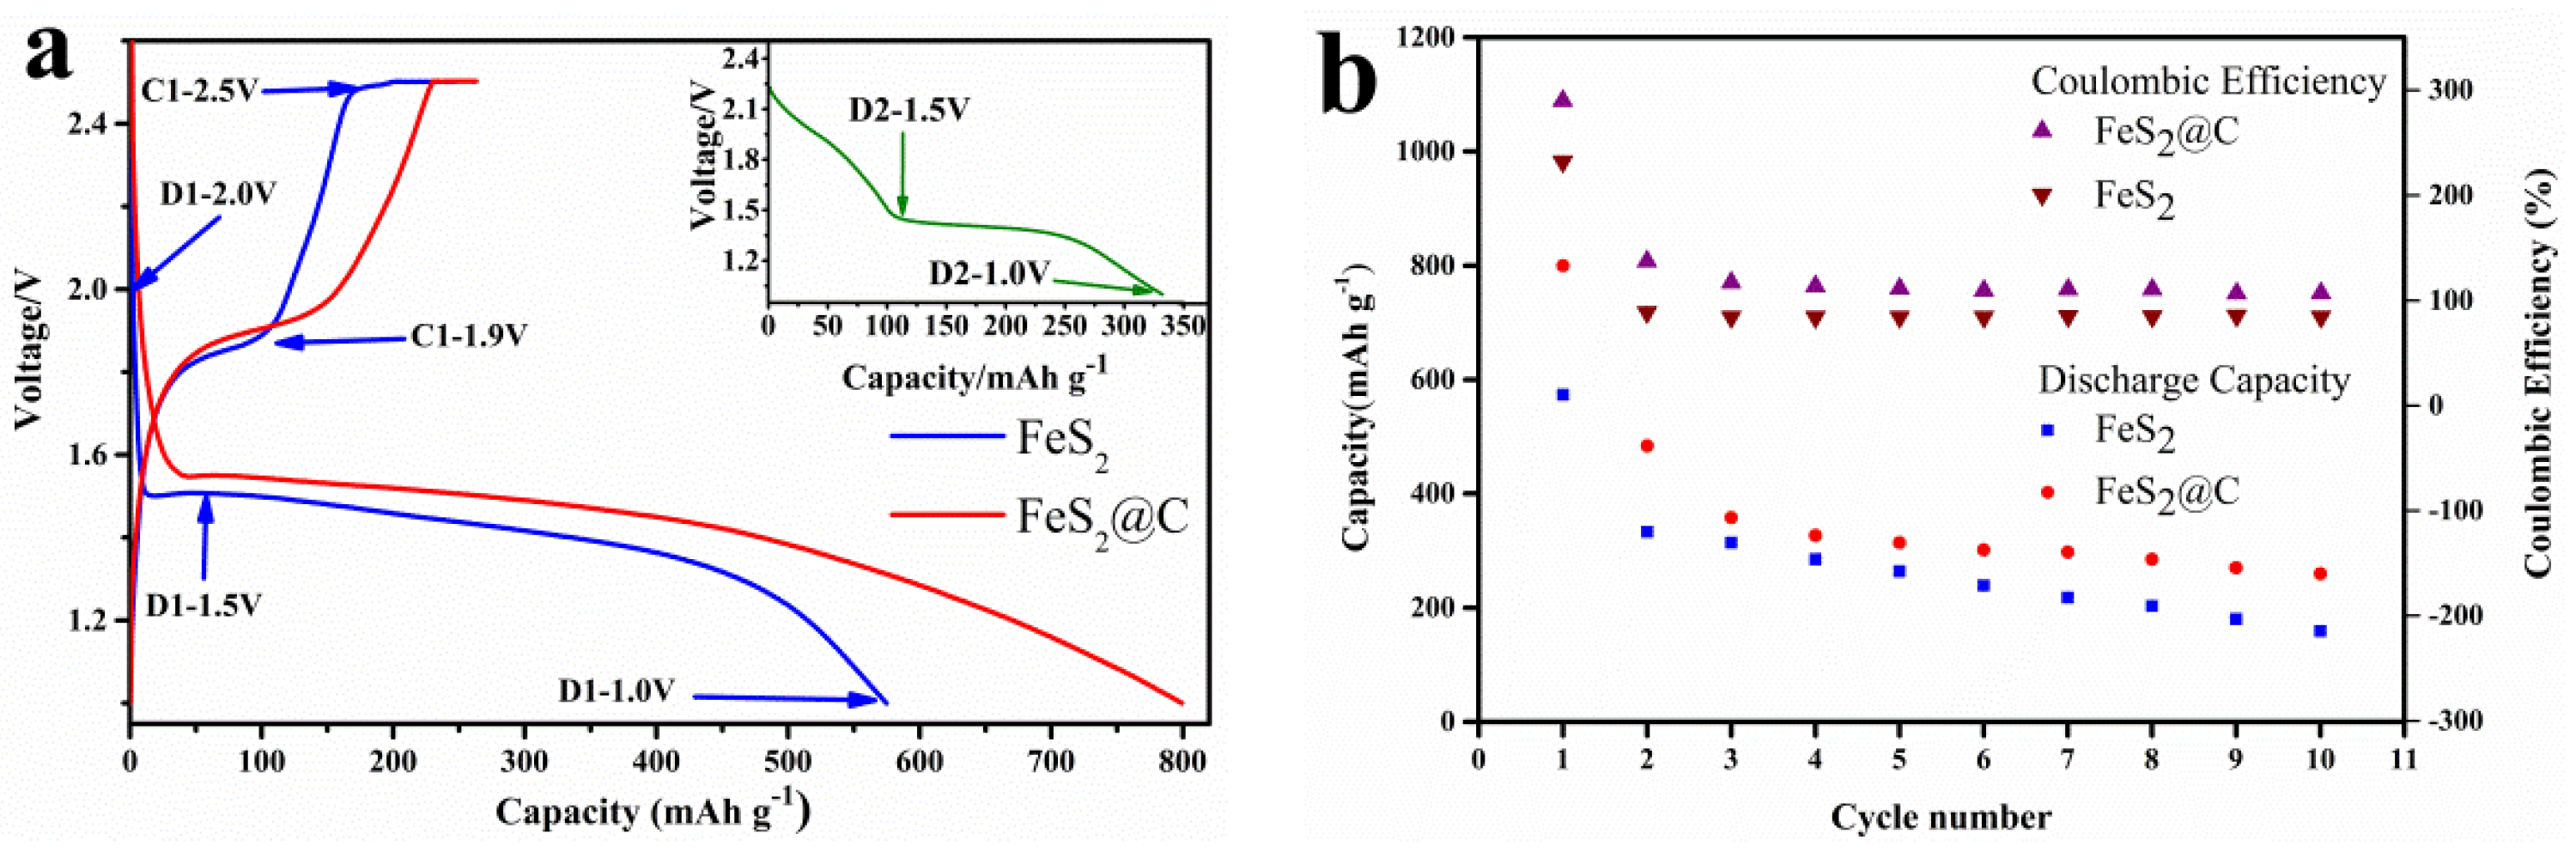
3.4. Galvanostatic Discharge and Charge Test

Figure 4 shows the charge-discharge curves of FeS2@C and FeS2 at a certain current density. The initial discharge curves of FeS2@C and FeS2 at 0.2 mA·cm−2 are shown in Figure 4a. As can be seen, the initial capacity of FeS2@C (799.2 mAh·g−1) was greater than that of FeS2 (574.6 mAh·g−1). Both of the electrodes exhibited an initial discharge plateau at approximately 1.5 V, corresponding to the transformation from FeS2 to Li2S and Fe. In addition, we investigated the cycle performance of both electrodes. As shown in Figure 4b, the capacities of both electrodes fade significantly. For FeS2@C, the initial capacity is 799.2 mAh·g−1, and the second one is 484.6 mAh·g−1. For FeS2, the initial capacity is 574.6 mAh·g−1, and the second one is 332.0 mAh·g−1. This phenomenon is resulted from the differences between initial and subsequent cycles, which will be discussed later.
From the comparison between FeS2@C and FeS2 in Figure 4b, it is easy to find that the cycling performance of FeS2@C is significantly improved. Discharge capacity of FeS2@C remains higher than that of FeS2 for the first 10 cycles. The decrease of discharge capacity of FeS2@C is also slower than that of FeS2. Serious decrease of capacity of FeS2 is mainly caused by the irreparable damage to the crystal structure after several cycles [15], while for FeS2@C, carbon could alleviate this kind of damage [16]. That’s why the cycling performance of FeS2@C is improved.

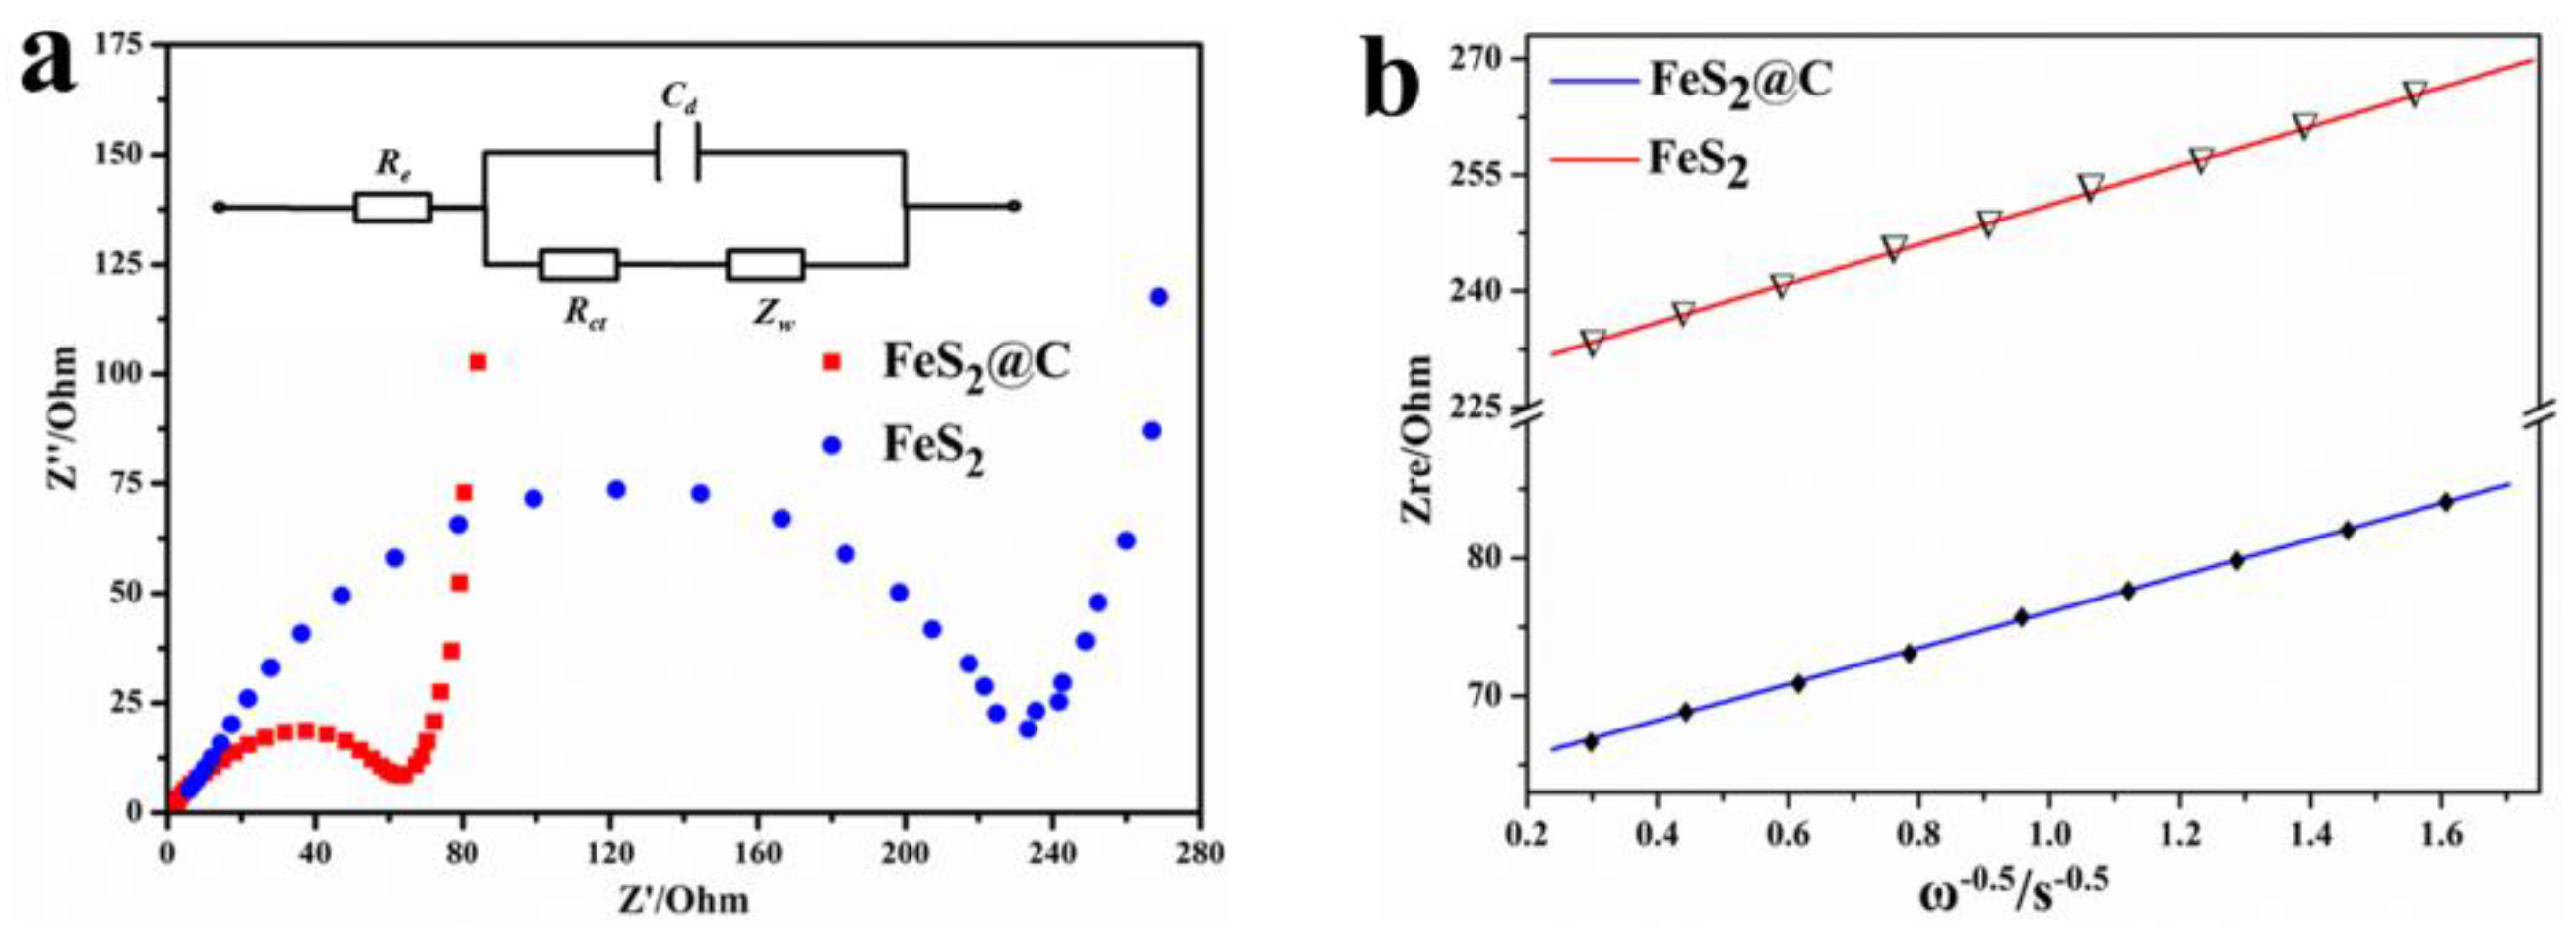
3.5. Electrochemical Impedance Spectroscopy (EIS)

EIS is used to investigate the charge transfer resistance. Figure 5a displays Nyquist plots of both electrodes. An intercept at the Z’ real axis in the high frequency region corresponded to electrolyte resistance, Re, in the equivalent circuits. The semicircle in the intermediate frequency range indicates the charge transfer resistance, Rct, which is related to both the charge transfer through and the double-layer capacitance at the electrode/electrolyte interface [17,18,19]. The shapes of the semicircles provided information pertaining to the charge-transfer resistances of the electrochemical reactions taking place.
Referring to the methods reported [20,21,22] and based on our EIS measurements, impedance parameters were calculated and listed in Table 1. The values of Rct were fitted by the equivalent circuit diagram inset in Figure 5a. Warburg coefficient σω can be obtained by Equation (1):
Z r e = R e + R c t + σ ω ω 0.5
where Re is the resistance of the electrolyte, Rct is the charge transfer resistance and ω is the angular frequency in the low frequency region. Both Re and Rct are kinetic parameters independent of frequency, so σω is the slope for the plot of Zre vs. the reciprocal root square of the lower angular frequencies (ω−0.5), as shown in Figure 5b, the slope of the fitted line is the Warburg coefficient σω.
The diffusion coefficient values of the lithium ions (D) can be obtained from Equation (2):
D = R 2 T 2 2 A 2 n 4 F 4 C 2 σ 2
where R is the gas constant (8.314 J·mol−1·K−1), T is the temperature (298.5 K), A is the area of the electrode surface (2.0106 cm2), F is the Faraday’s constant (96,500 C·mol−1) and C is the molar concentration of Li+ (1.09 mol·L−1), n is the number of electrons transferred in the electrode reactions.
The conductivity values (σ) are calculated from Equation (3):
σ = 1 R c t · t A
where t is the thickness of the cathode (250 µm). Again, the comparison between all the values calculated proves that the FeS2@C sample is more suitable for the electrochemical reactions.

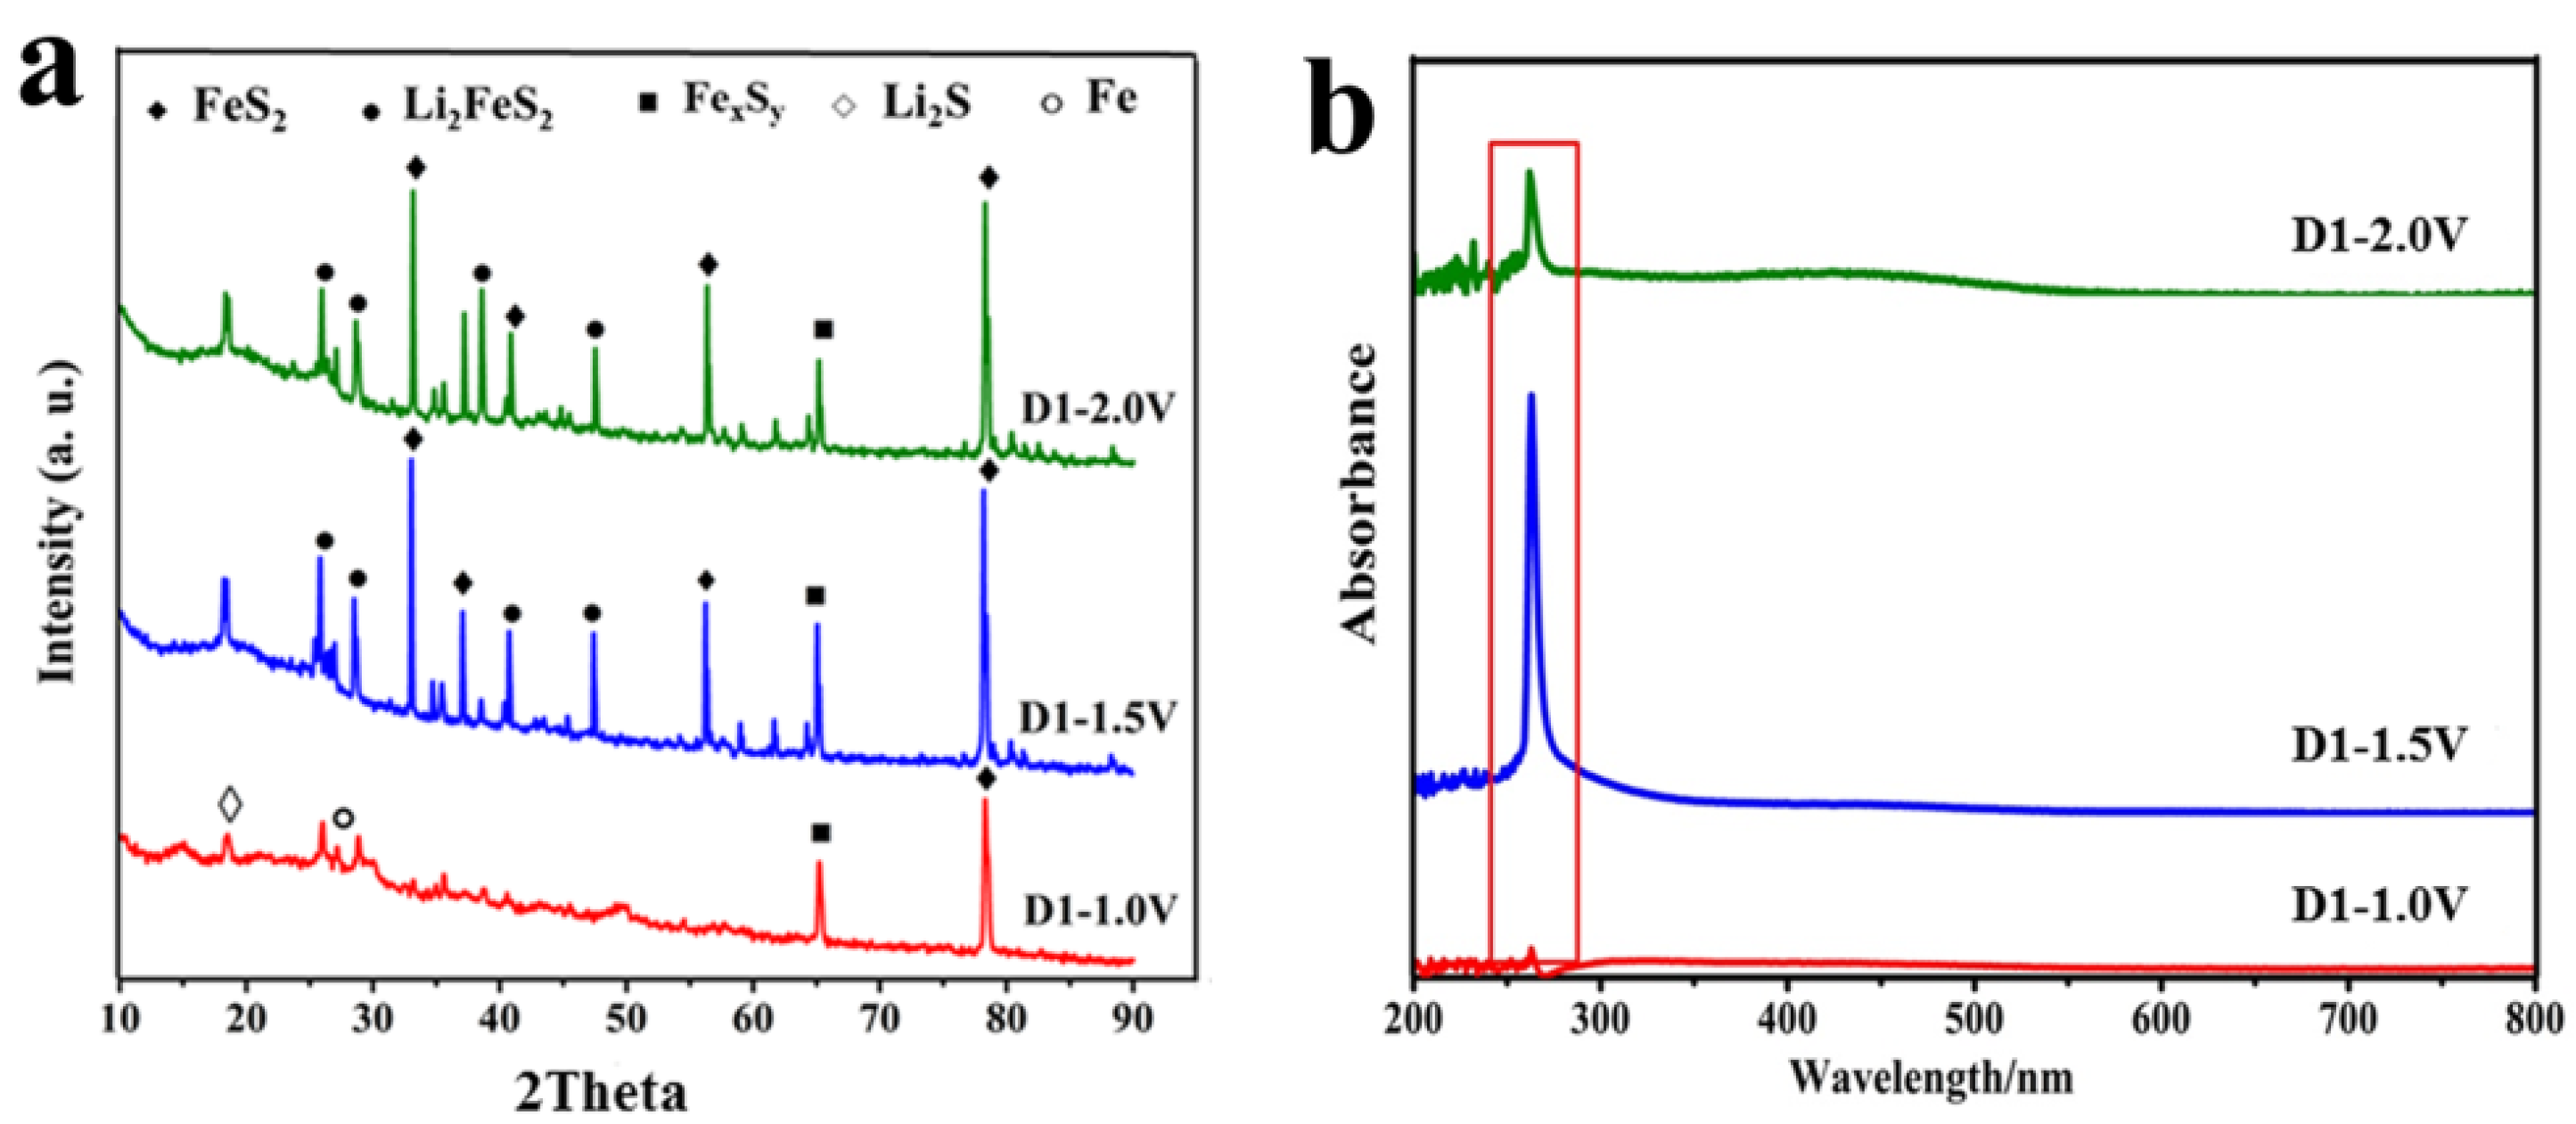
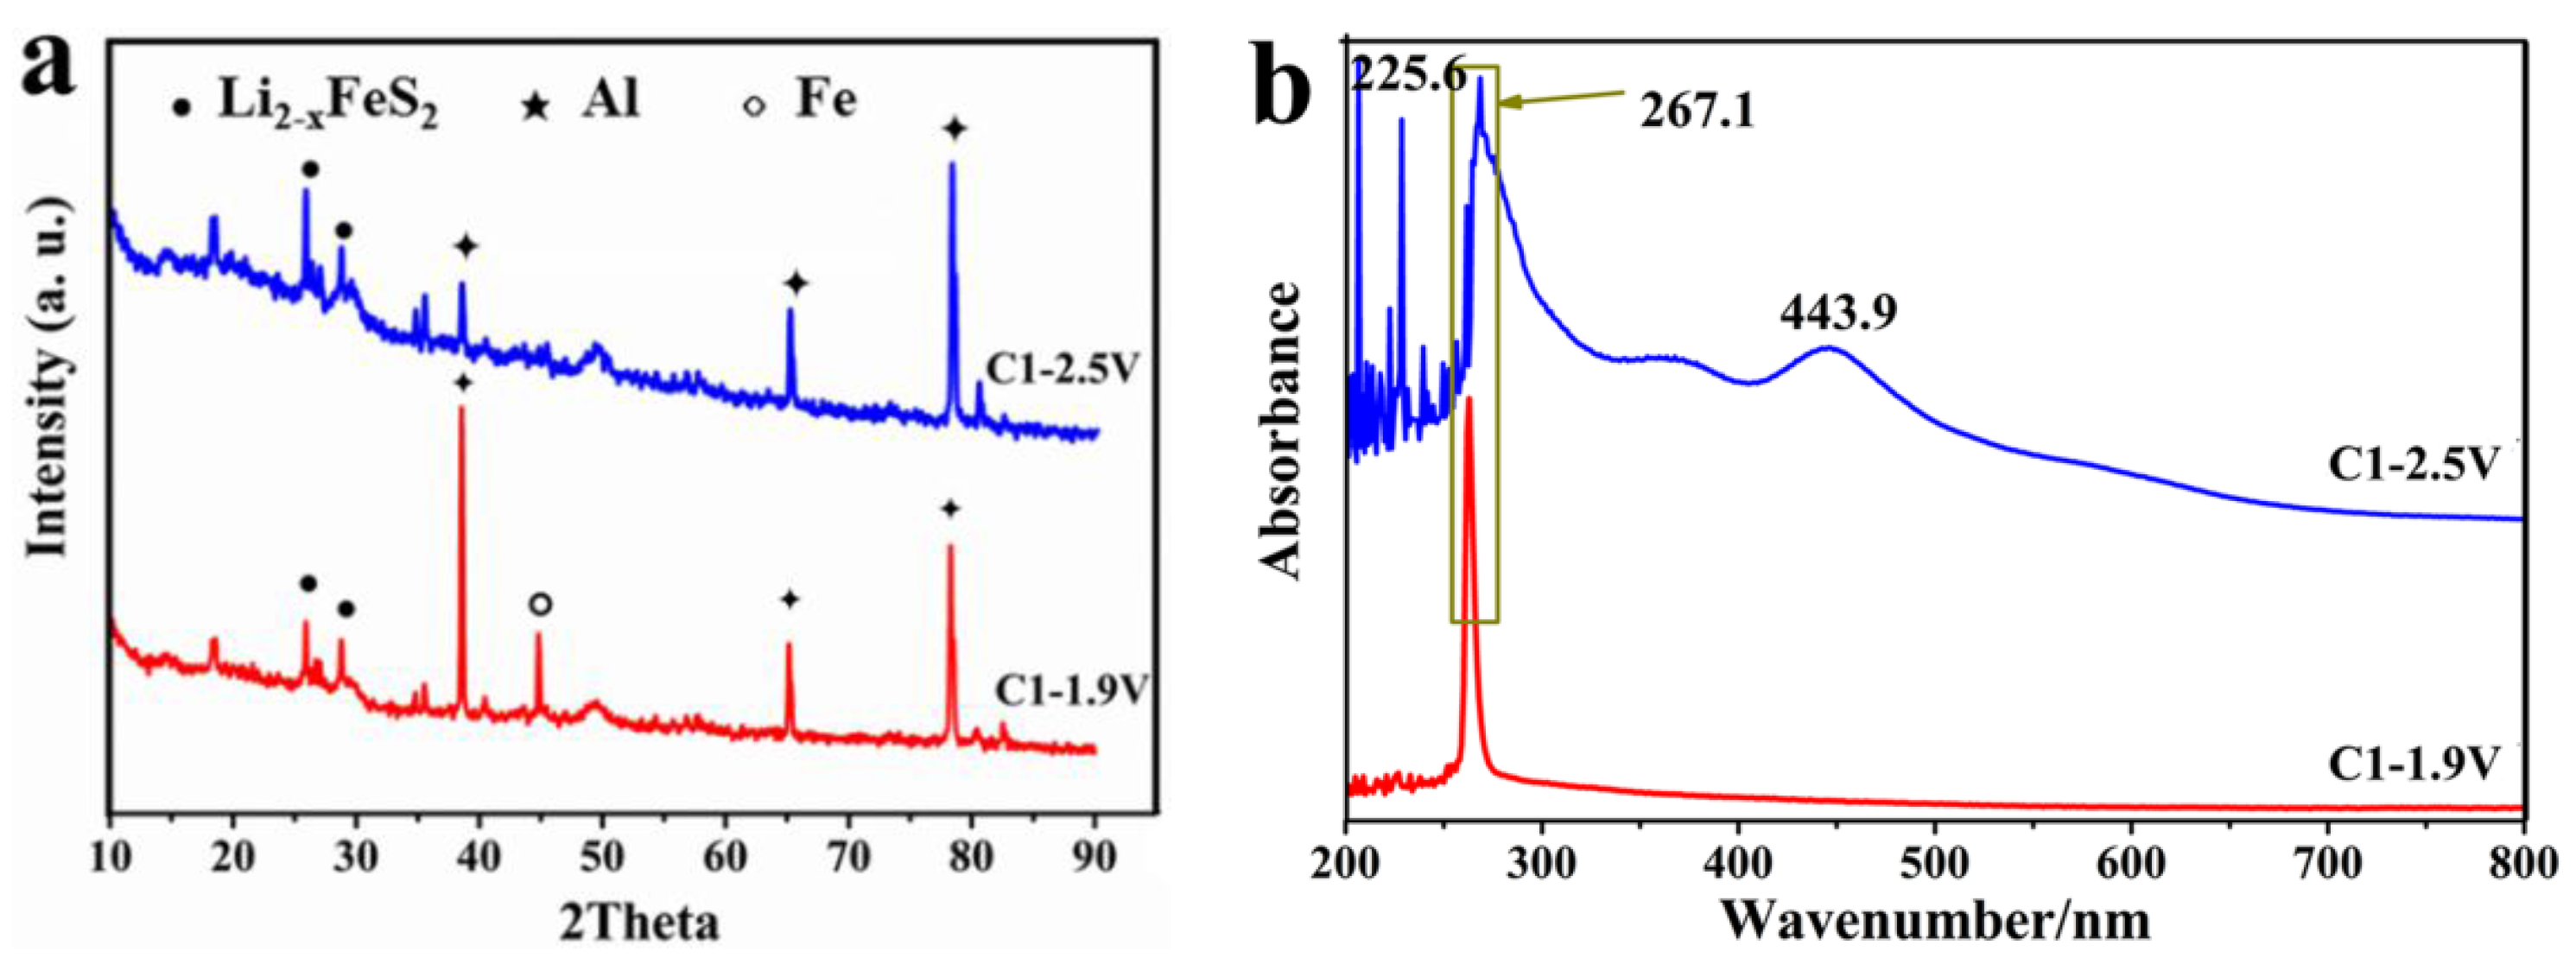
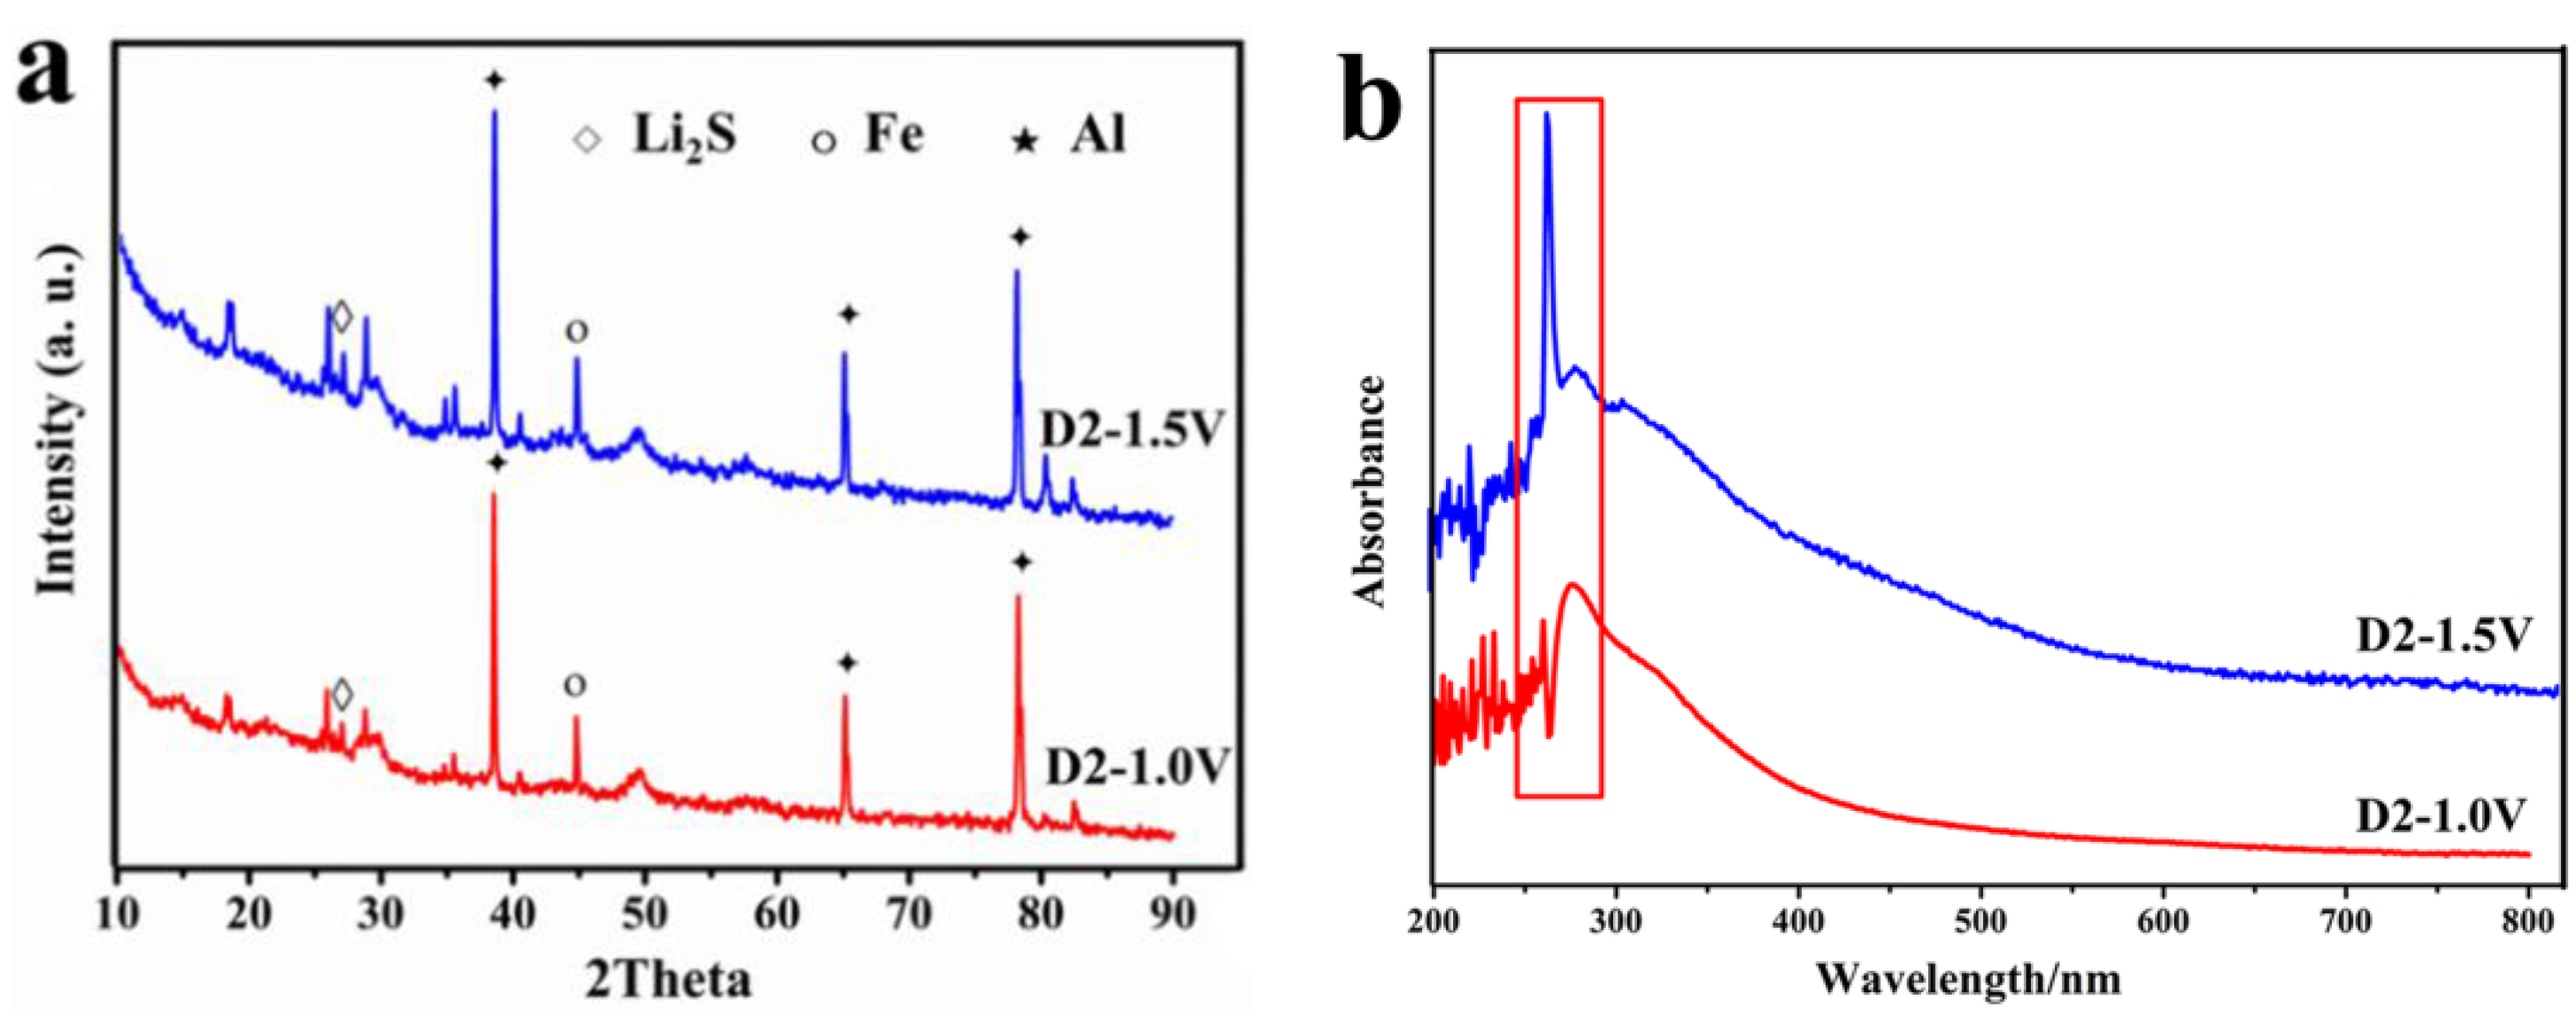
3.6. XRD and UV at Different Depths of Discharge-Charge

Figure 4b shows that the capacities of Li/FeS2 batteries fade significantly after the initial two cycles. To clarify the reasons, we discussed the electrochemical states of each node in Li/FeS2 batteries. When Li/FeS2 batteries were discharged or charged to different depths of discharge-charge (DOD), the cathode electrodes were immersed into dimethylformamide (DMF) in an argon-filled glove box before being characterized by XRD and UV visible spectroscopy.
The voltage nodes of Li/FeS2 batteries are shown in Figure 4a. These nodes are chosen by analyzing several reports [23,24,25,26]. D1-2.0 V, D1-1.5 V and D1-1.0 V are the nodes in the initial discharge, whose voltages are 2.0 V, 1.5 V and 1.0 V, respectively. C1-1.9 V and C1-2.5 V are in the initial charge, whose voltages are 1.9 V and 2.5 V, respectively. D2-1.5 V and D2-1.0 V (the inset in Figure 4a) are in the second discharge, whose voltages are 1.5 V and 1.0 V, respectively.
As shown in Figure 6a, the major intermediates are Li2FeS2 in the D1-2.0 V, and it also contained other substances, including FexSy [27]. These substances are made up of sulfur resulted from inactive matter on the surface.
Diffraction peaks of FeS2 are also observed, indicating that there is unreached FeS2 for Li+ in the central of particles. The dissolved substance with the node D1-2.0 V is displayed in Figure 6b. There are dissolved substances (264.1 nm) in the DMF, and it is short-chain sulfur formed in this period [28]. Therefore, we deduced the reaction Equation (4):
F e S 2 + 2 L i = L i 2 F e S 2
D1-1.5 V shows similar diffraction peaks as D1-2.0 V, as shown in Figure 6a. The peak of short-chain sulfur is displayed (D1-1.5 V) in Figure 6b. Therefore, we can conclude that there is no structural transformation of the FeS2 electrode.
There are some diffraction peaks for Fe and Li2S in D1-1.0 V, which provide evidence that elemental Fe formed the crystal structure. However, there are no peaks in Figure 6b because there is dissolved substance (D1-1.0 V) in the DMF. Therefore, it produces the reaction in Equation (5):
L i 2 F e S 2 + 2 L i = F e + 2 L i 2 S
There are only diffraction peaks of Al, Fe and Li2-xFeS2 in C1-1.9 V (Figure 7a). The peaks marked with Al can be assigned to aluminum foil. At the voltage of 1.9 V, the peak of elemental Fe appears. This is caused by residual Fe. Li2-xFeS2 is formed in this period. Li2S becomes amorphous in this period, making it hard to observe the peak of Li2S. C1-1.9 V in Figure 7b shows short-chain sulfur absorption peaks similar to D1-1.5 V in Figure 6b. We deduce that some substances are altered to the amorphous form during this period.
The diffraction peaks of Al and Li2-xFeS2 appears at C1-2.5 V in Figure 7a, which indicates that Li2-xFeS2 is produced in subsequent cycles rather than FeS2. This is in accordance with Ardel’s report [29]. There are some absorption peaks between 200 and 300 nm−1 at C1-2.5 V in Figure 7b, which are brought about by small sulfur molecules produced by side reactions during the charging and others in DMF [28]. The peak at 443.9 nm is attributed to the C=O bond formed by the oxidation of organics present in the electrolyte, such as ethylene carbonate.
In Figure 8a, the diffraction peaks of Al, Fe and Li2S appears in the D2-1.5 V curve. This phenomenon indicates that Fe and Li2S are formed at a voltage of 1.5 V during subsequent discharge. D2-2.5 V in Figure 8b shows absorption peaks between 200 and 300 nm−1 due to the existence of small sulfur molecules.
The XRD pattern for D2-1.0 V is similar to that of D2-1.5 V in Figure 8a. It contains small sulfur molecules as indicated by peaks in the similar range of absorption wavelength with D2-1.5 V in Figure 8b. There is no change in DMF between 1.5 V and 1.0 V. In this period, the reaction followed Equation (6):
L i 2 x F e S 2 F e + L i 2 S

4. Conclusions

In summary, we have successfully obtained the cathode material FeS2@C for Li/FeS2 batteries. The reported synthesis method was simple and controllable, requiring low energy expenditure. FeS2 particles were coated with glucose by hydrothermal carbonization. The plate-like carbon formed a conductive bridge among individual FeS2 particles. This special structure enhanced the conductivity. The FeS2@C electrode exhibited better electrochemical performance, including an initial capacity as high as 799.2 mAh·g−1, superior to that of uncoated FeS2. EIS tests and the parameters calculated indicated that the FeS2@C composite was more suitable for the electrode reactions. Most importantly, we discussed the possible electrochemical mechanism for Li/FeS2 batteries with XRD and UV visible spectroscopy.

Acknowledgments

This work was supported by the National Natural Science Foundation of China (21173198) and the Natural Science Foundation of Hubei Province, China (2014CFA097).

Author Contributions

Shengping Wang performed the data analyses and wrote the manuscript and contributed significantly to analysis and manuscript preparation; Jingxian Yu helped perform the analysis with constructive discussions.

Conflicts of Interest

The authors declare no conflict of interest.

References

  1. Zhao, H.G.; Wang, S.P.; Fan, L.R.; Wu, J.P. The modification of natural pyrite and its electrochemical properties in Li/FeS2 batteries. Funct. Mater. Lett. 2014, 7. [Google Scholar] [CrossRef]
  2. Liu, Y.; Dang, Z.; Wu, P.; Lu, J.; Shu, X.; Zheng, L. Influence of ferric iron on the electrochemical behavior of pyrite. Ionics 2011, 17, 169–176. [Google Scholar] [CrossRef]
  3. Zhong-Zhi, Y.; Ling, L. Synthesis and Electrochemical Characteristics of the Novel FeS2/VGCF Material for Lithium-Ion Batteries. J. Inorg. Mater. 2013, 28, 1291–1295. [Google Scholar]
  4. Vu, A.; Stein, A. Lithium iron phosphate spheres as cathode materials for high power lithium ion batteries. J. Power Sources 2014, 245, 48–58. [Google Scholar] [CrossRef]
  5. da F.L. Amorim, B.; Moura, F.; Brocchi, E.; Vieira, M.; da C. Rupp, M. Synthesis and Characterization of Iron Disulfide for Cathodic Material. Metall. Mater. Trans. B 2012, 43, 781–786. [Google Scholar] [CrossRef]
  6. Zhang, D.; Mai, Y.J.; Xiang, J.Y.; Xia, X.H.; Qiao, Y.Q.; Tu, J.P. FeS2/C composite as an anode for lithium ion batteries with enhanced reversible capacity. J. Power Sources 2012, 217, 229–235. [Google Scholar] [CrossRef]
  7. Zhang, D.; Tu, J.P.; Mai, Y.J.; Zhang, J.; Qiao, Y.Q.; Wang, X.L. Preparation and characterization of FeS2/polyaniline composite electrode in lithium-ion battery. J. Aust. Ceram. Soc. 2012, 48, 189–193. [Google Scholar]
  8. Choi, Y.J.; Kang, W.G.; Ryu, H.S.; Nam, T.H.; Ahn, H.J.; Cho, K.K.; Kim, K.W.; Ryu, K.S. Effect of Fe addition on cycle performance of FeS2 cathode for Li/FeS2 battery. Mater. Technol. 2012, 27, 124–126. [Google Scholar] [CrossRef]
  9. Huijun, Z.; Yongzhen, Y.; Xuguang, L.; Bingshe, X. Preparation of surface molecularly imprinted matrix materials porous carbon microspheres from glucose by hydrothermal carbonization method. China Sci. Pap. 2013, 7, 898–903. [Google Scholar]
  10. Lu, X.; Pellechia, P.J.; Flora, J.R.V.; Berge, N.D. Influence of reaction time and temperature on product formation and characteristics associated with the hydrothermal carbonization of cellulose. Bioresour. Technol. 2013, 138, 180–190. [Google Scholar] [CrossRef] [PubMed]
  11. Jiang, W.; Zhang, X.; Sun, Z.; Fang, Y.; Li, F.; Chen, K.; Huang, C. Preparation and mechanism of magnetic carbonaceous polysaccharide microspheres by low-temperature hydrothermal method. J. Magn. Magn. Mater. 2011, 323, 2741–2747. [Google Scholar] [CrossRef]
  12. He, X.; Li, H.; Liu, Y.; Huang, H.; Kang, Z.; Lee, S.-T. Water soluble carbon nanoparticles: Hydrothermal synthesis and excellent photoluminescence properties. Colloid Surf. B 2011, 87, 326–332. [Google Scholar] [CrossRef] [PubMed]
  13. Sun, X.; Li, Y. Colloidal Carbon Spheres and Their Core/Shell Structures with Noble-Metal Nanoparticles. Angew. Chem. Int. Ed. Engl. 2004, 43, 597–601. [Google Scholar] [CrossRef] [PubMed]
  14. Nomura, K.; Miyamoto, M. Hydrothermal experiments on alteration of Ca-Al-rich inclusions (CAIs) in carbonaceous chondrites: Implication for aqueous alteration in parent asteroids. Geochim. Cosmochim. Acta 1998, 62, 3575–3588. [Google Scholar] [CrossRef]
  15. Shembel, E.M.; Polischuk, Y.V.; Chervakov, O.V.; Reisner, D. Reactivity of natural and synthesized FeS2 relative to the components of polymer electrolytes. Ionics 2006, 12, 41–46. [Google Scholar] [CrossRef]
  16. Li, H.; Zhou, H. Enhancing the performances of Li-ion batteries by carbon-coating: present and future. Chem. Commun. 2012, 48, 1201–1217. [Google Scholar] [CrossRef] [PubMed]
  17. Moya, A.A. Electrochemical impedance of ion-exchange systems with weakly charged membranes. Ionics 2013, 19, 1271–1283. [Google Scholar] [CrossRef]
  18. Schmidt, J.P.; Chrobak, T.; Ender, M.; Illig, J.; Klotz, D.; Ivers-Tiffée, E. Studies on LiFePO4 as cathode material using impedance spectroscopy. J. Power Sources 2011, 196, 5342–5348. [Google Scholar] [CrossRef]
  19. Andre, D.; Meiler, M.; Steiner, K.; Walz, H.; Soczka-Guth, T.; Sauer, D.U. Characterization of high-power lithium-ion batteries by electrochemical impedance spectroscopy. II: Modelling. J. Power Sources 2011, 196, 5349–5356. [Google Scholar] [CrossRef]
  20. Cui, Y.; Zhao, X.; Guo, R. Improved electrochemical performance of La0.7Sr0.3MnO3 and carbon co-coated LiFePO4 synthesized by freeze-drying process. Electrochimica Acta 2010, 55, 922–926. [Google Scholar] [CrossRef]
  21. Qu, T.; Tian, Y.-W.; Zhai, Y.-C. Measurement of diffusion coefficient of lithium in LiFePO4 cathode material for Li-ion battery by PITT and EIS. Chin. J. Nonferrous Met. 2007, 17, 1255–1295. [Google Scholar]
  22. Reddy, C.V.S.; Chen, M.; Jin, W.; Zhu, Q.; Chen, W.; Mho, S.-I. Characterization of (PVDF+LiFePO4) solid polymer electrolyte. J. Appl. Electrochem. 2007, 37, 637–642. [Google Scholar] [CrossRef]
  23. Takeuchi, T.; Kageyama, H.; Nakanishi, K.; Inada, Y.; Katayama, M.; Ohta, T.; Senoh, H.; Sakaebe, H.; Sakai, T.; Tatsumi, K.; et al. Improvement of Cycle Capability of FeS2 Positive Electrode by Forming Composites with Li2S for Ambient Temperature Lithium Batteries. J. Electrochem. Soc. 2012, 159, A75–A84. [Google Scholar] [CrossRef]
  24. Iwakura, C.; Isobe, N.; Tamura, H. Preparation of iron disulfide and its use for lithium batteries. Electrochimica Acta 1983, 28, 269–275. [Google Scholar] [CrossRef]
  25. Brec, R.; Prouzet, E.; Ouvrard, G. Redox processes in the LixFeS2/Li electrochemical system studied through crystal, Mössbauer, and EXAFS analyses. J. Power Sources 1989, 26, 325–332. [Google Scholar] [CrossRef]
  26. Fong, R.; Dahn, J.R.; Jones, C.H.W. Electrochemistry of pyrite-based cathodes for ambient-ambient lithium batteries. J. Electrochem. Soc. 1989, 136, 3206–3210. [Google Scholar] [CrossRef]
  27. Fong, R.; Jones, C.H.W.; Dahn, J.R. A study of pyrite-based cathodes for ambient temperature lithium batteries by in situ 57Fe Mossbauer spectroscopy. J. Power Sources 1989, 136, 333–339. [Google Scholar] [CrossRef]
  28. Zu, C.; Fu, Y.; Manthiram, A. Highly reversible Li/dissolved polysulfide batteries with binder-free carbon nanofiber electrodes. J. Mater. Chem. A 2013, 1, 10362–10367. [Google Scholar] [CrossRef]
  29. Ardel, G.; Golodnitsky, D.; Freedman, K.; Peled, E.; Appetecchi, G.B.; Romagnoli, P.; Scrosati, B. Rechargeable lithium/hybrid-electrolyte/pyrite battery. J. Power Sources 2002, 110, 152–162. [Google Scholar] [CrossRef]
Figure 1. X-ray diffraction (XRD) patterns of FeS2@C and FeS2.
Energies 09 00225 g001
Figure 2. Morphologies of the samples. (a) SEM images of FeS2; (b) SEM images of FeS2@C; (c) TEM of FeS2@C.
Energies 09 00225 g002
Figure 3. The thermogravimetric (TG) curves of FeS2@C and FeS2.
Energies 09 00225 g003
Figure 4. Charge-discharge diagrams (a) and cycle performances (b) of both samples. The inset in Figure 4a is the second discharge for the FeS2 electrode.
Energies 09 00225 g004
Figure 5. Electrochemical impedance spectroscopy (EIS) (a) and plots for Zre vs. ω−1/2 (b) of the FeS2@C and FeS2 electrodes.
Energies 09 00225 g005
Figure 6. The X-ray diffraction (XRD) (a) and ultraviolet (UV) visible spectroscopy (b) curves of the initial discharge.
Energies 09 00225 g006
Figure 7. The X-ray diffraction (XRD) (a) and ultraviolet (UV) visible spectroscopy (b) curves of the initial charge.
Energies 09 00225 g007
Figure 8. The X-ray diffraction (XRD) (a) and ultraviolet (UV) visible spectroscopy (b) curves of the second discharge.
Energies 09 00225 g008
Table 1. Impedance parameters of samples.
SampleRct (Ω)σω (Ω·cm2·s−0.5)D (cm2·s−1)σ (S·cm−1)
FeS2@C65.4913.1313.47 × 10−113.45 × 10⁻⁵
FeS223425.3167.115 × 10−139.66 × 10⁻⁶

