Article

Performance Evaluation of Radiator and Radiant Floor Heating Systems for an Office Room Connected to a Ground-Coupled Heat Pump

Department of Building Services Engineering, Polytechnic University Timisoara, Piata Victoriei, No. 2A, 300006 Timisoara, Romania
*
Author to whom correspondence should be addressed.
Energies 2016, 9(4), 228; https://doi.org/10.3390/en9040228
Submission received: 14 January 2016 / Revised: 10 March 2016 / Accepted: 15 March 2016 / Published: 23 March 2016

Abstract

:
A ground-coupled heat pump (GCHP) system used to provide the space heating for an office room is a renewable, high performance technology. This paper discusses vapour compression-based HP systems, briefly describing the thermodynamic cycle calculations, as well as the coefficient of performance (COP) and CO2 emissions of a HP with an electro-compressor and compares different heating systems in terms of energy consumption, thermal comfort and environmental impact. It is focused on an experimental study performed to test the energy efficiency of the radiator or radiant floor heating system for an office room connected to a GCHP. The main performance parameters (COP and CO2 emissions) are obtained for one month of operation of the GCHP system, and a comparative analysis of these parameters is presented. Additionally, two numerical simulation models of useful thermal energy and the system COP in heating mode are developed using the Transient Systems Simulation (TRNSYS) software. Finally, the simulations obtained from TRNSYS software are analysed and compared to the experimental data, showing good agreement and thus validating the simulation models.

1. Introduction

Buildings are indisputably considered as one of the largest energy consuming sectors. According to the International Energy Agency (IEA), the average energy consumed by buildings represents 32% of worldwide energy consumption. European Union (EU) energy consumption patterns reveal that buildings are the greatest energy consumer, using approximately 40% of the total energy demand, followed by industry and transportation, which consume approximately 30% each [1]. Buildings offer the greatest and most cost-effective potential for energy savings. Studies have also shown that saving energy is the most cost-effective method for reducing greenhouse gas (GHG) emissions.
Some actions are being performed to reduce energy consumption and to protect the environment (e.g., the use of renewable energies for new or retroffited buildings and passive energy buildings). EU member states must stimulate the transformation of existing buildings undergoing renovation into nearly zero-energy buildings (nZEBs). Conversion of heating and cooling systems based to ground-source heat pumps and air-to-water heat pumps (HPs) is a well-proven measure to approach nZEB requirements.
To realise the ambitious goals for reducing the consumption of fossil fuel as primary energy and the related carbon dioxide (CO2) emissions, and to reach the targets of the Kyoto Protocol, improved energy efficiency and the use of renewable energy in the existing building stock must be addressed in the near future [2].
The Renewable Energy Directive 2009/28/EC of the European Parliament recognised aerothermal, geothermal and hydrothermal energy as renewable energy sources (RES) for the first time. This directive opens up a major opportunity for further use of HPs for heating and cooling of new and existing buildings [3].
Ground-coupled heat pump (GCHP) systems are a type of renewable energy technology which has been increasingly used in the past decade across Europe to provide air-conditioning and domestic hot water (DHW) for buildings [4,5]. These systems can achieve higher energy efficiency compared to air-source HP systems because the soil can provide a higher temperature for heating and lower temperature for cooling than air [6]. A number of GCHP systems have been used in residential and commercial buildings worldwide because of their noticeable high efficiency and environmental friendliness [6,7,8]. The use of GCHPs in the achievement of adequate temperatures has been studied by several researchers [9,10,11].
Most existing studies on GCHP systems concentrate on theoretical and simulation model research [12,13,14,15,16] or in situ monitoring of the heat transfer in borehole heat exchanger (BHE) [17,18,19]. Only a few researchers have investigated the experimental operation performance of GCHP systems. Pulat et al. [20] evaluated the performance of a GCHP with a horizontal ground heat exchanger (GHE) installed in Turkey under winter climatic conditions. Yang et al. [21] reported the heat transfer of a two-region vertical U-tube GHE after an experiment performed in a solar geothermal multifunctional HP experimental system. Lee et al. [22] conducted experiments on the thermal performance of a GCHP integrated into a building foundation in summer. Man et al. [23] performed an in situ operation performance test of a GCHP system for cooling and heating provision in a temperate zone. The experimental results indicate that the performance of the GCHP system is affected by its intermittent or continuous operation modes. Petit and Meyer [24] compared the thermal performance of a GCHP with an air-source air conditioner, finding that a horizontal or vertical GCHP was more favourable in terms of economic feasibility. Esen and Inalli [25] proposed using the in situ thermal response test to determine the thermal property of the ground for the GCHP applications in Turkey.
Currently, heating is responsible for almost 80% of the energy demand in houses and utility buildings, used for the purpose of space heating and DHW generation.
The widespread distribution of HPs as single generators in heating systems has mainly been in new, rather isolated buildings that have limited unit loads. This has enabled the use of low-temperature terminal units, such as fan coil units and, in particular, radiant systems [26]. After the introduction of plastic piping, the application of water-based radiant heating and cooling with pipes embedded in room surfaces (i.e., floors, walls and ceilings), has significantly increased worldwide. However, to extend the use of these types of heat generators and to benefit from their energy efficiency, working with radiators, which were the most commonly used terminal units in heating systems in the past, is necessary.
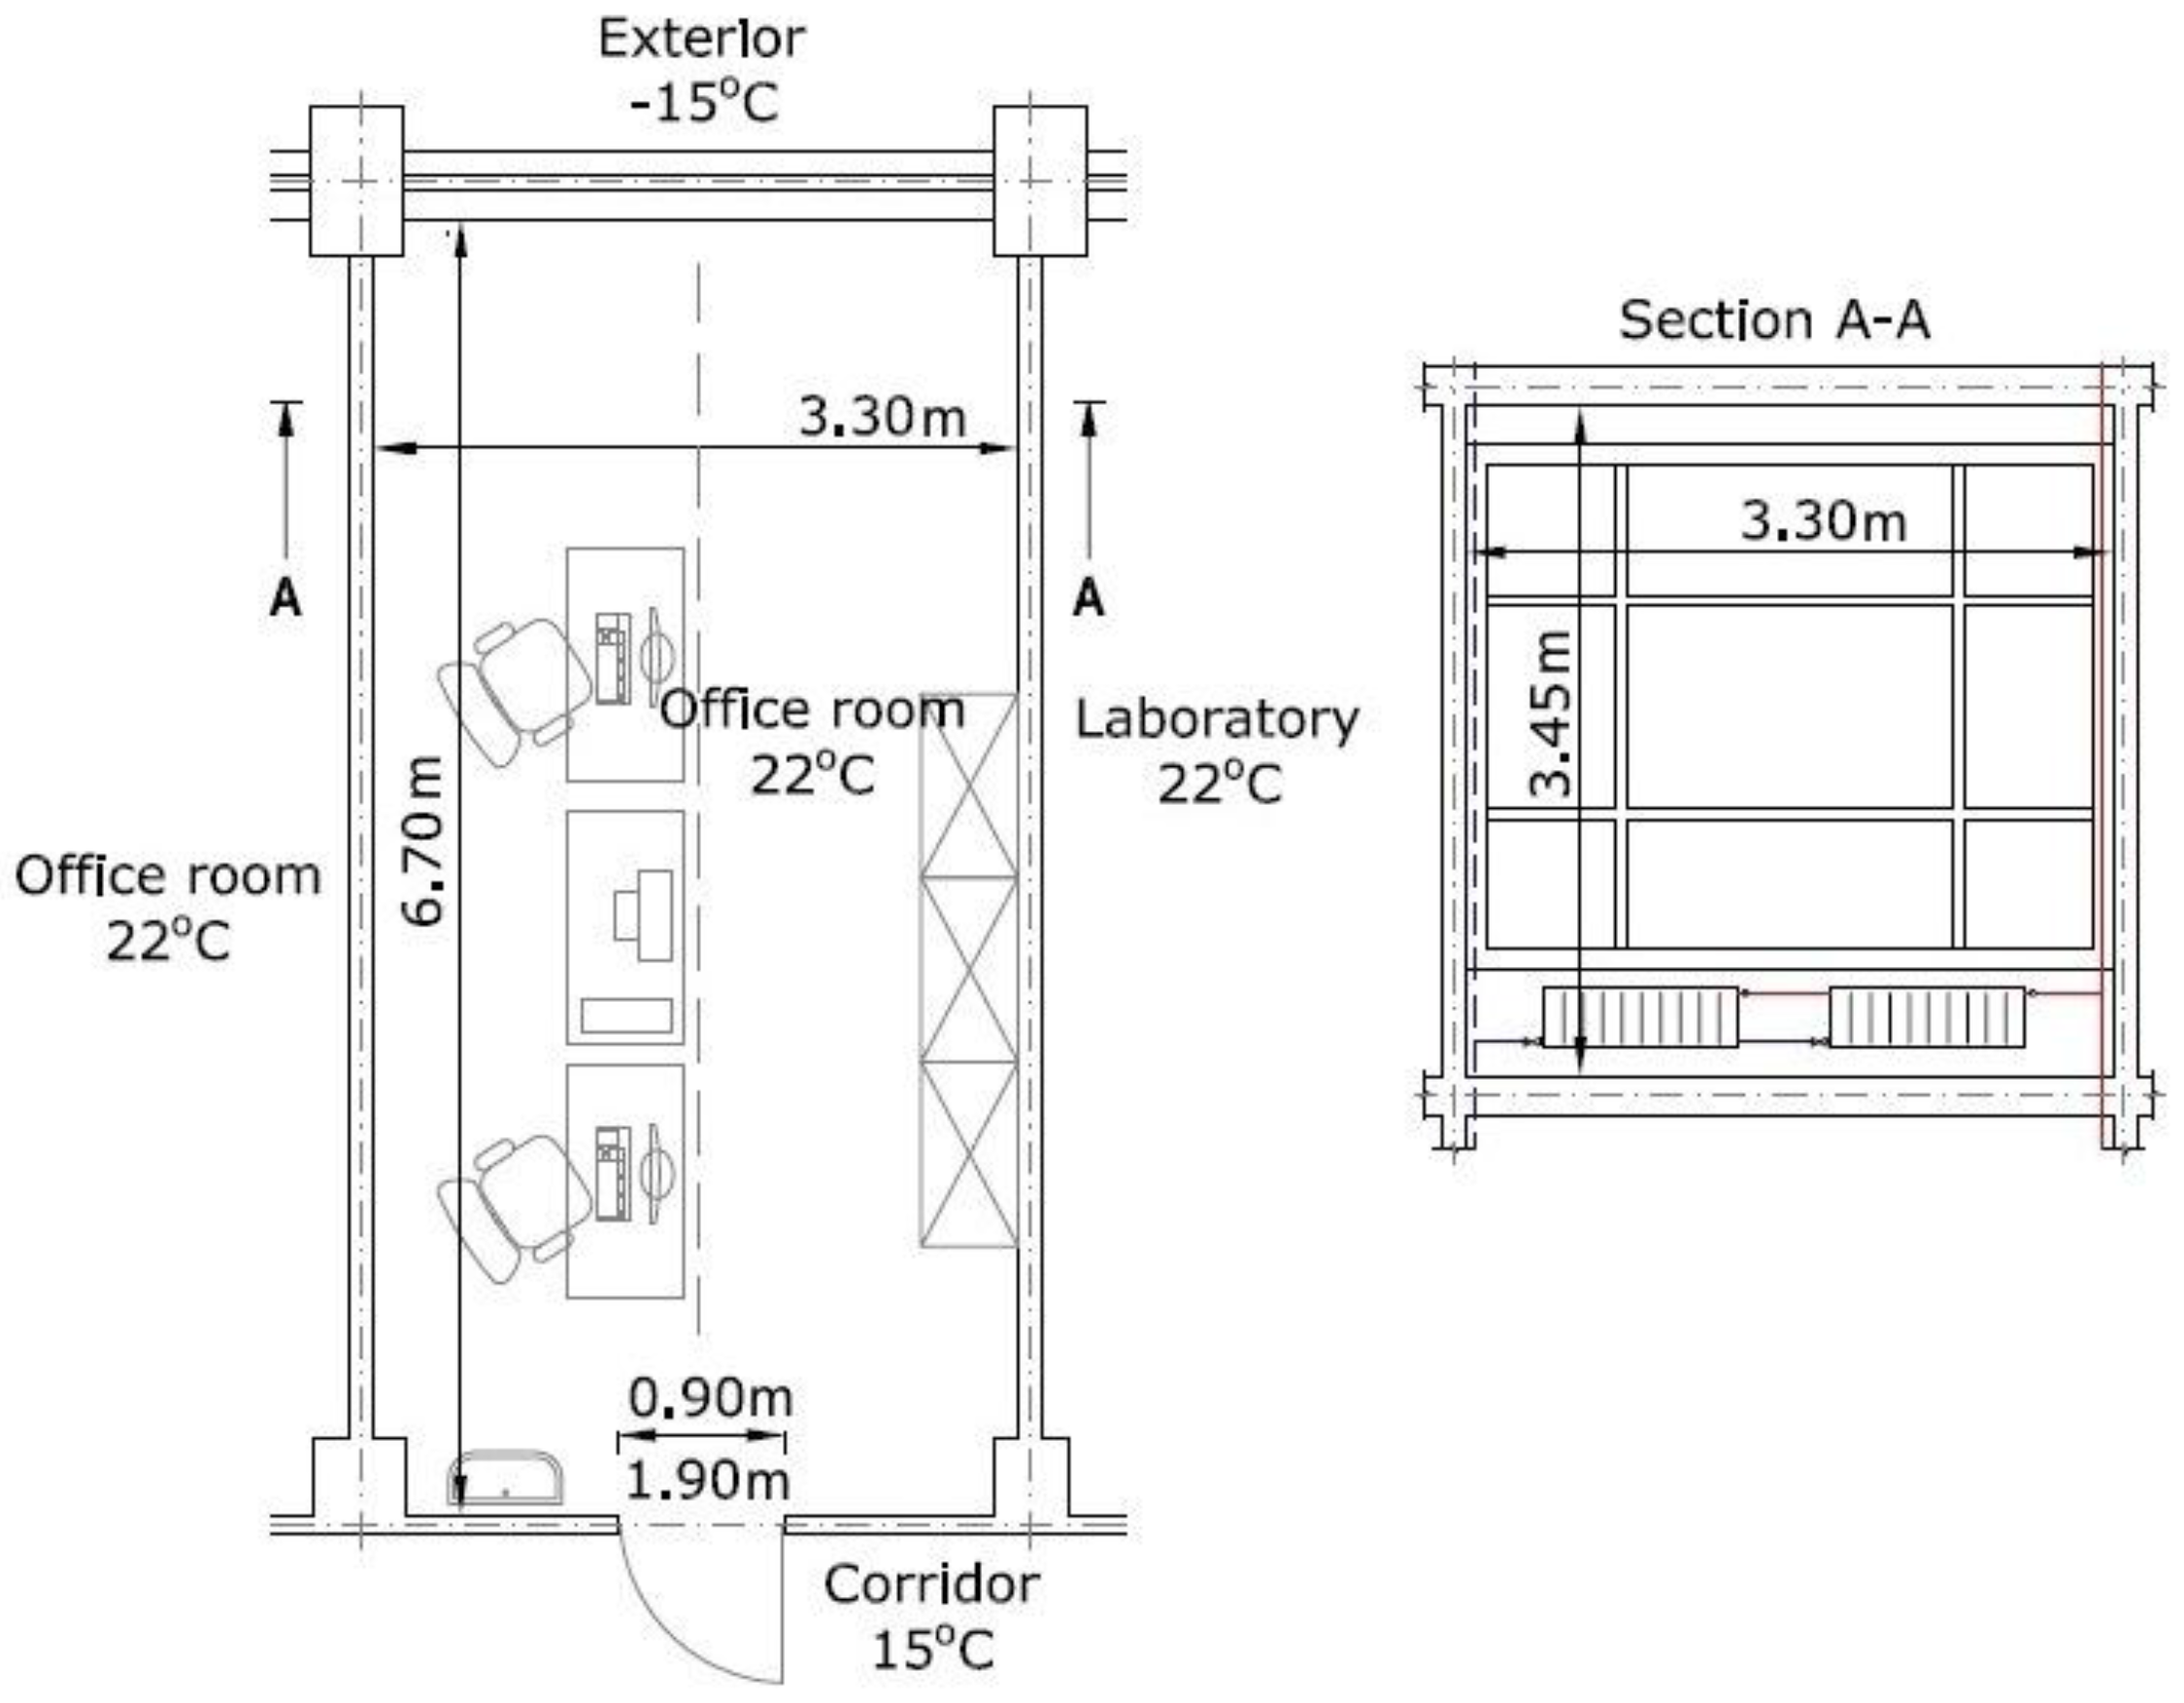
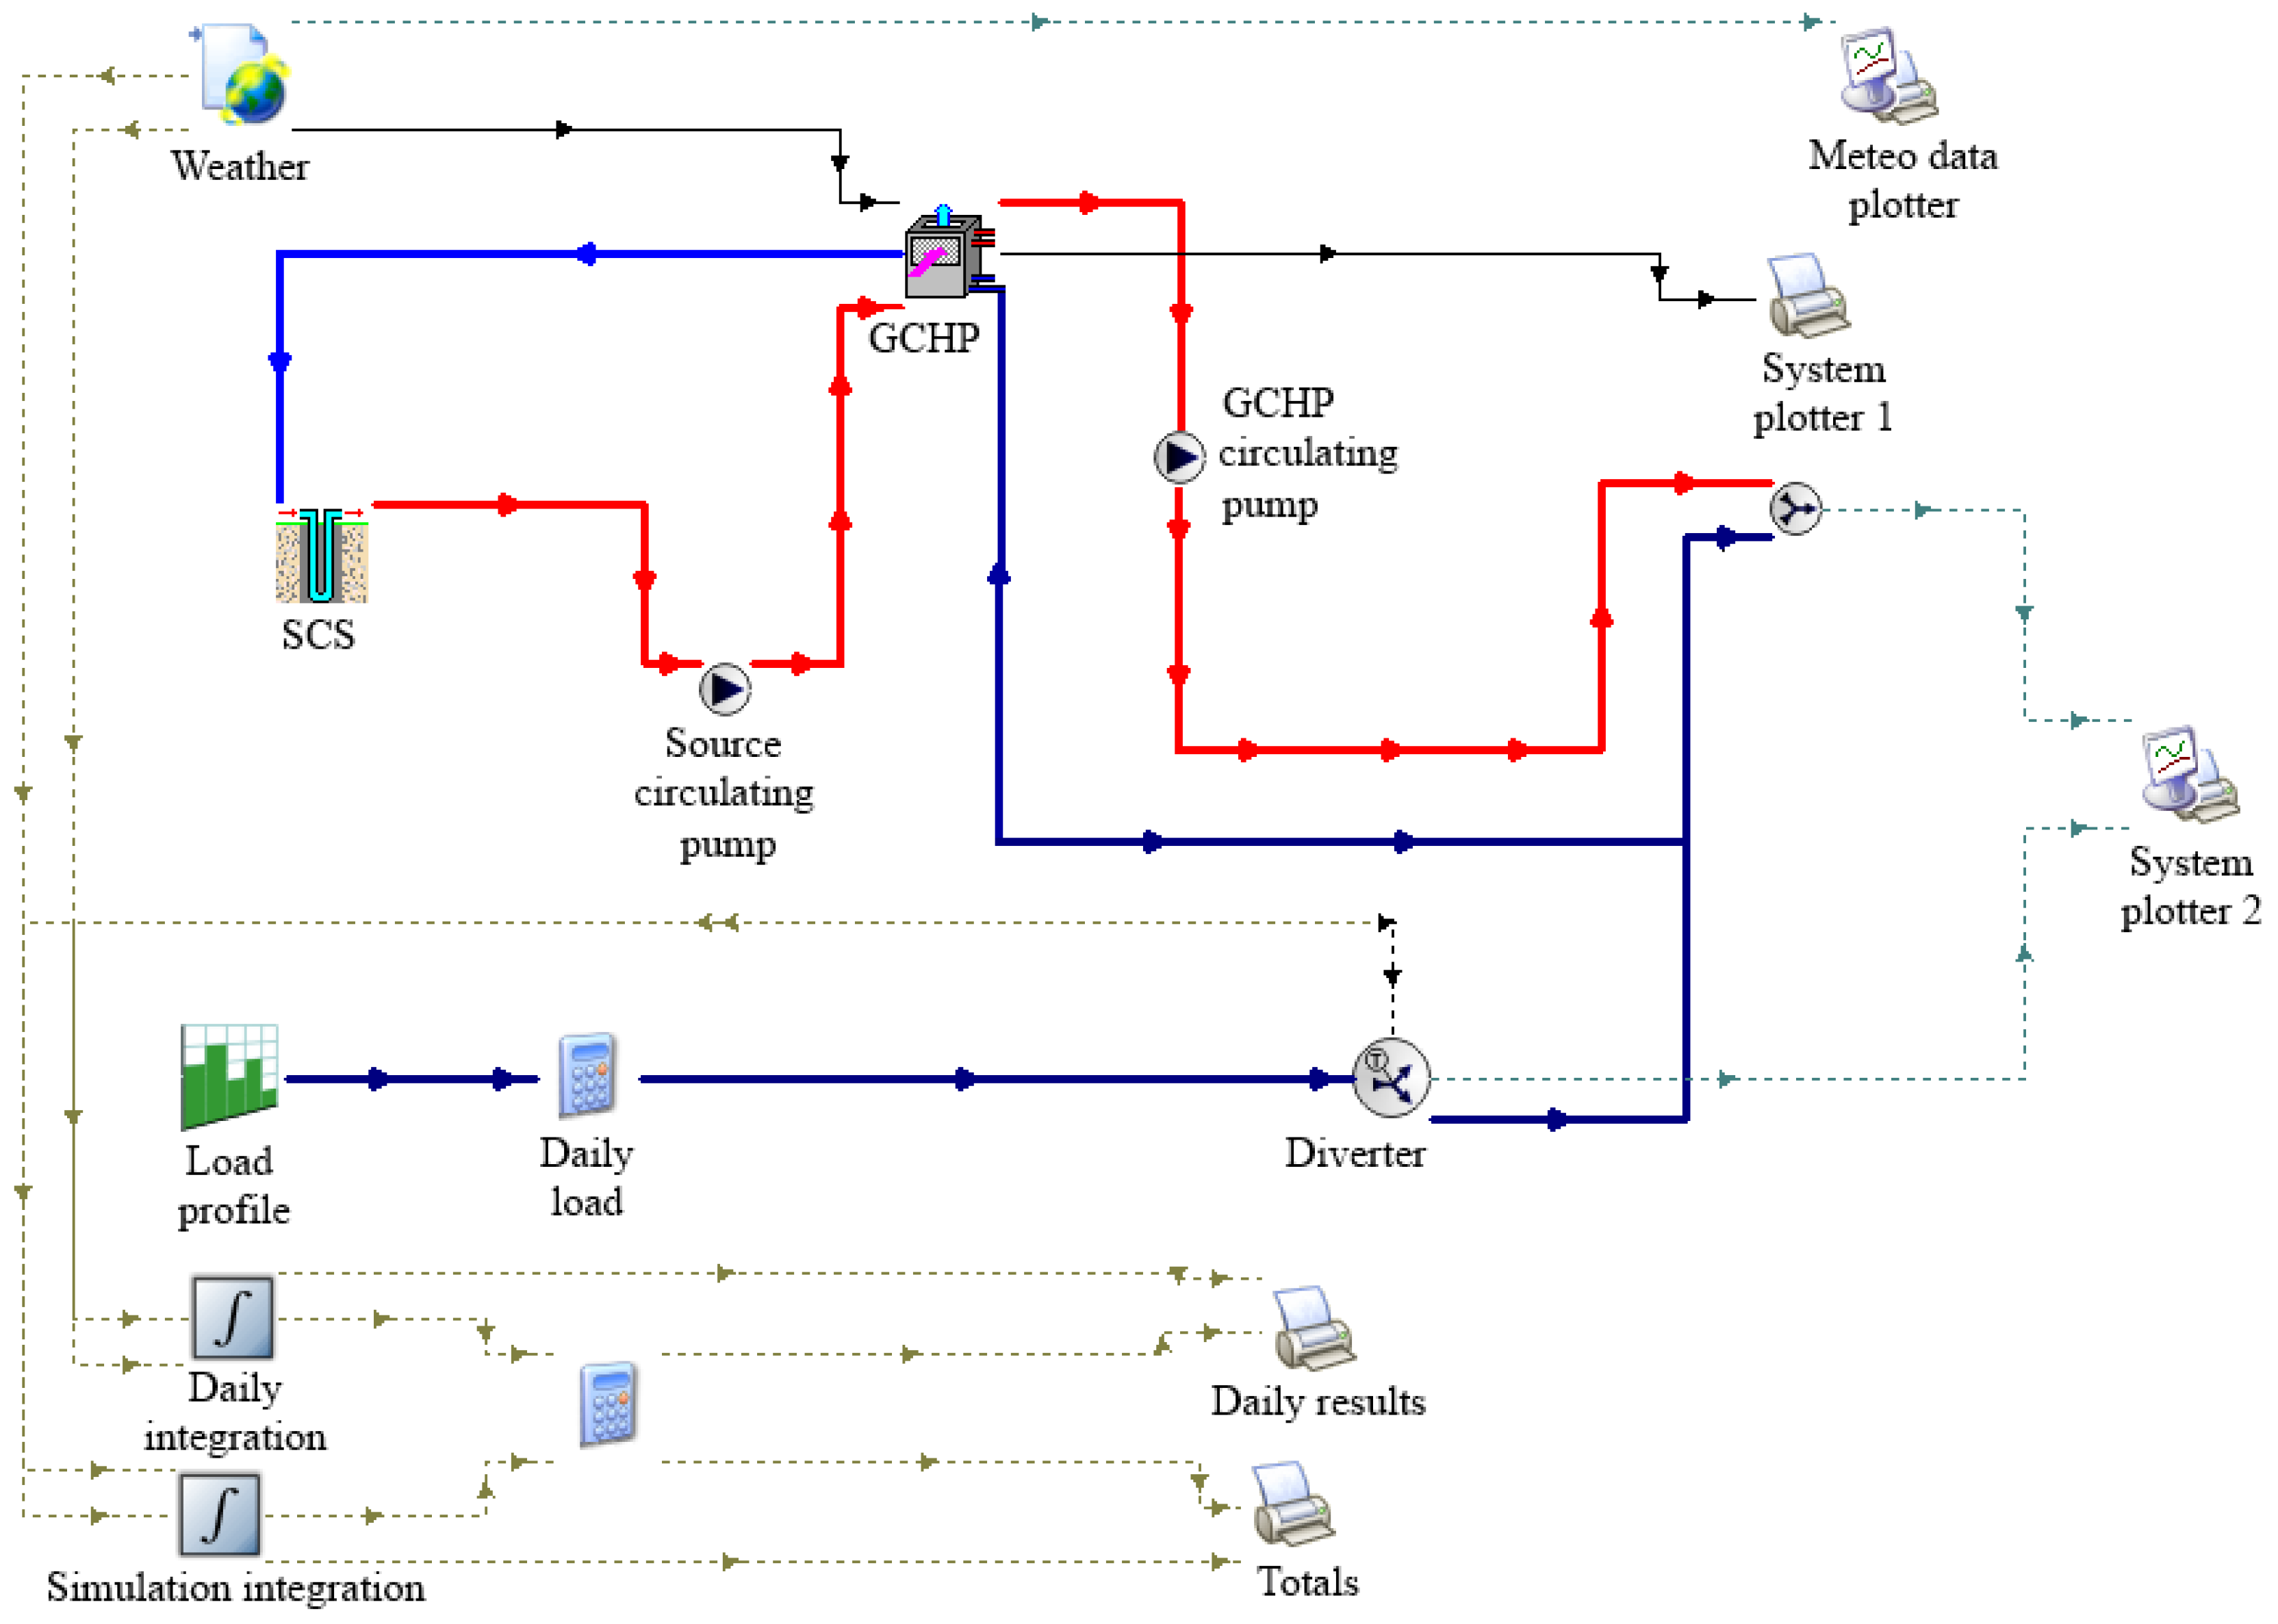
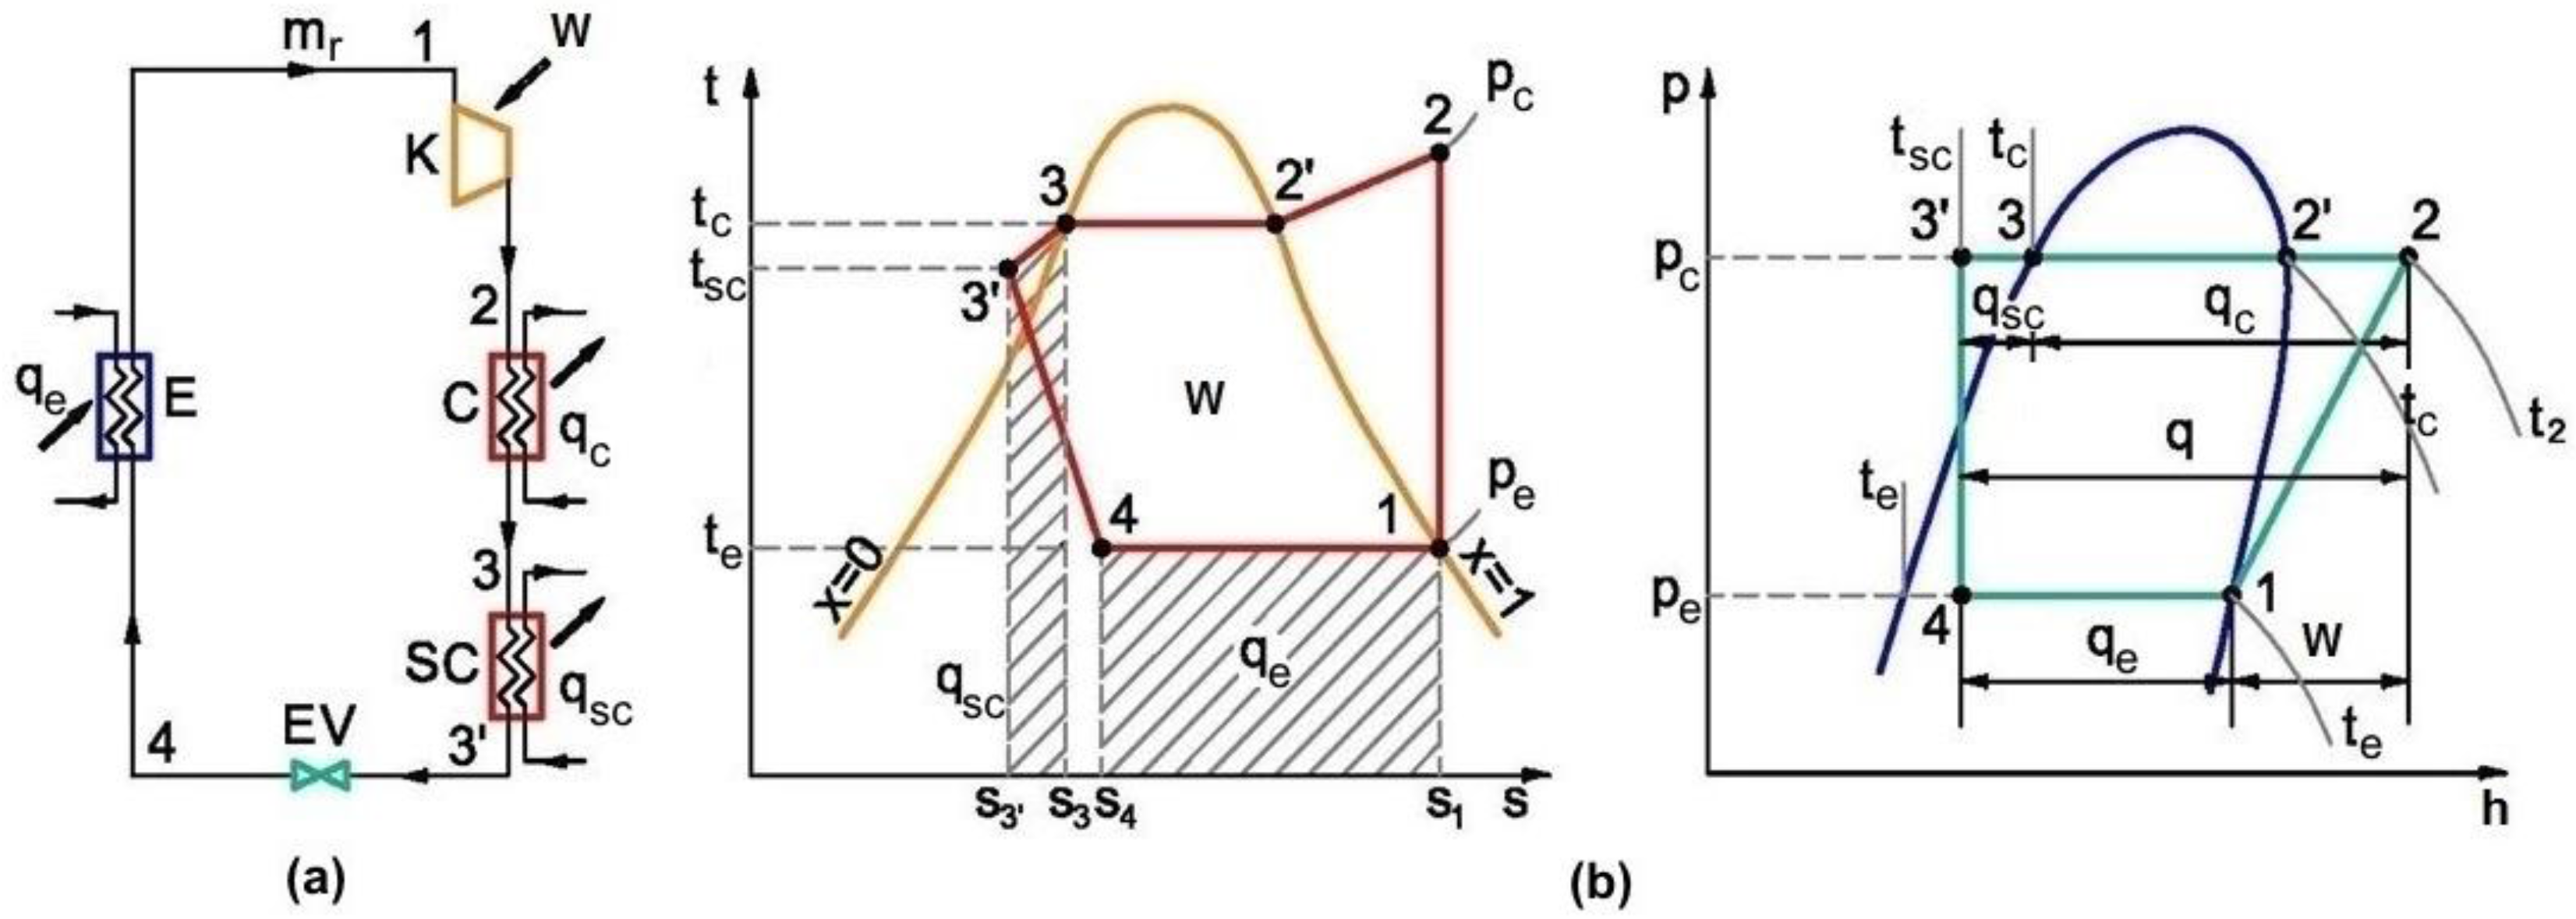
This paper discusses vapour compression-based HP systems briefly describing the calculation of the corresponding thermodynamic cycle, as well as the coefficient of performance (COP) and CO2 emissions of a HP with electro-compressor and compares different heating systems in terms of energy consumption, thermal comfort and environmental impact. It is focused of an experimental study performed to test the energy efficiency of the radiator or radiant floor heating system for an office room connected to a GCHP. The main performance parameters (COP and CO2 emissions) are obtained for one month of operation of the GCHP system, and a comparative analysis of these parameters is achieved. Simulations of useful thermal energy and the system COP in heating mode with Transient Systems Simulation (TRNSYS) software are finally performed along 8760 h using Meteonorm weather data and compared to experimental measurements to validate the simulation models.

2. Vapour Compression-Based Heat Pump (HP)

2.1. Thermodynamic Cycle

A HP is a thermal installation that is based on a reverse Carnot thermodynamic cycle, which consumes drive energy and produces a thermal effect. Air- and ground-source HPs are those with electro-compressors. The process of warming low-temperature heat to over 38 °C and transferring it indoors involves a cycle of evaporation, compression, condensation and expansion (Figure 1a). A non-chlorofluorocarbon refrigerant is used as the heat-transfer medium, which circulates within the HP. The basic vapour-compression cycle is considered to be one with isentropic compression and sub-cooling of liquid, and with no superheat of vapour (Figure 1b).
The specific compression work w, in kJ/kg, the specific cooling power qe, in kJ/kg, the specific heat load at condensation qc, in kJ/kg, the specific sub-cooling power qsc, in kJ/kg and the coefficient of performance COP are calculated as follows:
w = h 2 h 1
q e = h 1 h 4 = h 1 h 3
q c = h 2 h 3
q sc = h 3 h 3
COP = q c + q sc w = h 2 h 3 h 2 h 1
Thermal power (capacity) of heat pump Qhp, in kW, is expressed as:
Q hp = m r ( q c + q sc )
where mr is the mass flow rate of refrigerant, in kg/s.
The power necessary for the isentropic compression Pis, in kW, may be calculated using the equation:
P i s = m r w
The effective electrical power Pel on the compressor shaft is larger and is defined as:
P el = P i s η i s
where ηis is the isentropic efficiency.

2.2. Performance and CO2 Emission of HP

2.2.1. Coefficient of Performance

The operation of a HP is characterised by the coefficient of performance (COP) defined as the ratio between useful thermal energy Et and electrical energy consumption Eel:
COP = E t E el
Seasonal coefficient of performance (COPseasonal) or average COP over a heating (cooling) season, often indicated as the seasonal performance factor (SPF) or annual efficiency, is obtained if in Equation (9) is used summation of both usable energy and consumed energy during a season (year).
In the heating operate mode the COP of HP is defined by the following equation:
COP h p = Q h p P el
where Qhp is the thermal power of heat pump, in W; Pel is the electric power consumed by the compressor of HP, in W.

2.2.2. Profitability and Capabilities of HP

The factors that can affect the life-cycle efficiency of a HP are (i) the local method of electricity generation; (ii) the local climate; (iii) the type of HP (ground or air source); (iv) the refrigerant used; (v) the size of the HP; (vi) the thermostat controls; and (vii) the quality of work during installation.
Considering that the HP has over-unit efficiency, evaluation of the consumed primary energy uses a synthetic indicator [26]:
η s = η g COP h p
in which:
η g = η p η t η em
where ηg is the global efficiency and ηp, ηt and ηem are the electricity production, the transportation and the electromotor efficiency, respectively.
For justify the use of an HP, the synthetic indicator has to satisfy the condition η s > 1 . Additionally, the use of an HP can only be considered if the COPhp > 2.78.
The maximum theoretical COP of a HP can be expressed also in terms of the temperature of the hot environment (th), in K, and the temperature of the cold environment (ti), in K [6]:
  • in heating mode:
    COP = 1 1 t i / t h
  • in cooling mode:
    COP = 1 t h / t i 1
As the formulas shows, the COP of a HP system can be improved by reducing the temperature difference (thti) at which the system works.

2.2.3. Calculation of CO2 Emission

Due to the diversity in each country with respect to heating practices, direct energy use by HPs, and primary energy sources for electricity, country-specific calculations are provided.
The carbon dioxide emission C CO 2 of the HP during its operation can be evaluated with the following equation:
C CO 2 = g el E el
where gel is the specific CO2 emission factor for electricity. The average European CO2 emission factor for electricity production is 0.486 kg CO2/kWh and for Romania is 0.547 kg CO2/kWh [27].

3. Description of Ground-Coupled Heat Pump (GCHP) System

The ground serves as an ideal heat source for monovalent heat pump systems. The GCHP is a subset of the ground-source HP and is often called a closed-loop HP. A GCHP system consists of a reversible vapour-compression cycle that is linked to a GHE buried in the soil. This system may have a refrigerant-to-water heat exchanger or may be direct-expansion (DX). In systems with refrigerant-to-water heat exchangers, the heat transfer medium, water or antifreeze solution (brine), is circulated through the GHE (collector or loop) and the HP by an antifreeze solution pump. A GHE may be a simple pipe system buried in the ground; it may also comprise a horizontal collector or, more commonly, a BHE drilled to a depth between 20 and 300 m with a diameter of 100–200 mm and filled with single or double U-tube and grout [28]. DX-GCHPs use refrigerant in DX, flooded, or recirculation evaporator circuits for the ground pipe coils. A hybrid GCHP is a variation that uses a cooling tower or air-cooled condenser to reduce the annual heat rejection to the ground coupling.

4. Heat Pump Heating Systems

4.1. Radiator Heating System

A hot-water radiator heating system is a type of central heating. In the system, heat is generated in a HP and is distributed by hot water (heat carrier) to the radiators. The radiators heat the rooms. The hot water is circulated by a water circulation pump, which operates continuously. If the valves stop, then the hot water flows through a bypass pipe. The radiators, as rule of thumb, are located next to the cold surfaces of the envelope. They significantly influence the thermal comfort.
The radiators release the highest amount of heat to the heated room by convection and one part by heat radiation. The convective heat transfer will lead to a lower relative humidity of the air, and, at high radiator surface temperature, dust particles can be burned, leading to lower indoor air quality. Thus, emitters should be implemented with a radiation factor as high as possible in the case of high-temperature water supplies.
Computer simulation studies using the TRNSYS software indicate that according to the heat flux emitted by the heater, as well as its temperature level, it is possible to establish a temperature profile with height in rooms with a certain given geometry [29].
In regards to the heat flux values yielded by the heaters, in situ measurements [30] have indicated that the heat flux yielded by convection has the highest value. The heat flux yielded by radiation to the convectors is lower, for radiators it is under 50%, and for radiators with metal fins it is 10%–25%. To ensure ever-changing heat demand in a room, qualitative, quantitative or mixed control systems are used.

4.2. Radiant Heating Systems

In low-energy buildings, the low-temperature heating system usually works with a supply water temperature below 45 °C [31]. Embedded radiant systems are used in all types of buildings. Radiant heating systems supply heat directly to the floor or to panels in the wall or ceiling of a house. Hydronic (hot water) systems are the most popular and cost-effective radiant heating systems for heating-dominated climates.
Radiant heating application is classified as panel heating if the panel surface temperature is below 150 °C [32]. A radiant system is a sensible heating system that provides more than 50% of the total heat flux by thermal radiation. The controlled temperature surfaces may be in the floor, walls, or ceiling, with the temperature maintained by circulation of water or air. The radiant heat transfer coefficient between a heated surface and a room is approximately 5.5 W/(m2·K) and the convective heat transfer coefficient then varies between 0.5 and 5.5 W/(m2·K) [33], depending on the surface type and heating mode. This shows that the radiant heat transfer varies between 50% and 90% of the total heat transfer.
Radiant panel heating is characterised by the fact that heating is associated with a yielding of heat with low temperature because of physiological reasons. Thus, at the radiant floor panels, the temperature must not exceed +29 °C, and at the radiant ceiling panels, the temperature will not exceed 35–40 °C, depending on the position of the occupier (in feet) and the occupier distance to the panels, in accordance with thermal comfort criteria established by ISO Standard 7730 [34]. A vertical air temperature difference between head and feet of less than 3 °C is recommended. The estimation of heating capacity of systems is very important for the proper system design. Based on the calculated average surface temperature at given heat carrier temperature and operative temperature in the space, it is possible to determine the steady state heating capacity. Thus, the heating capacity of the floor, wall and ceiling heating systems is given by Equations (16)–(18), respectively [35]:
q = 8.92    | t o t S,m | 1.1
q = 8.0    | t o t S,m |
q = 6.0    | t o t S,m |
where q is the heating capacity, in W/m2; to is the operative (comfort) temperature in the space, in °C; tS,m is the average surface temperature, in °C.

4.3. Terminal Unit Supply Temperature

A radiant floor system requires water input temperature between 35 and 40 °C. A radiator system built in the 1970s was designed with input temperatures higher than 70 °C. The question is by how much can be the supply temperature of the radiators be lowered whilst keeping the same size existing terminal units? Both increasing the building performance and introducing a HP system results in a reduction in the requested power and this permits reducing the water temperature sent to the plant. The water input temperature in terminal units with both a radiant floor system and a radiator system can reduce the thermal load according to the change in outdoor air temperature ta, as shown in Figure 2.

5. Performance Analysis of Heating Systems Used for an Office Room

5.1. Description of the Office Room

Experimental investigations of GCHP performance were conducted in an office room with geometrical dimensions of 6.7 m × 3.3 m × 3.45 m (Figure 3) at the Polytechnic University of Timisoara (Romania), located at the ground floor of the Civil Engineering Faculty building. Timisoara has a continental temperature climate with four distinct seasons. The heating season runs in Timisoara from 1 October to 30 April. The following data are known: heat transfer resistance (1/U-value) of building components (depending on their structure): walls (2.10 m2·K/W), ceiling (0.34 m2·K/W), windows and doors (0.65 m2·K/W); glass walls surface, 8.2 m2; total internal heat gain (e.g., from computers, human and lights), 25 W/m2; and heat demand, 1.35 kW. The indoor and outdoor air design temperatures are 22 and −15 °C, respectively.
This space is equipped both with a floor heating system and steel panel radiators to analyse the energy and environmental performance of these systems. These two heating systems are connected to a mechanical compression GCHP, type WPC 5 COOL (Stiebel Eltron, Stuttgart, Germany). In the GCHP system, heat is extracted from the ground by a closed-loop vertical GHE with a length of 80 m. Figure 4 illustrates the monthly energy demand for office room heating calculated using Romanian standard NP 048-2000 [36].

5.2. Experimental Facilities

The GCHP experimental system consisted of a BHE, HP unit, circulating water pumps, floor/radiator heating circuit, data acquisition instruments and auxiliary parts, as shown in Figure 5.

5.2.1. Borehole Heat Exchanger

The GHE of this experimental GCHP consisted of a simple vertical borehole that had a depth of 80 m. Antifreeze solution (30% ethylene glycol aqueous solution) circulates in a single polyethylene U-tube of 32 mm internal diameter, with a 60 mm separation between the return and supply tubes, buried in borehole. The borehole’s overall diameter was 110 mm. The average temperature across the full borehole depth tested was 15.1 °C.
The average thermal conductivity and thermal diffusivity of the ground from the surface to 80 m deep tested were 1.90 W/(m·K) and 0.79 × 10⁻⁶ m2/s, respectively [37]. The boreholes were completely backfilled with grout mixed with drilling mud, cement and sand in specific proportions to avoid intrusion of pollutants in the aquifers. The thermal conductivity and thermal diffusivity of the grout tested by manufacturer were 2.32 W/(m·K) and 0.93 × 10⁻⁶ m2/s, respectively [38].

5.2.2. Heat Pump Unit

The heat pump unit is a reversible ground-to-water scroll hermetic compressor unit with R410A as a refrigerant and the nominal heating capacity of 6.5 kW. The HP unit is a compact type model having an inside refrigeration system. The operation of the HP is governed by an electronic controller, which, depending on the system water return temperature, switches the HP compressor on or off. The heat source circulation pump was controlled by the HP controller, which activates the source pump 30 s before compressor activation.

5.2.3. GCHP Data Acquisition System

The GCHP data acquisition system consisted of the indoor and outdoor air temperature, dew point temperature, supply/return temperature, heat source temperature (outlet BHE temperature), relative air humidity, and main operating parameters of the system components.

5.2.4. Heating Systems

The heating systems are supplied via a five-circuit flow/return manifold as follows. The first two circuits supply the floor heating system. The third and fourth circuits are coupled to a radiator heating system, and the fifth circuit is for backup.
The flow/return manifold is equipped with a circulation pump to ensure the chosen temperature of the heat carrier (hot water). A three-way valve and a thermostatic valve are provided to adjust the maximum hot-water temperature of the floor’s heating system. Thus, for higher temperatures, the hot water is adjusted to achieve a circulation loop in the heating system.
To achieve higher performance of the heating systems, a thermostat is provided for controlling the start/stop command of the circulation pump when the room reaches the set point temperature. At the same height as this thermostat, there is also an ambient thermostat that controls the starting and stopping of the HP to ensure optimum operation of the entire heating system.
The start-stop command of the flow/return manifold circulation pump is controlled by an interior thermostat relay, situated at a height of approximately 1.00 m above the floor surface. This height has been determined to provide adequate comfort for the office occupants.
The radiant floor heating system consists of two circuits connected to a flow/return (42/36 °C) manifold (Figure 6a), designed to satisfy the office heating demand of 1.35 kW. The first circuit has a length of 54 m and is installed in a spiral coil, with the closest step distance to the exterior wall of the building to compensate for the effect of the heat bridge, and the second circuit, with a length of 61 m, is mounted in the coil simple. The mounting step of the coils is between 10 and 30 cm.
The floor heating pipes are made of cross-linked polyethylene with an external diameter of 17 mm and a wall thickness of 2 mm. The mass flow rate for each circuit is controlled by the flow/return manifold circuit valves. They are adjusted to satisfy the heat demand according to Timisoara’s climate (ta = −15 °C).
As for the radiator heating system, the low-temperature radiator heating system (45/35 °C) has two steel panel radiators, each one with two water columns and a length of 1000 mm, height of 600 mm and thermal power of 680 W (Figure 6b), connected to a flow/return manifold and dimensioned to satisfy the office heating demand of 1.35 kW. They are installed on a stand at 15 cm above the floor surface to ensure optimal indoor air circulation.
The heating radiator system pipes are made of cross-linked polyethylene with an external diameter of 17 mm and a wall thickness of 2 mm. The mass flow rate for each radiator is controlled by the flow/return manifold circuit valves, adjusted to satisfy the heat demand of office room.

5.3. Measuring Apparatus

A network of sensors was setup to allow monitoring of the most relevant parameters of the system [38]. Two thermal energy meters were used to measure the thermal energy produced by the GCHP and the extracted/injected thermal energy to the ground. A thermal energy meter was built with a heat computer, two PT500 temperature sensors (AEM, Timisoara, Romania) and an ultrasonic mass flow meter. The two PT500 wires temperature sensors with an accuracy of ±0.15 °C were used to measure the supply and return temperature for a hydraulic circuit (the water-antifreeze solution circuit or the manifold circuit). Also, an ultrasonic mass flow meter measured the mass flow rate for a hydraulic circuit. The thermal energy meters were model LUXTERM ones (AEM, Timisoara, Romania), with an IP 67 signal converter and accuracy <0.2%. A three-phase electronic electricity meter measured the electrical energy consumed by system (the HP unit, the circulating pumps, a feeder 220 Vca/24 Vcc, a frequency converter and a programmable logic controller) and another three-phase electronic electricity meter measured the electrical energy consumed by the HP compressor. The two three-phase electronic electricity meters were multifunctional type from AEM, model ENERLUX-T, with an accuracy grade in ±0.4% of the nominal value. The monitoring and recording of the experiments were performed using a personal computer (PC). The indoor and outdoor air temperatures were measured by air flow sensors and supply/return and heat source temperatures were recorded by positive temperature coefficient (PTC) immersion sensors, all connected to the GCHP data acquisition system and having an accuracy of ±0.2 °C.

5.4. Experimental Results

5.4.1. Comparison between Energy Performances of Systems

The two heating systems were monitored for 2 months. The experiments were conducted for a 1-month heating period for each of the two analysed heating systems, from 7 December 2013 to 6 January 2014 and from 15 January 2014 to 14 February 2014. The outdoor temperature varied in the range of −5.0 to 9.9 °C. The monthly mean values of the outdoor temperature during the two periods were almost equal. The outdoor air temperature (ta) recorded for a 1-month period, is plotted in Figure 7 and the variation in time of the ground temperature (ths) is shown in Figure 8.
The energy performance of heating system is determined based on coefficient of performance (COPsys), which can be calculated using Equation (9). The carbon dioxide emission ( C CO 2 ) of the heating system during its operation is calculated with Equation (15). To obtain the COP and CO2 emissions, it is necessary to measure the heating energy and electricity used in the system.
During the cold season, measurements were performed at the appreciatively same average outdoor air temperature and the heat source temperature for both the radiant floor heating system and the radiator heating system. The following average values were recorded: outdoor air temperature (ta), indoor air temperature (ti), heat source temperature (ths), supply hot-water temperature (td), electricity consumption (Eel) and useful thermal energy for heating (Et). In addition, the CO2 emission and the on/off switching of the HP were determined in both heating systems. Figure 9 shows a comparison between the indoor air temperatures ti,RAD and ti,RF obtained by radiator heating and radiant floor heating. It is observed that due to the small thermal inertia of the radiators, a high level of on/off switching is needed for the HP of the radiator heating system, leading to large fluctuations of indoor air temperature compared with the floor heating system, along with reduced thermal comfort. Table 1 presents a summary of the average values of the experimental results during a 1-month measurement.
The two heating systems have small differences (4.5%) in their energy performance coefficient (COPsys) value, but the on/off switching in the case of radiator heating system is almost three times higher than that for radiant floor heating system, leading to higher wear on the HP equipment. In addition, there was 10% higher energy consumption and CO2 emission for the radiator heating system compared with the floor heating system under the same operating conditions.
Energy consumption can be influenced by building occupants’ activity and the floor surface material. If the floor surface material exhibits good heat transfer, such as with stone or tile, the floor feels cold even at a temperature of approximately 24–25 °C.
Generally, the building occupants want the floor to feel warm to the feet, and this is why they increase the water temperature to a level that makes the floor feel warm, sometimes even in summer. The warm temperature is typically more than 27 °C for stone-based materials. The excess heat must be ventilated/cooled to retain acceptable indoor air temperatures. This causes a great increase in energy consumption. Cases in which the energy consumption has doubled have been observed in studies. In a well-insulated building, the selected floor surface material is of crucial importance in regard to how warm the floor feels. For example, oak parquet at a temperature of 21 °C and stone floor at a temperature of 26 °C feel neutral and roughly the same under a bare foot according ISO/TS 13732-2 [39]. However, this is not always the case, the percent dissatisfied (PD) in % has a relation with floor surface temperature as follow [40]:
PD = 100 94 exp ( 1.387 + 0.118 t f 0.0025 t f 2 )
where tf is the floor surface temperature.

5.4.2. Uncertainty Analysis

Uncertainty analysis (the analysis of uncertainties in experimental measurement and results) is necessary to evaluate the experimental data. An uncertainty analysis was performed using the method described by Holman [41]. A result Z is a given function of the independent variables x1, x2, x3, …, xn. If the uncertainties in the independent variables w1, w2, w3, …, wn are all given with same odds, then uncertainty in the result wZ having these odds is calculated by the following equation [41]:
w Z = ( Z x 1 w 1 ) 2 + ( Z x 2 w 2 ) 2 + + ( Z x n w n ) 2
In the present study, the temperatures, thermal energy and electrical energy were measured with appropriate instruments explained previously. Error analysis for estimating the maximum uncertainty in the experimental results was performed using Equation (20). It was found that the maximum uncertainty in the results is in the COPsys, with an acceptable uncertainty of 3.9% and 3.1% for radiant floor heating system and radiator heating system, respectively.

5.5. Thermal Comfort Assessment

The office room with geometrical dimensions from Figure 4 is considered. The following data are known: indoor air temperature, 22 °C; relative humidity of air, 55%; thermal power of heater, 1360 W; floor temperature, 20 °C for radiator heating and 29 °C for radiant floor heating.
Assessment of thermal comfort in the office room is performed using the predicted mean vote (PMV)-predicted percent dissatisfied (PPD) model [42]. A comparative study of PMV and PPD indices is performed using the computer program THERMAL COMFORT [43] in several points situated on a straight line (discontinuous), at different distances from the window, function of metabolic rate (iM) and clothing thermal resistance (Rcl).
The results of the numerical solution obtained for the pairs of values are as follows: 3.4 met-0.67 clo (intense activity, normal clothes), 1 met-0.90 clo (reading seated, winter clothes), and 1.1 met-0.29 clo (writing, light clothes), and are reported in Table 2.
According to the performed study, it was established that the PMV index has values close to zero only for the pair of values 1 met-0.9 clo. For any other pair of values iM-Rcl, the percent of people dissatisfied with their thermal comfort would be greater than 35%. In addition, the PMV index values for the pair 1 met-0.9 clo are lower with 47%–94% in the case of the radiant floor heating system than in the case of the radiator heating system. Therefore, the first system leads to increased thermal comfort.

5.6. Numerical Simulation of Useful Thermal Energy and System COP Using TRNSYS Software

The TRNSYS software [44] is a flexible modelling and simulation tool that can solve very complex problems from the decomposition of the model in various interconnected model components. One of the main advantages of TRNSYS for the modelling and design of ground-source HPs is that it includes components for the calculation of building thermal loads, specific components for heating/cooling, ventilating and air-conditioning (HVAC), HPs and circulating pumps, modules for BHEs and thermal storage, as well as climatic data files, which make it a very suitable tool to model a complete air-conditioning/HP installation to provide heating and cooling to a building.
Some statistical methods, such as the root-mean square (RMS), the coefficient of variation (cv), the coefficient of multiple determinations (R2) and percentage difference (relative error) er may be used to compare simulated and actual values for model validation, according to relations [45]:
RMS = i = 1 n ( y sim , i y mea , i ) 2 n
c v = RMS | y ¯ mea , i | 100
R 2 = 1 i = 1 n ( y sim , i y mea , i ) 2 i = 1 n y mea , i 2
e r = | y mea , i y sim , i | y mea , i 100 %
where n is the number of measured data in the independent data set; ymea,i is the measured value of one data point i; ysim,i is the simulated value; y ¯ mea , i is the mean value of all measured data points.

5.6.1. Simulation of Thermal Energy Used for Office Room Heating

Definition of the operation scheme. To simulate the thermal energy used to cover the heating load of the office room, the operational connections were established between the building and all internal and external factors.
Figure 10 presents the operational scheme built in TRNSYS, where the building thermal behaviour was modelled using a Type 56 subroutine. This subroutine was processed with the TRNBuild interface by introducing the main construction elements, their orientation and surface, shadow factors, and indoor activity type. Weather data for the Timisoara were obtained from the Meteonorm data base [46] and the Types 109 and 89d weather data readers were used to convert the data into a form readable from TRNSYS. The simulation model took into account the outdoor air infiltrations, heat source type, and interior gains. To extract the results, an online plotter (Type 65) is used.
Simulation results and comparison with experimental data. Performing simulations for a 1-year period (8760 h), the values of thermal energy used for heating were obtained and are presented beside the measured values during heating operation in Table 3. Statistical values are also given in Table 3. There was a maximum difference between the measured and TRNSYS simulated values for the heating period of approximately 1.59%, which is very acceptable. The RMS and cv values in heating mode are 2.722% and 1.41%, respectively. The R2-values are about 0.9999, which can be considered as very satisfactory. Thus, the simulation model was validated by the experimental data.

5.6.2. COP Simulation of GCHP System

Definition of the operation scheme. For COP simulation of the GCHP system, the operational scheme built in TRNSYS from Figure 11 was utilised. The assembly of GCHP system consists of the standard TRNSYS weather data readers Type 15-6, a GCHP model Type 919, a BHE Type 557a. Also, in the simulation model were defined single-speed circulating pumps Type 114 for the antifreeze solution in the BHE and Type 3d for heat carrier fluid of the manifold. A Type 14 for the load profile and a daily load subroutine were created, this approach improving significantly the numerical convergence of the model. Finally, two model integrators (Types 25 and 24) were used to calculate daily and total results for thermal energy produced.
Simulation results and comparison with experimental data. COP simulation of the GCHP integrated both with radiator and radiant floor heating system was performed for a 1-month period. The results of the simulation program are presented beside the experimental data in Table 4. A comparative analysis of these results indicates that the COPsys values simulated with TRNSYS program were only 3.52% lower than the measured values for radiant floor heating system and only 4.98% lower than the measured values for radiator heating system. Thus, the simulation model is validated experimentally. The radiant floor system appears to be more performing in terms of COP because this system has a superior thermal inertia as the radiator system.

6. Conclusions

The use of heat pumps in modern buildings with improved thermal insulation and reduced thermal load is a good alternative to traditional heating solutions. This study showed that radiator heating and radiant floor heating systems have small differences (4.5%) in their energy performance coefficient (COPsys) value, but the on/off switching in the case of radiator heating system is almost three times higher than that for radiant floor heating system, leading to higher wear on the HP equipment. In addition, the radiator heating system showed 10% higher energy consumption and CO2 emission compared to the floor heating system under the same operating conditions, which also provided good thermal comfort.
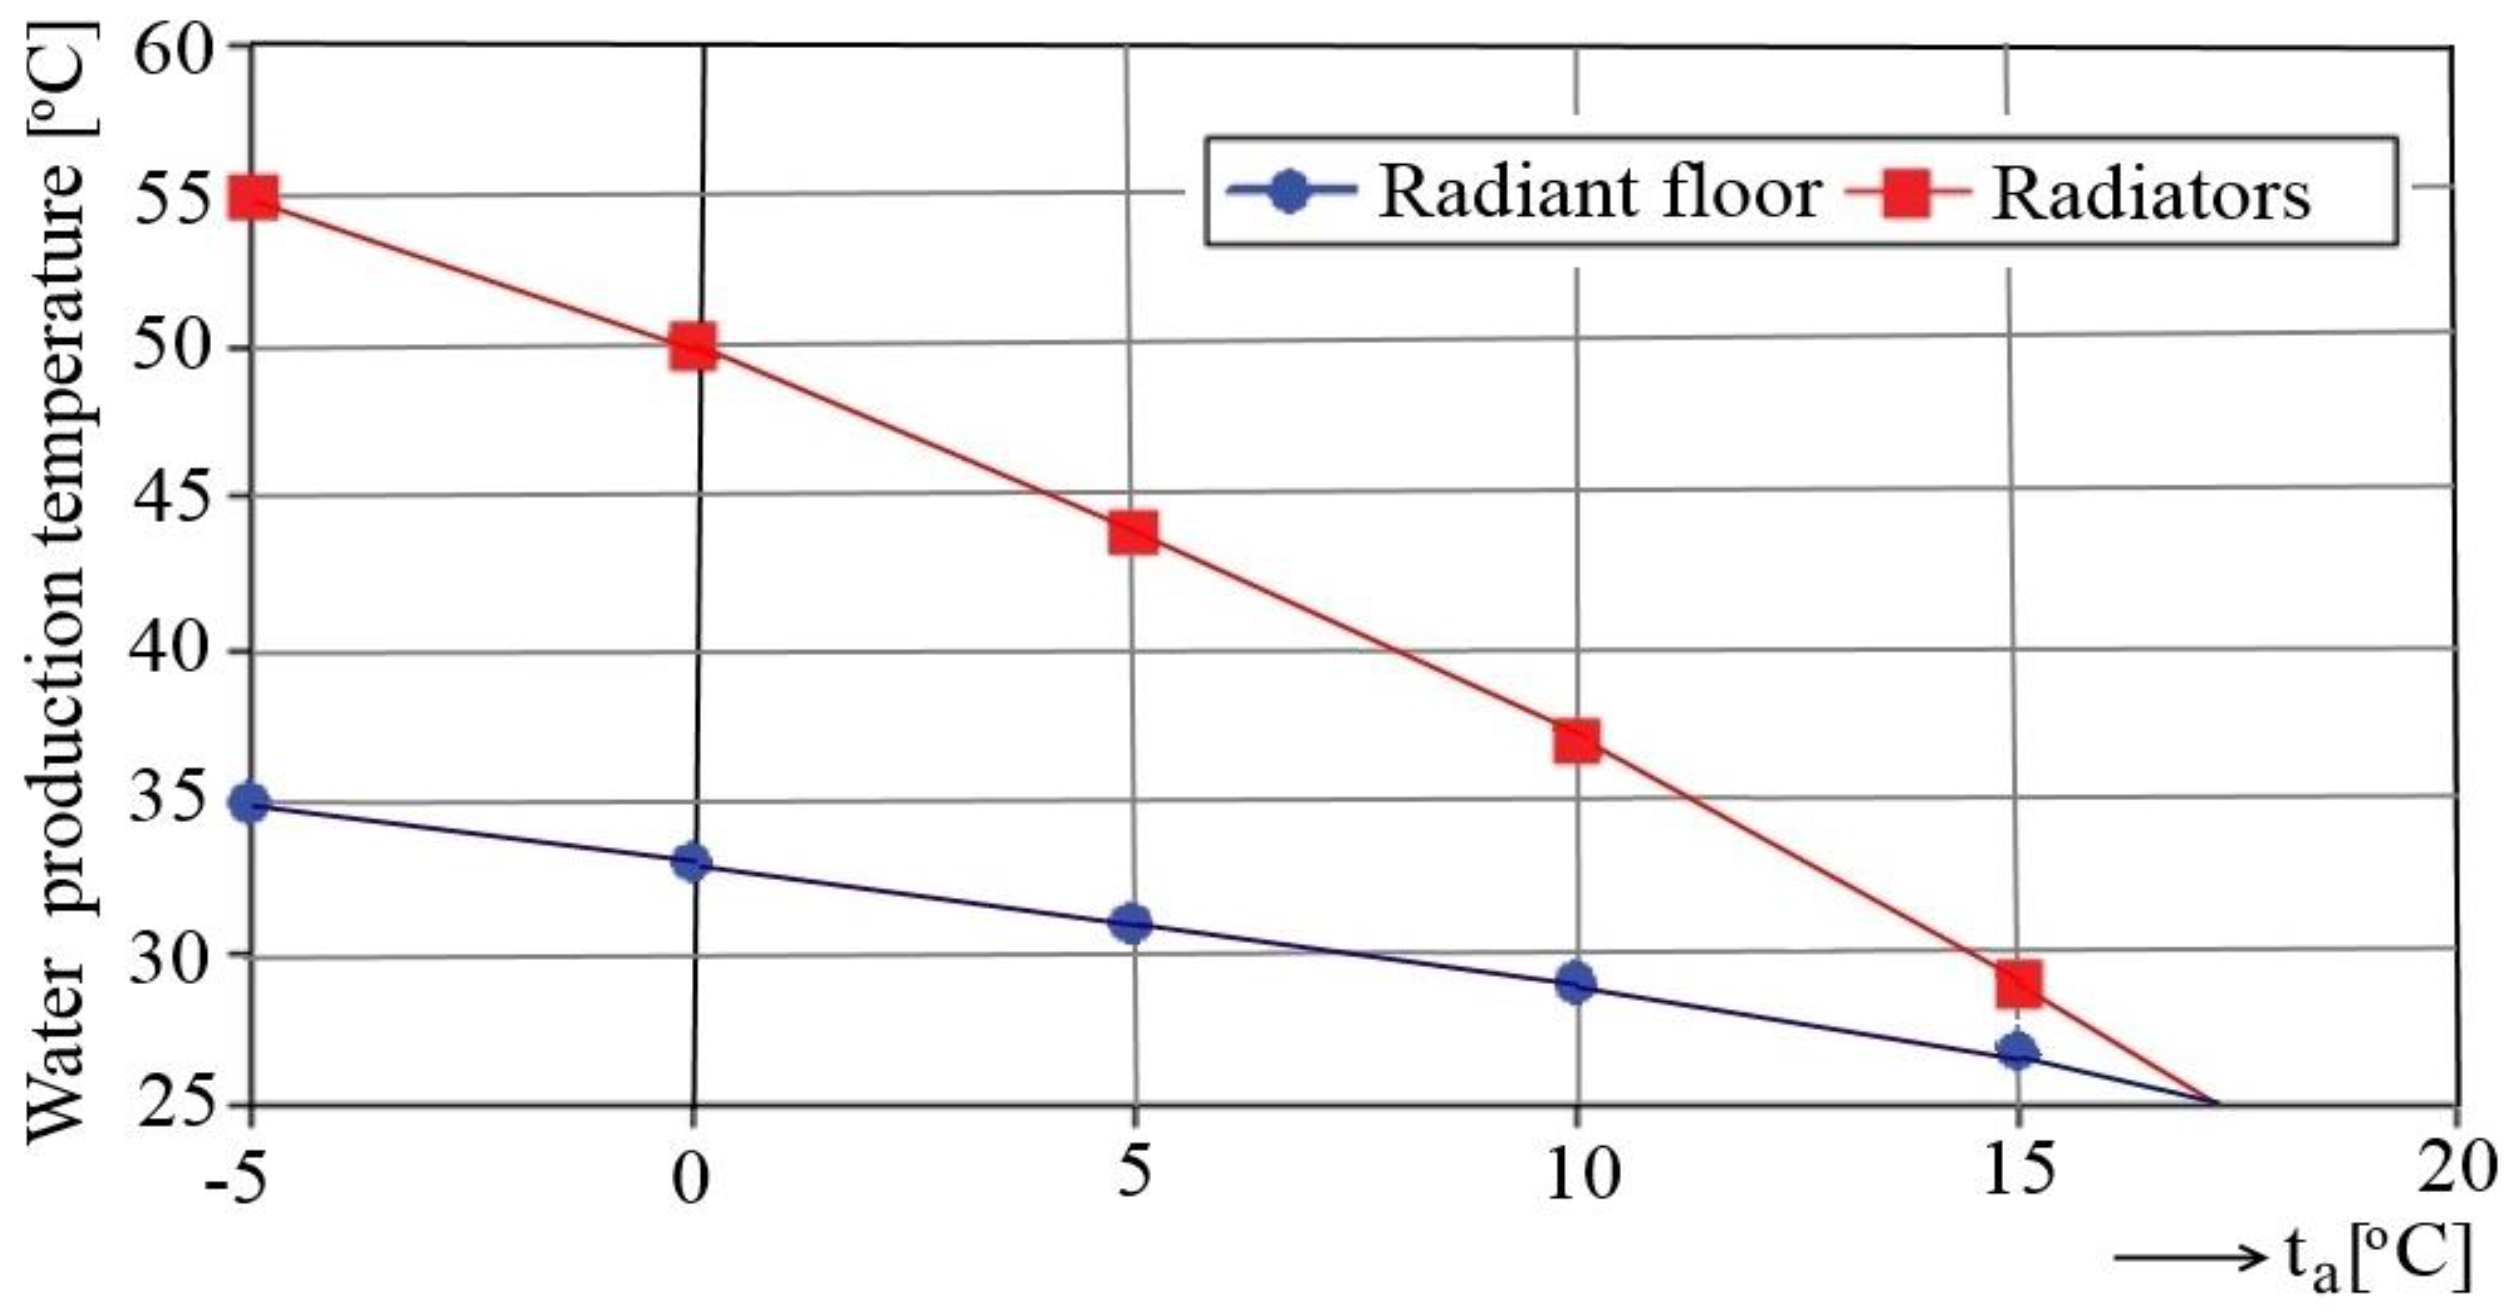
From the radiator selection point of view, design temperatures of 45/35 °C are more useful than 50/30 °C because of higher excess temperature (logarithmic mean temperature difference). Design water temperatures 45/35 °C also provide a good common basis for a combined heating system using radiators as primary heat emitters and floor heating in rooms where higher floor temperatures are preferred (e.g., bathrooms) [47]. In well-insulated buildings, a floor heating system is recommended over a radiator heating system if a heat pump is used as the energy source.
The developed TRNSYS simulation models can be used as a tool to determine the GCHP performance connected with different heating systems to optimise theirs energy efficiency and ensure the user’s comfort throughout the year. This study can provide a practical reference for the design of similar GCHP system in residential buildings. More detailed experimental and numerical information will be presented in later studies.

Acknowledgments

This research work was supported by a grant of the Romanian National Authority for Scientific Research, CNDI-UEFISCDI (National Council for Development and Innovation-Executive Agency for Higher Education, Research, Development and Innovation Funding), project number PN-II-PT-PCCA-2011- 3.2-1214-Contract 74/2012.

Author Contributions

All authors conceived the research idea and the framework of this study. Calin Sebarchievici performed the experiments and Ioan Sarbu analysed the data and wrote the paper. Both authors have read and approved the final manuscript.

Conflicts of Interest

The authors declare no conflict of interest.

Abbreviations

The following abbreviations are used in this paper:
BHEBorehole heat exchanger
CO2Carbon dioxide
COPCoefficient of performance
DXDirect-expansion
DHWDomestic hot water
EUEuropean Union
GHGGreenhouse gas
GCHPGround-coupled heat pump
GHEGround heat exchanger
HPHeat pump
IEAInternational Energy Agency
nZEBNearly zero-energy building
PDPercent dissatisfied
PTCPositive temperature coefficient
PMVPredicted mean vote
PPDPredicted percent dissatisfied
RESRenewable energy source
RMSRoot-mean square
SPFSeasonal performance factor
TRNSYSTransient systems simulation

Nomenclature

C CO 2 Carbon dioxide emission (kg)
COPhpCoefficient of performance of heat pump
COPsysSystem coefficient of performance
EelElectrical energy consumption (kWh)
EtUseful thermal energy (kWh)
ηemElectromotor efficiency
ηisIsentropic efficiency
ηpElectricity production efficiency
ηtTransportation efficiency
gelSpecific CO2 emission factor for electricity (kg CO2/kWh)
iMMetabolic rate (met)
mrMass flow rate of refrigerant (kg/s)
PelElectric power consumed by the compressor (kW)
qHeating capacity of radiant system (W/m2)
qcSpecific heat load at condensation (kJ/kg)
qeSpecific cooling power (kJ/kg)
qscSpecific sub-cooling power (kJ/kg)
QhpThermal power (capacity) of heat pump (kW)
RclClothing thermal resistance (clo)
taOutdoor air temperature (°C)
tdSupply hot-water temperature (°C)
tfFloor surface temperature (°C)
thHot environment temperature (°C)
thsHeat source temperature (°C)
tiIndoor air temperature (°C)
ti,RADIndoor air temperature obtained by radiator heating (°C)
ti,RFIndoor air temperature obtained by radiant floor heating (°C)
toOperative (comfort) temperature (°C)
trMean radiant temperature (°C)
tS,mAverage surface temperature (°C)
wSpecific compression work (kJ/kg)

References

  1. Anisimova, N. The capability to reduce primary energy demand in EU housing. Energy Build. 2011, 43, 2747–2751. [Google Scholar] [CrossRef]
  2. Bendea, G.V.; Prada, M.F.; Bendea, C.; Secui, C. Ground-coupled heat pump systems—A key for a sustainable development of heating and cooling buildings. In Recent Advances in Environmental Science, Proceedings of the 9th International Conference on Energy, Environment, Ecosystems and Sustainable Development, Lemesos, Cyprus, 21–23 March 2013; pp. 133–138.
  3. Sarbu, I.; Dan, D.; Sebarchievici, C. Performance of heat pump systems as users of renewable energy for building heating/cooling. WSEAS Trans. Heat Mass Transf. 2014, 9, 51–62. [Google Scholar]
  4. Yang, W.; Zhou, J.; Xu, W.; Zhang, G. Current status of ground-source heat pumps in China. Energy Policy 2010, 38, 323–332. [Google Scholar] [CrossRef]
  5. Lee, J.Y. Current status of ground source heat pumps in Korea. Renew. Sustain. Energy Rev. 2009, 13, 1560–1568. [Google Scholar] [CrossRef]
  6. Sarbu, I.; Sebarchievici, C. General review of ground source heat pump systems for heating and cooling of buildings. Energy Build. 2014, 70, 441–454. [Google Scholar] [CrossRef]
  7. Bayer, P.; Saner, D.; Bolay, S.; Rybach, I.; Blum, P. Greenhouse gas emission savings of ground source heat pump systems in Europe: A review. Renew. Sustain. Energy Rev. 2012, 16, 1256–1267. [Google Scholar] [CrossRef]
  8. Self, S.J.; Reddy, B.V.; Rosen, M.A. Geothermal heat pump systems: Status review and comparison with other heating options. Appl. Energy 2013, 101, 341–348. [Google Scholar] [CrossRef]
  9. Inalli, M.; Esen, H. Experimental thermal performance evaluation of a horizontal ground-source heat pump system. Appl. Therm. Eng. 2004, 24, 2219–2232. [Google Scholar] [CrossRef]
  10. Esen, H.; Inalli, M.; Esen, M. Numerical and experimental analysis of a horizontal ground-coupled heat pump system. Build. Environ. 2007, 42, 1126–1134. [Google Scholar] [CrossRef]
  11. Esen, H.; Inalli, M.; Sengur, A.; Esen, M. Modelling a ground-coupled heat pump system using adaptive neuro-fuzzy inference systems. Int. J. Refrig. 2008, 31, 65–74. [Google Scholar] [CrossRef]
  12. Congedo, P.M.; Colangelo, G.; Starace, G. Computational modeling and sensitivity analysis of horizontal helical heat exchangers for GSHPs. In Proceedings of the CLIMAMED 2007 Congress, AICARR, Genova, Italy, 5–7 September 2007.
  13. Congedo, P.M.; Colangelo, G.; Starace, G. Computational modeling and sensitivity analysis of horizontal slinky heat exchangers for GSHPs. In Proceedings of the 22nd IIR International Congress of Refrigeration, Bejing, China, 21–26 August 2007.
  14. Yang, H.; Cui, P.; Fang, Z. Vertical-borehole ground coupled heat pumps: A review of models and systems. Appl. Energy 2010, 87, 16–27. [Google Scholar] [CrossRef]
  15. Congedo, P.M.; Colangelo, G.; Starace, G. CFD simulations of horizontal ground heat exchangers: A comparison among different configurations. Appl. Therm. Eng. 2012, 33–34, 24–32. [Google Scholar] [CrossRef]
  16. Retkowski, W.; Thoming, J. Thermoeconomic optimization of vertical ground-source heat pump systems through nonlinear integer programming. Appl. Energy 2014, 114, 492–503. [Google Scholar] [CrossRef]
  17. Michopoulos, A.; Bozis, D.; Kikidis, P.; Papakostas, K.; Kyriakis, N.A. Three-year operation experience of a ground source heat pump system in Northern Greece. Energy Build. 2007, 39, 328–334. [Google Scholar] [CrossRef]
  18. Mostafa, H.; Sharqawy, S.A.; Said, E.M. First in situ determination of the ground thermal conductivity for borehole heat exchanger applications in Saudi Arabia. Renew. Energy 2009, 34, 2218–2223. [Google Scholar]
  19. Carli, M.D.; Tonon, M.; Zarrella, A.; Zecchin, R. A computational capacity resistance model for vertical ground-coupled heat exchanger. Renew. Energy 2010, 35, 1537–1550. [Google Scholar] [CrossRef]
  20. Pulat, E.; Coskun, S.; Unlu, K. Experimental study of horizontal ground source heat pump performance for mild climate in Turkey. Energy 2009, 34, 1284–1295. [Google Scholar] [CrossRef]
  21. Yang, W.B.; Shi, M.H.; Liu, G.Y. A two-region simulation model of vertical U-tube ground heat exchanger and its experimental verification. Appl. Energy 2009, 86, 2005–2012. [Google Scholar] [CrossRef]
  22. Lee, J.U.; Kim, T.; Leigh, S.B. Thermal performance analysis of a ground-coupled heat pump integrated with building foundation in summer. Energy Build. 2013, 59, 37–43. [Google Scholar] [CrossRef]
  23. Man, Y.; Yang, H.; Wang, J.; Fang, Z. In situ operation performance test of ground couplet heat pump system for cooling and heating provision in temperate zone. Appl. Energy 2012, 97, 913–920. [Google Scholar] [CrossRef]
  24. Petit, P.J.; Meyer, J.P. Economic potential of vertical ground-source heat pumps compared to air-source air conditioners in South Africa. Energy 1998, 23, 137–143. [Google Scholar] [CrossRef]
  25. Esen, H.; Inalli, M. In-situ thermal response test for ground source heat pump system in Elazig, Turkey. Energy Build. 2009, 41, 395–401. [Google Scholar] [CrossRef]
  26. Sarbu, I.; Sebarchievici, C. Ground-Source Heat Pumps: Fundamentals, Experiments and Applications; Elsevier: Oxford, UK, 2015. [Google Scholar]
  27. IEE, Intelligent Energy Europe. Environmental Report of Europe. Available online: http://ec.europa.eu/ energy/environment (accessed on 21 November 2013).
  28. Fossa, M. The temperature penalty approach to the design of borehole heat exchangers for heat pumps applications. Energy Build. 2011, 43, 1473–1479. [Google Scholar] [CrossRef]
  29. Sarbu, I.; Sebarchievici, C. A study of the performance of low-temperature heating systems. Energy Effic. 2015, 8, 609–627. [Google Scholar] [CrossRef]
  30. Ilina, M.; Burchiu, S. Influence of heating systems on microclimate from living rooms. Fitter 1996, 6, 24–29. [Google Scholar]
  31. Hesaraki, A.; Holmberg, S. Energy performance of low temperature heating systems in five new-built Swedish dwellings: A case study using simulations and on-site measurements. Build. Environ. 2013, 64, 85–93. [Google Scholar] [CrossRef]
  32. ASHRAE Handbook; HVAC Systems and Equipment; American Society of Heating, Refrigerating and Air Conditioning Engineers: Atlanta, GA, USA, 2012.
  33. Kim, K.W.; Olesen, B.W. Radiant heating and cooling systems. ASHRAE J. 2015, 57, 28–37, 34–42. [Google Scholar]
  34. Moderate Thermal Environment—Determination of the PMV and PPD Indices and Specification of the Conditions for Thermal Comfort; ISO 7730; International Organization for Standardization: Geneva, Switzerland, 2005.
  35. Building Environment Design—Design, Dimensioning, Installation and Control of the Embedded Radiant Heating and Cooling Systems; ISO 11855; International Organization for Standardization: Geneva, Switzerland, 2012.
  36. Standard for Energy and Thermal Expertise of Existent Buildings and Their Heating and DHW Systems; NP048-2000; National Institute for Research and Development of Buildings: Bucharest, Romania, 2000.
  37. Sebarchievici, C. Optimization of Thermal Systems from Buildings to Reduce Energy Consumption and CO2 Emissions Using Ground-Coupled Heat Pump. Ph.D. Thesis, Polytechnic University Timisoara, Romania, 2013. [Google Scholar]
  38. Sebarchievici, C.; Sarbu, I. Performance of an experimental ground-coupled heat pump system for heating, cooling and domestic hot-water operation. Renew. Energy 2015, 76, 148–159. [Google Scholar] [CrossRef]
  39. Ergonomics of the thermal environment. In Methods for the Assessment of Human Responses to Contact with Surface, Part 2: Human Contact with Surfaces at Moderate Temperature; ISO/TS 13732-2; International Organization for Standardization: Geneva, Switzerland, 2001.
  40. Thermal Environmental Conditions for Human Occupancy; ASHRAE Standard 55; American Society of Heating, Refrigerating and Air-conditioning Engineers: Atlanta, GA, 2010.
  41. Holman, J.P. Experimental Method for Engineers; McGraw Hill: Singapore, 2001. [Google Scholar]
  42. Sarbu, I.; Sebarchievici, C. Aspects of indoor environmental quality assessment in buildings. Energy Build. 2013, 60, 410–419. [Google Scholar] [CrossRef]
  43. Thermal Comfort Tool, version 2; ASHRAE, Centre for the Built Environment: Berkeley, CA, USA, 2011.
  44. A Transient System Simulation Program User Manual; TRNSYS 17; Solar Energy Laboratory, University of Wisconsin-Madison: Madison, WI, USA, 2012.
  45. Bechthler, H.; Browne, M.W.; Bansal, P.K.; Kecman, V. New approach to dynamic modelling of vapour-compression liquid chillers: Artificial neural networks. Appl. Therm. Eng. 2001, 21, 941–953. [Google Scholar] [CrossRef]
  46. METEONORM. Help, version 5.1, Meteonorm Software, Bern, Switzerland. 2004. Available online: http://www.meteonorm.com/ (accessed on 5 December 2013).
  47. Hasan, A.; Kumitski, J.; Jokiranta, K. A combined low temperature water heating system consisting of radiators and floor heating. Energy Build. 2009, 41, 470–479. [Google Scholar] [CrossRef]
Figure 1. Single-stage heat pump (HP) system: (a) Schematic; (b) Vapour-compression processes in t-s and p-h diagrams.
Energies 09 00228 g001
Figure 2. Water supply production temperature depending on outdoor air temperature.
Energies 09 00228 g002
Figure 3. Heated office room.
Energies 09 00228 g003
Figure 4. Monthly energy demand for office room heating.
Energies 09 00228 g004
Figure 5. Experimental ground-coupled heat pump (GCHP) system.
Energies 09 00228 g005
Figure 6. Schematic of heating systems: (a) Floor heating; (b) Radiator heating.
Energies 09 00228 g006
Figure 7. Recorded outdoor air temperature during heating operation.
Energies 09 00228 g007
Figure 8. Heat source temperature evolution during heating operation.
Energies 09 00228 g008
Figure 9. Variation of indoor air temperature.
Energies 09 00228 g009
Figure 10. Schematic of the system model built in TRNSYS to simulate useful thermal energy.
Energies 09 00228 g010
Figure 11. Schematic of the system model built in TRNSYS for COP simulation.
Energies 09 00228 g011
Table 1. Experimental results.
Heating Systemta (°C)ti (°C)ths (°C)td (°C)Eel (kWh)Et (kWh) C CO 2 (kg)On/Off SwitchingCOPsys
Radiant floor9.3922.2818.7728.125.7732.783.16485.68
Radiator9.0022.3017.6230.626.3534.423.471405.42
Table 2. Numerical results of THERMAL COMFORT computer program.
Heating TypeDistance from the Window (m)3.4 met-0.67 clo1 met-0.90 clo1.1 met-0.29 clo
tr (°C)PMV (-)PPD (%)tr (°C)PMV (-)PPD (%)tr (°C)PMV (-)PPD (%)
Radiant floor1.023.002.178423.00−0.35823.00−1.6358
1.523.702.228623.70−0.26623.70−1.5152
2.024.302.268724.30−0.18624.30−1.4146
2.524.702.288824.70−0.12524.70−1.3442
3.025.002.318825.00−0.08525.00−1.2839
3.525.202.328925.20−0.06525.20−1.2538
4.025.302.328925.30−0.04525.30−1.2337
4.525.502.348925.50−0.02525.50−1.1935
5.025.502.348925.50−0.02525.50−1.1935
Radiator1.020.602.017720.60−0.671420.60−2.0579
1.521.202.057921.20−0.591221.20−1.9474
2.021.702.088021.70−0.531121.70−1.8670
2.522.102.118222.10−0.481022.10−1.7967
3.022.402.138222.40−0.43922.40−1.7464
3.522.602.148322.60−0.41822.60−1.7062
4.022.702.158322.70−0.39822.70−1.6961
4.522.802.168322.80−0.38822.80−1.6760
5.022.802.168322.80−0.38822.80−1.6760
Table 3. Thermal energy used for office room heating.
MonthHeating Energy (kWh)er (%)RMS (-)cv (%)R2 (-)
SimulatedMeasured
January252.50256.241.572.721871.4090.99990075
February195.70195.060.32
March151.61150.440.77
April49.7348.951.59
May0.000.000.00
June0.000.000.00
July0.000.000.00
August0.000.000.00
September0.000.000.00
October94.8595.660.84
November174.45172.621.06
December238.75240.110.57
Table 4. The COP values for GCHP system.
Heating SystemCOPsysPercentage Difference er (%)
SimulatedMeasured
Radiant floor5.485.68−3.52
Radiator5.155.42−4.98

